The alternative regenerative strategy of bearded dragon unveils the key processes underlying vertebrate tooth renewal
- University of Helsinki, Finland
Figures
Figure 1
Different types of bearded dragon teeth develop through morphologically equivalent stages.
(A, B) Micro-CT scan images of bearded dragon skull at hatchling stage in frontal (A) and lateral (B) views. Insets show high magnifications of anterior pleurodont (A) and posterior acrodont (B) teeth. Hatchling bearded dragons possess four pleurodont teeth (one in each jaw quadrant; white arrowheads) and one central egg tooth (red arrow). Scale bars: 1 cm (main images); 2.5 mm (insets). (C, D) 3D volume rendering as well as tooth (C, D; orange) and dental lamina (DL) (D); blue) segmentation of PTA-stained juvenile bearded dragon upper jaw in ventral views, showing the morphogenesis (C), red arrows) or replacement (C), white arrowheads) of anterior pleurodont teeth. Only the segmented teeth and DL are shown in panel (D) to highlight the expansion of the DL along the oral-aboral axis at pleurodont tooth positions (white arrows). Scale bars: 1 mm. (E–P) Hematoxylin and eosin (H and E)-stained coronal (E–J) or sagittal (K–P) sections of developing acrodont (E–J) and pleurodont (K–P) teeth at various developmental stages indicated as embryonic days post-oviposition (dpo) or days post-hatching (dph). Vestigial teeth develop directly from the oral epithelium (OE) prior emergence of functional dentition (E; asterisk). Pleurodont teeth emerge later in development than acrodont teeth, and the DL connecting the pleurodont tooth germs to the OE surface is extended (L, M; red arrows). The acrodont successional dental lamina (SDL) starts to develop at late mineralization stage and persists until hatching (I, J; white arrowheads), while the pleurodont SDL is only visible around hatching time (O, P; black arrowhead). Scale bars: 100 μm.
Figure 2
Expression of conserved dental genes is maintained from embryonic development to replacement.
(A) In situ hybridization (ISH) showing the expression of SHH, PITX2, NOTCH1, and LEF1 at various indicated developmental stages (24, 28, and 48 dpo) in developing mandibular acrodont teeth. The positive signal is false-colored to enhance visibility. Insets at 48 dpo show high magnifications of the SDL region indicated by black outlines. Black arrowheads indicate the expression of PITX2 and LEF1 in both the primary DL (24 dpo) and SDL (48 dpo). Black arrows indicate the expression of NOTCH1 in the OE, and red arrows show the expression of SHH in the inner enamel epithelium of both vestigial and functional teeth. (B) PCNA immunohistochemistry (IHC) and TUNEL apoptotic assay (left panels; red staining), SOX2 IHC (middle panel; red staining), or PITX2 and LEF1 ISH (right panels) in parallel sections of pleurodont (top panels) and acrodont (bottom) SDL in juvenile bearded dragon (<1 year old). Arrowheads and asterisks indicate focal or absent expression in the SDL tip of pleurodont teeth, respectively. Arrows show positive apoptotic cells in mesenchymal tissues. (C) BrdU IHC (green) in pleurodont (top panel) and acrodont (bottom) SDL in adult bearded dragon (>2 years old) following a 7 day BrdU pulse. The epithelium-mesenchyme junction is indicated by black or white dashed lines in all panels (A–C), and cell nuclei are counterstained with DAPI (blue staining) in IHC and TUNEL experiments (B, C). Scale bars: 100 μm.
Figure 3
Slow-cycling label-retaining cells (LRCs) accumulate in two different regions of bearded dragon teeth.
(A) Double IHC for PCNA (red staining) and BrdU (green) in pleurodont (left and middle panels) or acrodont (right) tooth sections collected from bearded dragons at 0 (d0), 28 (d28), and 58 (d58) days of chase after the first week of BrdU pulse. White arrowheads indicate the scattering of BrdU/PCNA-double positive cells throughout the dental epithelium at d28, and red arrowheads show the clustering of BrdU/PCNA-double positive LRCs in both OE and DL at d58. White asterisks indicate the position of taste buds in the OE, and white dashed lines delimitate the epithelium-mesenchyme junction. Scale bars: 100 μm. (B) Schematic drawing of the dental subdivisions used for cell quantification: I, OE, defined as a portion of epithelium directly lingual to the DL; II, external DL; III, deep DL; IV, SDL. (C, D) Total amount of BrdU/PCNA-double positive cells in the entire dental epithelium (C; dental zones I-IV) or relative distribution of BrdU/PCNA-double positive cells in the individual dental subdivisions (D; color-code as in (B)) of pleurodont and acrodont teeth at d0 and d58, n = 3 per group (ns, non-significant). (E, F) IHC for SOX2 (red staining) and BrdU (green; left, middle top, and right top panels) or double IHC/ISH for LGR5 (middle bottom) or IGFBP5 (right bottom) with BrdU in parallel sections of pleurodont (E) and acrodont (F) teeth at d58. Insets show high magnifications of OE (dental zone I as in (C)) or DDL (dental zone III) positive stainings. White arrowheads indicate co-expression of SOX2, LGR5, or IGFBP5 with BrdU. White or black dashed lines delimitate the epithelium-mesenchyme junction. Scale bars: 100 μm.
-
Figure 3—source data 1
Quantification of putative stem/progenitor cells in dental tissues.
Absolute means of BrdU/PCNA-double positive cells in the entire dental epithelium (all regions) or relative amounts of BrdU/PCNA-double positive cells in the individual tooth regions (subdivisions I-IV, see Figure 3B) of pleurodont and acrodont teeth at d0 and d58, n = 3 biological replicates per group.
- https://doi.org/10.7554/eLife.47702.006
Figure 4
The OE contributes to SDL both in vivo and ex vivo.
(A) DiI fluorescence (red staining) in pleurodont (left and middle panels) or acrodont (right) tooth sections collected from bearded dragons at 1 (d1), 7 (d7), and 14 (d14) days after in vivo DiI administration at the OE-DL junction. Cell nuclei are counterstained with DAPI (blue). The arrowhead at d0 indicates the site of administration of DiI in the OE. High magnifications of the SDL in pleurodont and acrodont teeth are shown at d14 (insets). White dashed lines delimitate the epithelium-mesenchyme junction. Scale bars: 100 μm. (B) DiI fluorescence (red) in cultured pleurodont dental tissue slices, imaged every other day (d0–d14) over a two-week period following initial dye administration (d0). White dashed lines indicate the border between the erupted tooth and the DL. Scale bars: 500 μm. (C) H and E and PCNA IHC (PCNA; red staining) in paraffin sections from cultured tissue slices of pleurodont teeth. The OE region near the OE-DL junction of teeth was removed on one side of the jaw (removal), and the opposing, equivalent teeth were used as controls (control). Black arrows indicate disrupted DL and SDL tissues in the removal experiment after one week of culture. Dashed lines separate epithelium from mesenchyme. Scale bars: 100 μm. (D) Quantification of the proportion of PCNA-positive cells in both DL and SDL in one-week dental tissue cultures with intact (control) or removed (removal) OE, as described in (C). Red values indicate mean values, n = 4 per group (*, p-value<0.05).
-
Figure 4—source data 1
Quantification of proliferating cells in dental tissues with intact or removed OE.
Total cell number (total cells), number of PCNA-positive cells (PCNA+ cells) and proportion of PCNA-positive cells in the DL/SDL region of one-week dental tissue cultures with intact (control) or removed (removal) OE, n = 4 biological replicates per group.
- https://doi.org/10.7554/eLife.47702.008
Figure 5
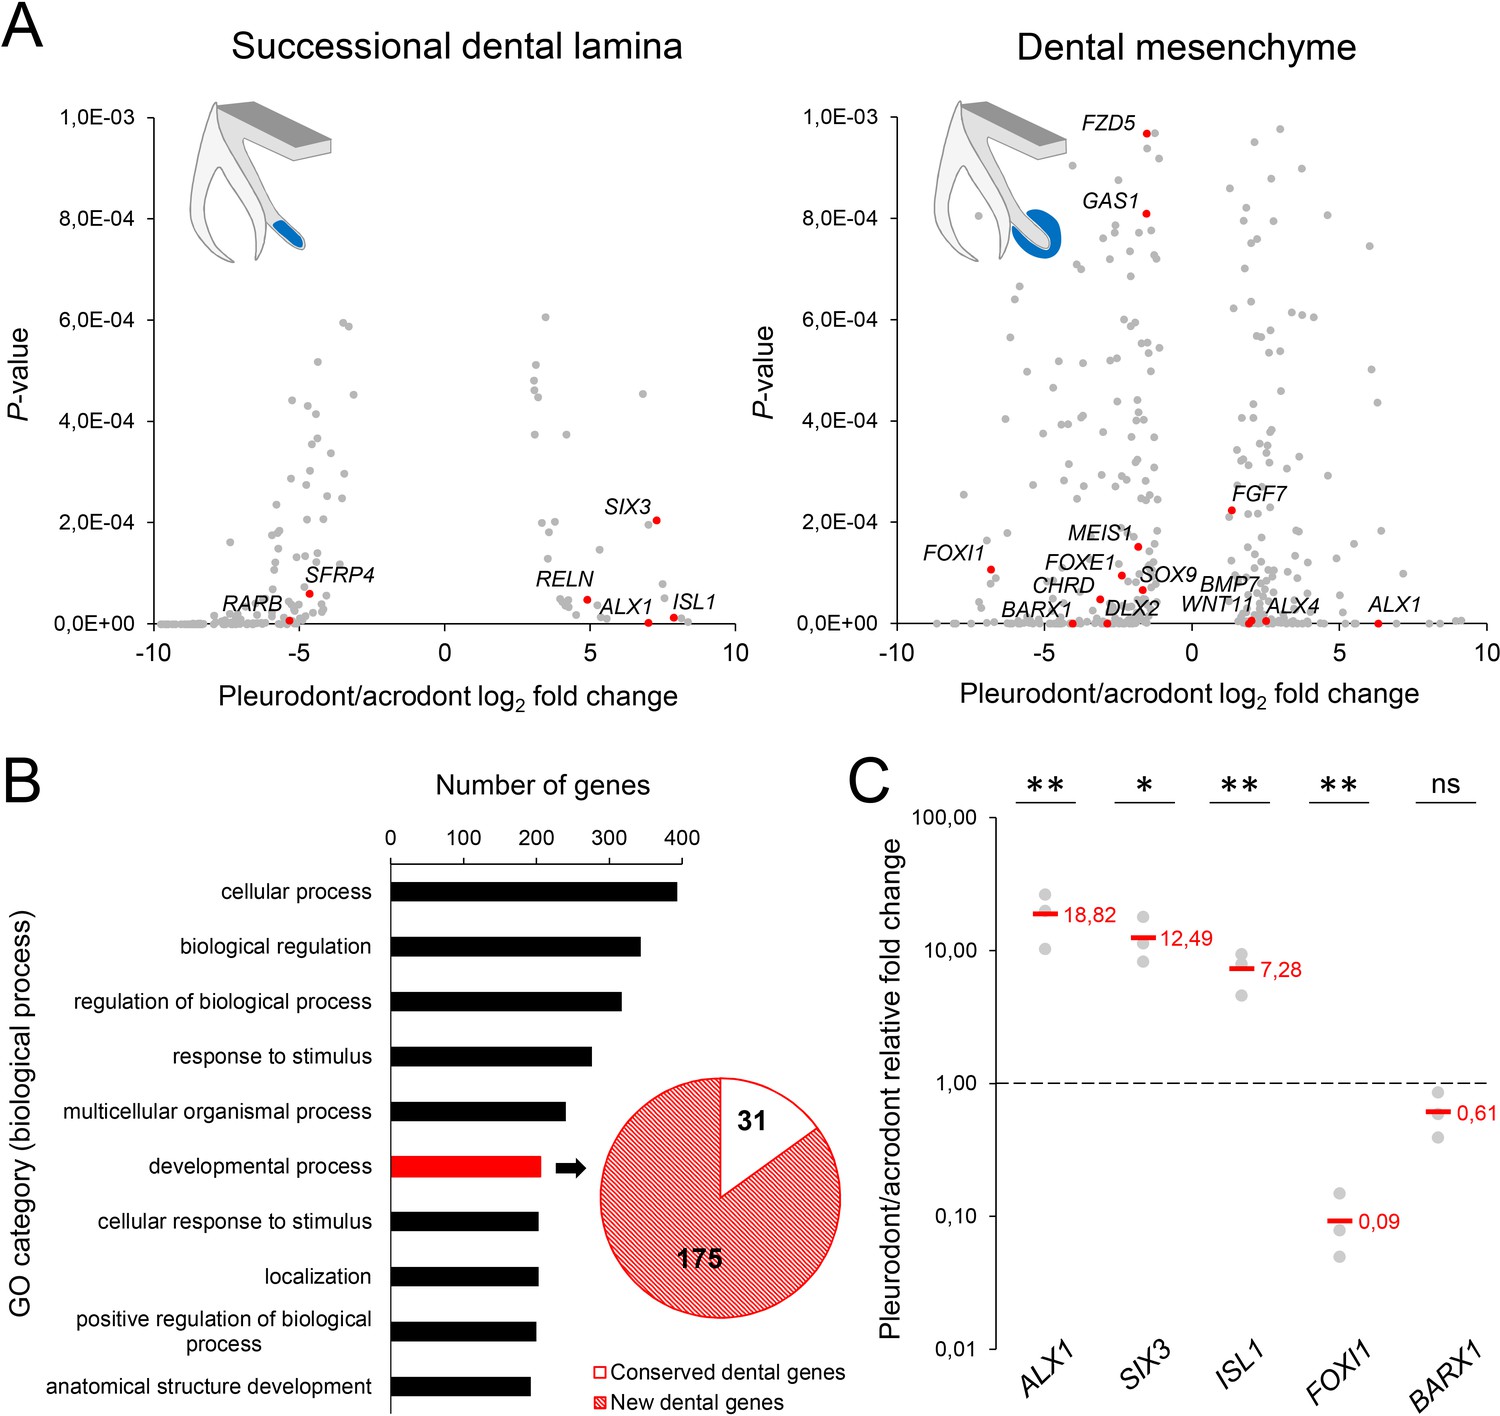
RNA sequencing of micro-dissected SDL and dental mesenchyme tissues reveals putative new genes involved in tooth replacement.
(A) Volcano plots of significantly differentially expressed genes (FDR-corrected p-values<0.05) between pleurodont and acrodont SDL (n = 206, left plot) and dental mesenchyme (n = 368, right) tissues at early postnatal stage (four dph), n = 3 per group. The x- and y-axes display the log2 fold change (pleurodont with respect to acrodont) and associated P-values, respectively. Positive log2 values indicate gene upregulation in pleurodont teeth, and red plot points highlight some key developmental genes and transcription factors (see main text). Schematic drawings illustrate the laser-microdissected areas (blue color) used for transcriptomics in each dental tissue type. (B) Gene ontology (GO) analysis of all differentially expressed genes between pleurodont and acrodont dental tissues (n = 574), as identified in (A). The ten top-ranking biological process categories by gene number are shown. The pie chart depicts the gene distribution from the category ‘developmental process’. Genes already known to be associated with vertebrate tooth development were defined as ‘conserved dental genes’ (white portion; n = 31), whereas other genes were categorized as ‘new dental genes’ (red shaded portion; n = 175). (C) Quantitative PCR of ALX1, SIX3, ISL1, FOXI1, and BARX1 in dental tissues from pleurodont and acrodont teeth. The x- and y-axes display the gene names and relative fold change (pleurodont with respect to acrodont), respectively. The dashed line depicts the position of a fold change of 1.00 (equal expression). Red values indicate mean values, n = 3 per gene (ns, non-significant; *, p-value<0.05; **, p-value<0.01).
-
Figure 5—source data 1
Quantitative PCR of newly identified dental genes in dental tissues.
ΔCt values in quantitative PCR for ALX1, SIX3, ISL1, FOXI1, and BARX1 genes in dental tissues from pleurodont and acrodont teeth, n = 3 biological replicates per gene.
- https://doi.org/10.7554/eLife.47702.010
Figure 6
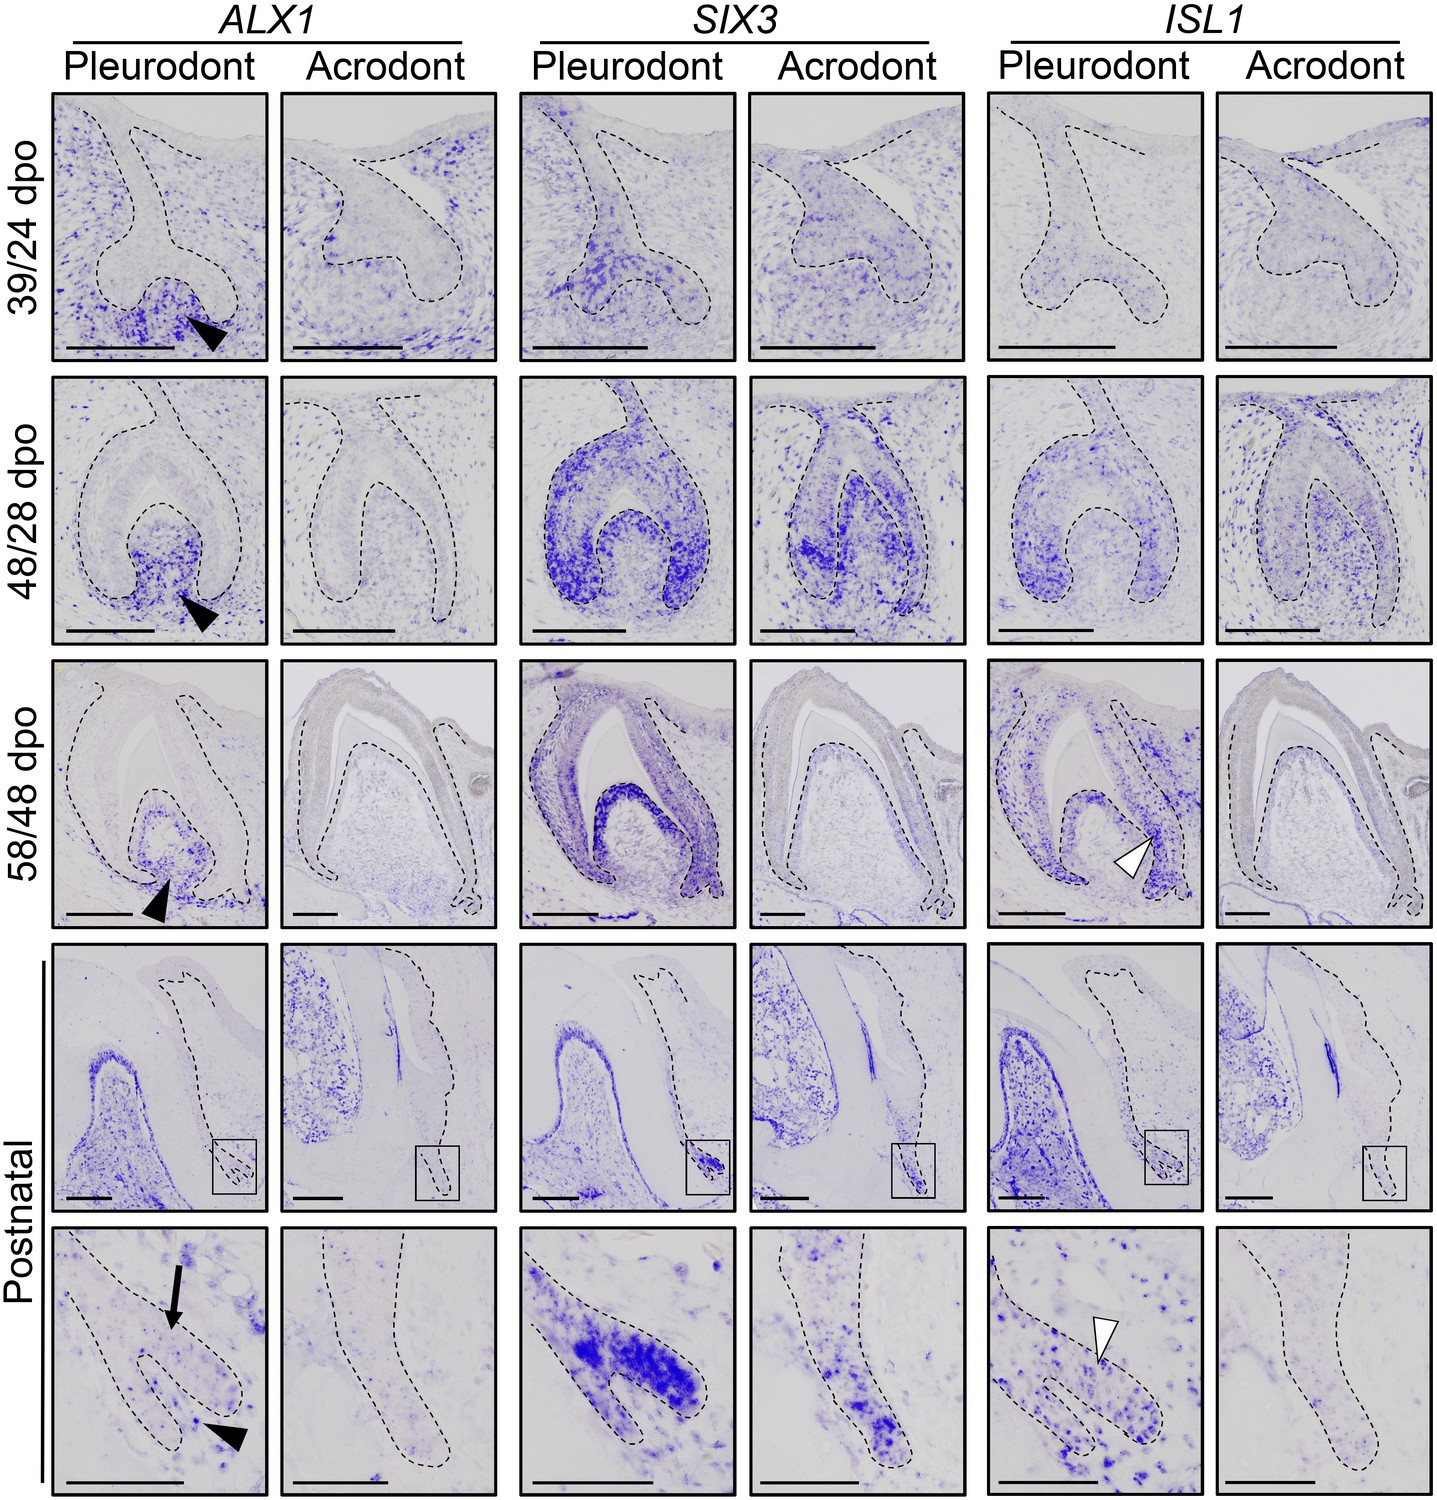
Comparative expression pattern of new dental genes in developing bearded dragon dentition.
ISH showing the expression of ALX1 (left panels), SIX3 (middle), and ISL1 (right) at various indicated developmental stages in embryonic and early postnatal pleurodont and acrodont dental tissues. As pleurodont teeth are developmentally delayed compared to acrodont teeth (see Figure 1E–P), different embryonic stages were used to attain comparable dental developmental stages in the two dentition types (e.g., 39/24 dpo indicates 39 dpo for pleurodont teeth and 24 dpo for acrodont teeth). The positive signal is false-colored to enhance visibility. High magnifications of the SDL region, as indicated by black outlines, are shown for postnatal teeth (bottom panels). Black arrowheads show relatively higher ALX1 expression in the mesenchymes of embryonic and postnatal pleurodont teeth. In postnatal SDL, ALX1 transcripts are also present in the epithelial compartment (black arrow). Increased ISL1 expression in pleurodont epithelium is only detected at late developmental stages (white arrowheads). Black dashed lines separate the epithelium from mesenchyme. Scale bars: 50 μm (bottom panels); 100 μm (other images).
Figure 7
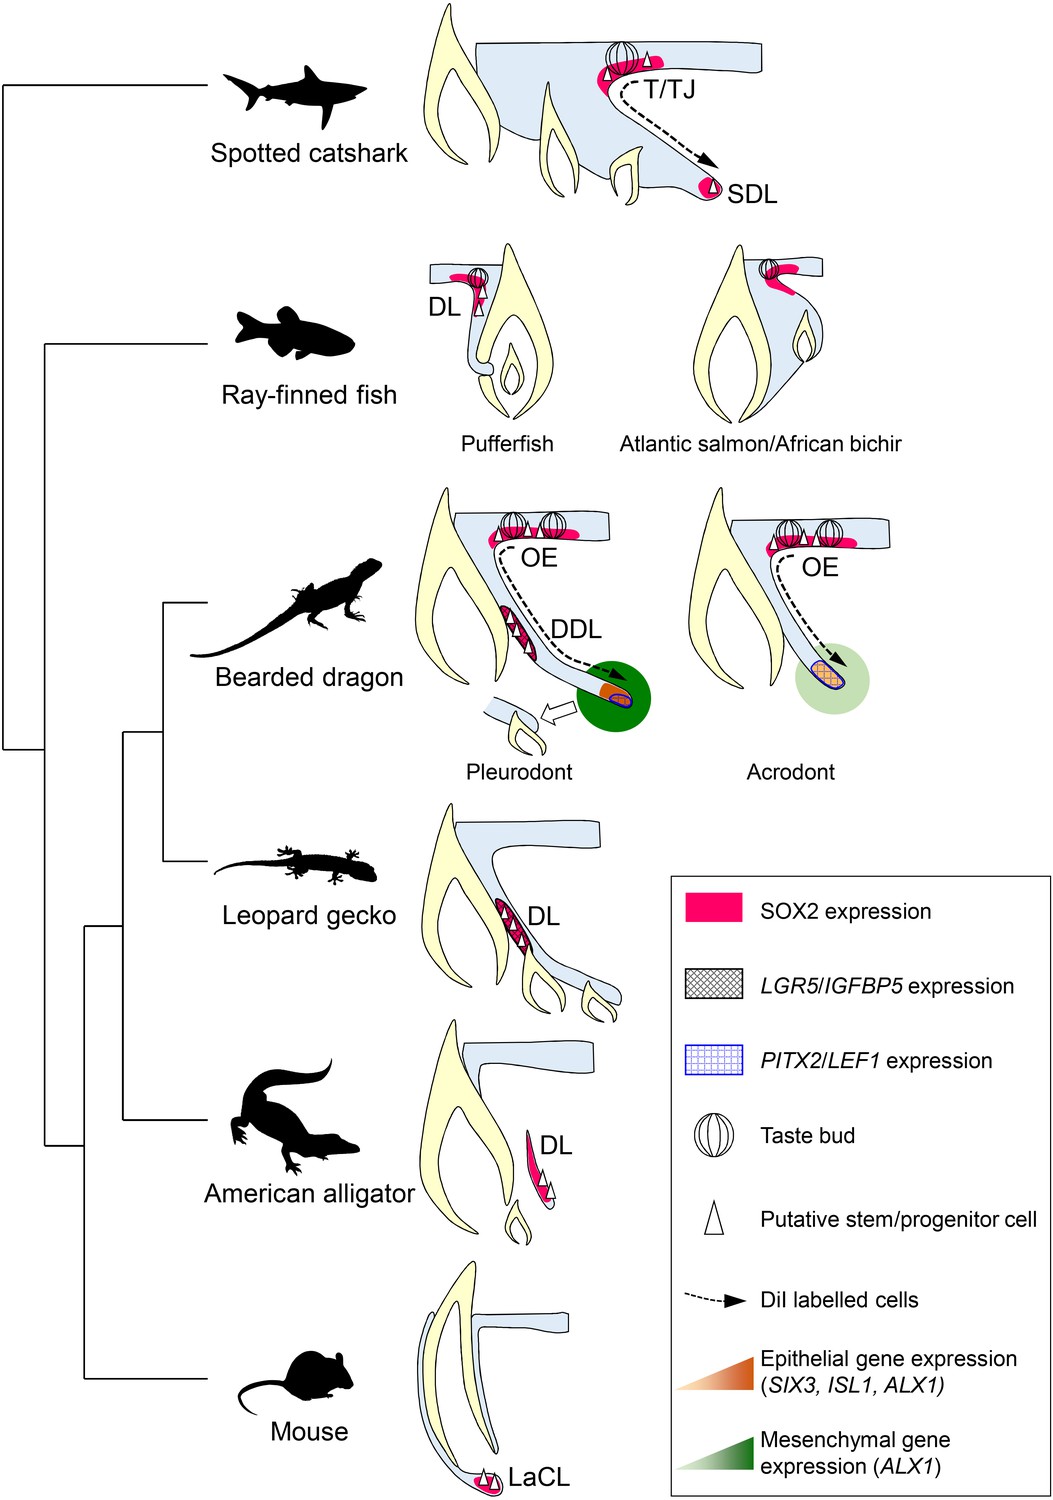
Comparative models of cellular and molecular processes controlling oral tooth replacement in polyphyodont species.
Schematic drawings of oral tooth replacement strategies in polyphyodont species with molecularly-characterized LRC populations: spotted catshark (Martin et al., 2016), pufferfish (Thiery et al., 2017), Atlantic salmon (Vandenplas et al., 2016), African bichir (Vandenplas et al., 2016), bearded dragon pleurodont and acrodont teeth (this study), leopard gecko (Handrigan et al., 2010), and American alligator (Wu et al., 2013). The putative stem cell niche of monophyodont mouse incisor (Harada et al., 1999) is also shown for comparison. In spotted catshark, SOX2-positive putative dental progenitors migrate from the superficial taste/tooth junction (T/TJ) towards the successional dental lamina (SDL). In pufferfish but also cichlid fish (Fraser et al., 2013), a SOX2-positive putative dental progenitor niche resides in the most superficial dental lamina (DL). In Atlantic salmon and African bichir, no epithelial LRCs have been identified despite positive SOX2 expression in the OE and outer dental epithelium transition zone. In the leopard gecko, LRCs expressing adult stem cell markers such as IGFBP5 and LGR5 reside on the lingual side of the DL. In the American alligator, putative stem cells localize to the distal enlarged bulge of the DL. In both leopard gecko and American alligator, SOX2 expression has been shown to overlap with the epithelial region containing putative stem cells (Juuri et al., 2013), but no co-localization studies are available. In mouse incisors, SOX2-positive putative stem cells responsible for continual growth are located in the labial cervical loop (LaCL; Juuri et al., 2012). In bearded dragon pleurodont teeth, LRCs are located both in the SOX2-positive oral epithelium (OE; region similar to the T/TJ) and IGFBP5/LGR5/SOX2-positive DDL (region similar to the gecko DL). During regeneration, cells migrate from the superficial OE towards the SDL, the SDL shows focal expression of SDL marker genes (PITX2/LEF1), and both the SDL and surrounding mesenchyme exhibit relatively high expression of newly identified dental genes (ALX1/SIX3/ISL1), thus leading to the initiation of replacement tooth. In acrodont teeth, LRCs are also evident in the SOX2-positive OE and cell migration occurs from the superficial OE towards the SDL, thus contributing to SDL growth. However, the acrodont SDL shows scattered expression of SDL markers and low expression of newly identified dental genes, most likely as a result of absence of DL stem/progenitor cells and SDL organization, and no replacement teeth are formed.
Tables
Key resources table
| Reagent type | Designation | Source or reference | Identifiers | Additional information |
|---|---|---|---|---|
| Antibody | PCNA (mouse monoclonal) | BioLegend | cat# 307901, RRID:AB_314691 | 1:300 |
| Antibody | BrdU (rat monoclonal) | Abcam | cat# ab6326, RRID:AB_314691 | 1:200 |
| Antibody | SOX2 (rabbit polyclonal) | Abcam | cat# ab97959, RRID:AB_2341193 | 1:200 |
| Antibody | DIG conjugated to alkaline phosphatase (sheep polyclonal) | Sigma-Aldrich | cat# 11093274910, RRID:AB_2734716 | 1:2000 |
| Antibody | Alexa Fluor-488 (goat anti-rat IgG) | Thermo Fisher Scientific | cat# A-11006, RRID:AB_2534074 | 1:400 |
| Antibody | Alexa Fluor-568 (goat anti-rabbit IgG) | Thermo Fisher Scientific | cat# A-11011, RRID:AB_143157 | 1:400 (with SOX2), 1:600 (with PCNA) |
| Sequence-based reagent | PITX2 | This paper | PCR primers | Forward primer (fp) ATGAACTGCCTGAAAGACGC; reverse primer (rp) CATCAGGCCGTTGAATTGGG |
| Sequence-based reagent | LEF1 | This paper | PCR primers | (fp) GCCACCGACGAGATGATCC; (rp) GTGCGAAGGATGTGTCCCTG |
| Sequence-based reagent | SHH | Di-Poï and Milinkovitch (2016) | PCR primers | (fp) CAAGCAGTTCCATCCCCAAC; (rp) GCCCAGCTATGCTCCTCAAT |
| Sequence-based reagent | NOTCH1 | This paper | PCR primers | (fp) GCCACATC CTGGACTACGAC; (rp) GGAATGTCCAGGTTCCCGAG |
| Sequence-based reagent | LGR5 | This paper | PCR primers | (fp) GGAATGTCCAGGTTCCCGAG; (rp) GGCACTAGTGAATTGCTGGGG |
| Sequence-based reagent | IGFBP5 | This paper | PCR primers | (fp) GCAGAGGAGACCTTCCAACC; (rp) CTGAGGGCTTCTCACACCAG |
| Sequence-based reagent | ALX1 | This paper | PCR primers | (fp) CTGTCTCCCGTGAAAGGC AT; (rp) TAACAG AAGTGGGTGACTGCC |
| Sequence-based reagent | SIX3 | This paper | PCR primers | (fp) TGCCCACG CTCAACTTTTC; (rp) CCGCCGAA CTGTGAGTAGGA |
| Sequence-based reagent | ISL1 | This paper | PCR primers | (fp) ACCTGCTTT GTTAGGGACGG; (rp) CGTCGTG TCTCTCCGGAC TA |
| Sequence-based reagent | ALX1 | This paper | qPCR primers | (fp) GCAGTTCC GTTGTGACTTC; (rp) ATCTGTCC GAGGTGAATGG |
| Sequence-based reagent | SIX3 | This paper | qPCR primers | (fp) CTCTACCAC ATCCTGGAGAAC; (rp) TTCCTGG TAGTGAGCTTCG |
| Sequence-based reagent | ISL1 | This paper | qPCR primers | (fp) TGCGGCA ATCAAATCCAC; (rp) GGTTACATT CCGCACACTTC |
| Sequence-based reagent | FOXI1 | This paper | qPCR primers | (fp) GGCTATAC TGGTTCAGTCCTC; (rp) ACTTCA GTGCCCTCTCTTG |
| Sequence-based reagent | BARX1 | This paper | qPCR primers | (fp) AAGGTGGA GGGCTTGAATC; (rp) TGTCAACT GCTCGCTACTG |
| Sequence-based reagent | ACTB | This paper | qPCR primers | (fp) CCTGGAGA AGAGCTACGAAC; (rp) AGAAAG ACGGCTGGAAGAG |
| Commercial assay or kit | RNeasy Plus Micro Kit | Qiagen | cat#/ID: 74034 | |
| Commercial assay or kit | Ovation SoLo RNA-Seq Library Preparation Kit | Nugen | cat#/ID: 0501–32 | |
| Commercial assay or kit | RNA 6000 Pico Kit | Agilent | cat#: 5067–1513 | |
| Commercial assay or kit | QuantiTect Reverse Transcription Kit | Qiagen | cat#/ID: 205311 | |
| Commercial assay or kit | iTaq Universal SYBR Green Supermix | Bio-Rad | cat#: 1725121 | |
| Commercial assay or kit | TUNEL in situ cell death detection | Roche | cat#: 11684795910 | |
| Chemical compound, drug | BrdU | Sigma-Aldrich | cat#: B5002 | Administered at 80 mg/kg |
| Chemical compound, drug | DiI | Biotium | cat#: 60010 | Dissolved into ethanol at 25 mg/ml; working solution further diluted in 0.3M sucrose at 5 mg/ml |
| Chemical compound, drug | Fluoroshield mounting medium | Sigma-Aldrich | cat#: F6057 | |
| Chemical compound, drug | Dako Faramount aqueous medium | Agilent | cat#: S302580 | |
| Software, algorithm | Nrecon | Bruker | ||
| Software, algorithm | Advanced 3D Visualization and Volume Modeling (Amira) | Thermo Fisher Scientific | RRID:SCR_007353 | |
| Software, algorithm | Fiji/ImageJ | Schindelin et al. (2012) | RRID:SCR_002285 | |
| Software, algorithm | Adobe Photoshop CC | Adobe | RRID:SCR_014199 | |
| Software, algorithm | NIS-Elements | Nikon | RRID:SCR_014329 | |
| Software, algorithm | Leica Application Suite X | Leica | RRID:SCR_013673 | |
| Software, algorithm | Microsoft Excel | Microsoft | RRID:SCR_016137 | |
| Software, algorithm | Zen | Zeiss | RRID:SCR_013672 | |
| Software, algorithm | FastQC | http://www.bioinformatics.babraham.ac.uk/projects/fastqc/ | RRID:SCR_014583 | |
| Software, algorithm | Trimmomatic | Bolger et al. (2014) | RRID:SCR_011848 | |
| Software, algorithm | SortMeRNA | Kopylova et al. (2012) | RRID:SCR_014402 | |
| Software, algorithm | STAR | Dobin et al. (2013) | RRID:SCR_015899 | |
| Software, algorithm | edgeR | Robinson et al. (2010) | RRID:SCR_012802 | |
| Software, algorithm | PALM Robo | Zeiss | RRID:SCR_014435 | |
| Software, algorithm | CFX Manager | Bio-Rad | RRID:SCR_017251 | |
| Other | PALM MicroBeam device | Zeiss |
Additional files
-
Supplementary file 1
List of differentially expressed genes in transcriptomic analysis.
List of significantly upregulated (UP) and downregulated (DOWN) genes in acrodont vs pleurodont SDL and acrodont vs pleurodont mesenchyme, with gene names, fold change (FC), P-values, and False Discovery Rate (FDR)-corrected P-values.
- https://doi.org/10.7554/eLife.47702.013
-
Transparent reporting form
- https://doi.org/10.7554/eLife.47702.014
Download links
A two-part list of links to download the article, or parts of the article, in various formats.
Downloads (link to download the article as PDF)
Open citations (links to open the citations from this article in various online reference manager services)
Cite this article (links to download the citations from this article in formats compatible with various reference manager tools)
The alternative regenerative strategy of bearded dragon unveils the key processes underlying vertebrate tooth renewal
eLife 8:e47702.
https://doi.org/10.7554/eLife.47702


