Evolutionarily conserved long-chain Acyl-CoA synthetases regulate membrane composition and fluidity
- University of Gothenburg, Sweden
- BioPharmaceuticals R&D, AstraZeneca, Sweden
- Helsinki Institute for Life Science, Finland
- University of Helsinki, Finland
Figures
Figure 1 with 4 supplements
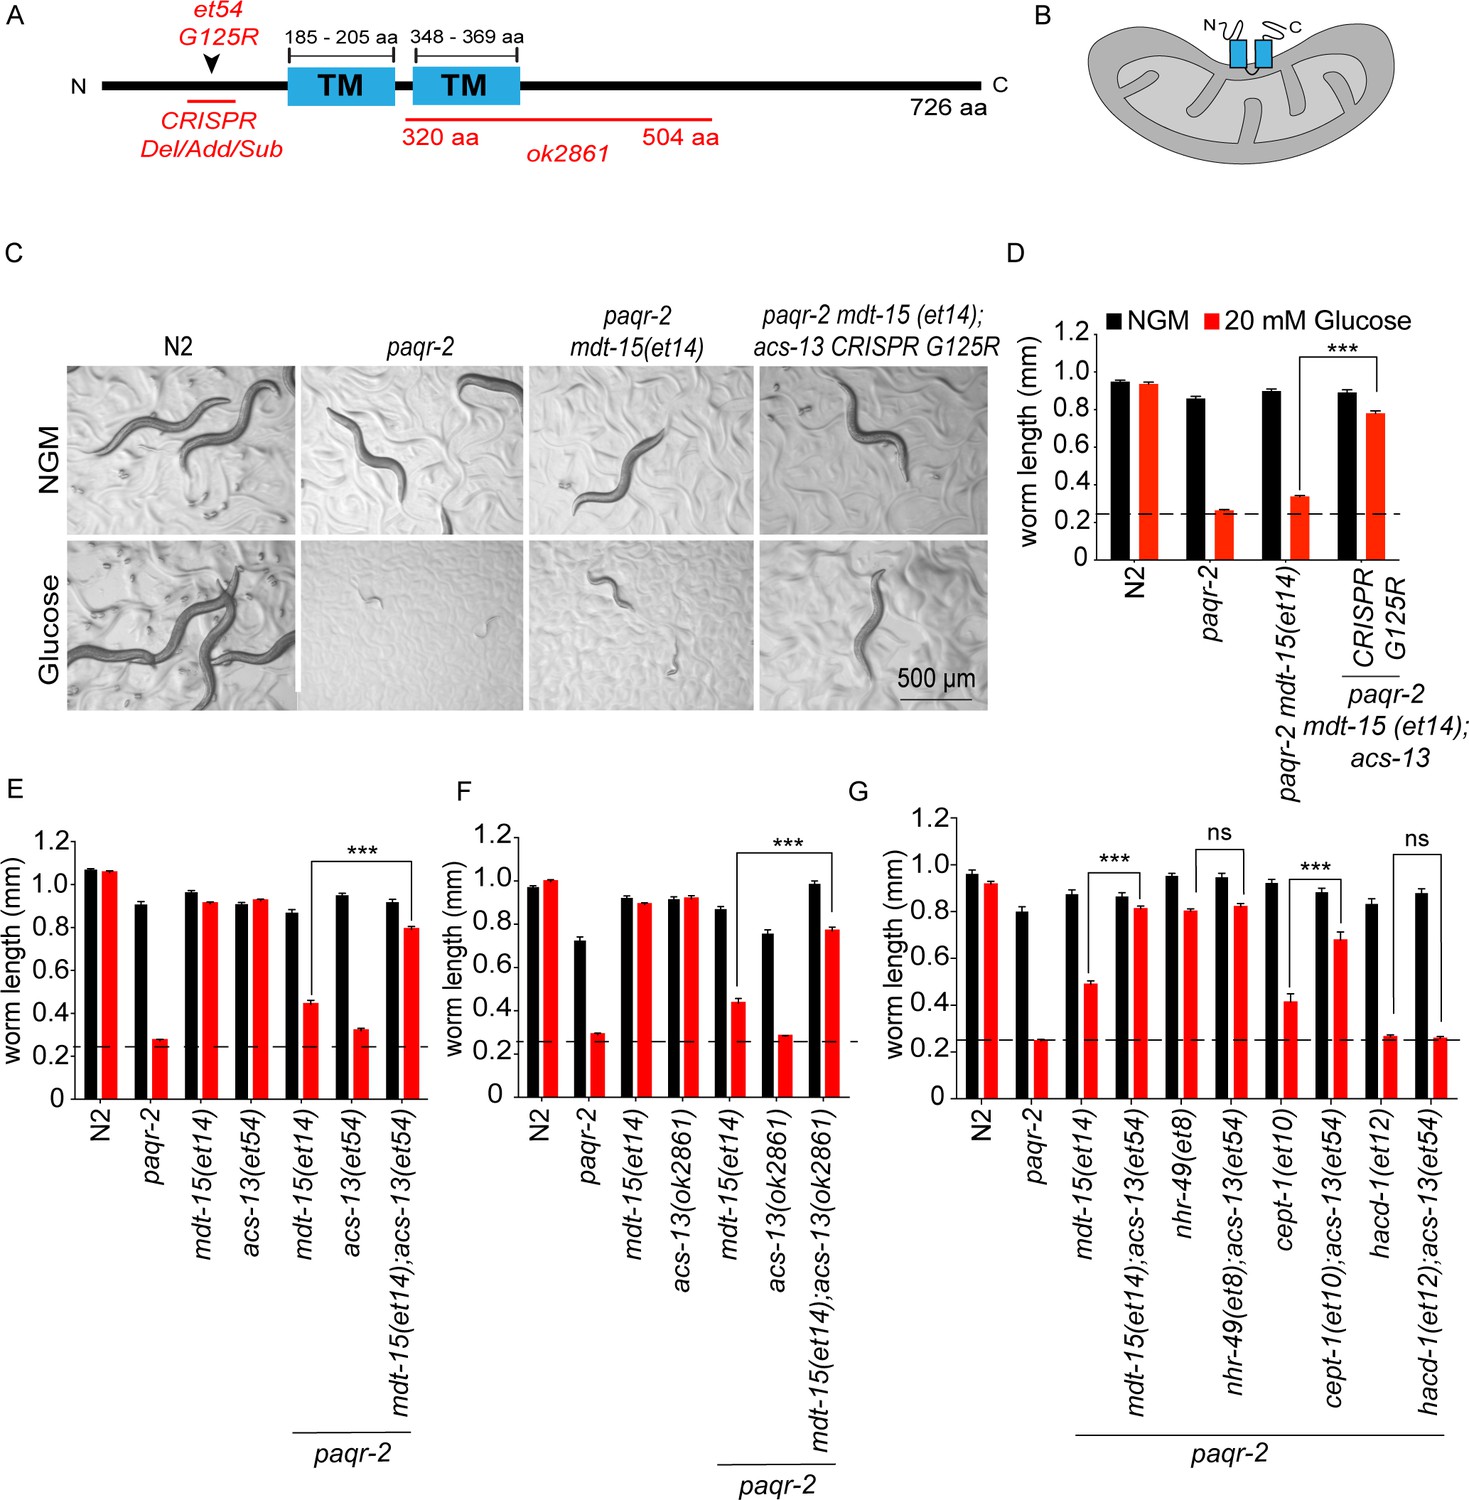
acs-13 mutations enhance the ability of mdt-15(et14) or cept-1(et10) to suppress the glucose intolerance of the paqr-2 mutant.
(A) Cartoon representation of the ACS-13 protein, with the two transmembrane domains indicated in blue and the nature of the amino acid substitution mutant alleles et54 and the deletion mutant allele ok2861 indicated in red; the Phyre2 web portal was used for protein modelling and definition of the transmembrane domains (Kelley et al., 2015). (B) Tentative orientation of ACS-13 inserted in an outer mitochondrial membrane, where the human homolog ACSL1 has been detected (Lee et al., 2011; Lewin et al., 2001). (C–G) Photographs and length measurements of worms with the indicated genotypes placed as L1s on the indicated media (control NGM or 20 mM glucose) then grown for 72 hr (n = 20). The dashed lines in D-G indicate the approximate length of L1s at the start of the experiments. Only the statistical significances of interest are indicated, where ***: p<0.001.
Figure 1—figure supplement 1
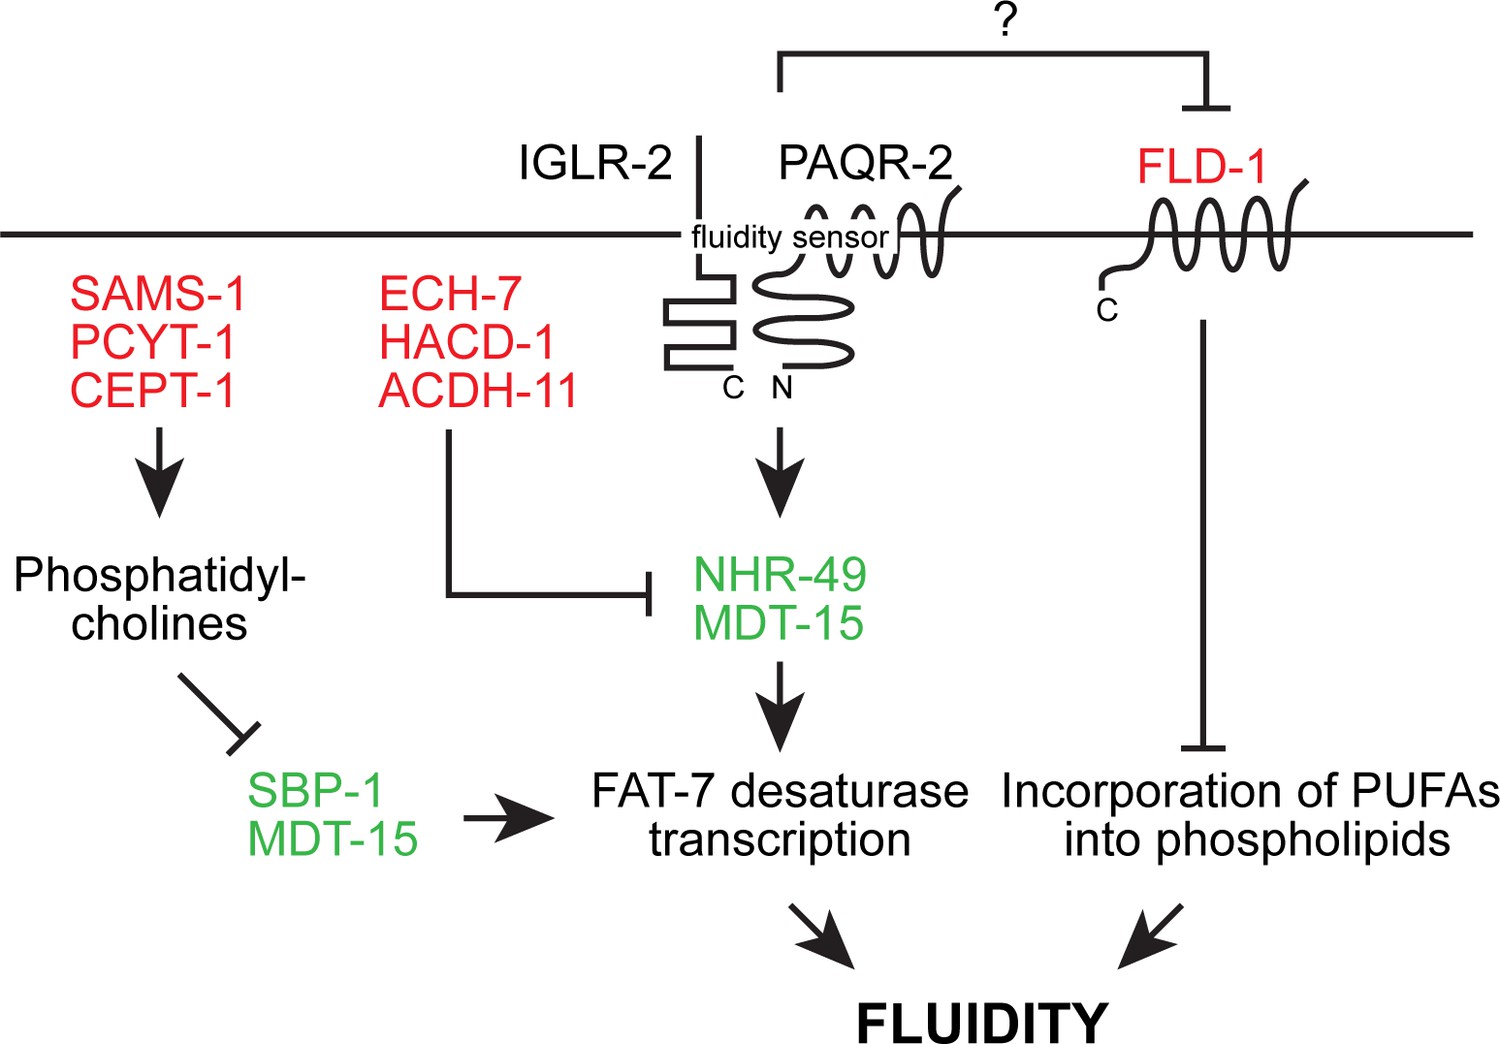
Overview of the likely epigenetic interactions in the paqr-2 pathway based on published work prior to the present study.
Loss-of-function mutation in the red-colored proteins and gain-of-function mutations in the green-colored proteins act as paqr-2 mutant suppressors. Note that there are likely two separate fluidity-promoting outputs of PAQR-2 signaling: one output promotes desaturase transcription while the other output regulates incorporation of PUFAs into phospholipids. Several previously showed that many paqr-2 suppressor mutations act by promoting desaturase upregulation, either via either SBP-1::MDT-15 or NHR-49::MDT-15 (Svensk et al., 2013; Svensk et al., 2016a; Bodhicharla et al., 2018; Ruiz et al., 2018). In contrast, prior to this work only loss-of-function alleles of fld-1 had so far been identified as paqr-2 mutant suppressors that act as regulators of PUFA incorporation (Ruiz et al., 2018).
Figure 1—figure supplement 2
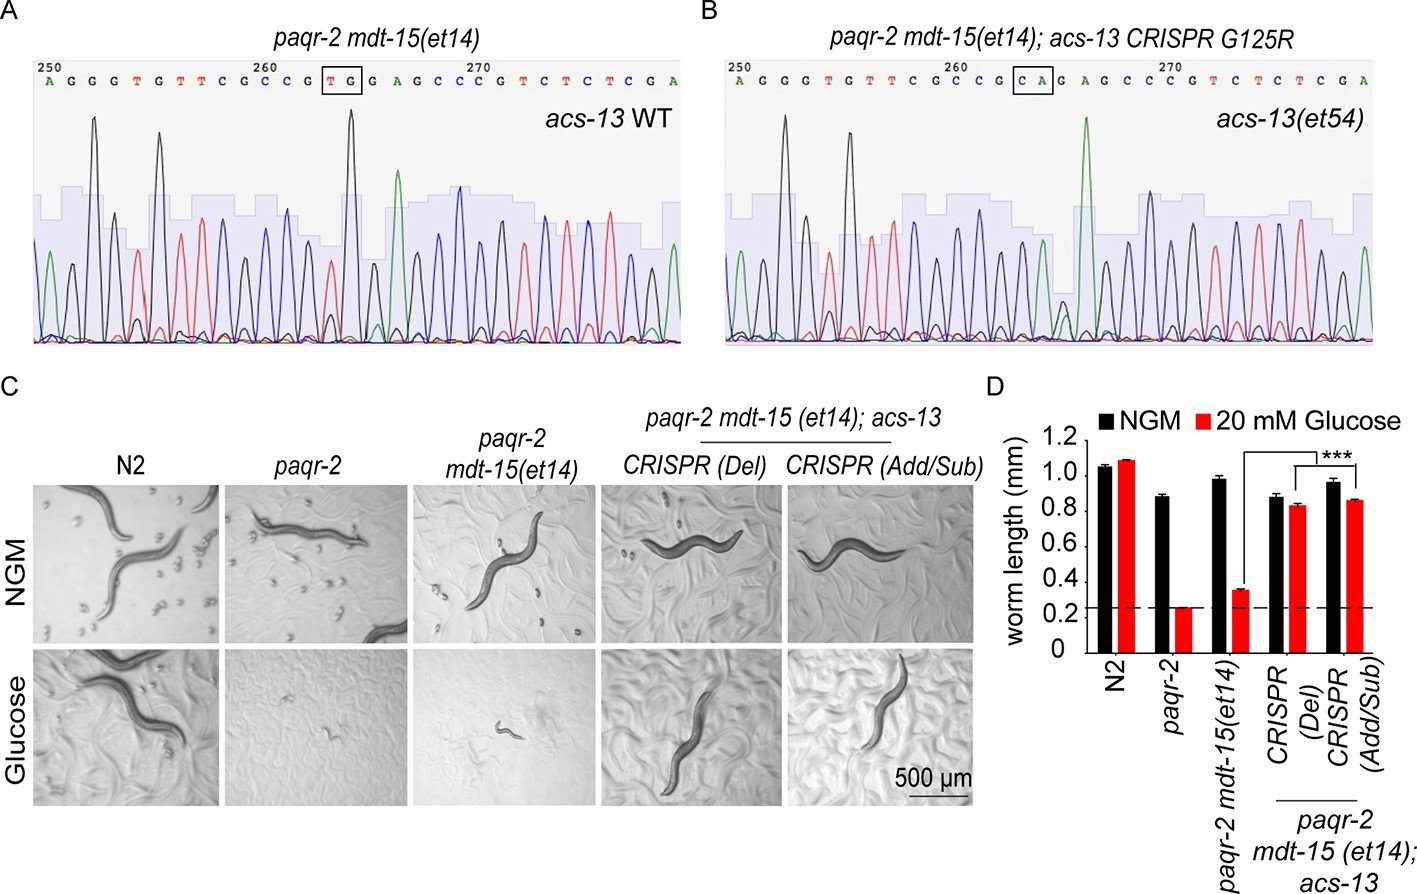
Additional CRISPR-generated acs-13 mutants also enhance the ability of mdt-15(et14) to suppress the glucose intolerance in paqr-2 mutants.
(A–B) Sequencing results confirming genome editing of the acs-13 locus in paqr-2 mdt-15(et14); acs-13(CRISPR G125R) compared to the original sequence paqr-2 mdt-15(et14) worms. (C–D) Photographs and length measurements from >20 worms per genotype placed as L1s on the indicated media (control NGM or 20 mM glucose) then grown for 72 hr (n = 20). The CRISPR Del (26 b deletion in the 3rd exon of the spliced version of acs-13 isoform ‘a’ starting from and include the 350th nucleotide to 375th nucleotide where the position one is the ‘A’ in the start ATG codon) and CRISPR Add/Sub (five nucleotides substitution and four nucleotides addition in the 3rd exon of the spliced version of acs-13 isoform ‘a’ starting from the 367th nucleotide. WT: 5’-cgccgtggagcccg-3’, mut: 5’-TgAAgCCATGTgagcccg-3’) variants of acs-13 carry short amino acid deletions, addition and substitutions due to imperfect repair near position G125 which was targeted by the guide RNA. The dashed lines in D indicate the approximate length of L1s at the start of the experiments. Only the statistical significances of interest are indicated, where ***: p<0.001.
Figure 1—figure supplement 3
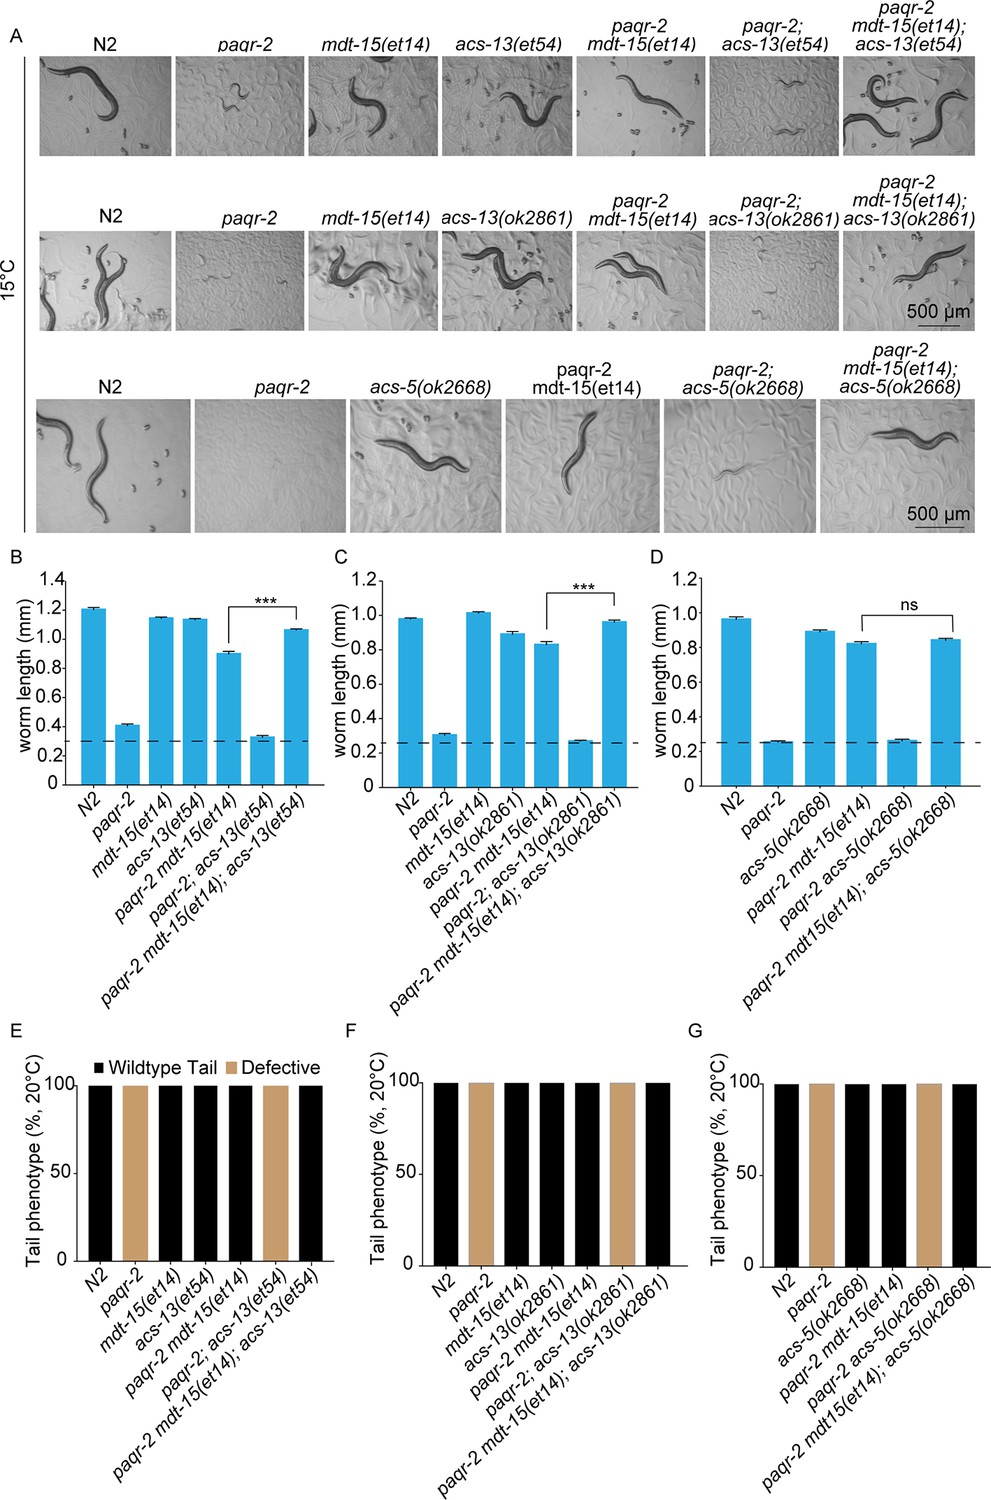
acs-13 mutations enhance the ability of mdt-15(et14) to suppress the cold sensitivity of the paqr-2 mutant.
(A–D) Photographs and length measurements of worms placed as L1s on control (NGM) plates then grown for 96 hr at 15°C (n = 20). Only the statistical significances of interest are indicated, where ***: p<0.001. (E–G) Scoring of the tail tip in worms of various genotypes (n = 100).
Figure 1—figure supplement 4
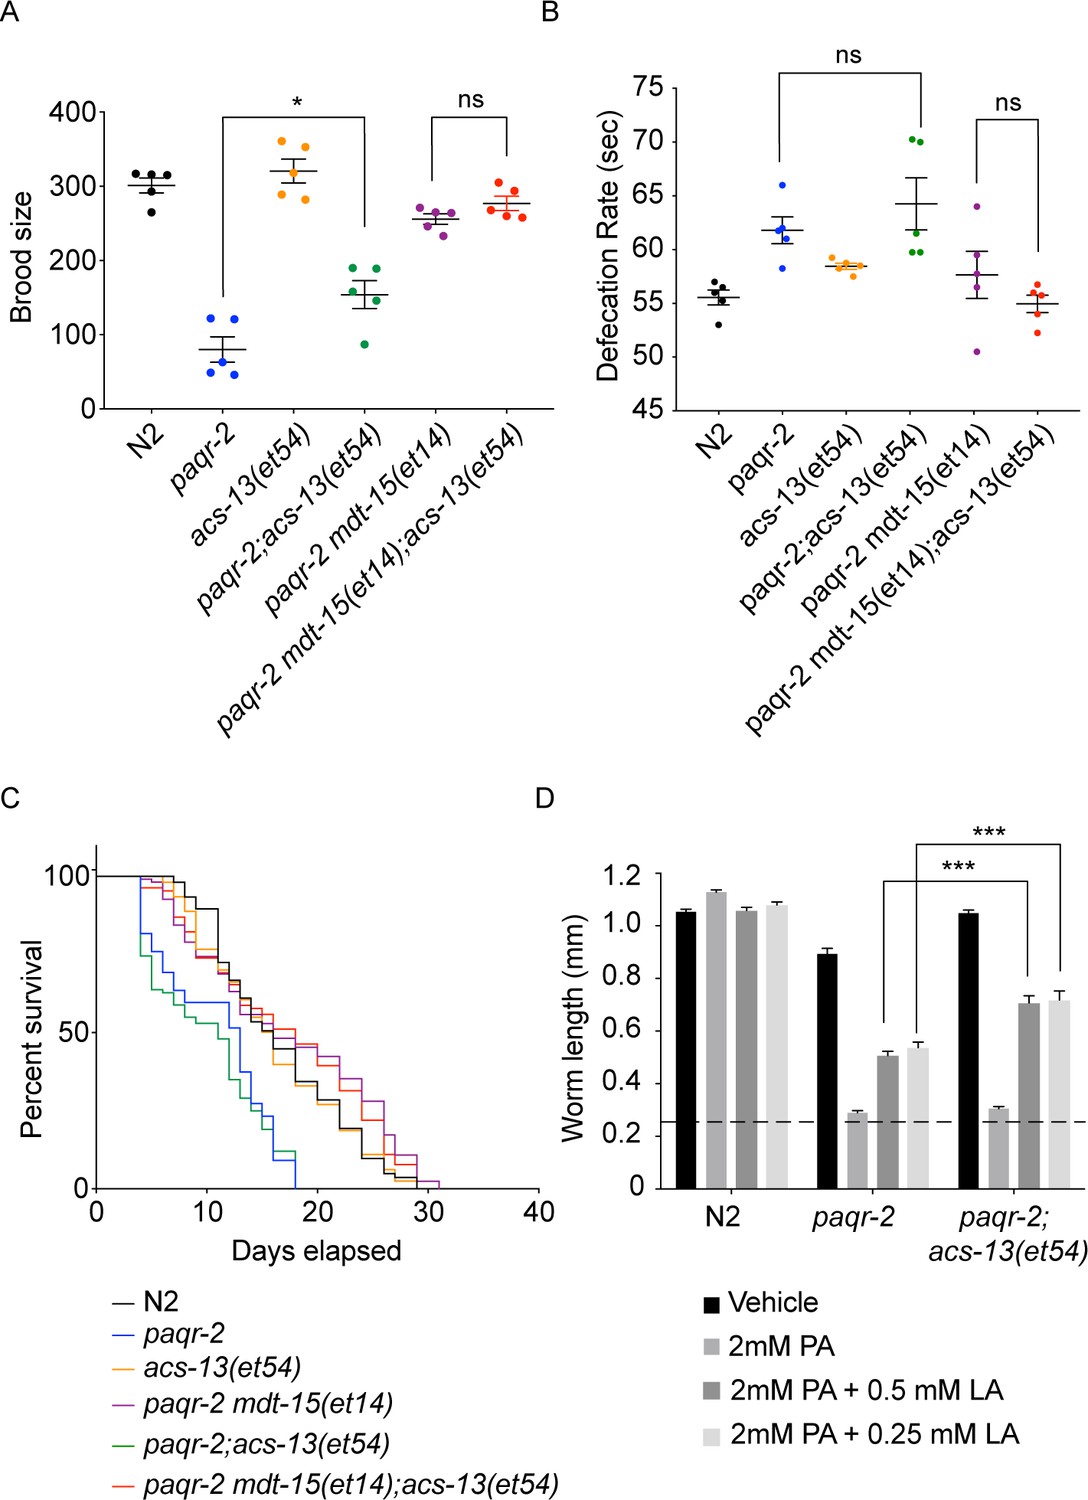
The acs-13 mutation suppresses the brood size defect in paqr-2 mutants and enhances the effects of exogenous linoleic acid (18:2 n-6).
Brood size (n = 5) (A), defecation rate (n = 5) (B), and lifespan (n = 100) (C) defects in worms of the indicated genotypes. Note that acs-13(et54) by itself improves the brood size of paqr-2 mutant worms and enhances the ability of mdt-15(et4) to suppress the brood size and defecation rate defects in the paqr-2 mutant. (D) Control N2, paqr-2 or paqr-2; acs-13(et54) synchronized L1s were placed on plates containing the indicated additives, cultivated for 72 hr and their lengths measured. Note that the acs-13(et54) mutation improves the ability of linoleic acid (LA) to suppress the palmitate (PA) intolerance in paqr-2 mutants.
Figure 2 with 1 supplement
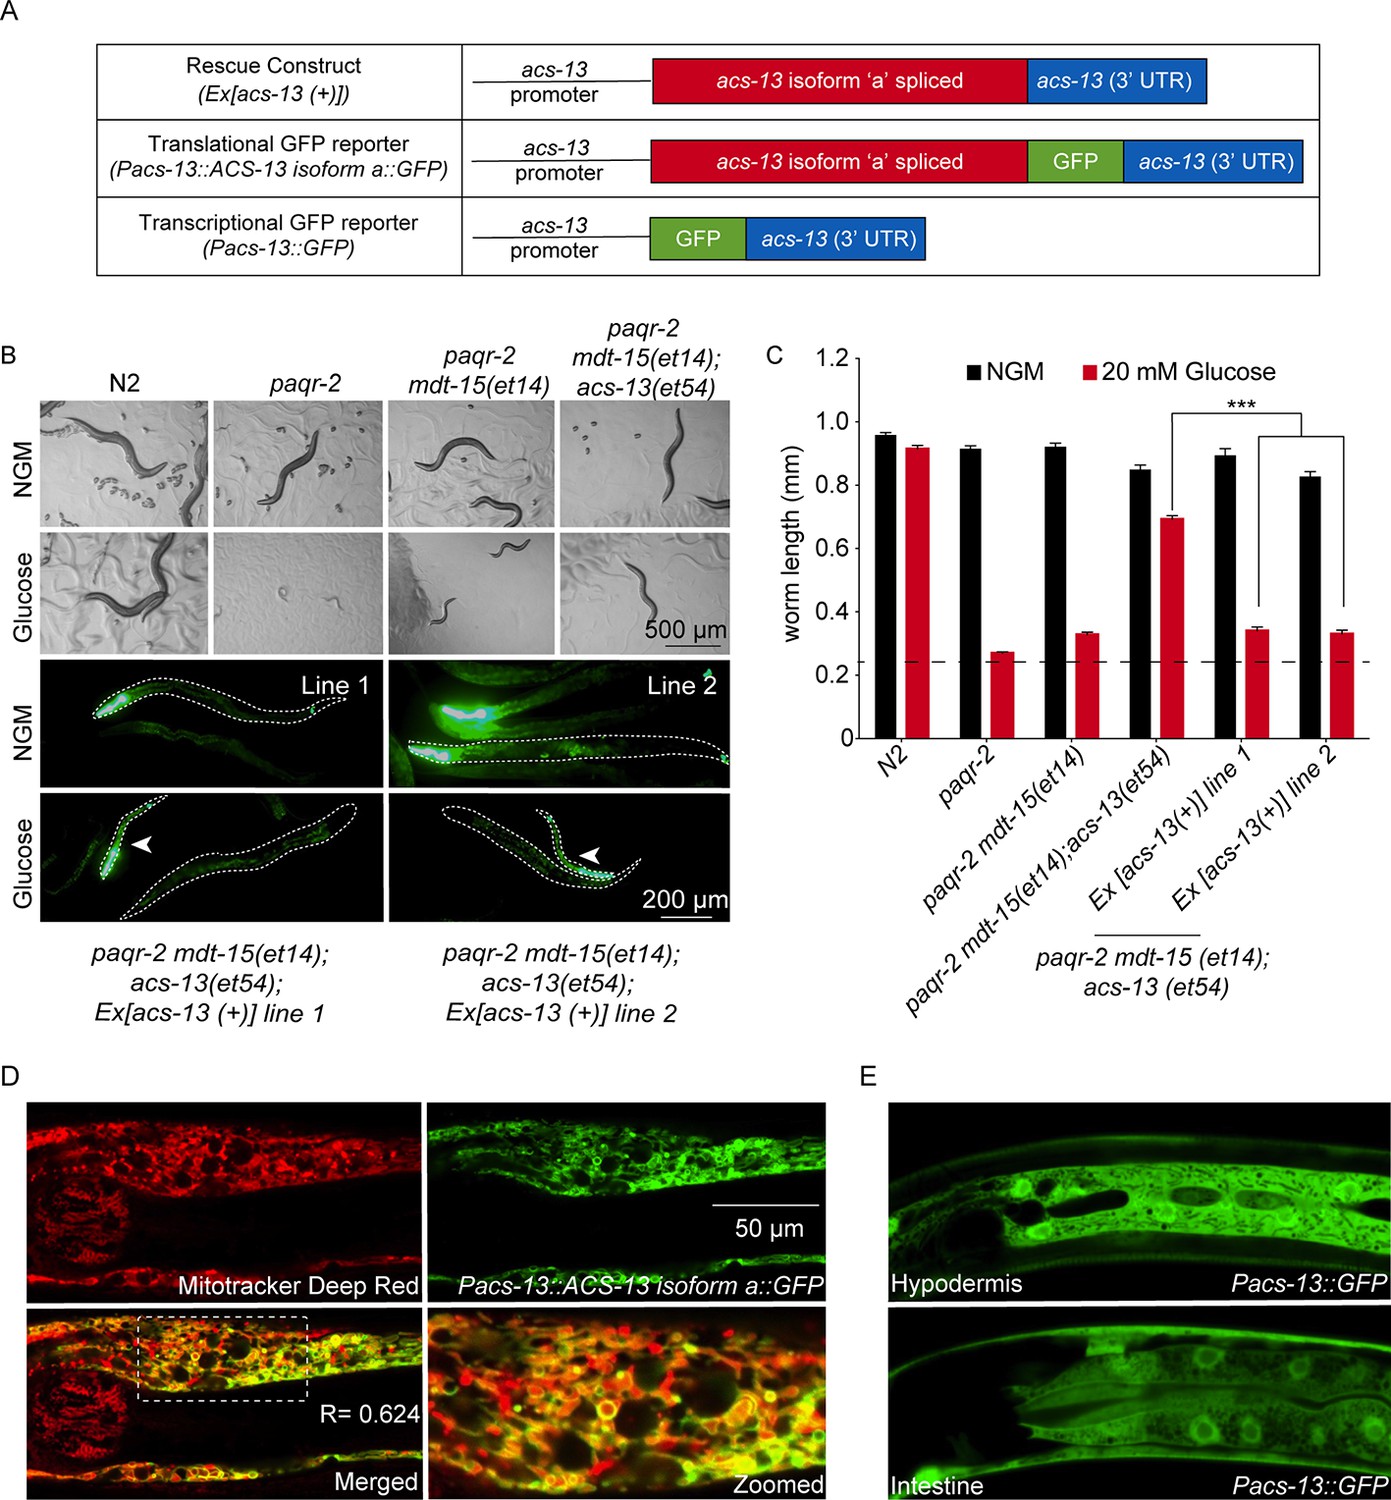
The ACS-13 protein localizes to mitochondria and is expressed in intestine and hypodermis.
(A) Cartoon representation of the acs-13 constructs created for this study. (B) Bright field photographs of worms with the indicated genotypes cultivated on control plates (NGM) or plates containing 20 mM glucose (top two rows), and epifluorescence images of two independent lines of transgenic paqr-2 mdt-15(et14) worms carrying the myo-2::GFP marker as well as the wild-type acs-13(+) rescue construct and cultivated either on NGM or 20 mM glucose plates (bottom two rows; several worms are outlined with dashed lines). Note how presence of the acs-13(+) construct in both transgenic lines abolishes the glucose resistance of paqr-2 mdt-15(et14); acs-13(et54) double mutants (examples indicated by arrowheads). (C) Length measurements of worms cultivated as in B (n = 20). Only the statistical significances of interest are indicated, where ***: p<0.001. (D) Confocal image of the anterior portion of an N2 worms at the L1 stage stained with Mitotracker Deep Red (red) and carrying the Pacs-13::ACS-13 isoform a::GFP translational reporter (green). Co-localization is indicated by yellow hues in the merged and zoomed panels. Note the strong colocalization on the periphery of mitochondria, indicating that ACS-13 localizes to the mitochondrial membrane. R is the Pearson correlation coefficient between the two fluorophores. (E) Confocal image of N2 worms of the L1 stage and carrying the Pacs-13::GFP transcriptional reporter expressed in hypodermis and intestine.
Figure 2—figure supplement 1
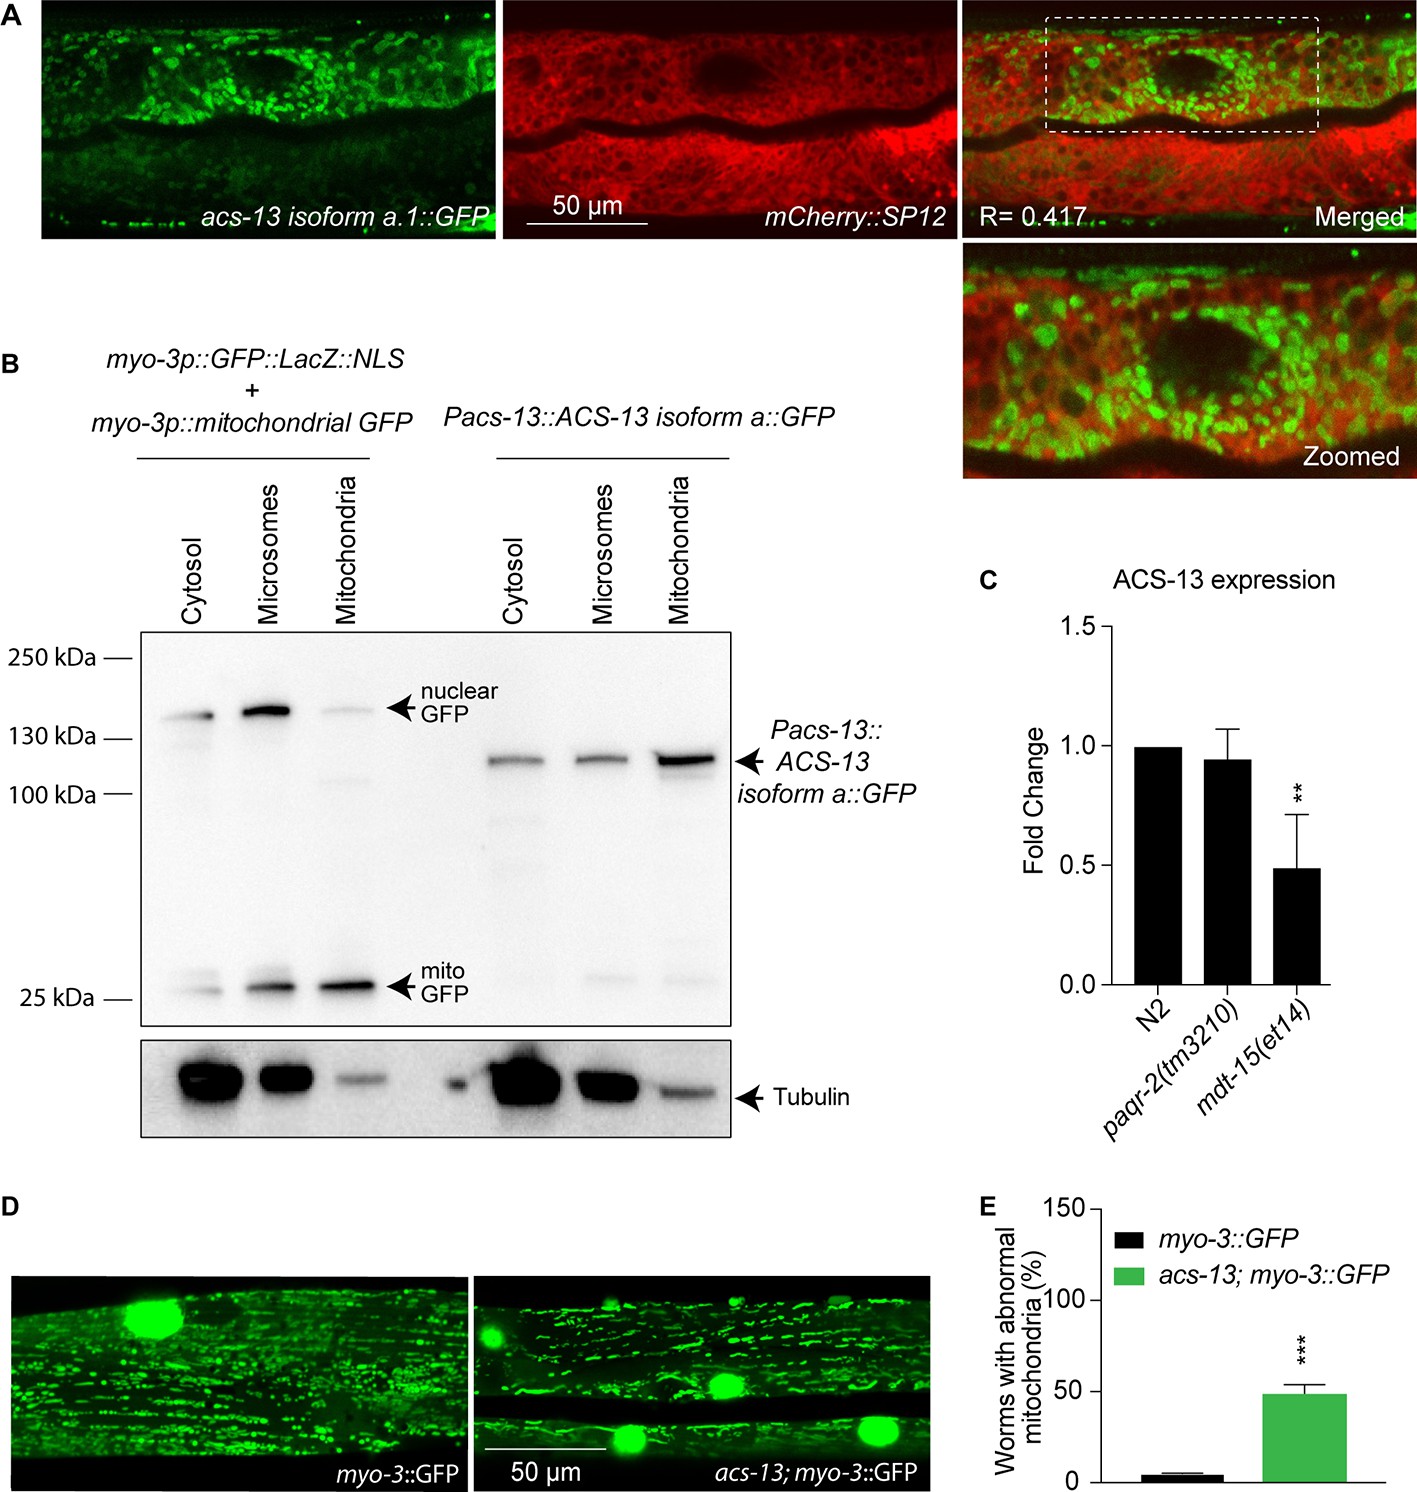
ACS-13 is enriched on mitochondria and important for their morphology.
(A) Confocal image of L4 staged N2 worms carrying the Pacs-13::ACS-13 isoform a::GFP translational reporter (green) and SP12 ER marker (red). Note that ACS- 13 does not colocalizes with the ER marker. R is the Pearson correlation coefficient between the two fluorophores. (B) Western blot detection of the GFP proteins in the indicated strains and fractions (cytosol, microsome and mitochondria); α-tubulin was used as a cytosol marker. 8 μg of protein was loaded in each sample. Note that in Pacs-13::ACS-13 isoform a::GFP worms there is enrichment of ACS-13 in the mitochondria fractionation sample showing that ACS-13 is present mostly in the mitochondria. (C) Quantitative PCR showing the ACS-13 RNA expression levels in N2, paqr-2 (tm3210) and mdt15(et14) worms. (D–E) Confocal image and quantification of one-day old adult N2 control and acs-13(et54) mutant worms carrying the mitochondrial GFP reporter myo-3::GFP and cultivated on NGM plates. Note how the mitochondria in the acs-13 mutant are less regularly spaced and of more variable length and intensity than in the wild-type. The bright green circles are muscle cell nuclei. The graph shows the frequency of worms with at least once clear instance of a muscle cell with abnormal mitochondria morphology in control myo-3::GFP and in acs-13; myo-3::GFP worms. Statistically significant differences from control are indicated, where **: p<0.01 and ***: p<0.001.
Figure 3
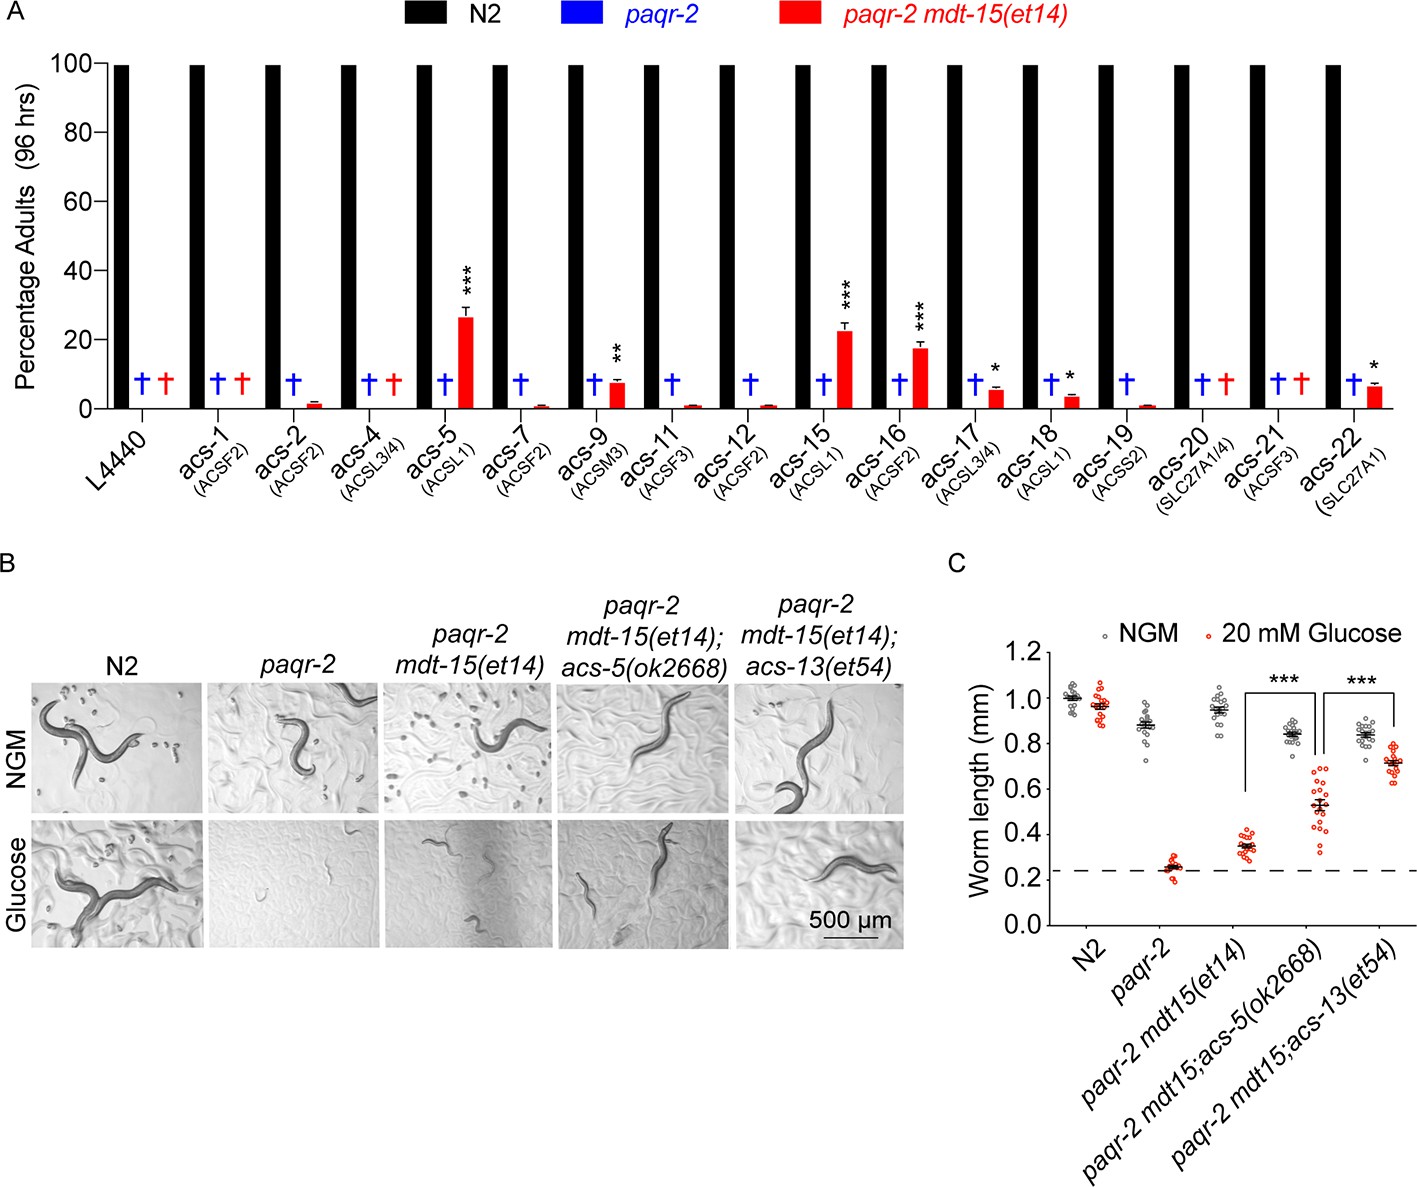
Knockdown of several Acyl Co-A synthetases can enhance the ability of mdt-15(et14) to suppress the glucose sensitivity of the paqr-2 mutant.
(A) Percentage of L1 larvae that grew into adults within 96 hr on plates containing 20 mM glucose (n = 100) and seeded with the indicated RNAi E. coli clone (suggested human homolog as per WormBase is indicated in parenthesis; L4440 is the empty vector control). Statistical significances between the empty vector control and RNAi are indicated, where *: p<0.05, **: p<0.01 and ***: p<0.001. (B–C) Photographs and length measurements of worms placed as L1s on the indicated media (control NGM or 20 mM glucose) then grown for 72 hr (n = 20). The dashed lines in C indicate the approximate length of L1s at the start of the experiments. Only the statistical significances of interest is indicated, where ***: p<0.001.
Figure 4 with 3 supplements
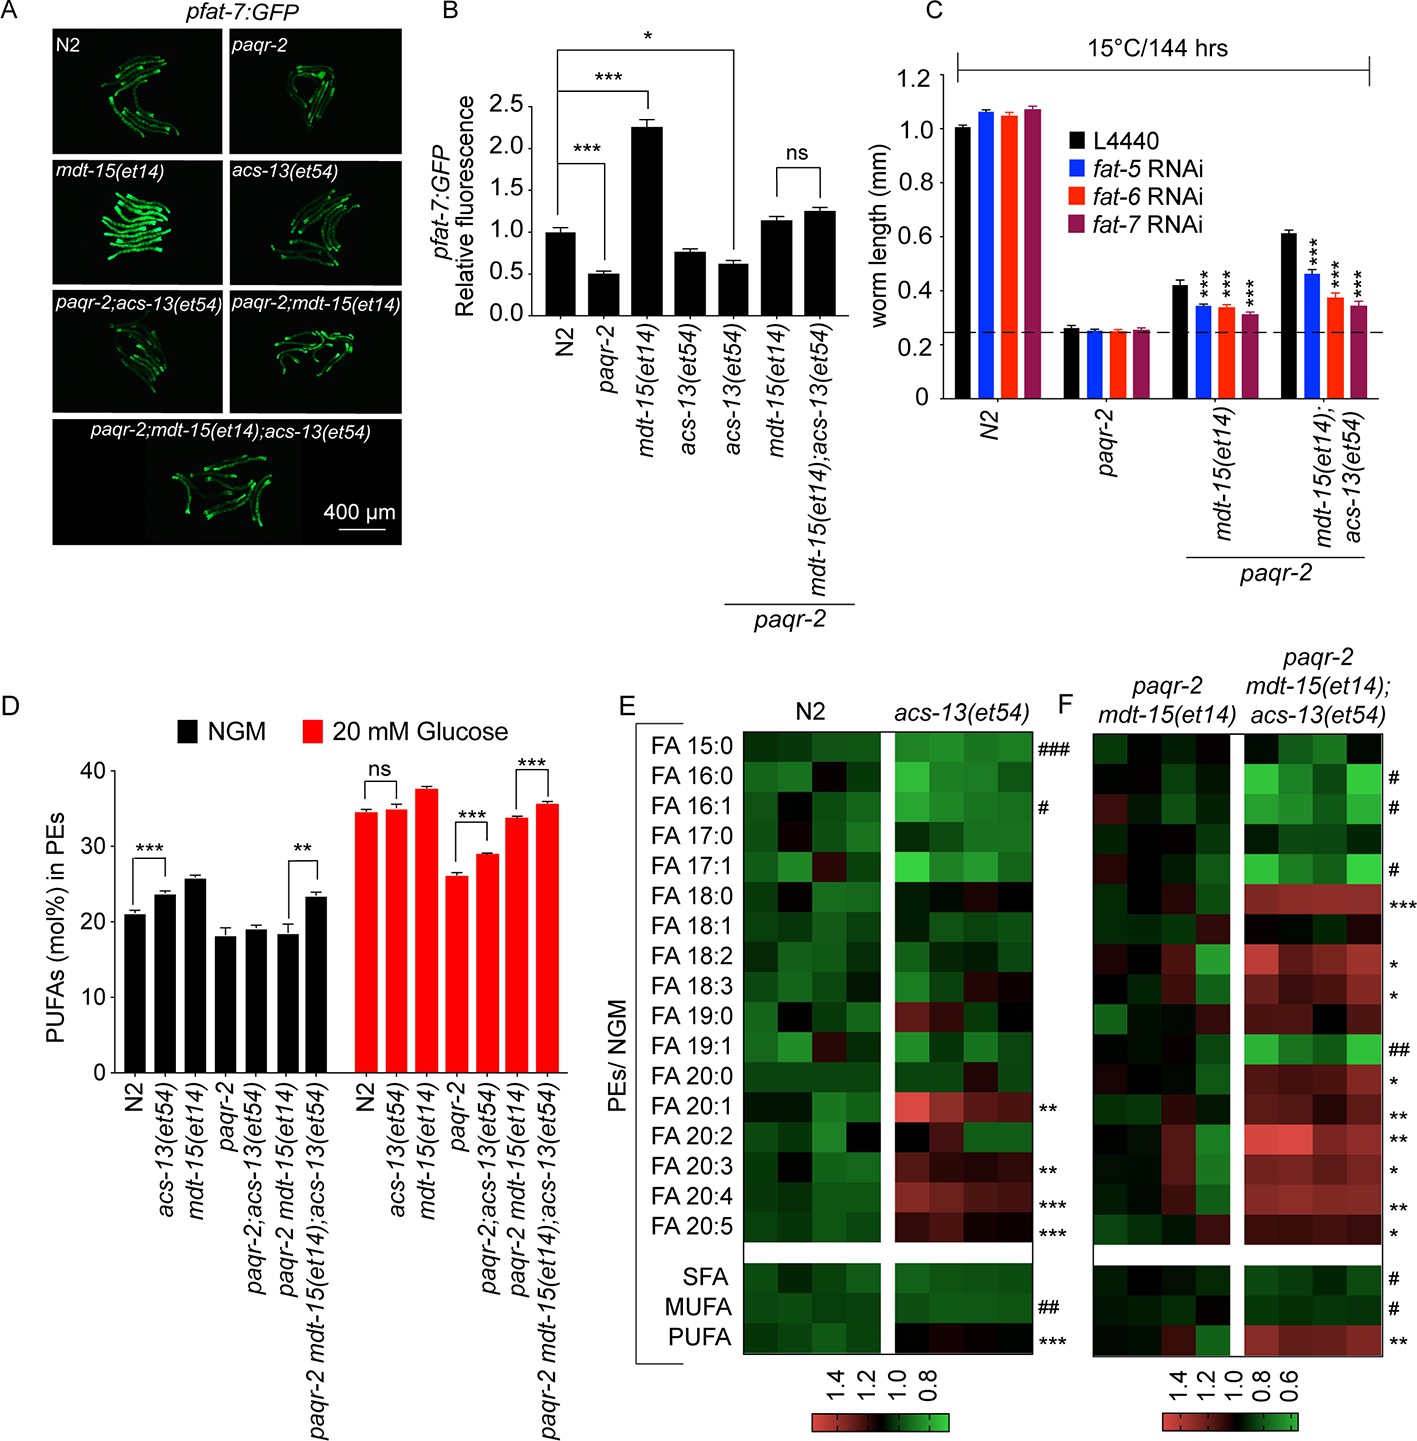
The acs-13 mutation causes elevated LCPUFAs in phospholipids.
(A–B) mdt-15(et14) but not acs-13(et54) cause upregulation of the pfat-7::GFP reporter (n = 20) on NGM plates. (C) RNAi against the Δ9 desaturases fat-5, fat-6 and fat-7 reduces the ability of mdt-15(et14) and of mdt-15(et14) together with acs-13(et54) to suppress the cold sensitivity of paqr-2 mutants (n = 20). (D) The paqr-2 mutant has decreased PUFA levels among PEs on control plates (NGM) or plates containing 20 mM glucose, while the acs-13(et54) and mdt-15(et14) mutations cause increased PUFA levels among PEs in wild-type worms grown on NGM and together restore normal PUFA levels in paqr-2 mutants cultivated on NGM plates or 20 mM glucose. (E–F) Heat maps showing the relative abundance of specific FA species among the PEs of worms with the indicated genotype and grown on NGM plates. Note the increased abundance of LCPUFAs in genotypes carrying the acs-13(et54) mutation. Statistical significances of interest are indicated, where *: p<0.05, **: p<0.01 and ***: p<0.001 for FAs with increased levels in the acs-13(et54) mutants (#, ## and ### are used when acs-13(et54) mutants have reduced levels of a FA).
-
Figure 4—source data 1
Lipidomics data for panel D.
- https://cdn.elifesciences.org/articles/47733/elife-47733-fig4-data1-v2.xlsx
-
Figure 4—source data 2
Lipidomics data for panel E.
- https://cdn.elifesciences.org/articles/47733/elife-47733-fig4-data2-v2.xlsx
Figure 4—figure supplement 1
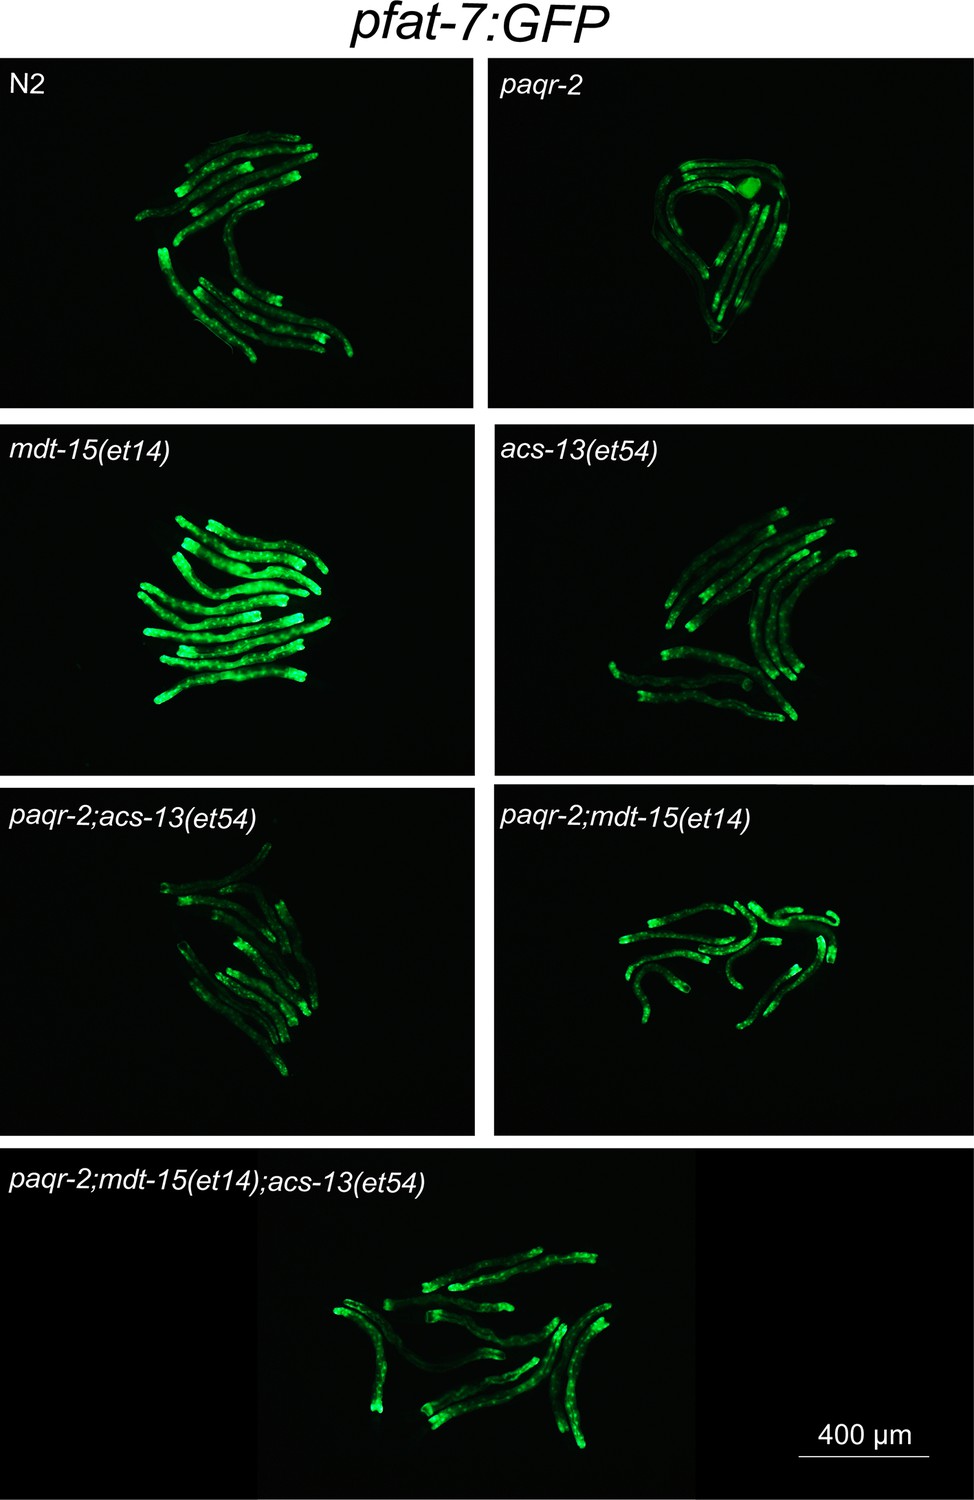
Enlarged view of pfat-7::GFP expression from Figure 4A.
Figure 4—figure supplement 2
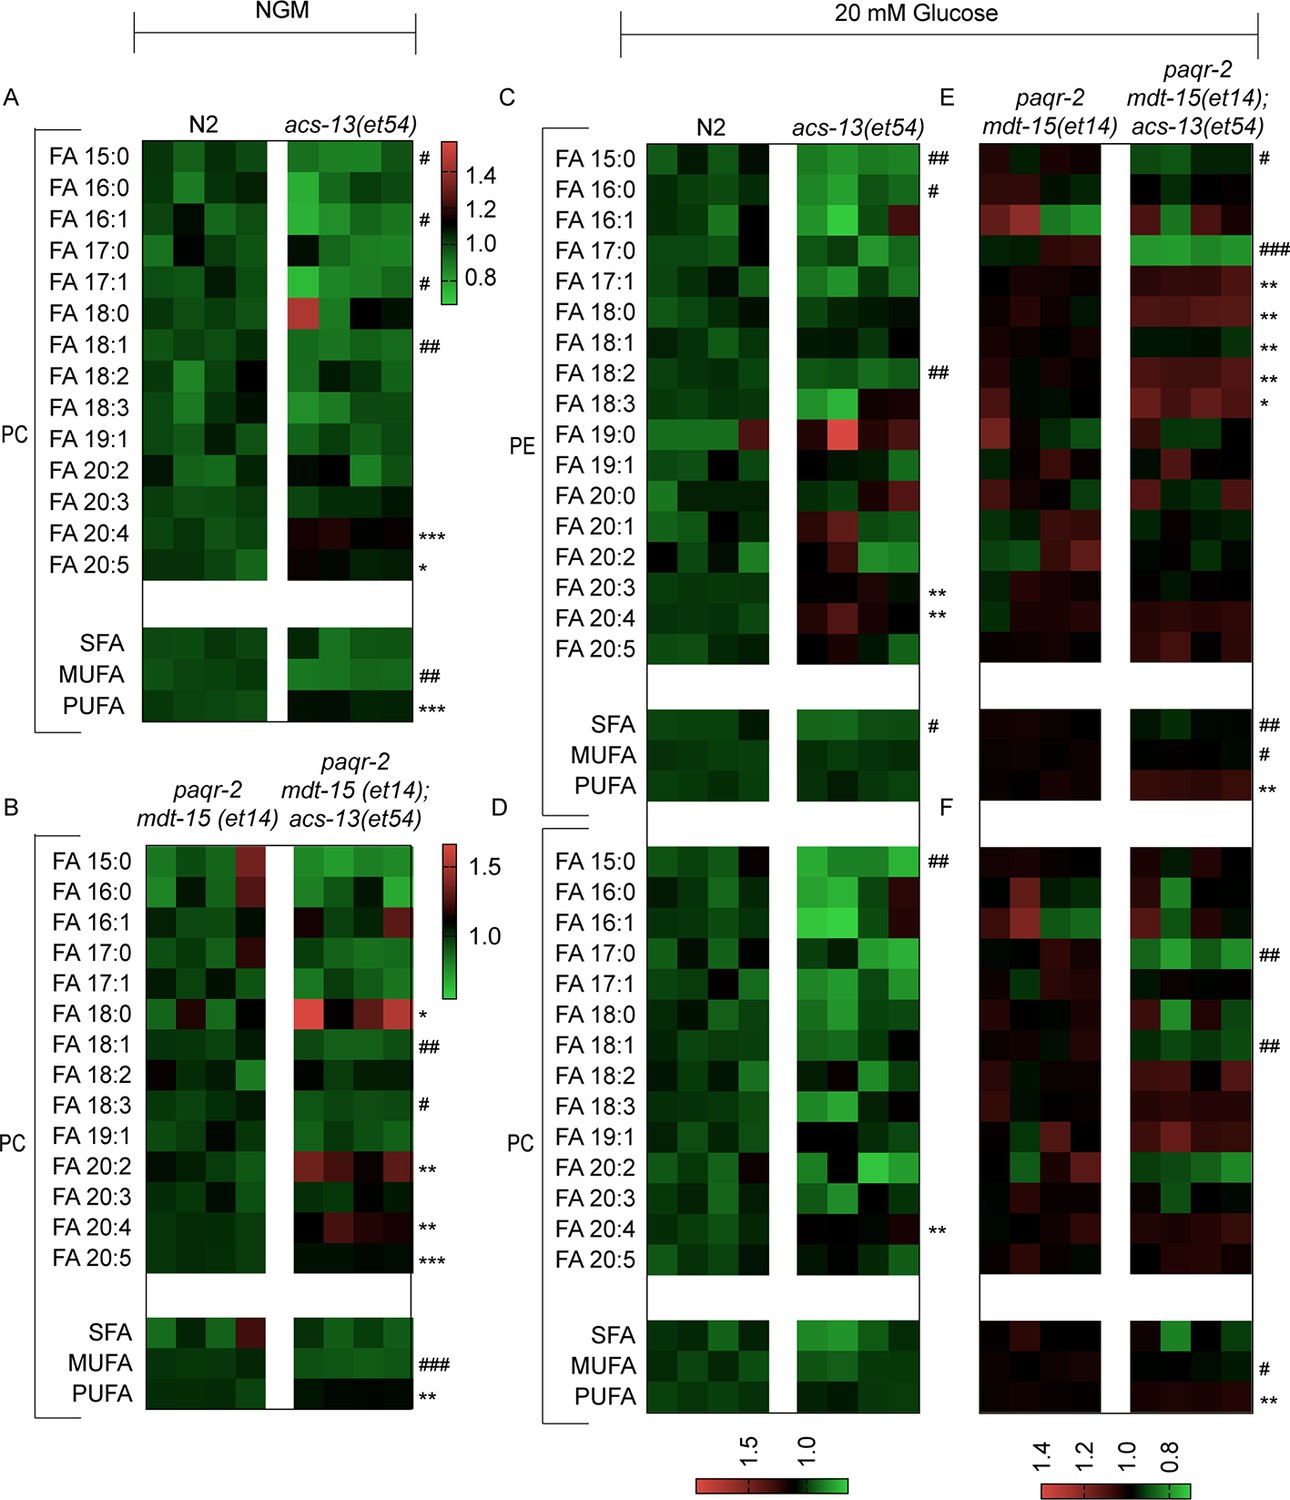
Lipidomics heat map for FAs among PCs from worms grown on NGM plates or PEs from worms grown on 20 mM glucose.
(A–F) Heat maps showing the relative abundance of specific FA species among the PCs and PEs of worms with the indicated genotype and grown on NGM plates or 20 mM glucose. Statistical significances of interest are indicated, where *: p<0.05, **: p<0.01 and ***: p<0.001 for FAs with increased levels in the acs-13(et54) mutants (#, ## and ### are used where the acs-13(et54) mutants have reduced levels of a FA).
-
Figure 4—figure supplement 2—source data 1
Lipidomics data for panel A.
- https://cdn.elifesciences.org/articles/47733/elife-47733-fig4-figsupp2-data1-v2.xlsx
-
Figure 4—figure supplement 2—source data 2
Lipidomics data for panel B.
- https://cdn.elifesciences.org/articles/47733/elife-47733-fig4-figsupp2-data2-v2.xlsx
-
Figure 4—figure supplement 2—source data 3
Lipidomics data for panel C.
- https://cdn.elifesciences.org/articles/47733/elife-47733-fig4-figsupp2-data3-v2.xlsx
-
Figure 4—figure supplement 2—source data 4
Lipidomics data for panel D.
- https://cdn.elifesciences.org/articles/47733/elife-47733-fig4-figsupp2-data4-v2.xlsx
-
Figure 4—figure supplement 2—source data 5
Lipidomics data for panel E.
- https://cdn.elifesciences.org/articles/47733/elife-47733-fig4-figsupp2-data5-v2.xlsx
-
Figure 4—figure supplement 2—source data 6
Lipidomics data for panel F.
- https://cdn.elifesciences.org/articles/47733/elife-47733-fig4-figsupp2-data6-v2.xlsx
Figure 4—figure supplement 3
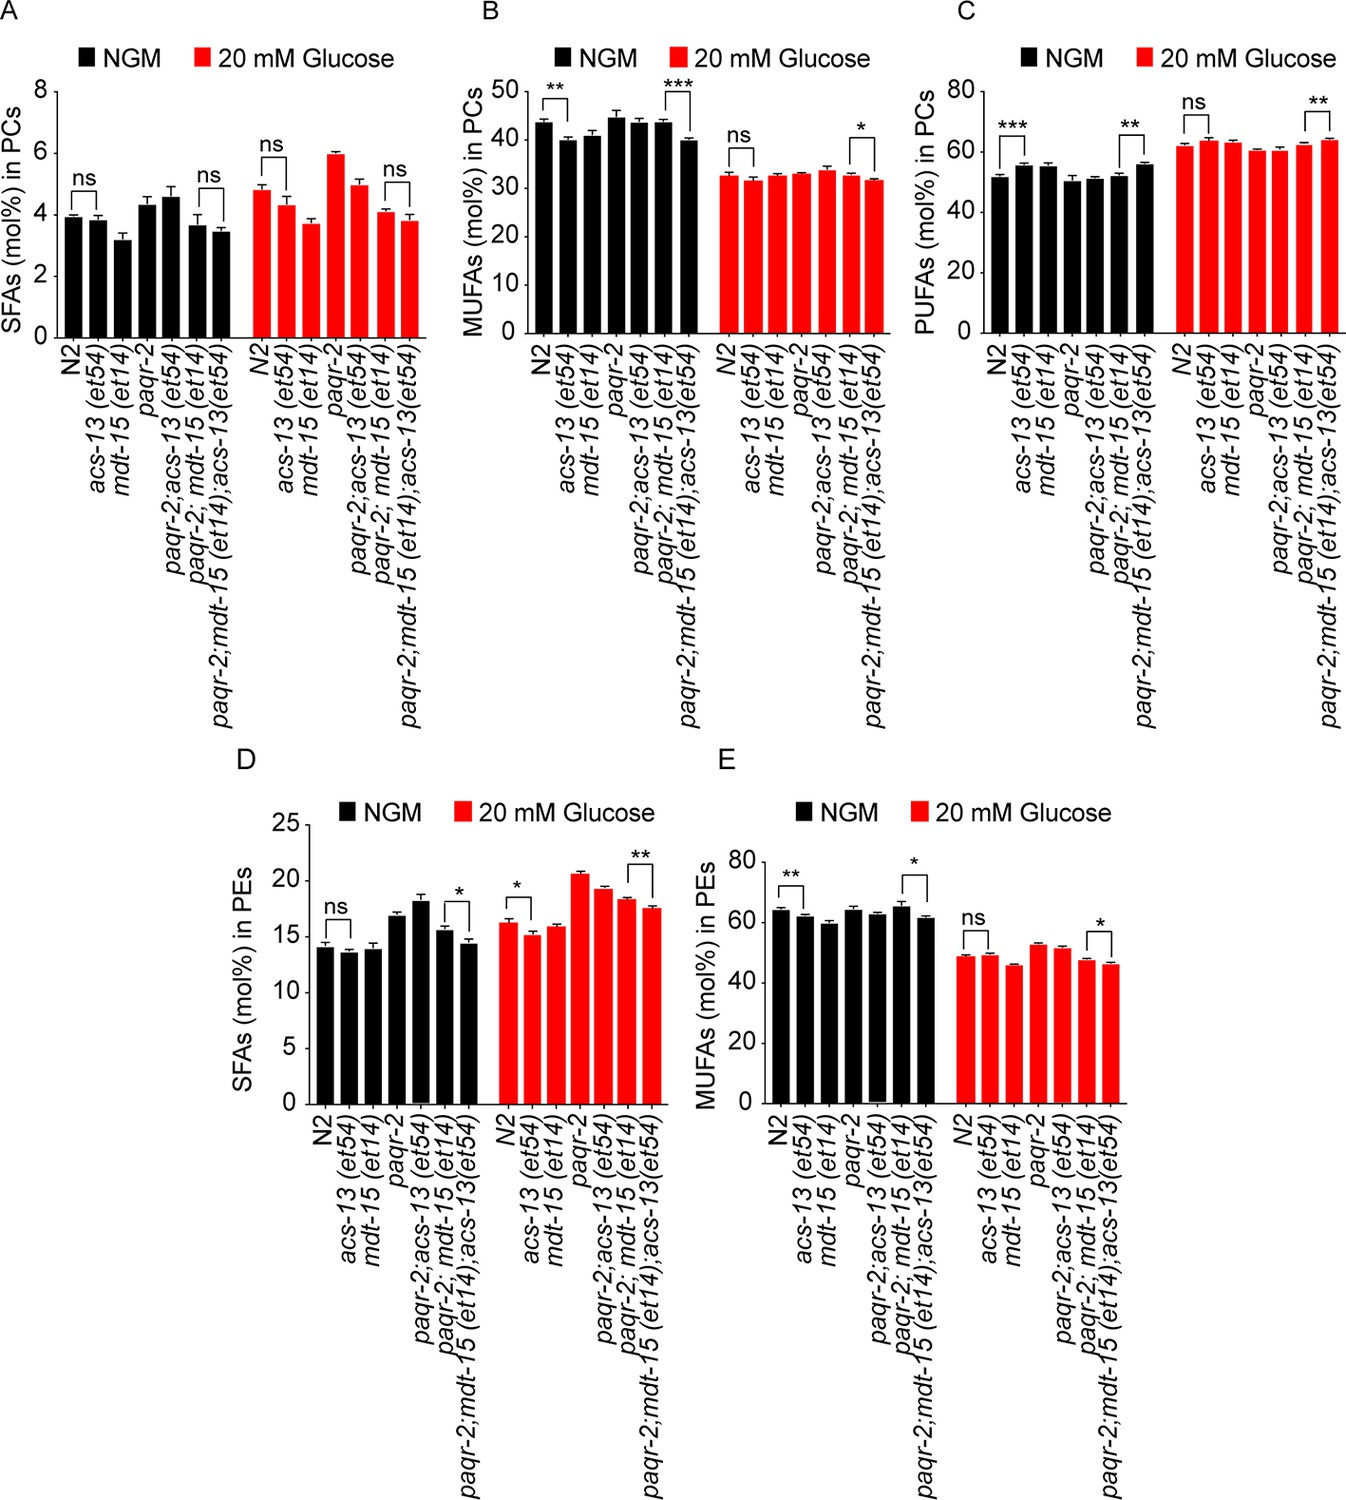
The acs-13 mutation enhances the effect of mdt-15(et14) on phospholipid FA composition in the paqr-2 mutant.
(A–E) Relative abundance of SFAs, MUFAs and PUFAs among the PCs, and SFAs and MUFAs among the PCs and PEs, of worms with various genotypes. Statistically significant differences of interest are indicated, where *: p<0.05, **: p<0.01 and ***: p<0.001.
-
Figure 4—figure supplement 3—source data 7
Lipidomics data for panel A.
- https://cdn.elifesciences.org/articles/47733/elife-47733-fig4-figsupp3-data7-v2.xlsx
-
Figure 4—figure supplement 3—source data 8
Lipidomics data for panel B.
- https://cdn.elifesciences.org/articles/47733/elife-47733-fig4-figsupp3-data8-v2.xlsx
-
Figure 4—figure supplement 3—source data 9
Lipidomics data for panel C.
- https://cdn.elifesciences.org/articles/47733/elife-47733-fig4-figsupp3-data9-v2.xlsx
-
Figure 4—figure supplement 3—source data 10
Lipidomics data for panel D.
- https://cdn.elifesciences.org/articles/47733/elife-47733-fig4-figsupp3-data10-v2.xlsx
-
Figure 4—figure supplement 3—source data 11
Lipidomics data for panel E.
- https://cdn.elifesciences.org/articles/47733/elife-47733-fig4-figsupp3-data11-v2.xlsx
Figure 5 with 2 supplements
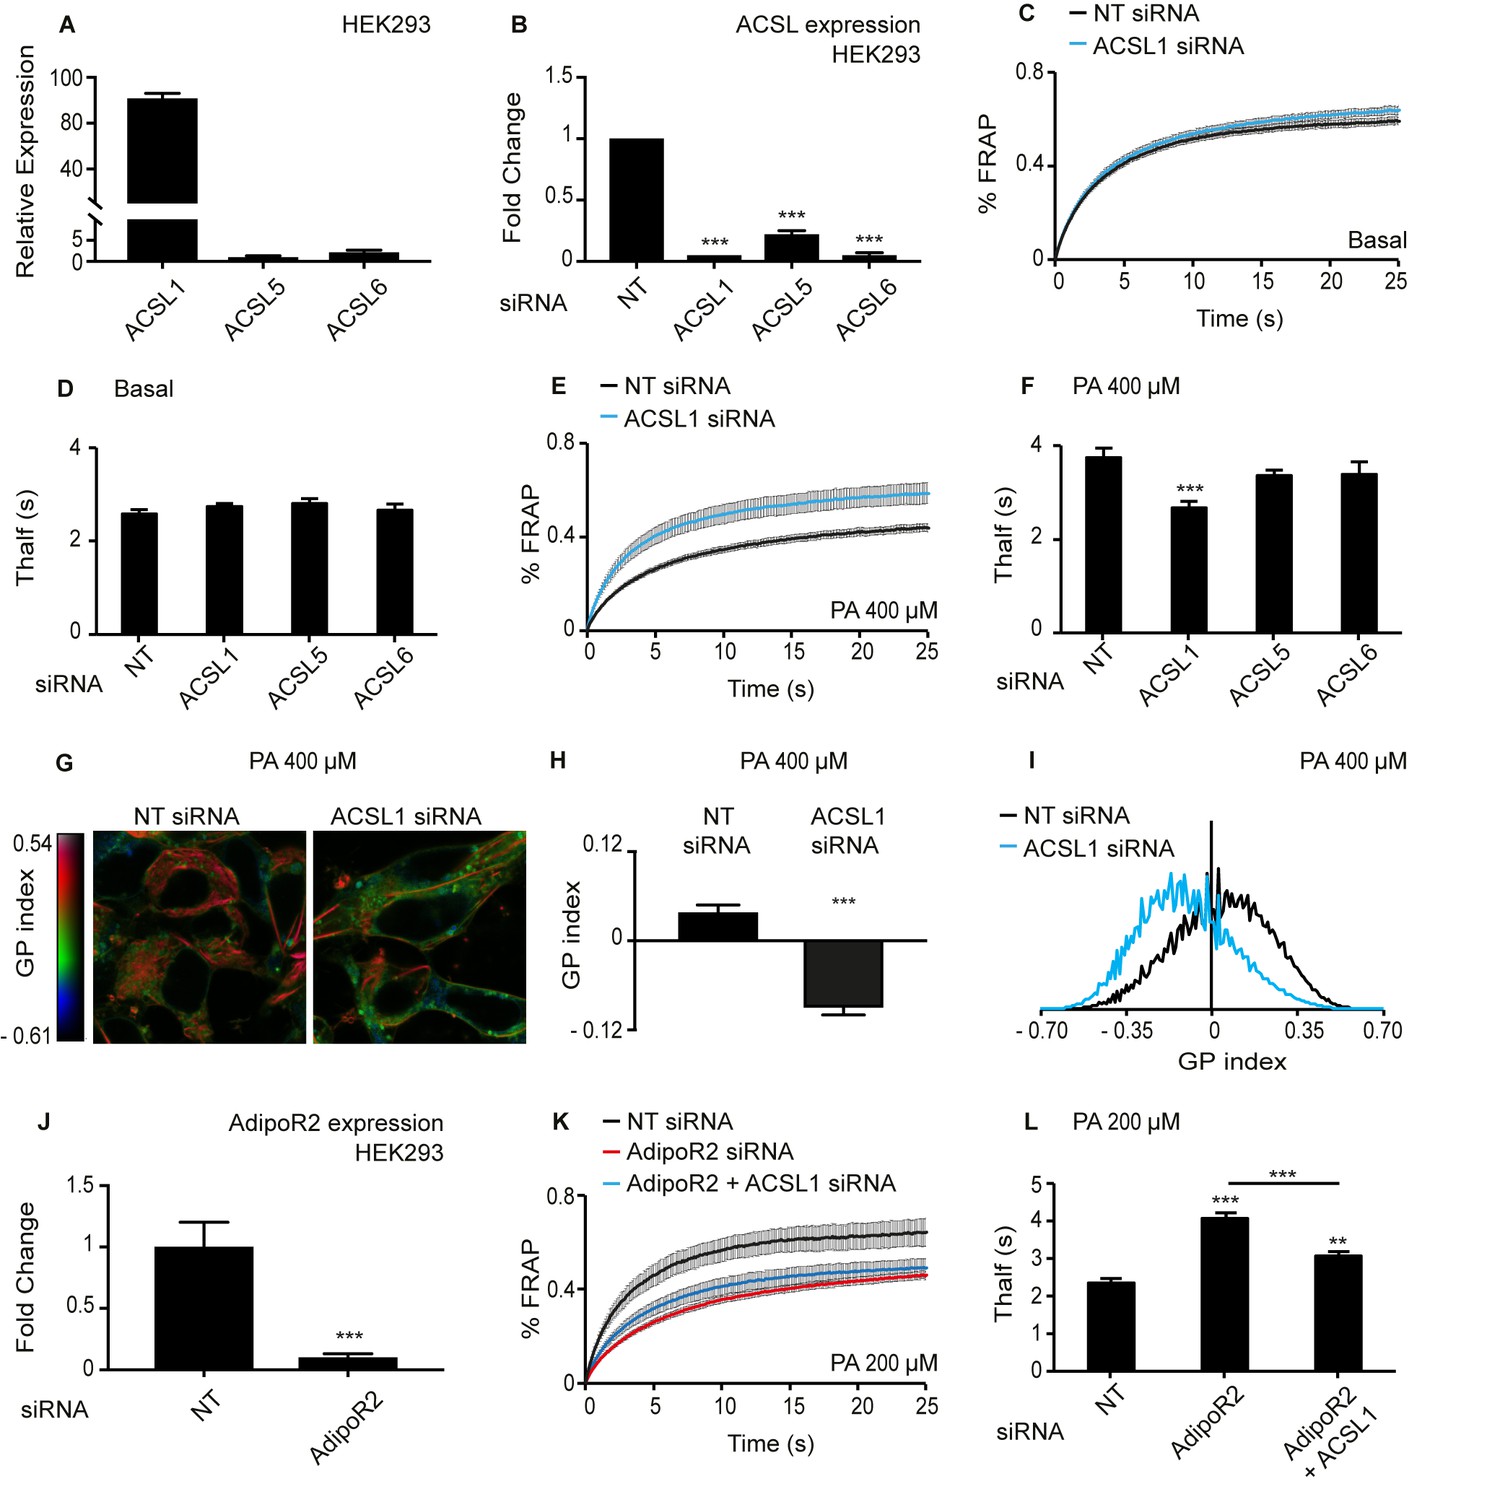
Knockdown of ACSL1 protects human HEK293 cells against the membrane-rigidifying effects of palmitate/AdipoR2 knockdown.
(A) Relative expression levels of ACSL1, ACSL5 and ACSL6 in HEK293 cells as determined using qPCR. (B) Efficiency of ACSL1, ACSL5 and ACSL6 knockdown using siRNA relative to a non-target (NT) siRNA treatment in HEK293 cells. (C) FRAP analysis showing that siRNA against ACSL1 does not cause a change in membrane fluidity of HEK293 cells under basal conditions compared to NT siRNA treatment. (D) Thalf values from FRAP experiments with cells treated with the indicated siRNA and cultivated under basal conditions. None of the ACSL siRNA treatments differed significantly from the control NT siRNA; n ≥ 6. (E–F) As in C-D but in the presence of 400 μM palmitate (PA). Note that ACSL1 siRNA prevented membrane rigidification by palmitate, as evidenced by the significantly lowered Thalf; n ≥ 10 in F. (G) Pseudocolor images showing Laurdan dye global polarization (GP) index at each pixel position in HEK293 cells treated with NT or ACSL1 siRNA and cultivated in the presence of 400 μM palmitate (PA) for 24 hr. (H) Average GP index from several images as in G; n = 15. (I) Distribution of GP index values in representative images for each treatment under basal condition. (J) Efficiency of AdipoR2 knockdown using siRNA relative to a control NT siRNA treatment in HEK293 cells. (K) FRAP analysis showing that AdipoR2 siRNA causes membrane rigidification in HEK293 cells cultivated in the presence of 200 μM PA and that ACSL1 siRNA prevents this rigidification. (L) Thalf values from FRAP experiments as in K; n ≥ 13. Statistically significant differences from control are indicated, where **: p<0.01 and ***: p<0.001.
Figure 5—figure supplement 1
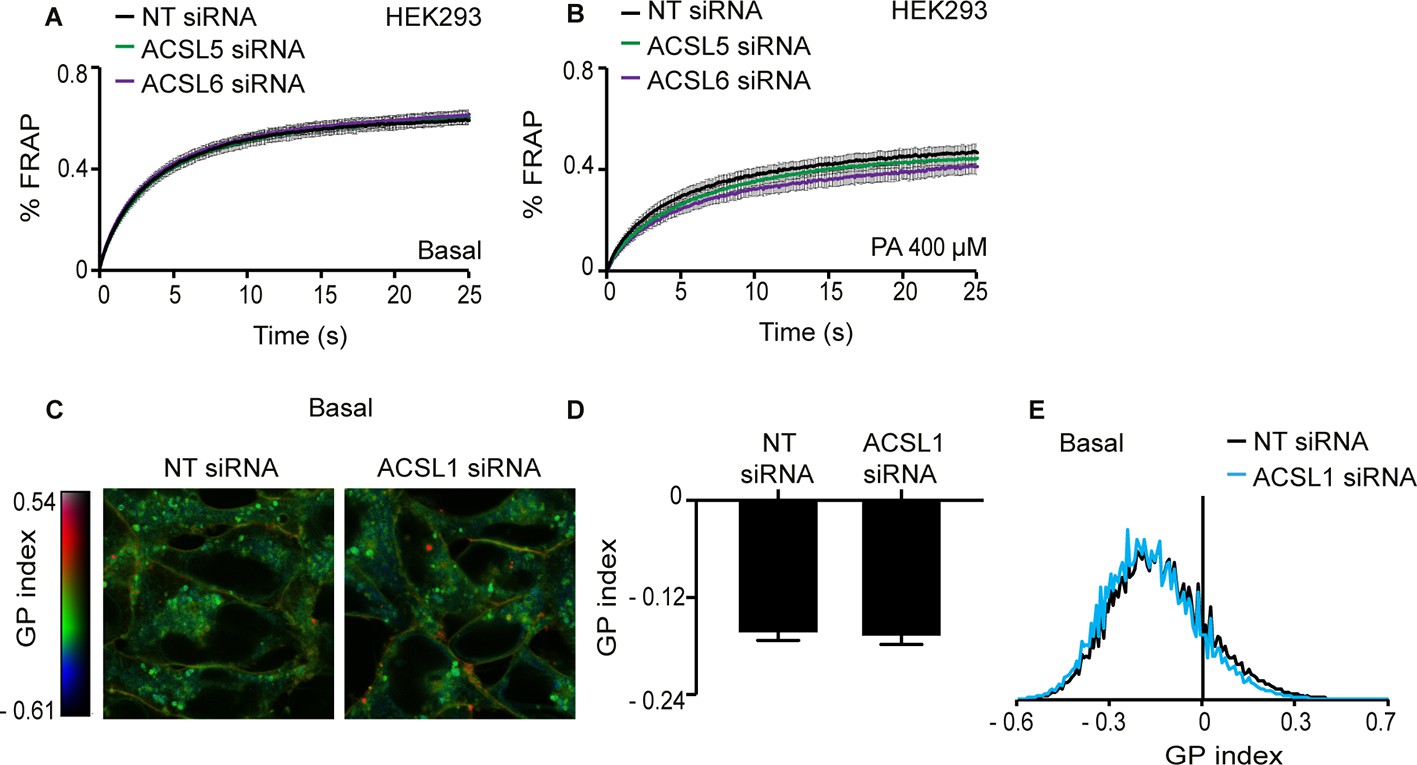
Silencing either ACSL5 or ACSL6 has no effect on the membrane fluidity of HEK293 cells.
(A–B) FRAP analysis showing that siRNA knockdown of ACSL5 or ACSL6 has no effect on membrane fluidity of HEK293 cells cultivated under basal conditions or in the presence of 400 μM palmitate (PA), respectively. (C) Pseudocolor images showing Laurdan dye global polarization (GP) index at each pixel position in HEK293 cells treated with non-target (NT) or ACSL1 siRNA under basal conditions. (D) Average GP index from several images as in C; n = 15. (E) Distribution of GP index values in representative images for each treatment under basal condition. There were no statistically significant differences between ACSL5/6 siRNA and controls.
Figure 5—figure supplement 2
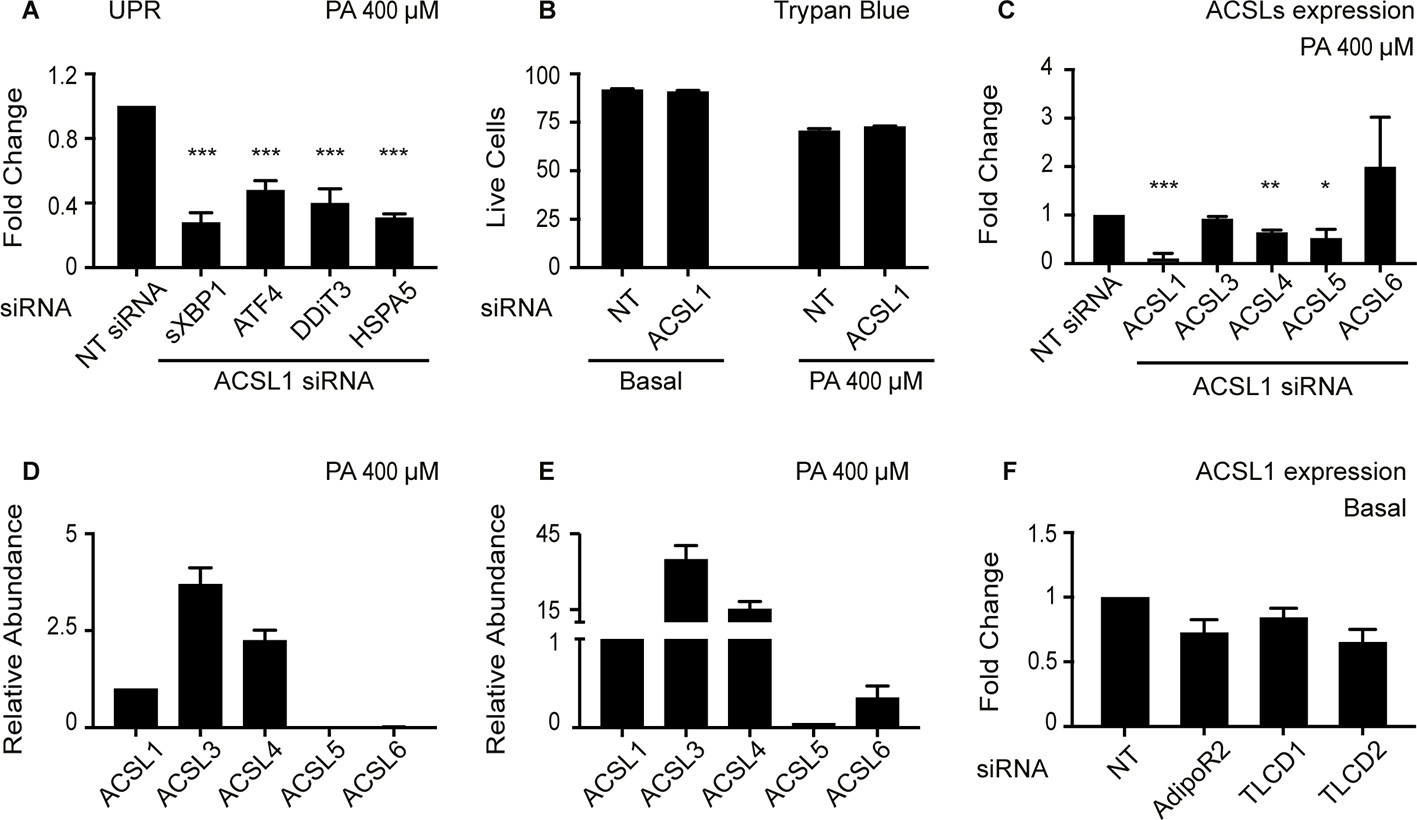
Effect of ACSL1 silencing on UPR activation, viability, and expression of other ACSLs.
(A) Relative expression levels measured using qPCR of several UPR markers in HEK293 cells challenged with 400 μM palmitate (PA) and treated with either non-target (NT) or ACSL1 siRNA. (B) Viability measured using the Trypan blue staining method of HEK293 cells in basal media or challenged with 400 μM PA and treated with either NT or ACSL1 siRNA. (C) Relative expression levels measured using qPCR of several ACSLs in HEK293 cells challenged with 400 μM PA and treated with either NT or ACSL1 siRNA. (D–E) Relative expression levels of ACSLs measured using qPCR in HEK293 cells cultivated in basal media and treated with either NT (D) or ACSL1 siRNA (E) against the indicated genes. (F) Change in ACSL1 expression levels in HEK293 cells cultivates din basal media and treated with siRNA against the indicated targets. Statistically significant differences of interest are indicated, where *: p<0.05, **: p<0.01 and ***: p<0.001.
Figure 6 with 2 supplements
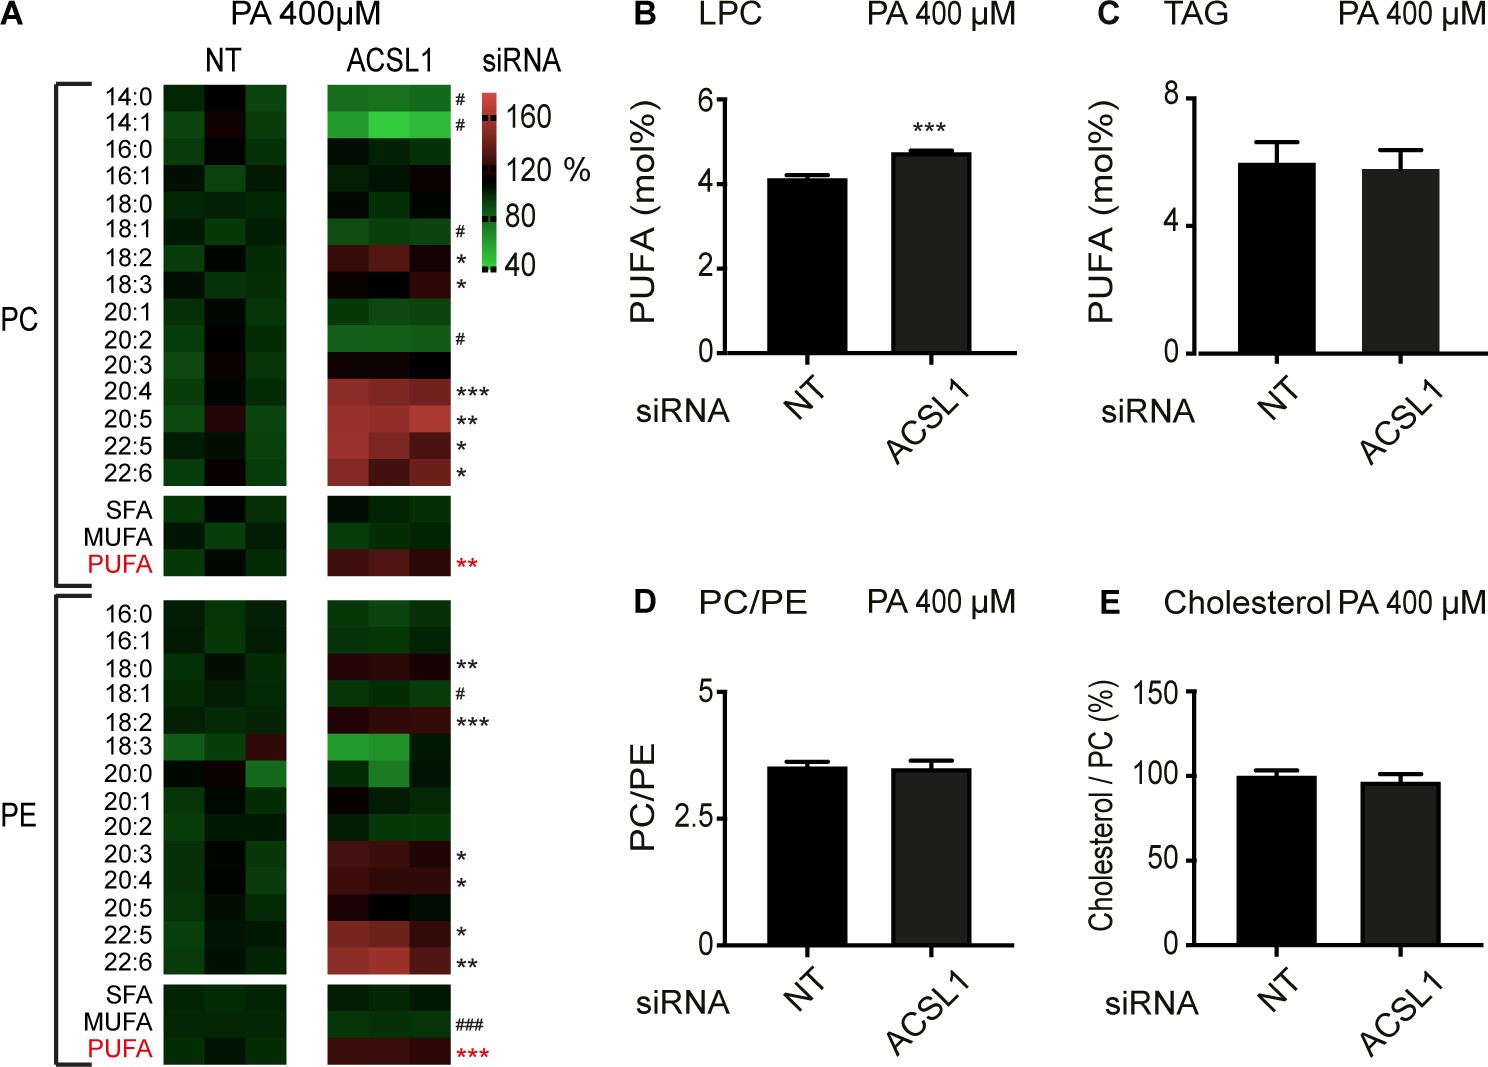
ACSL1 siRNA alters specifically membrane phospholipid composition in HEK293 cells challenged with palmitate.
(A) Heat maps showing the relative abundance of specific FA species among the PCs and PEs of HEK293 cells treated with non-target (NT) or ACSL1 siRNA and cultivated for 24 hr in 400 μM palmitate (PA). Note the increased abundance of PUFA species in the ACSL1 siRNA-treated cells. (B–C) Abundance of PUFAs among lysophosphatidylcholines (LPC) and TAGs of HEK293 cells treated with NT or ACSL1 siRNA. Note the increased PUFA levels in the LPCs but not TAGs of the ACSL1 siRNA-treated cells. (D–E) PC/PE ratio and abundance of free cholesterol relative to PCs in HEK293 cells treated with NT or ACSL1 siRNA. Statistical significances of interest are indicated, where *: p<0.05, **: p<0.01 and ***: p<0.001 for FAs with increased levels in the ACSL1 siRNA-treated cells (#, ## and ### are used when ACSL1 siRNA-treated cells have reduced levels of a FA).
-
Figure 6—source data 1
Lipidomics data for panels A and D.
- https://cdn.elifesciences.org/articles/47733/elife-47733-fig6-data1-v2.xlsx
-
Figure 6—source data 2
Lipidomics data for panel B.
- https://cdn.elifesciences.org/articles/47733/elife-47733-fig6-data2-v2.xlsx
-
Figure 6—source data 3
Lipidomics data for panel C.
- https://cdn.elifesciences.org/articles/47733/elife-47733-fig6-data3-v2.xlsx
-
Figure 6—source data 4
Lipidomics data for panel E.
- https://cdn.elifesciences.org/articles/47733/elife-47733-fig6-data4-v2.xlsx
Figure 6—figure supplement 1
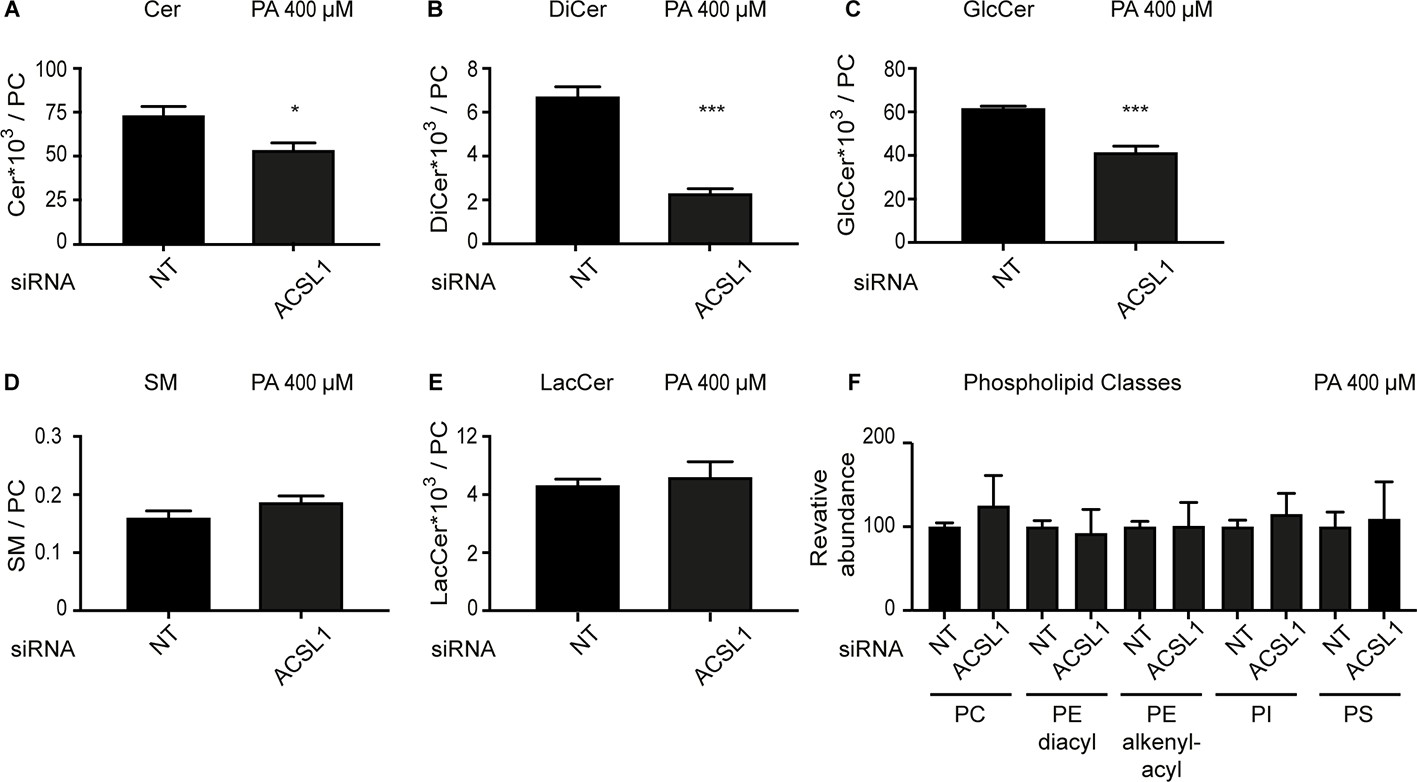
ACSL1 siRNA alters the levels of some sphingolipids in HEK293 cells challenged with palmitate.
(A–E) Abundance of the indicated sphingolipids relative to PCs in HEK293 cells treated with non-target (NT) or ACSL1 siRNA and challenged with 400 μM palmitate. Cer: ceramides; DiCer: dihydroxyceramides; GlcCer: glucosylceramides; SM: sphingomyelins; LacCer: lactosylceramides. (F) Relative abundance of several phospholipid classes between NT and ACSL1 siRNA-treated cells challenged with 400 μM palmitate; abbreviations are as in (A–E), with the addition of phosphatidylinositols (PI) and phosphatidylserines (PS). Statistically significant differences are indicated, where *: p<0.05 and ***: p<0.001.
-
Figure 6—figure supplement 1—source data 1
Lipidomics data for panels A to E.
- https://cdn.elifesciences.org/articles/47733/elife-47733-fig6-figsupp1-data1-v2.xlsx
-
Figure 6—figure supplement 1—source data 2
Lipidomics data for panel F.
- https://cdn.elifesciences.org/articles/47733/elife-47733-fig6-figsupp1-data2-v2.xlsx
Figure 6—figure supplement 2
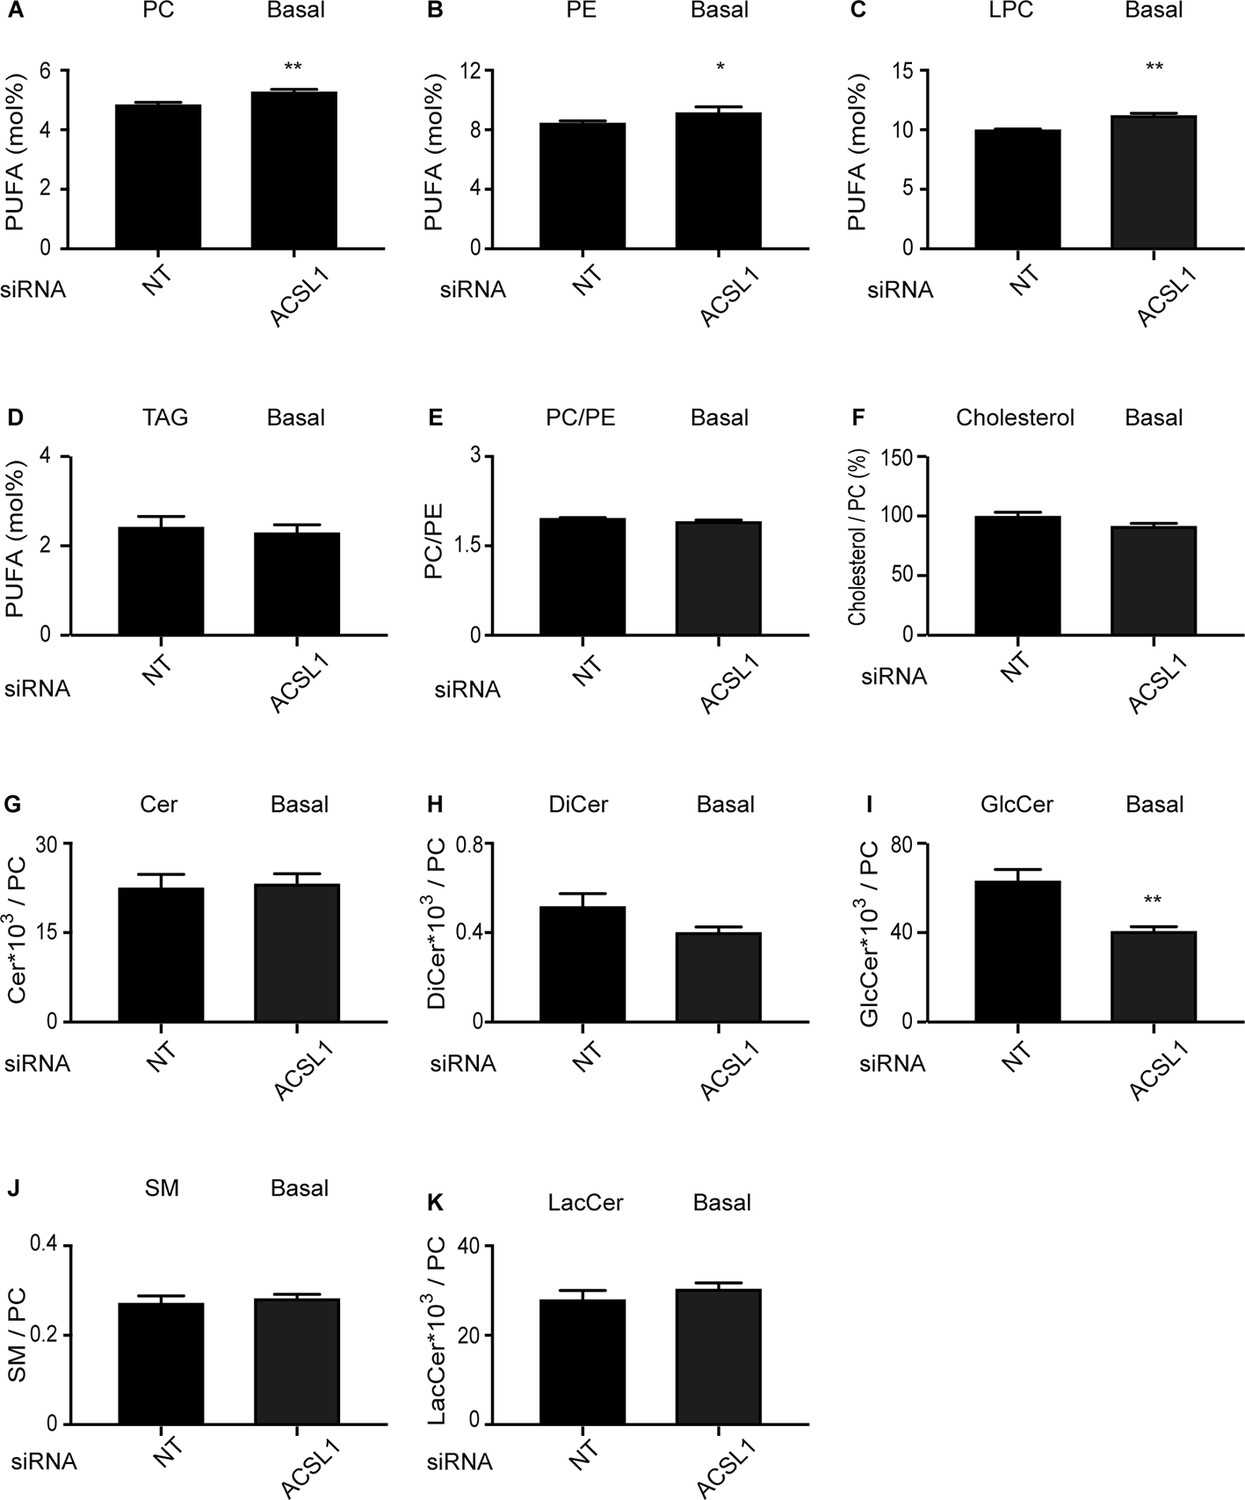
Effect of ACSL1 siRNA on the lipid composition of HEK293 cells cultivated under basal conditions.
(A–D) Abundance of PUFAs among PCs, PEs, LPCs and TAGs of HEK293 cells treated with non-target (NT) or ACSL1 siRNA. (E–F) PC/PE ratio and abundance of free cholesterol relative to PCs in HEK293 cells treated with non-target (NT) or ACSL1 siRNA. (G–K) Abundance of the indicated sphingolipids relative to PCs in HEK293 cells treated with non-target (NT) or ACSL1 siRNA. Cer: ceramides; DiCer: dihydroxyceramides; GlcCer: glucosylceramides; SM: sphingomyelins; LacCer: lactosylceramides. Statistically significant differences from control are indicated, where *: p<0.05 and **: p<0.01.
-
Figure 6—figure supplement 2—source data 3
Lipidomics data for panels A, B and E.
- https://cdn.elifesciences.org/articles/47733/elife-47733-fig6-figsupp2-data3-v2.xlsx
-
Figure 6—figure supplement 2—source data 4
Lipidomics data for panel C.
- https://cdn.elifesciences.org/articles/47733/elife-47733-fig6-figsupp2-data4-v2.xlsx
-
Figure 6—figure supplement 2—source data 5
Lipidomics data for panel D.
- https://cdn.elifesciences.org/articles/47733/elife-47733-fig6-figsupp2-data5-v2.xlsx
-
Figure 6—figure supplement 2—source data 6
Lipidomics data for panel F.
- https://cdn.elifesciences.org/articles/47733/elife-47733-fig6-figsupp2-data6-v2.xlsx
-
Figure 6—figure supplement 2—source data 7
Lipidomics data for panel G to K.
- https://cdn.elifesciences.org/articles/47733/elife-47733-fig6-figsupp2-data7-v2.xlsx
Figure 7 with 1 supplement
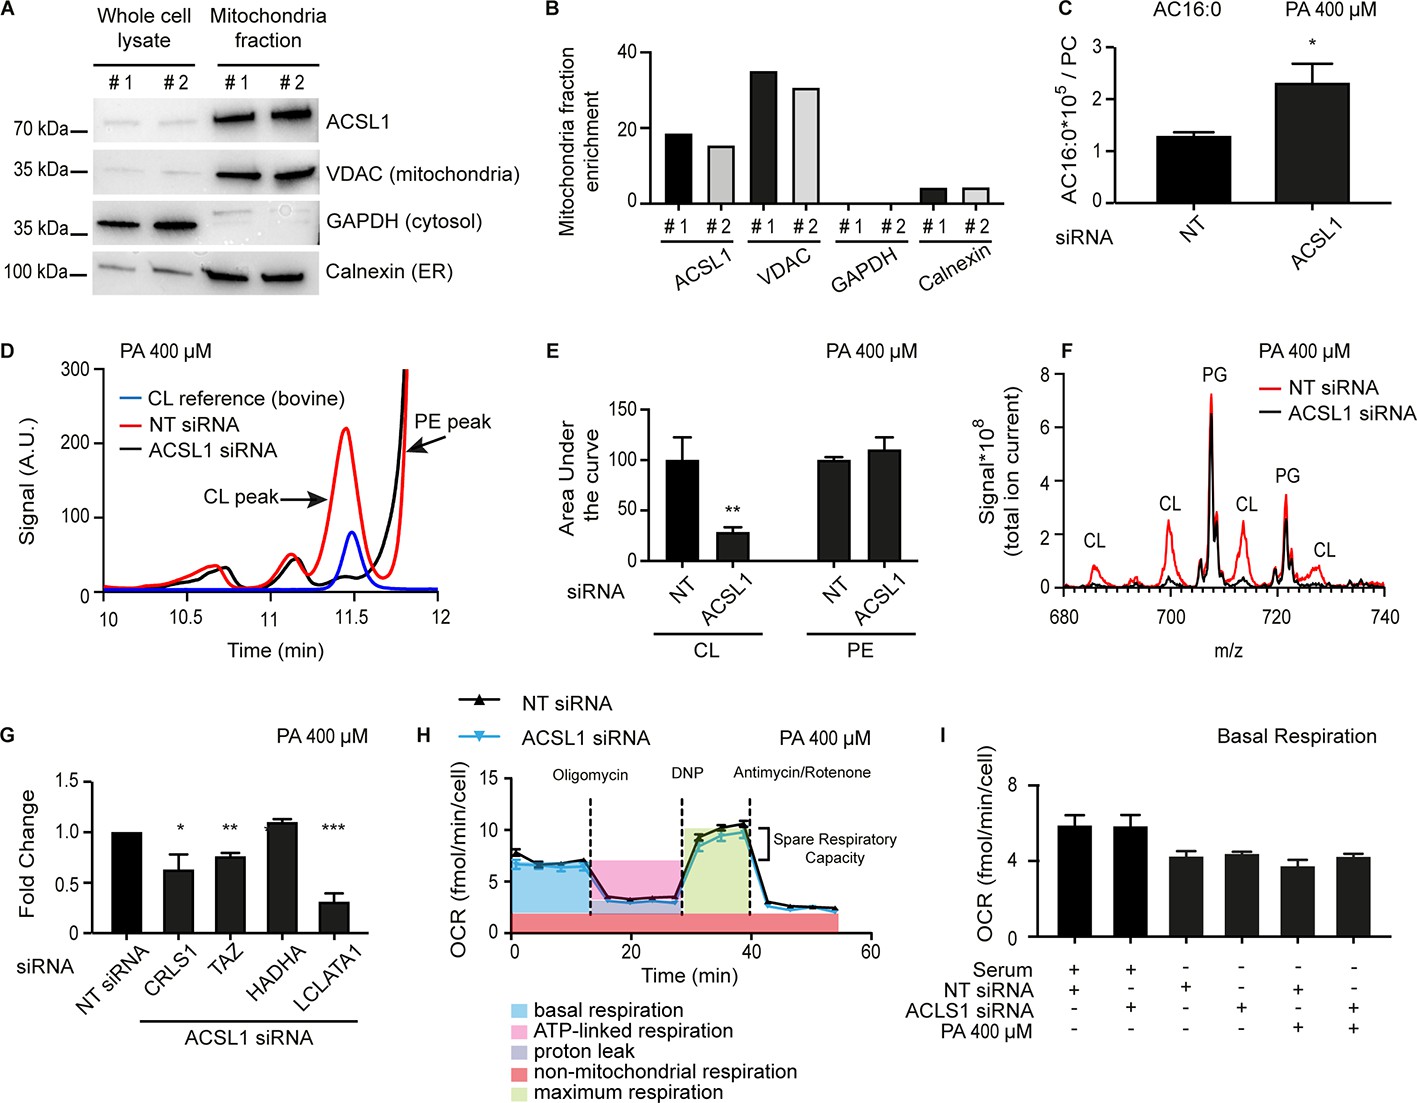
ACSL1 is enriched on mitochondria and its deficiency alters acyl-carnitine and cardiolipin levels.
(A) Western blot showing that ACSL1 is enriched in the mitochondrial fraction purified from HEK293 cells. The VDAC, GAPDH and Calnexin proteins were also detected as markers of mitochondria, cytosol and ER, respectively. (B) Quantification of the blot in A. (C) Levels of palmitoylcarnitine (AC16:0) relative to total PCs in HEK293 cells treated with non-target (NT) or ACSL1 siRNA and challenged with 400 μM palmitate (PA) for 24 hr. (D) HPLC chromatogram for HEK293 cells treated with NT or ACSL1 siRNA. Note that the HPLC peak containing cardiolipins (CLs) is dramatically reduced in the ACSL1 siRNA-treated cells challenged with PA. (E) Quantification of the CL and PE peaks from triplicate experiments as in (D). (F) Mass spectrum confirming that CLs are the dominant species depleted in the peak labelled as ‘CL’ in ACSL1 siRNA-treated cells in (D); levels of phosphatidylglycerols (PGs) were unchanged. (G) Changes in the expression of the indicated CL synthesis/remodelling genes in ACSL1 siRNA-treated HEK293 cells challenged with PA. (H) Example of a Seahorse analysis measuring oxygen consumption rates in in HEK293 cells treated with NT or ACSL1 siRNA and cultivated in the presence of PA. (I) Basal respiration in HEK293 cells pre-treated with the indicated conditions prior to the Seahorse analysis. All PA treatments used 400 μM for 24 hr. Statistically significant differences from control are indicated, where *:p<0.05; **: p<0.01 and ***: p<0.001.
-
Figure 7—source data 1
Lipidomics data for panel C.
- https://cdn.elifesciences.org/articles/47733/elife-47733-fig7-data1-v2.xlsx
Figure 7—figure supplement 1
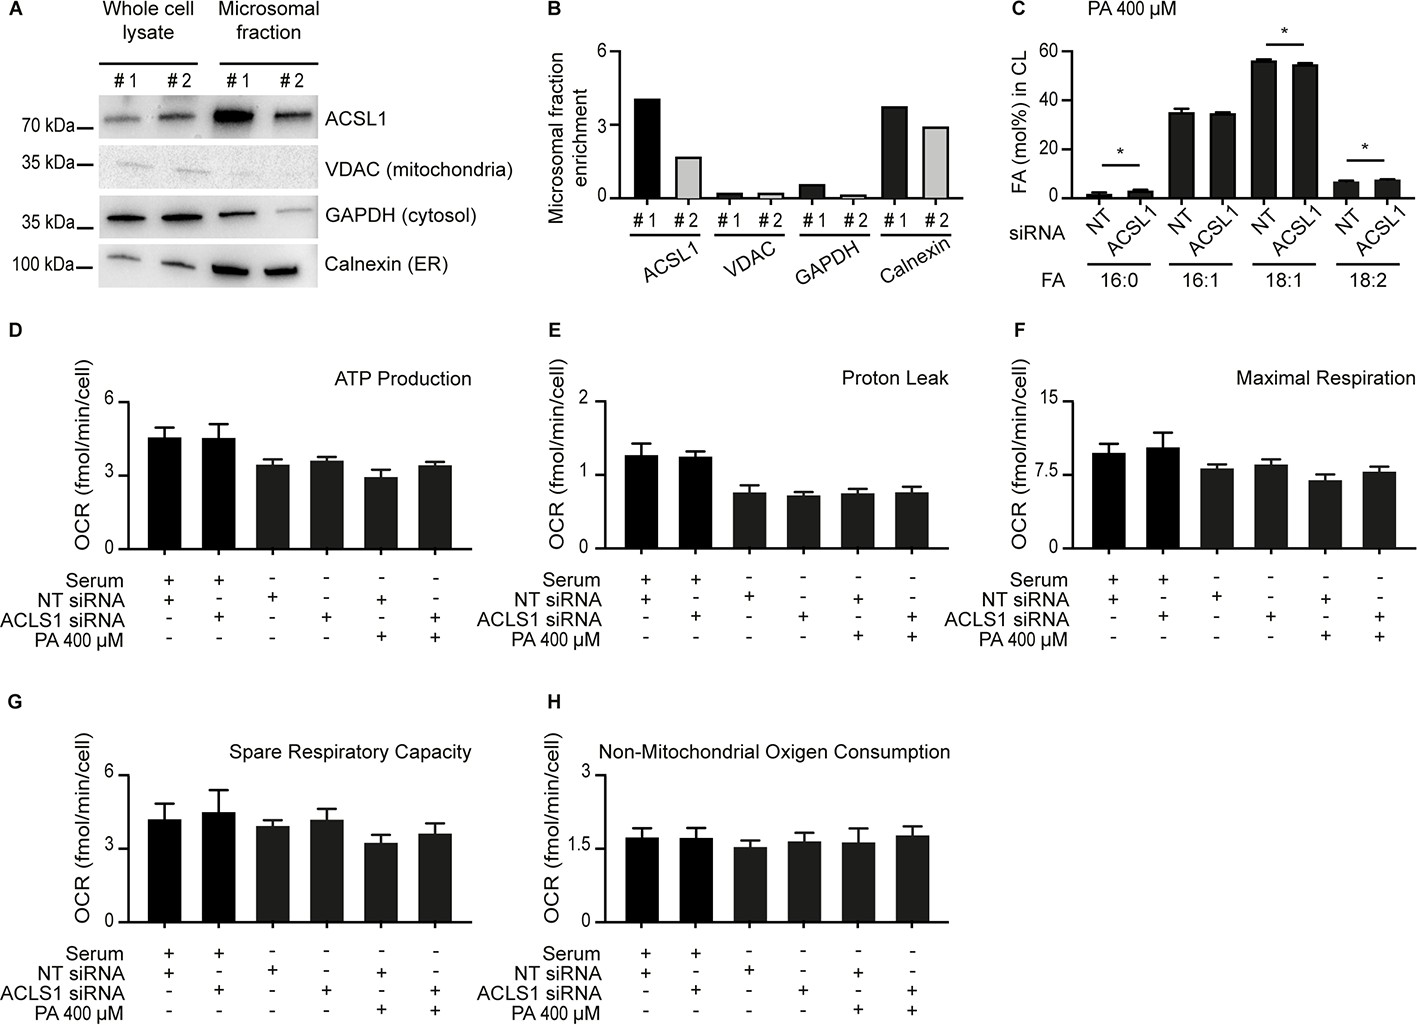
Some ACSL1 is enriched in the microsomal fraction and evidence that mitochondria respiration is still functional when ACSL1 is silenced.
(A) Western blot showing that ACSL1 is slightly enriched in the microsomal fraction purified from HEK293 cells. The VDAC, GAPDH and Calnexin proteins were also detected as markers of mitochondria, cytosol and ER, respectively. (B) Quantification of the blot in A. (C) Abundance of different FAs among CLs in HEK293 treated with non-target (NT) or ACSL1 siRNA. (D–H) Respiration parameters in HEK293 cells pre-treated with the indicated conditions prior to the Seahorse analysis. All PA treatments used 400 μM for 24 hr. Statistically significant differences from control are indicated, where *: p<0.05.
-
Figure 7—figure supplement 1—source data 1
Lipidomics data for panel C.
- https://cdn.elifesciences.org/articles/47733/elife-47733-fig7-figsupp1-data1-v2.xlsx
Figure 8
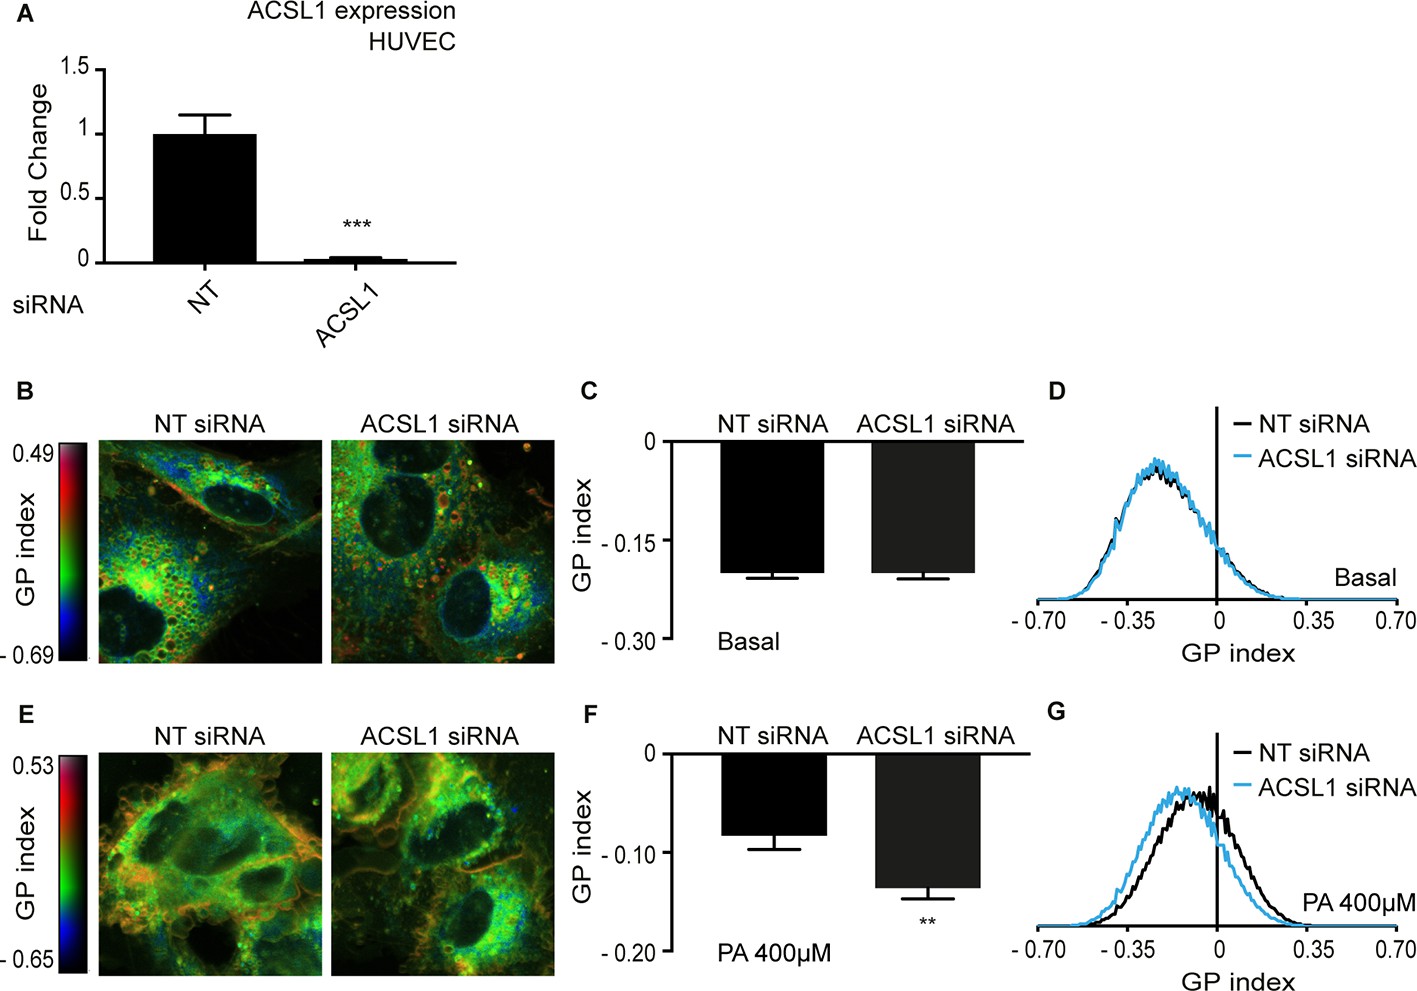
Knockdown of ACSL1 protects human primary endothelial cells against palmitate toxicity.
(A) Efficiency of ACSL1 knockdown using siRNA relative to a non-target (NT) siRNA treatment in HUVEC. (B) Pseudocolor images showing Laurdan dye global polarization (GP) index at each pixel position in HUVEC cells treated with NT or ACSL1 siRNA under basal conditions. (C) Average GP index from several images as in A; n = 10. (D) Distribution of GP index values in representative images for each treatment under basal condition. (E–G) As in A-C but with HUVEC cells cultivated in the presence of 400 μM palmitate (PA); n = 15 in E. Statistically significant differences from control are indicated, where **: p<0.01 and ***:p<0.001.
Figure 9 with 1 supplement
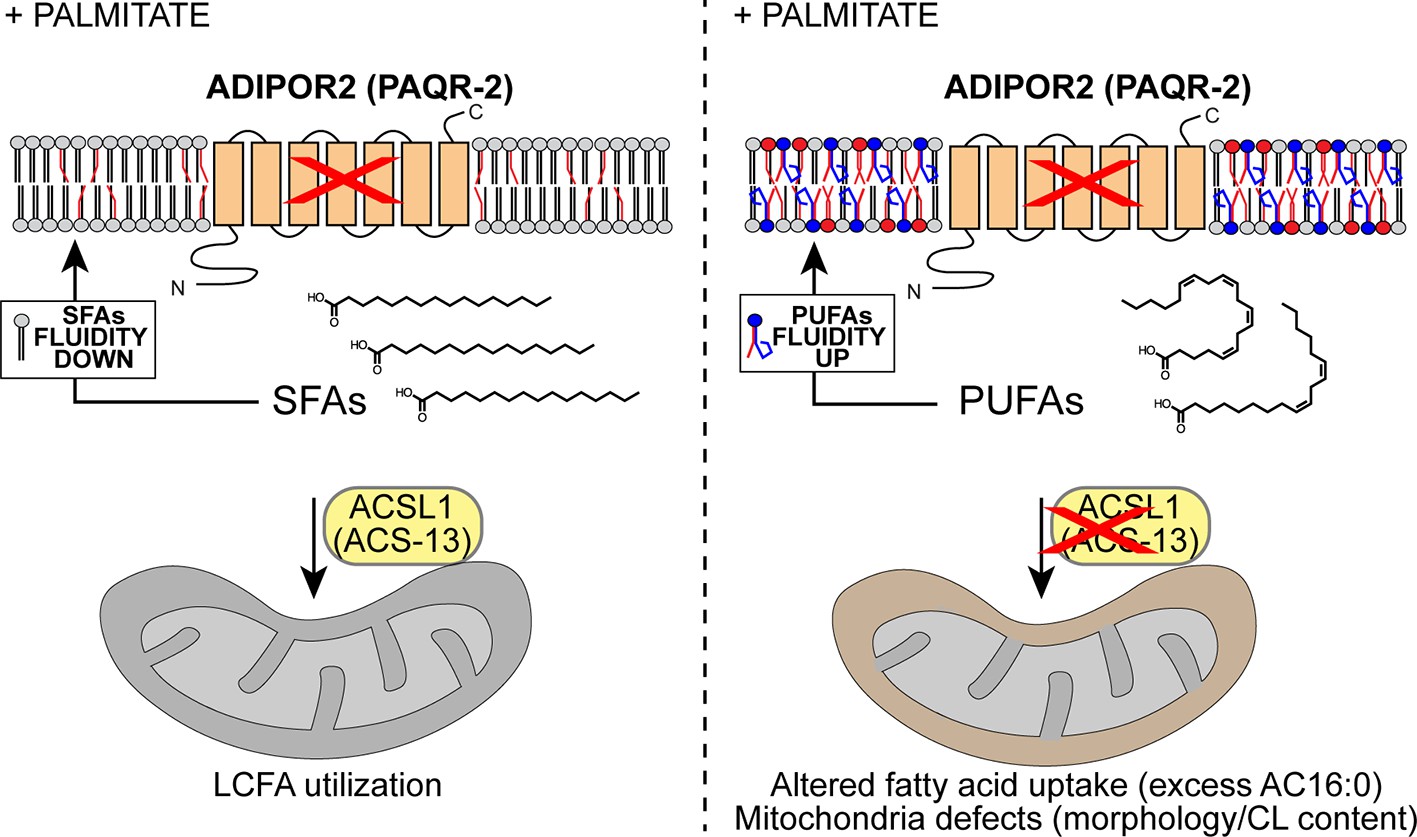
Model explaining the membrane-fluidizing effect of decreased/loss of ACSL1/ACS-13.
The normal function of ADIPOR2 (PAQR-2 in C. elegans) is to monitor and maintain membrane fluidity: it is activated by membrane rigidification and thereby signals to promote fatty acid desaturation and insertion of fluidizing UFAs in phospholipids. When ADIPOR2 is absent, exogenous SFAs become incorporated into the plasma membrane and cause rigidification. When present in mitochondria ACSL1 (ACS-13 in C. elegans) help channel LCFAs (including UFAs and PUFAs) into mitochondria. When ACSL1 is absent, fewer/different LCFAs are channelled into mitochondria. This results in mitochondria defects but also increased availability of LCFAs (including UFAs and PUFAs) to be channelled towards other processes, such as phospholipid remodelling that results in improved membrane fluidity.
Figure 9—figure supplement 1
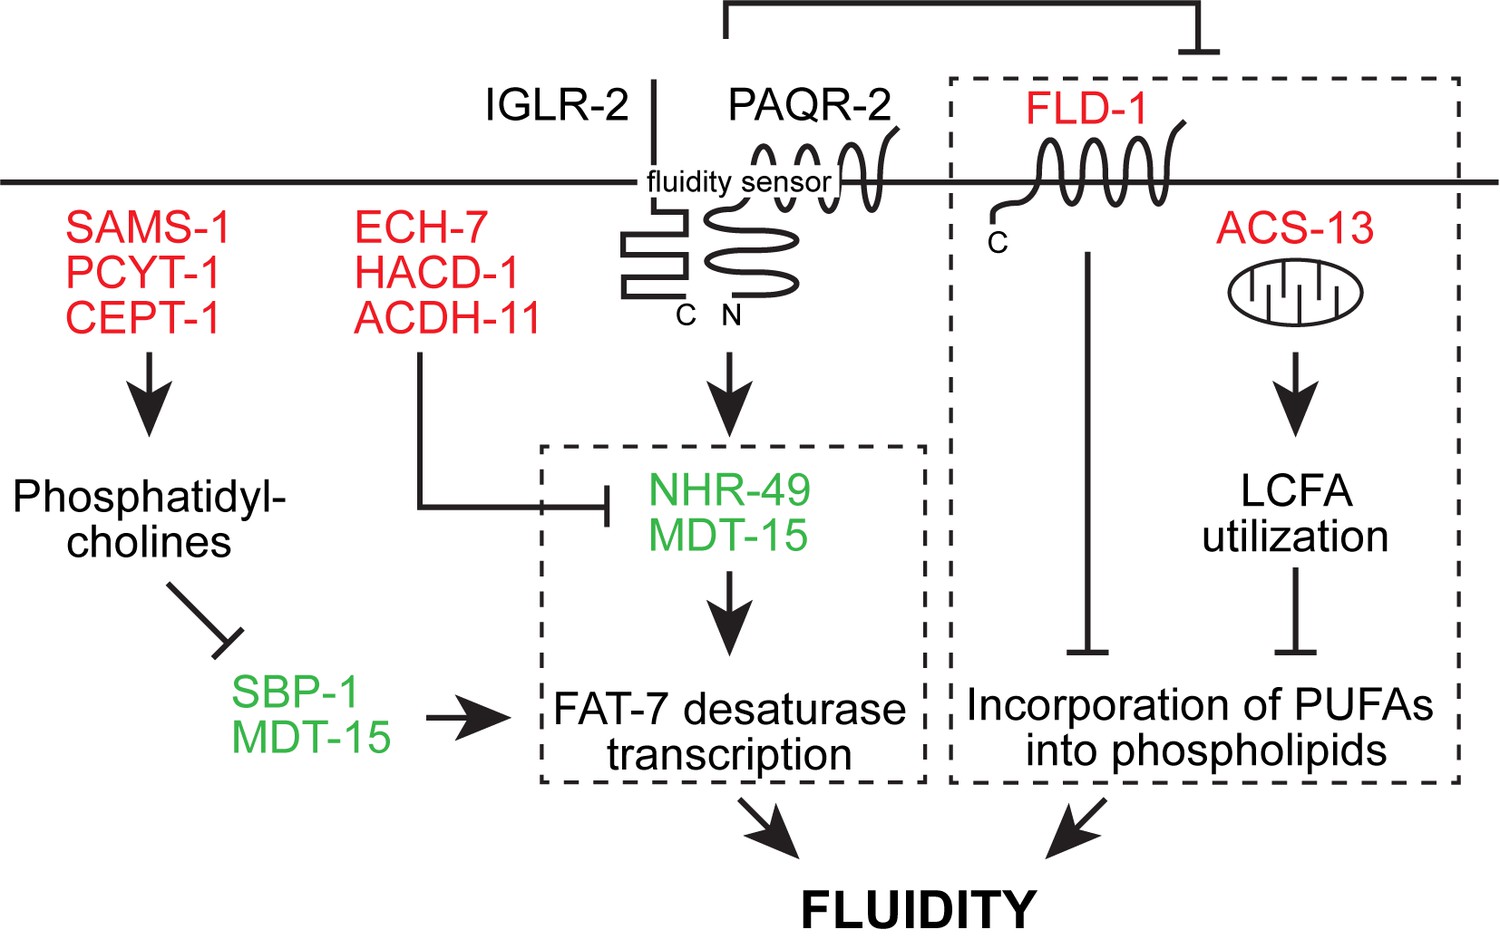
Revised model of the likely epigenetic interactions in the paqr-2 pathway based on previously published work and the present study.
Loss-of-function mutation in the red-colored proteins and gain-of-function mutations in the green-colored proteins act as paqr-2 mutant suppressors. Note that there are likely two separate fluidity-promoting outputs of PAQR-2 signaling (dashed boxes): one output promotes desaturase transcription while the other output regulates incorporation of PUFAs into phospholipids. Previous studies showed that many paqr-2 suppressor mutations act by promoting desaturase upregulation, either via either SBP-1::MDT-15 or NHR-49::MDT-15 (Svensk et al., 2013; Svensk et al., 2016a; Bodhicharla et al., 2018; Ruiz et al., 2018). Loss-of-function alleles of fld-1 (Ruiz et al., 2018) and or acs-13 (present work) have so far been identified as paqr-2 mutant suppressors that act as regulators of PUFA levels in phospholipids.
Tables
Key resources table
| Reagent type (species) or resource | Designation | Source or reference | Identifiers | Additional information |
|---|---|---|---|---|
| Strain, strain background (C. elegans) | N2 | C. elegans Genetics Center (CGC) | ||
| Strain, strain background (C. elegans) | HA1842 [rtIs30(pfat-7::GFP)] | Gift from Amy Walker; PMID: 22035958 | ||
| Strain, strain background (C. elegans) | PD4251 (ccIs4251 [(pSAK2) myo-3p::GFP::LacZ::NLS + (pSAK4) myo-3p::mitochondrial GFP + dpy-20(+)] I) | C. elegans Genetics Center (CGC); PMID: 9486653 | ||
| Strain, strain background (C. elegans) | ||||
| Strain, strain background (C. elegans) | ||||
| Genetic reagent (C. elegans) | paqr-2(tm3410) mdt-15(et14) | C. elegans Genetics Center (CGC); PMID: 24068966 | QC127 | |
| Genetic reagent (C. elegans) | acs-13(et54) | This paper | Will be deposited at CGC. | |
| Genetic reagent (C. elegans) | acs-13(ok2861) | C. elegans Genetics Center (CGC); PMID: 23173093 | RB2147 | |
| Genetic reagent (C. elegans) | cept-1(et10) | C. elegans Genetics Center (CGC); PMID: 24068966 | QC123 | |
| Genetic reagent (C. elegans) | paqr-2(tm3410) | C. elegans Genetics Center (CGC); PMID: 21712952 | QC129 | |
| Genetic reagent (C. elegans) | nhr-49(et8) | C. elegans Genetics Center (CGC); PMID: 24068966 | QC121 | |
| Genetic reagent (C. elegans) | hacd-1(et12) | C. elegans Genetics Center (CGC); PMID: 24068966 | QC125 | |
| Genetic reagent (C. elegans) | svIs136 [pVB641OB (Pvha-6::mCh::SP12)] | Gift from Gautam Kao (Univ Gothenburg) | ||
| Genetic reagent (E. coli strain HT115) | L4440; acs-1; acs-2; acs-4; acs-5; acs-7; acs-9; acs-11; acs-12; acs-15; acs-16; acs-17; acs-18; acs-19; acs-20; acs-21; acs-22 | PMID: 12529635 | The RNAi clones are available within the ‘C. elegans RNAi collection (Ahringer)’ distributed by Source Bioscience Limited. | |
| Cell line (Homo sapiens) | HEK293 | ATCC | CRL-1573 | |
| Biological sample (Homo sapiens) | HUVEC | Gibco | C-015–5C | Human umbilical vein endothelial cells |
| Antibody | Mouse anti-GFP monoclonal antibody (GF28R) | Invitrogen | MA5-15256 | |
| Antibody | Mouse anti-tubulin monoclonal antibody | Sigma | T5168 | |
| Antibody | Goat HRP-conjugated anti-mouse IgG antibody | Dako | P0447 | |
| Antibody | rabbit anti-ACSL1 monoclonal antibody | Cell Signaling | D2H5 | |
| Antibody | rabbit anti-Calnexin monoclonal antibody | Cell Signaling | C5C9 | |
| Antibody | rabbit anti-GAPDH monoclonal antibody | Cell Signaling | 14C10 | |
| Antibody | rabbit anti-VDAC monoclonal antibody | Cell Signaling | D73D12 | |
| Antibody | HRP-conjugated anti-rabbit IgG antibody | Dako | P0399 | |
| Recombinant DNA reagent | pPD118.33 | Gift from Andre Fire | RRID:Addgene_1596 | |
| Recombinant DNA reagent | pPD95.77 | Gift from Andre Fire | RRID:Addgene_1495 | |
| Recombinant DNA reagent | Pacs-13::acs-13 | This paper | ||
| Recombinant DNA reagent | Pacs-13::ACS-13 isoform a::GFP | This paper | ||
| Recombinant DNA reagent | Pacs-13::GFP | This paper | ||
| Recombinant DNA reagent | pRF4 [rol-6(su1006)] | PMID: 1935914 | ||
| Sequence-based reagent | AdipoR2 siRNA | Dharmacon | J-007801–10 | |
| Sequence-based reagent | NT siRNA | Dharmacon | D-001810–10 | Non-target control |
| Sequence-based reagent | ACSL1 siRNA | Dharmacon | J-011654–06 | |
| Sequence-based reagent | ACSL5 siRNA | Dharmacon | J-006327–09 | |
| Sequence-based reagent | ACSL6 siRNA | Dharmacon | J-007748–05 | |
| Peptide, recombinant protein | Recombinant Cas9 protein | Dharmacon | CAS11200 | |
| Peptide, recombinant protein | Bovine Serum Albumin (fatty acid free) | Sigma | A8806 | |
| Peptide, recombinant protein | Bovine Serum Albumin | Sigma | A7906 | |
| Commercial assay or kit | RNeasy Plus Kit | Qiagen | 74134 | |
| Commercial assay or kit | Qproteome mitochondria isolation kit | Qiagen | 37612 | |
| Commercial assay or kit | Pierce BCA Protein Assay Kit | ThermoScientific | 23227 | |
| Commercial assay or kit | RevertAid H Minus First Strand cDNA Synthesis Kit | ThermoScientific | K1631 | |
| Commercial assay or kit | HOT FIREPol EvaGreen qPCR Supermix | Solis Biodyne | 08-36-00001 | |
| Commercial assay or kit | Viromer Blue | Lipocalyx | VB-01LB-01 | |
| Commercial assay or kit | Gibson assembly cloning kit | NEB | E5510S | |
| Commercial assay or kit | Enhanced chemiluminescence detection kit | Millipore | WBKLS0100 | |
| Commercial assay or kit | Lipofectamine RNAiMAX | Invitrogen | 13778100 | |
| Chemical compound, drug | BODIPT 500/510 C1, C12 | Invitrogen | D3823 | |
| Chemical compound, drug | Laurdan | ThermoFisher | D2350 | |
| Chemical compound, drug | Palmitic acid | Sigma-Aldrich | P0500 | |
| Chemical compound, drug | Linoleic acid acid | Sigma-Aldrich | L1376 | |
| Chemical compound, drug | Viromer Blue | Lipocalyx | ||
| Chemical compound, drug | Mitotracker Deep Red FM | Invitrogen | M22426 | |
| Software, algorithm | ImageJ script: nprot.2011.419-S1 | PMID: 22157973 | ||
| Software, algorithm | LipidView software | Sciex | ||
| Software, algorithm | MassHunter software | Agilent Technologies | ||
| Software, algorithm | ZEN software | Zeiss |
Additional files
Download links
A two-part list of links to download the article, or parts of the article, in various formats.
Downloads (link to download the article as PDF)
Open citations (links to open the citations from this article in various online reference manager services)
Cite this article (links to download the citations from this article in formats compatible with various reference manager tools)
Evolutionarily conserved long-chain Acyl-CoA synthetases regulate membrane composition and fluidity
eLife 8:e47733.
https://doi.org/10.7554/eLife.47733


