An integrin/MFG-E8 shuttle loads HIV-1 viral-like particles onto follicular dendritic cells in mouse lymph node
- National Institutes of Allergy and Infectious Diseases, National Institutes of Health, United States
Figures
Figure 1 with 2 supplements
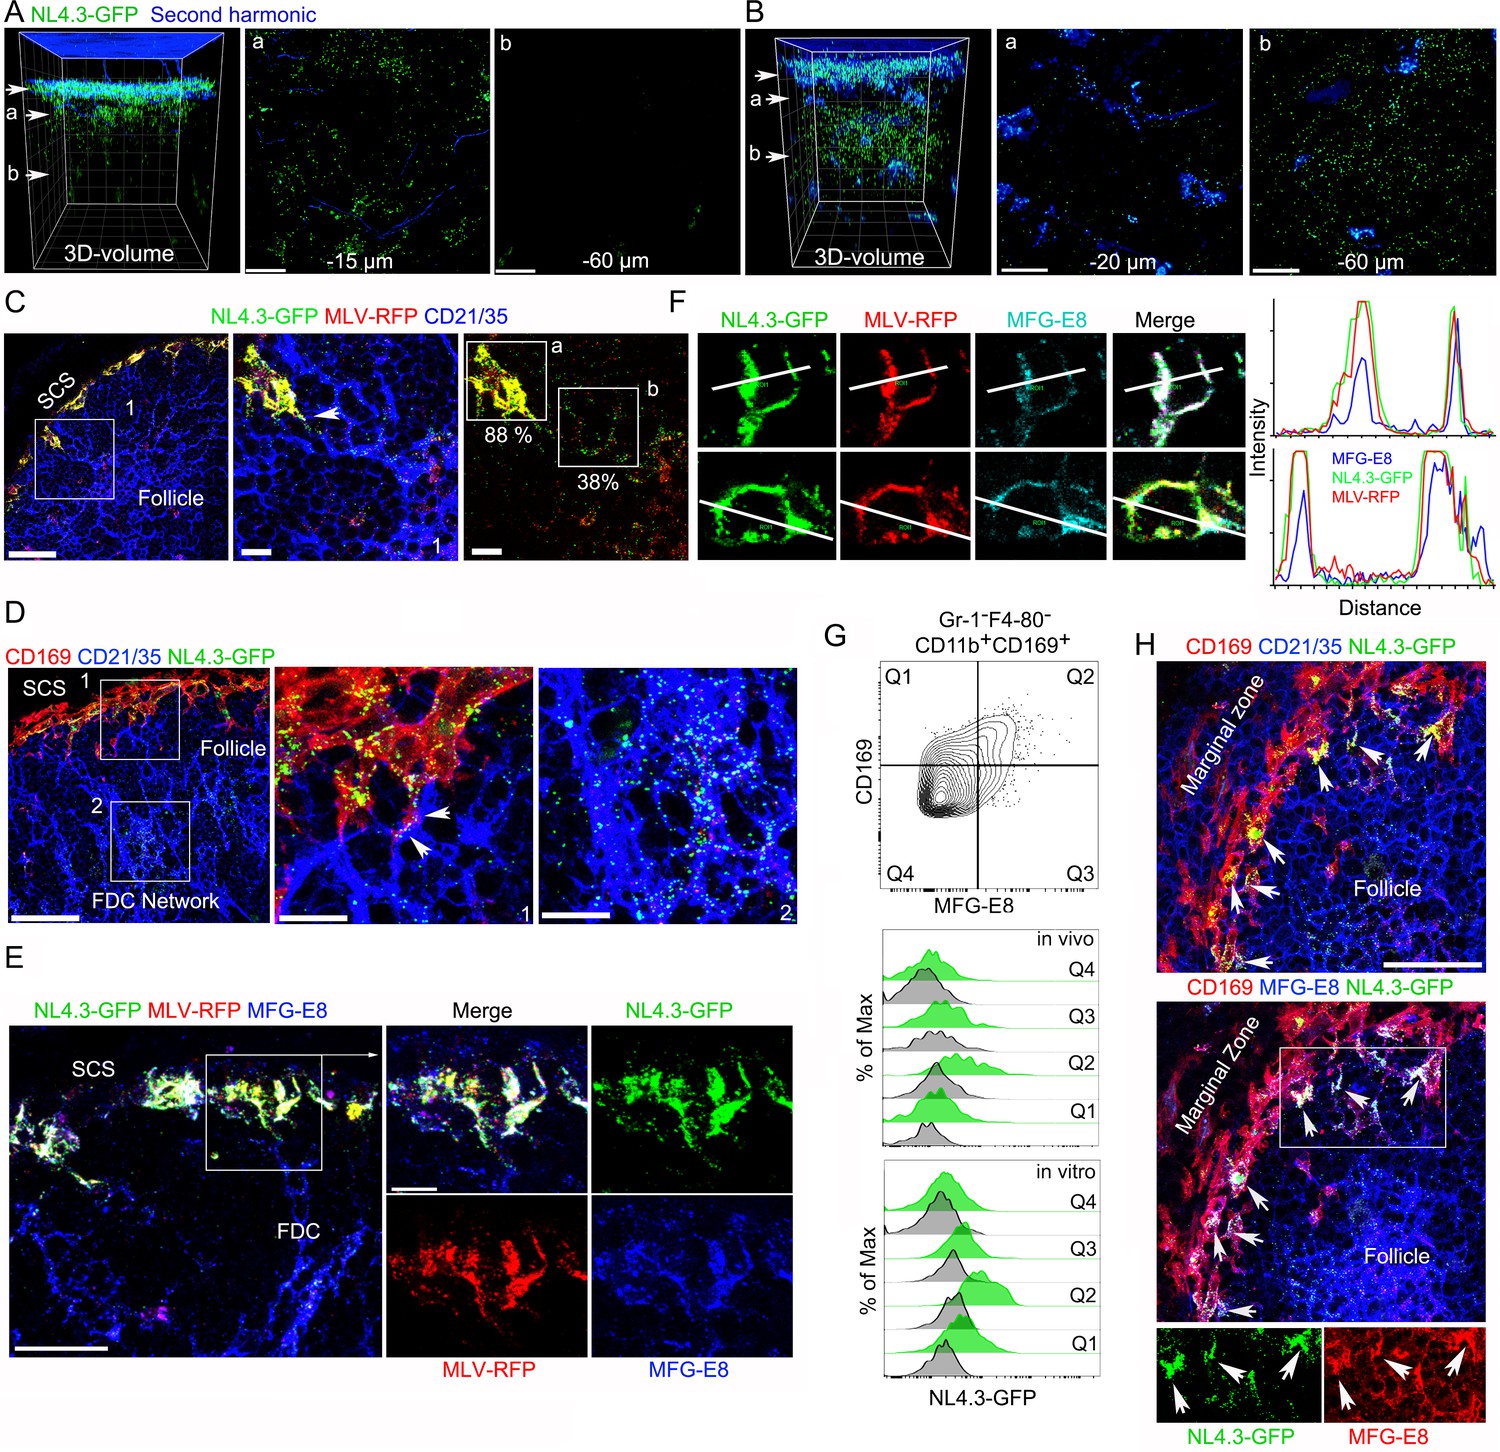
VLPs accumulated in MFG-E8+ compartment in SCSM and on the FDC network.
(A, B) LN TP-LSM thick volume micrographs of NL4.3-GFP (green) 6 hr (A) and 20 hr (B) post VLPs injection. LN structure visualized by second harmonic (blue) of capsule and sinus floor. In left panel the top arrow indicates the subcapsular sinus floor and arrow a and b the location of the cross-sectional 10 μm volume image shown in panels a and b. Distance from the sinus floor to indicated areas are shown. Grid spacing in volume images is 20 μm. Scale bars 20 μm. (C) LN confocal micrographs of NL4.3-GFP and MLV-RFP 3 hr post VLPs injection. Box 1 in first panel zoomed in 2nd and 3rd panels. Arrowhead in 2nd panel indicates a contact point between SCSM and FDC. Colocalization scores of NL4.3-GFP and MLV-RFP in SCSM and FDCs are noted. (D) LN confocal micrographs of NL4.3-GFP 8 hr after NL4.3-GFP injection. Boxes in upper panel zoomed in middle and lower panel. Middle panel arrowheads indicate abutment of SCSM and FDC. (E) Confocal micrographs of NL4.3-GFP and MLV-RFP in inguinal LN 3 hr post VLPs injection. FDC networks were visualized with FDC-M1 (MFG-E8) antibody. Box in left panel was electronically zoomed. (F) Two SCSMs were analyzed for the co-localization of NL4.3-GFP, MLV-RFP and MFG-E8. Region of interest (ROI) in each panel are indicated with white lines. Signal intensity in ROIs were plotted. (G) Flow cytometry of LN cells. Gr-1-F4-80-CD11b+CD169+ population from total LN cells was plotted with MFG-E8 versus CD169, which generated Q1, Q2, Q3, and Q4. Histograms show NL4.3-GFP signal (green) and background control (gray) of indicated populations. Upper, LN cells from NL4.3-GFP injected mice. Lower, purified LN cells incubated with NL4.3-GFP. (H) Spleen confocal micrographs of NL4.3-GFP 6 hr after intravenous VLP injection. Upper panel, FDC networks visualized with CD21/35 and lower panel, FDC networks visualized with MFG-E8 antibody. In bottom panels are shown separated pseudo-colored signals of boxed area in lower panel. NL4.3-GFP (green, left) and MFG-E8 (red, right). Arrows indicate MFG-E8+ compartment. Scale bars 30 μm and 10 μm (A, B, E), 50 μm (F).
Figure 1—figure supplement 1

NL4.3-GFP rapidly localized on SCSMs that overlie the LN follicle rather than those over the interfollicular region.
(A) Tiled confocal micrographs of NL4.3-GFP in inguinal LN at 1 hr after injection. SCSMs covered B cell follicle visualized by CD169 (red) antibody injection 30 min before imaging. Left panel, follicular channels are located between B cell follicles. Right upper, NL4.3-GFP signal only. Right lower, CD169 signal only. (B) Tiled TP-LSM thick volume micrographs of NL4.3-GFP (green) and labeled gp120 (red) in inguinal LN. NL4.3-GFP and labeled gp120 simultaneously injected 1 hr before imaging. Collagen capsule of LN was visualized by 2nd harmonic signal (blue), left. Collagen and NL4.3-GFP signals, middle panel. Collagen and gp120 signals, right panel. Follicular top (F) and interfollicular channel (C) indicates microstructure of LN that overlie and divide the LN follicle. Medullary follicular junction indicates area between follicular top and medullar. (C) Tiled confocal micrographs of NL4.3-GFP in inguinal LN harvested at 1 hr after injection. Fixed LN section was stained with antibodies of SIGN-R1 (red) and CD11b (blue). Left panel, all signals merged. Middle panel, NL4.3-GFP signal only. Right panel, SIGN-R-1 and NL4.3-GFP signals. Follicular top and follicular channel were indicated by arrows. Scale bars 100 μm (A), 200 μm (B) and 100 μm (C).
Figure 1—figure supplement 2
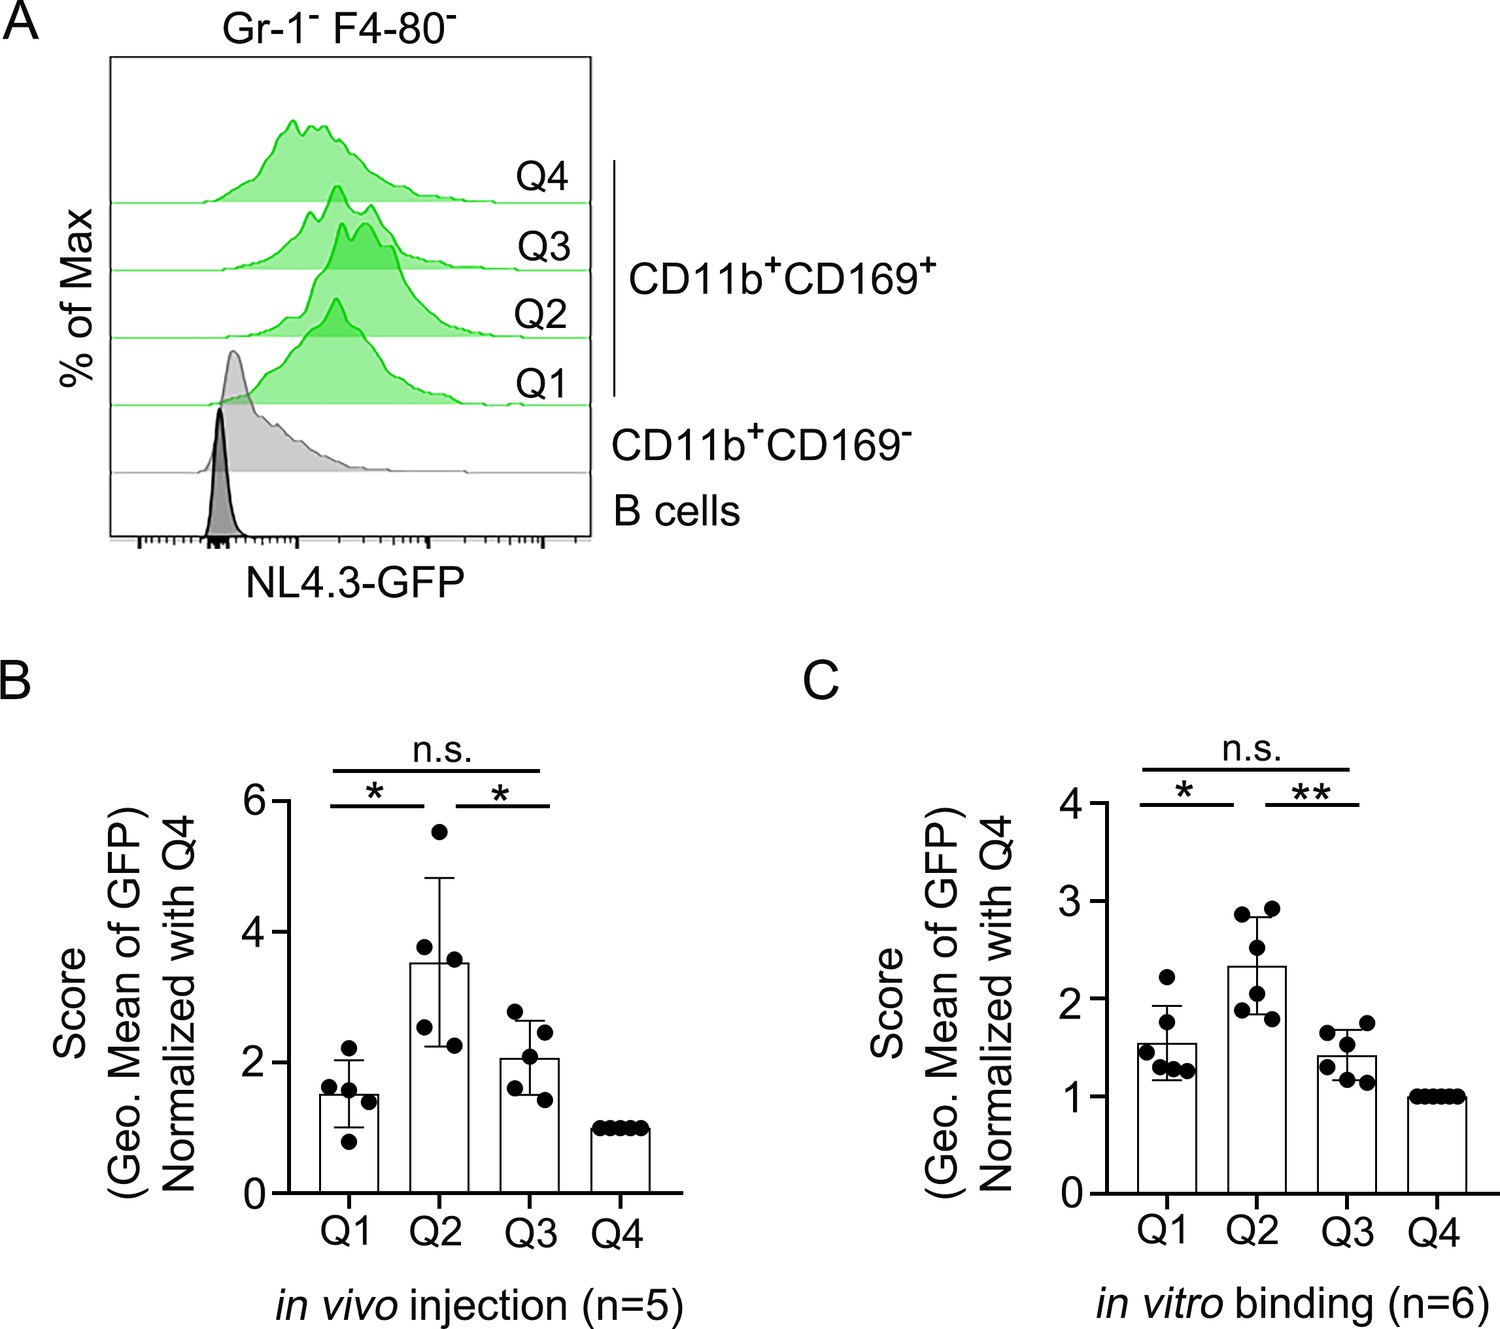
The lymph node MFG-E8+ SCSMs capture NL4.3-GFP VLPs.
(A) Histogram shows NL4.3-GFP signal (green) of indicated populations. GFP signal of CD11b+CD169- macrophages (gray) and B cells (dark gray) are shown for comparison. (B) Level of NL4.3-GFP signal of different populations are shown. The GFP signal strength was normalized to the Q4 population signal. LN cells obtained from 5 mice 3 hr after NL4.3-GFP injection stained and analyzed. (C) Purified LN cells from six different mice stained with surface markers after binding of NL4.3-GFP on ice for 30 min. *; p<0.1, **; p<0.01.
Figure 2 with 3 supplements
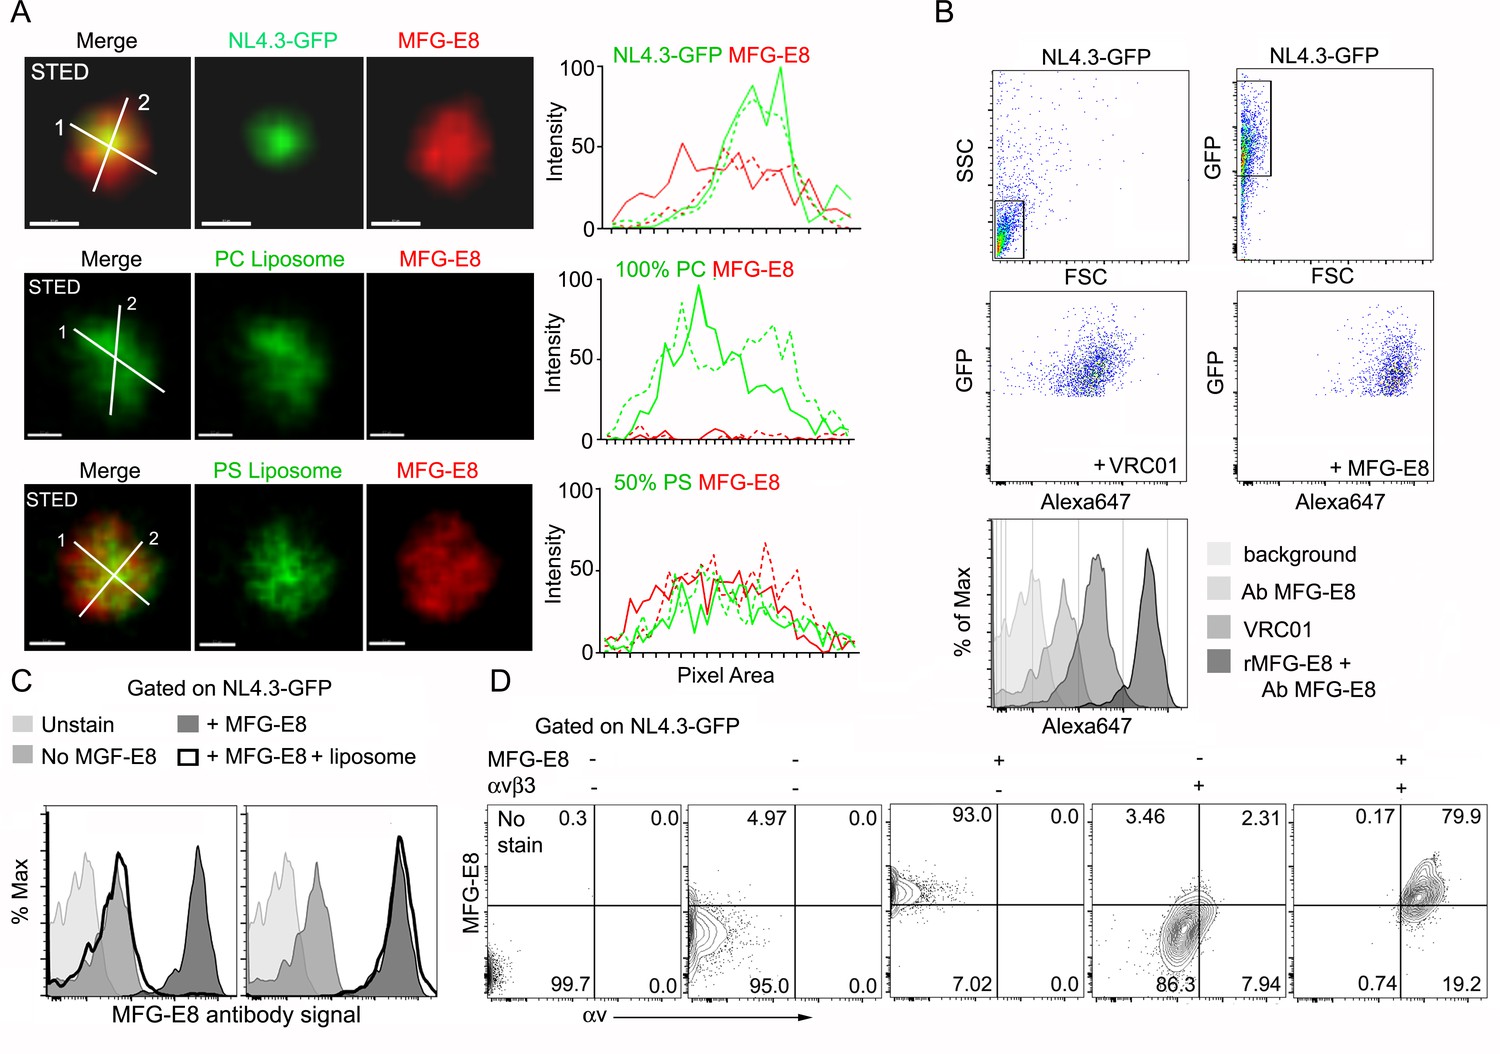
HIV-1 VLPs bind MFG-E8, which can interact with αvβ3 integrins.
(A) STED microscopy images of HIV-1 VLP/MFG-E8 complex (top row), PC-liposome and bound MFG-E8 (middle row), and PS-liposome and bound MFG-E8 (bottom row). Corresponding graphs show signal intensities along axis 1(solid) and axis 2 (dotted line). Scale bars 100 nm. (B) Flow cytometry analyzing VRC01 and MFG-E8 binding NL4.3-GFP VLPs. FSC versus SSC shown in 1st panel. 1st panel boxed region used to analyze FSC versus GFP in 2nd panel. GFP versus Alexa 647-VRC01, 3rd panel; and Alexa 647-MFG-E8, 4th panel. NL4.3-GFP VLPs confirmed by VRC01 antibody staining and MFG-E8/NL4.3-GFP complexes detected by MFG-E8 antibody staining and flow cytometry. (C) Flow cytometry detects competitive inhibition of MFG-E8 binding NL4.3-GFP by PS-liposome (left), but not PC-liposome (right). (D) Flow cytometry detects MFG-E8/αvβ3 integrin/NL4.3 GFP complexes. Binding of recombinant proteins to NL4.3-GFP detected by αv and MFG-E8 antibodies.
Figure 2—figure supplement 1
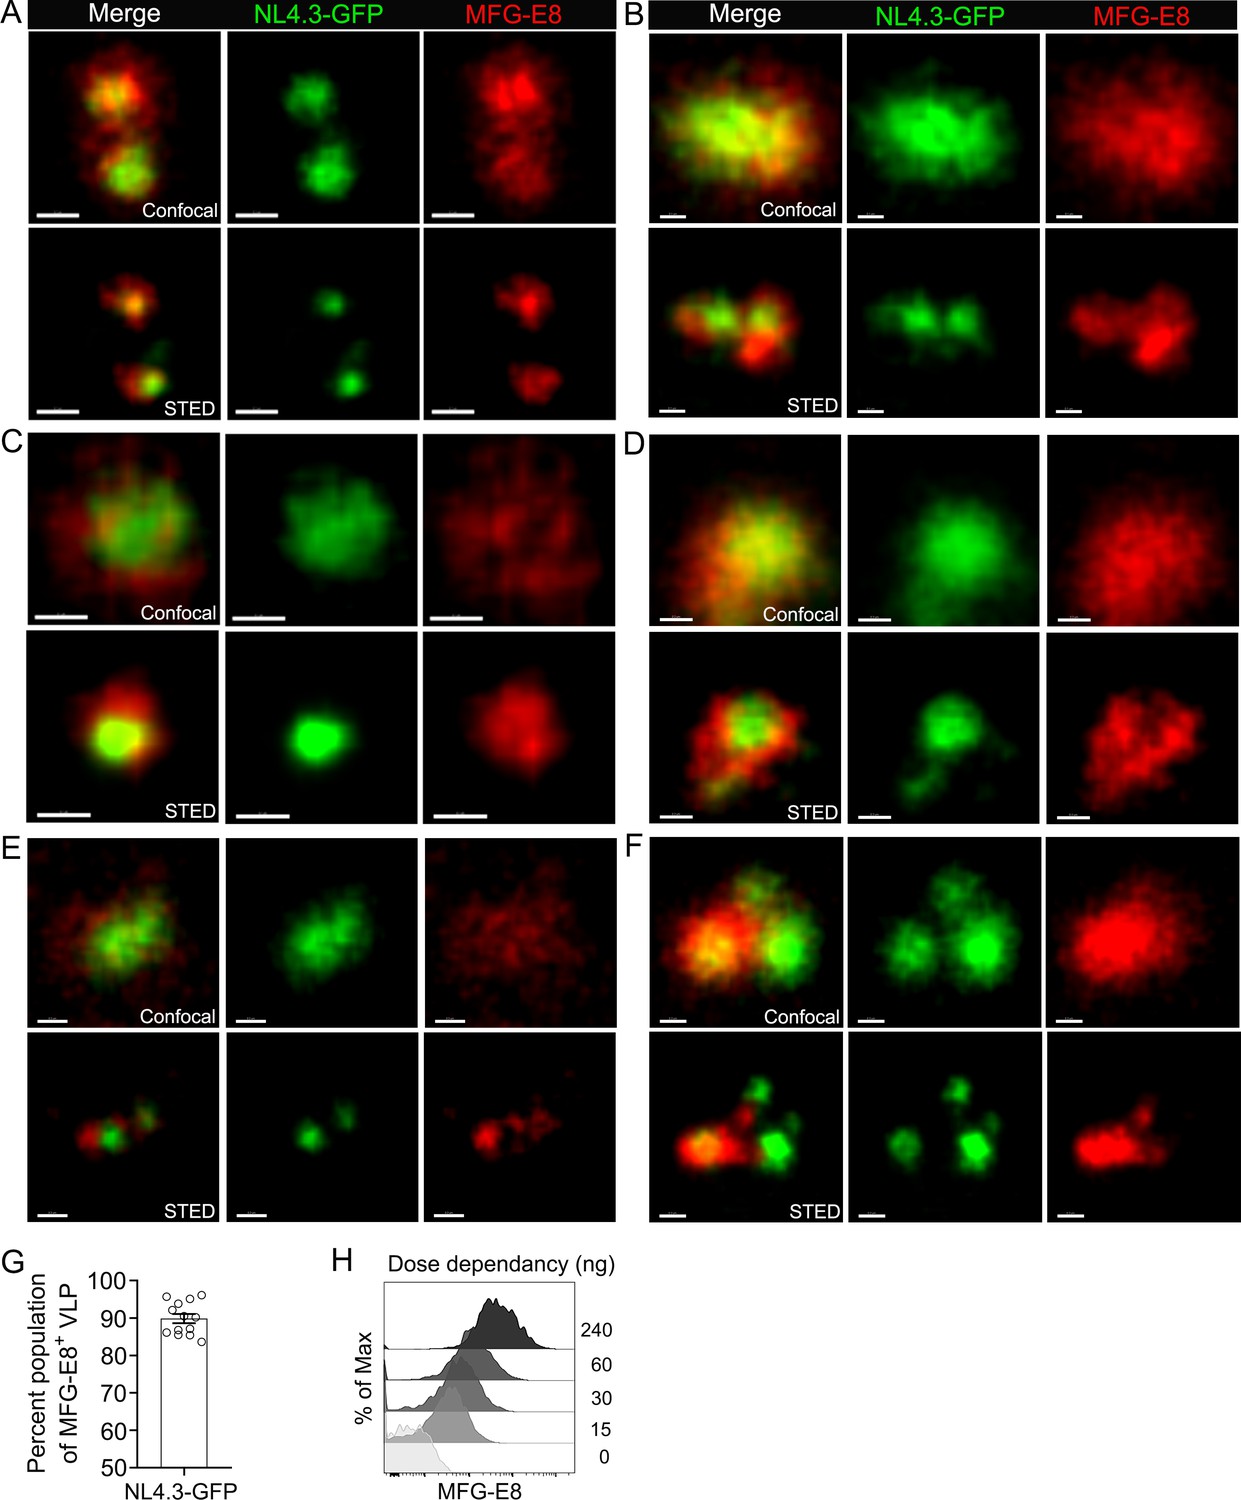
MFG-E8 encasing NL4.3-GFP VLPs.
(A–F) Confocal (upper) and corresponding STED (lower) micrographs of HIV-1 VLP/MFG-E8 complexes. Scale bars 100 nm (A–C), 200 nm (D–F). (G) Percent of HIV-1 VLPs coated with VLP/MFG-E8 complexes were plotted. Percent populations were obtained from 13 separated binding experiments. (H) Histograms shows that dose dependency of MFG-E8 binding to HIV-1 VLP. Directly labeled mouse recombinant MFG-E8 incubated with NL4.3-GFP on ice for 30 min. HIV-1 VLP/MFG-E8 complexes were measured by flow cytometry.
Figure 2—figure supplement 2
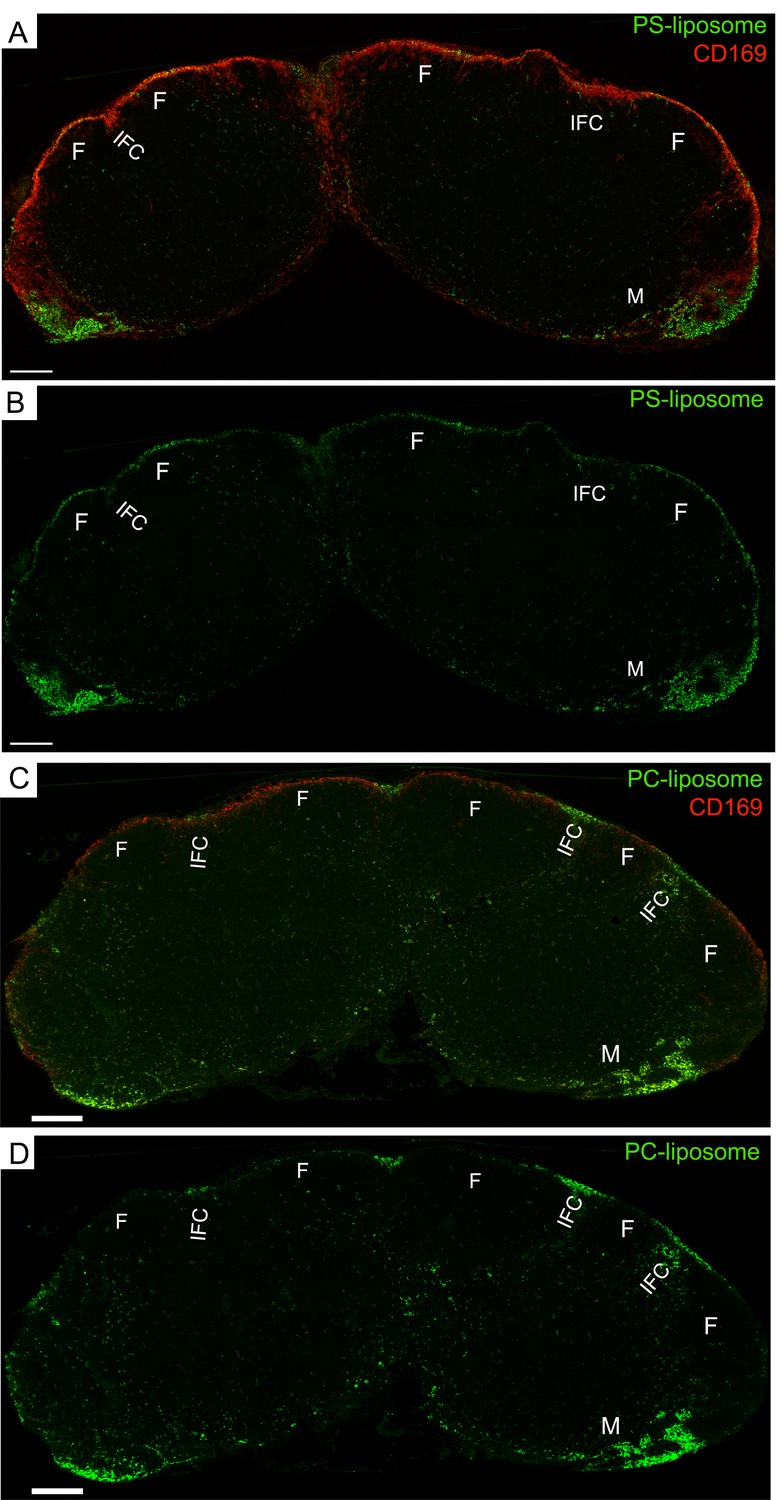
PS-liposome target SCSMs, while PC-liposome mainly target medullary and interfollicular channel SMs.
(A) Tiled confocal micrographs of PS-liposome in inguinal LN harvested 1 hr after liposome injection. B cell follicle (F), inter follicular channel (IFC), and medullary area (M) are indicated. (B) PS-liposome signal only shown. (C) Tiled confocal image of PC-liposome in inguinal LN harvested 1 hr after liposome injection. CD169 immunostained red. B cell follicle (F), interfollicular channel (IFC), and medullary area (M) are indicated. (D) PC-liposome (green) signal only shown. Scale bars 200 μm.
Figure 2—figure supplement 3

MFG-E8 bound HIV-1 VLPs bind to integrin αvβ3.
(A) Flow cytometry detects MFG-E8/αvβ3 integrin/PS liposome complexes. PS-liposome incubated with directly labeled recombinant MFG-E8 and αvβ3 integrin on ice 30 min. Binding of recombinant proteins to PS-liposome detected by αv antibody. (B) Percentage of HIV-1 VLPs bound to MFG-E8 and αvβ3 integrins shown. Percentages obtained from seven separate binding experiments.
Figure 3 with 2 supplements
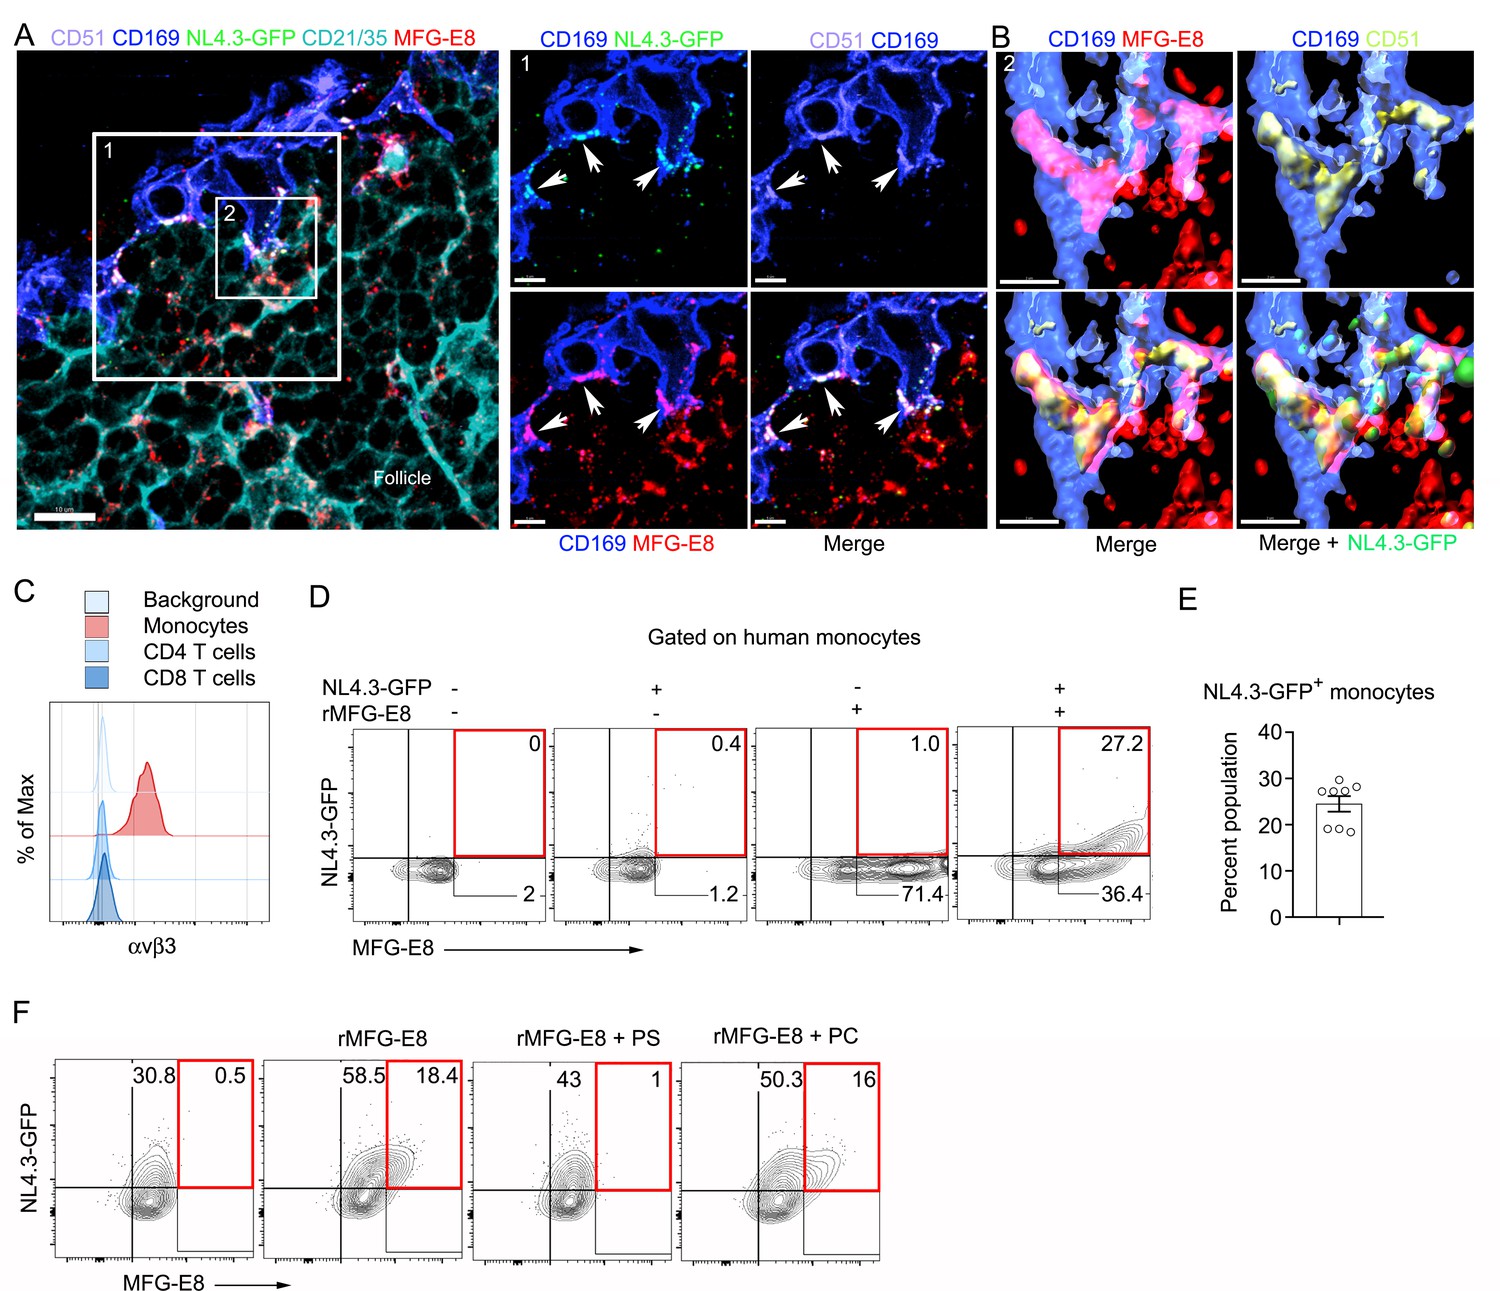
MFG-E8 functions as a bridging molecule to target HIV-1 VLPs to murine SCSM and human monocytes.
(A) LN confocal micrographs of NL4.3-GFP 3 hr after NL4.3-GFP injection. Box 1 zoomed in right panels. Arrow heads indicate overlapping signals. (B) Box 2 in (A) used for 3D-reconstruction in right panels. Triple signals (CD169, CD51, and MFG-E8) were shown as yellowish compartments in left lower panel. NL4.3-GFP signal was overlapped on the compartment in right lower panel. (C) Flow cytometry detects αvβ3 integrin expression on human monocytes (CD14+ PBMC). (D) Addition of recombinant MFG-E8 enhanced NL4.3-GFP binding on human monocytes. Gates were highlighted with red boxes. (E) Percent of NL4.3-GFP+ population of human PBMC enhanced by recombinant MFG-E8 pretreatment was plotted. Human PBMC from eight individuals were tested by in vitro binding assay. (F) PS-liposome inhibited recombinant MFG-E8 mediated NL4.3-GFP binding on human monocytes. Gates highlighted with red boxes. Scale bars 10 and 5 μm (A), and 2 μm (B).
Figure 3—figure supplement 1
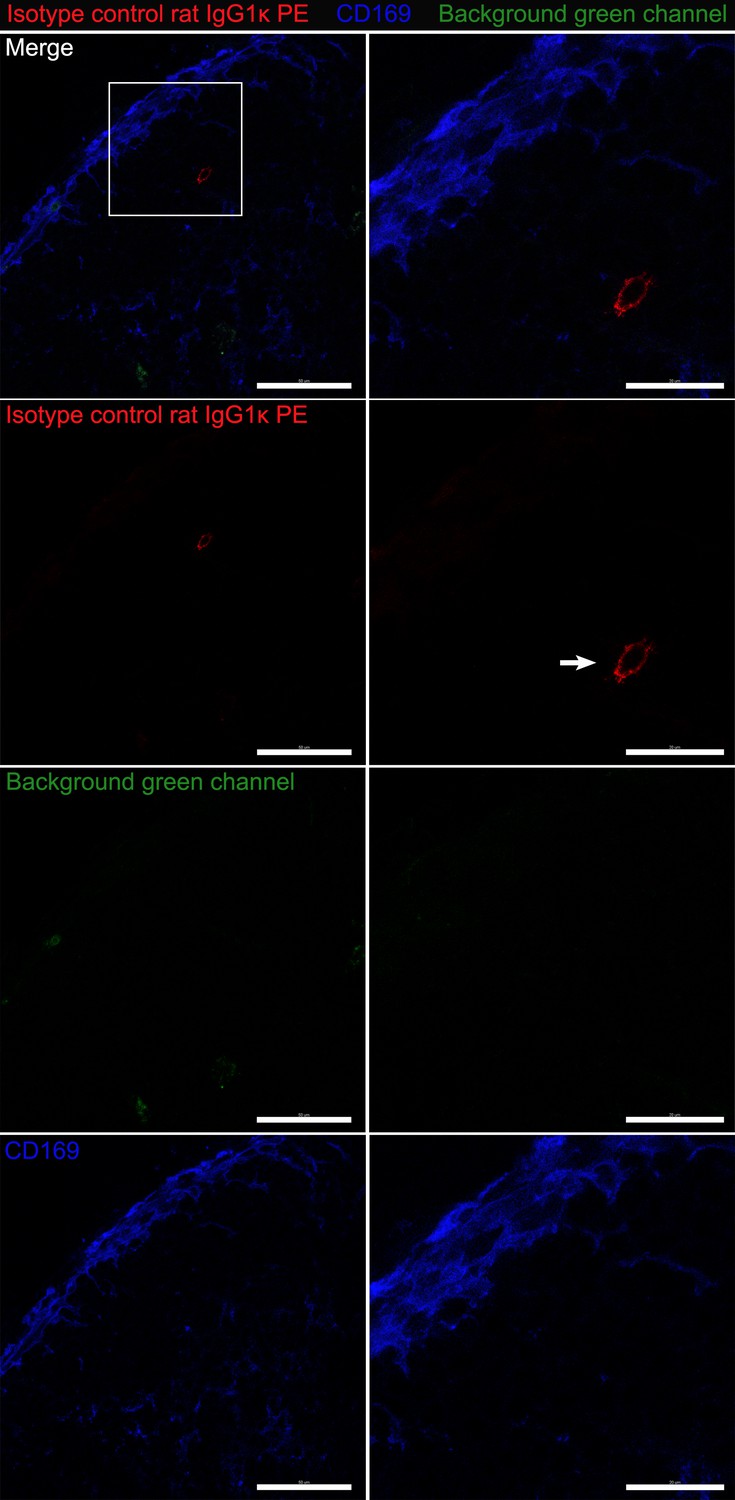
Confocal images of isotype control for CD51 staining.
Confocal micrographs of inguinal LN. Fixed section stained with PE-conjugated rat IgG1k isotype control antibody (red) and CD169 antibody (blue). Boxed area electronically zoomed in second column. First row, all signals merged. Second row, red signal only. Third row, green signal only. Fourth row, CD169 signal only. Arrow indicates non-specific signals in red channel. Scale bars 50 μm and 20 μm.
Figure 3—figure supplement 2
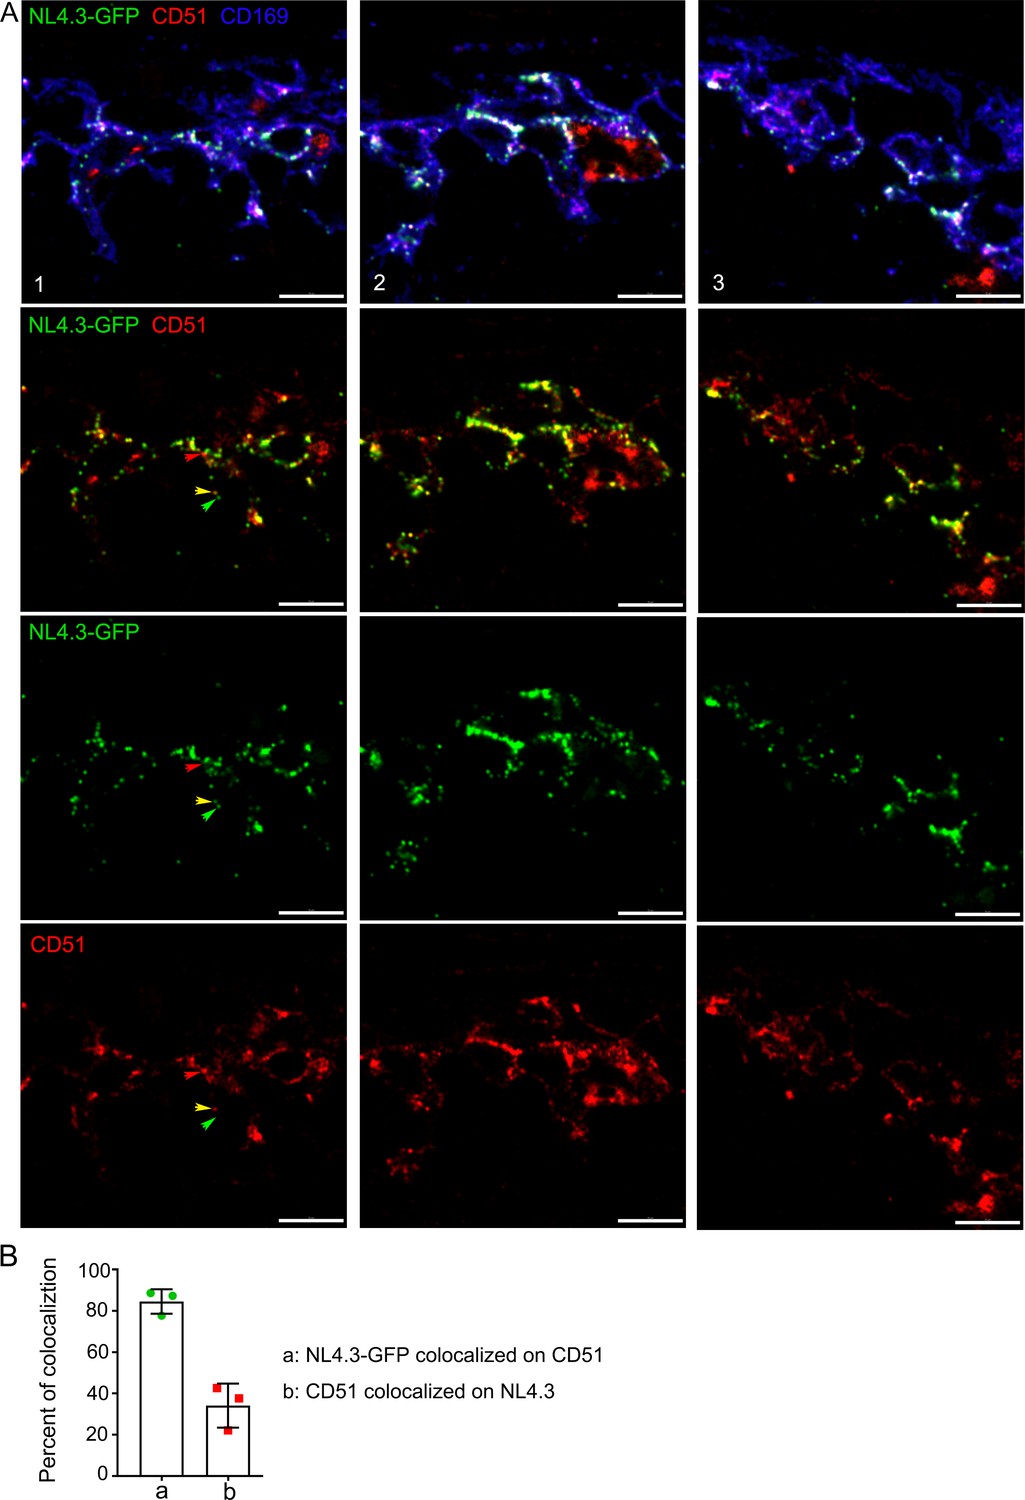
NL4.3-GFP VLPs colocalized with αv integrins.
(A) Confocal micrographs of NL4.3-GFP in inguinal LN harvested 1 hr after injection. Fixed sections were stained with PE-conjugated CD51 antibody (red) and CD169 antibody (blue). Three representative LN slices (columns 1, 2, and 3) are shown. Indicated signals in each row visualized. Yellow arrowhead indicates merged signal of NL4.3-GFP and CD51. Green and red arrowheads indicate internal negative control corresponding to CD51 and NL4.3-GFP. (B) Percent of colocalization between NL4.3-GFP and CD51 was analyzed and plotted. Scale bars 10 μm (A).
Figure 4 with 6 supplements
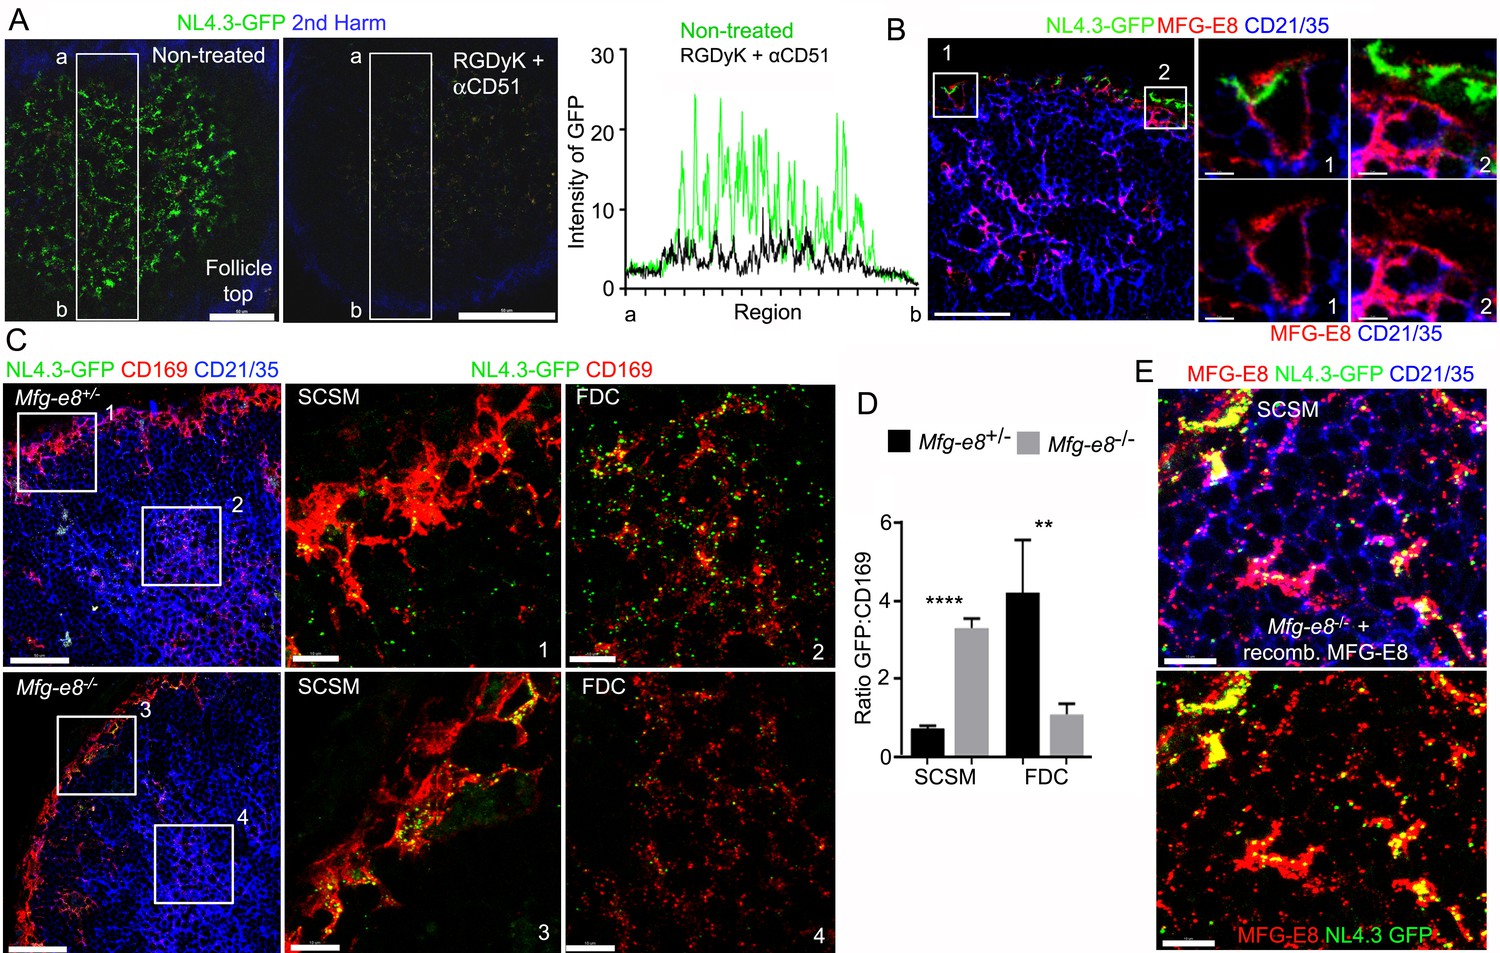
Requirement for αv integrins and MFG-E8 to load NL4.3-GFP VLPs on the FDC network.
(A) LN TP-LSM images from control or from RGDyK (100 μg) + CD51 (10 μg) blocking antibody treated mice captured 80 min after integrin blockade and 20 min after NL4.3-GFP injection. GFP intensity in delineated area shown in graph. (B) LN confocal micrographs of NL4.3-GFP from a mouse pretreated with RGDyK + CD51 blocking antibody as same in (A). LN collected 1 hr after VLPs injection. SCSMs (in Boxes) zoomed in middle and right panels. (C) Confocal micrographs of NL4.3-GFP in Mfg-e8+/- LN (upper) and Mfg-e8-/- LN (lower) 20 hr after VLPs injection. Boxes zoomed in middle and right panels. (D) Graph of NL4.3-GFP signal overlying SCSM and FDCs normalized to CD169+ deposition signal. Four different sections analyzed and plotted. (E) Confocal micrographs of NL4.3-GFP and recombinant MFG-E8 in Mfg-e8-/- LN 3 hr after VLP injection. MFG-E8 injected 1 hr before NL4.3-GFP. Scale bars 50 μm (A), 20 μm and 5 μm (B), 50 μm and 10 μm (C), and 10 μm (E). **; p<0.01, ****; p<0.0001.
Figure 4—figure supplement 1
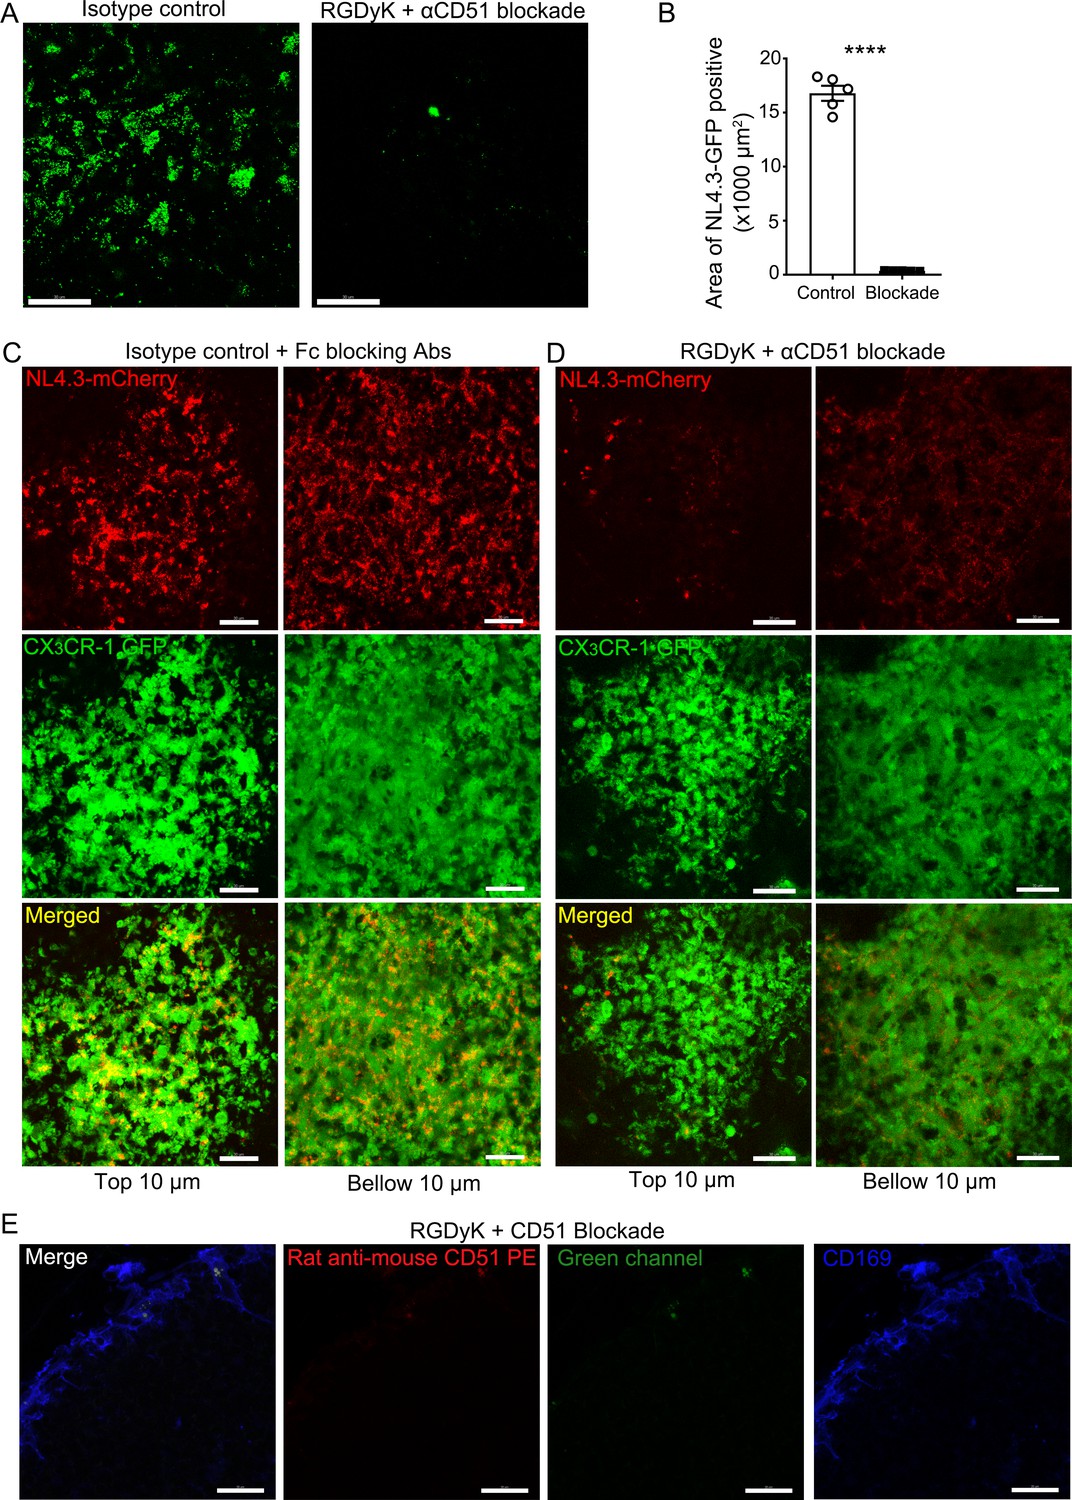
Integrin blockade inhibits VLP binding to SCSMs.
(A) LN TP-LSM micrographs from isotype control (Rat IgG1k,10 μg) or from RGDyK (100 μg) + CD51 (10 μg) blocking antibody treated mice captured 80 min after integrin blockade and 20 min after NL4.3-GFP injection. (B) NL4.3-GFP+ capsular area was measured and plotted. Five different area from two different experiments analyzed. ****; p<0.0001. (C) LN TP-LSM micrographs of CX3CR-1-GFP mice from isotype control (Rat IgG1k, 10 μg plus Fc blocking antibody, 10 μg) antibody treated mice. Images were captured 1 hr after antibodies and NL4.3-mCherry simultaneous injection. (D) LN TP-LSM micrographs of CX3CR-1-GFP mice from RGDyK (100 μg) + CD51 (10 μg) blocking antibody treated mice. Images were captured 1 hr after integrin blockade and NL4.3-mCherry simultaneous injection. In C and D, left column visualized initial 10 μm thick volume image of SCSM layer. Right column visualized subsequent 10 μm thick volume image of SCSM layer. (E) Confocal micrographs of inguinal LN from a mouse pretreated for 2 hr with RGDyK + CD51 blocking antibody. Fixed section was stained with PE-conjugated anti-mouse CD51 antibody (red) and CD169 antibody (blue). Left panel, all signals merged. Second panel, red signal only. Third panel, green signal only. Fourth panel, CD169 signal only. Scale bars 30 μm (A, C, D), 20 μm (E).
Figure 4—figure supplement 2
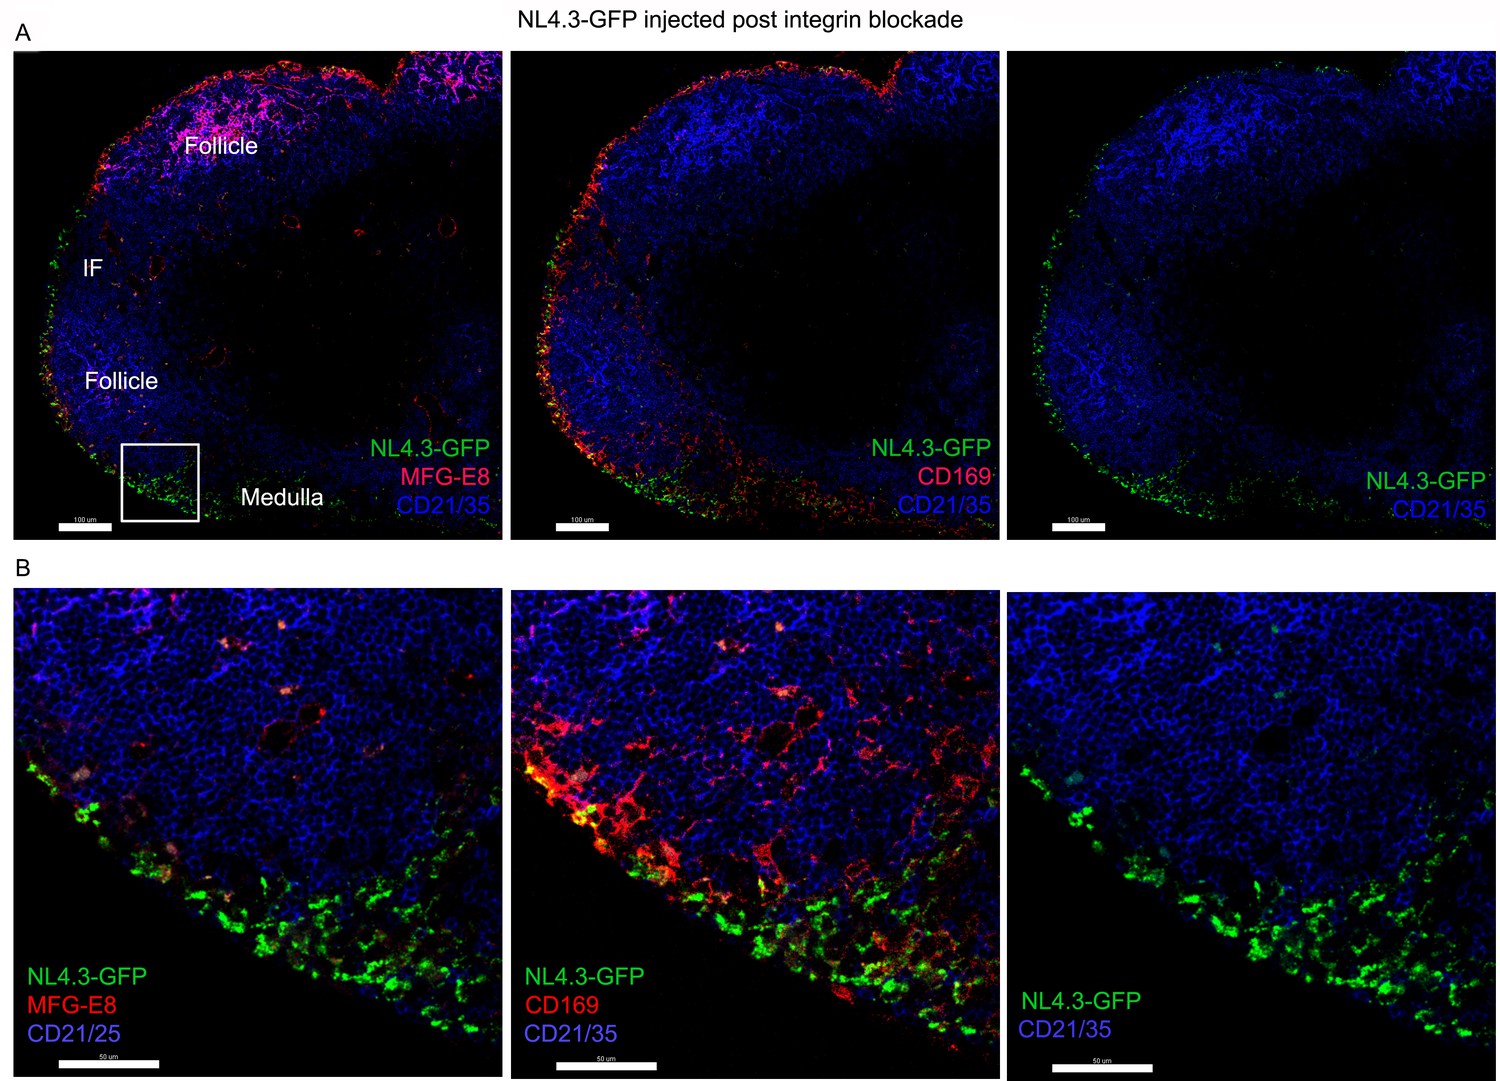
Integrin blockade shifts VLP targeting to the medullary SMs and strongly reduces FDC loading.
(A) Confocal micrographs of NL4.3-GFP (green) in inguinal LN from a mouse pretreated for 1 hr with RGDyK + CD51 blocking antibody. The LN was harvested 1 hr after VLPs injection. Top panels show CD21/35 and NL4.3-GFP signals. The left panel also shows MFG-E8 and the middle panel CD169. B cell follicle (follicle) and area (medulla) are indicated. (B) Box (cortical/medullary junction) in left, above micrograph electronically zoomed and shown with indicated signals. Scale bars 100 μm (A), 50 μm (B).
Figure 4—figure supplement 3
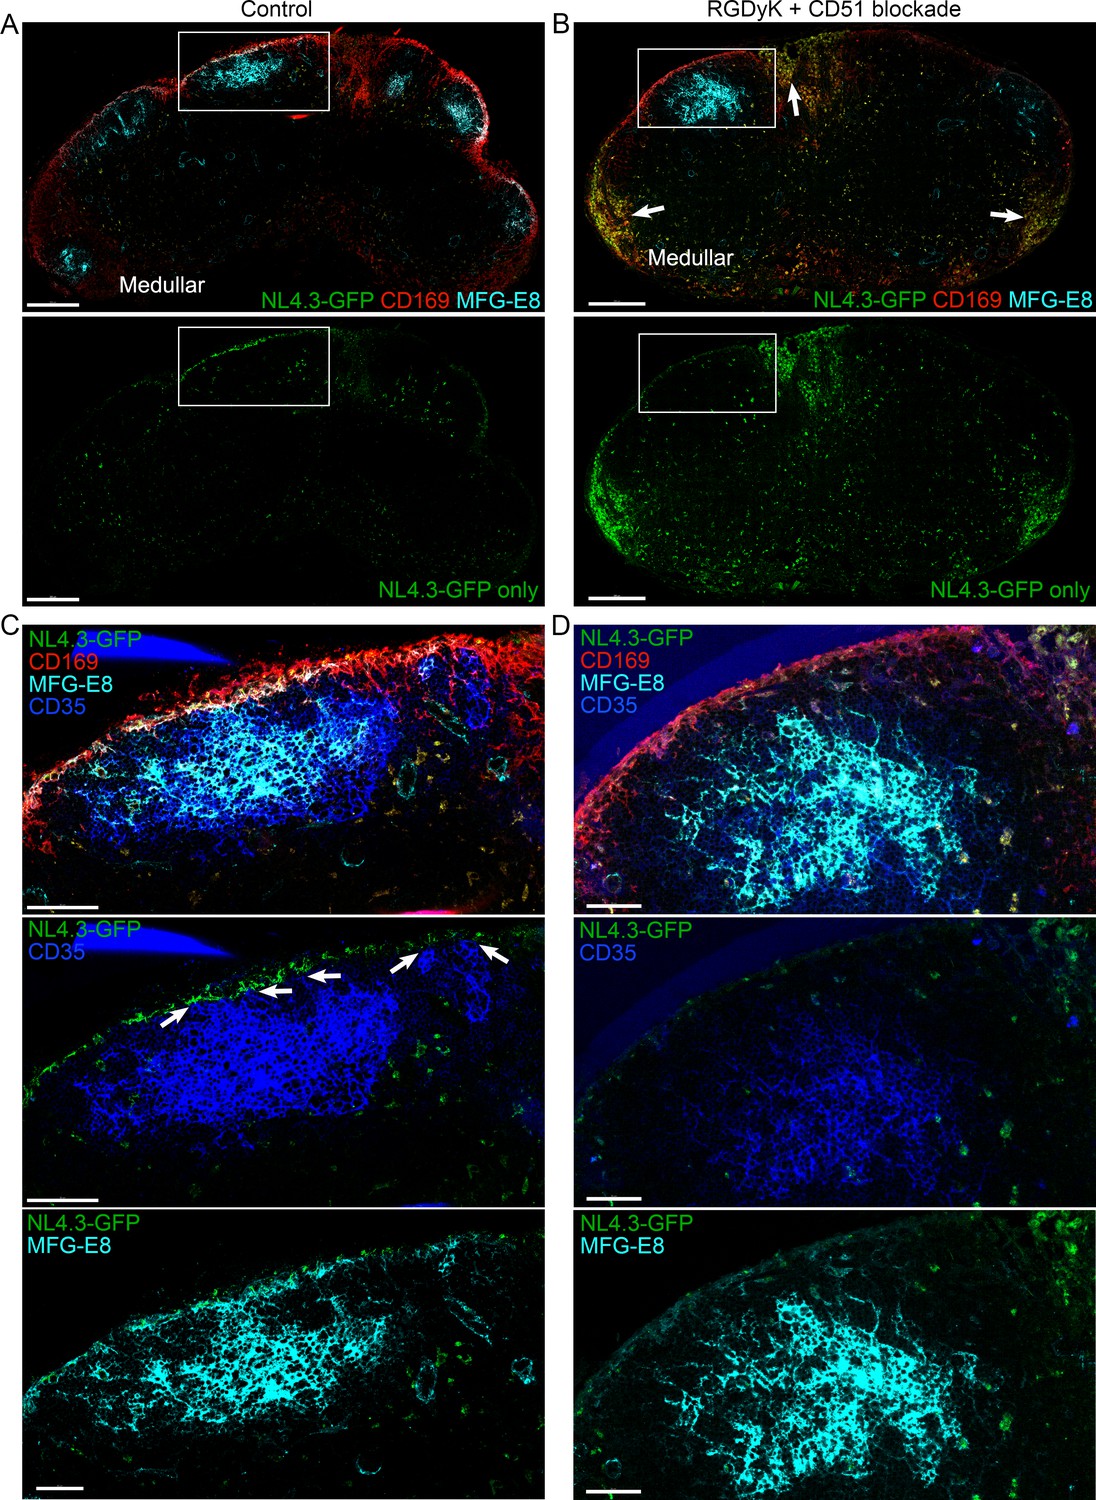
Integrin blockade shifts VLP targeting to the medullary SMs and strongly reduces FDC loading.
(A) Confocal micrographs of NL4.3-GFP (green) in inguinal LN from a mouse pretreated for 5 hr with isotype control antibody (Rat IgG1k,10 μg). The LN was harvested 1 hr after VLPs injection. Upper panel show CD169, MFG-E8 and NL4.3-GFP signals. Lower panel show NL4.3-GFP signal only. (B) Confocal micrographs of NL4.3-GFP (green) in inguinal LN from a mouse pretreated for 5 hr with RGDyK + CD51 blocking antibody. The LN was harvested 1 hr after VLPs injection. Upper panel show CD169, MFG-E8 and NL4.3-GFP signals. Lower panel show NL4.3-GFP signal only. Arrows indicates medullary area in LN. (C, D) Box in A and B electronically zoomed and shown with indicated signals in C and D. Arrows of middle panel in C indicate MFG-E8+ compartment as direct contact point between SCSM and FDC. Scale bars 200 μm (A, B), 50 μm (C, D).
Figure 4—figure supplement 4
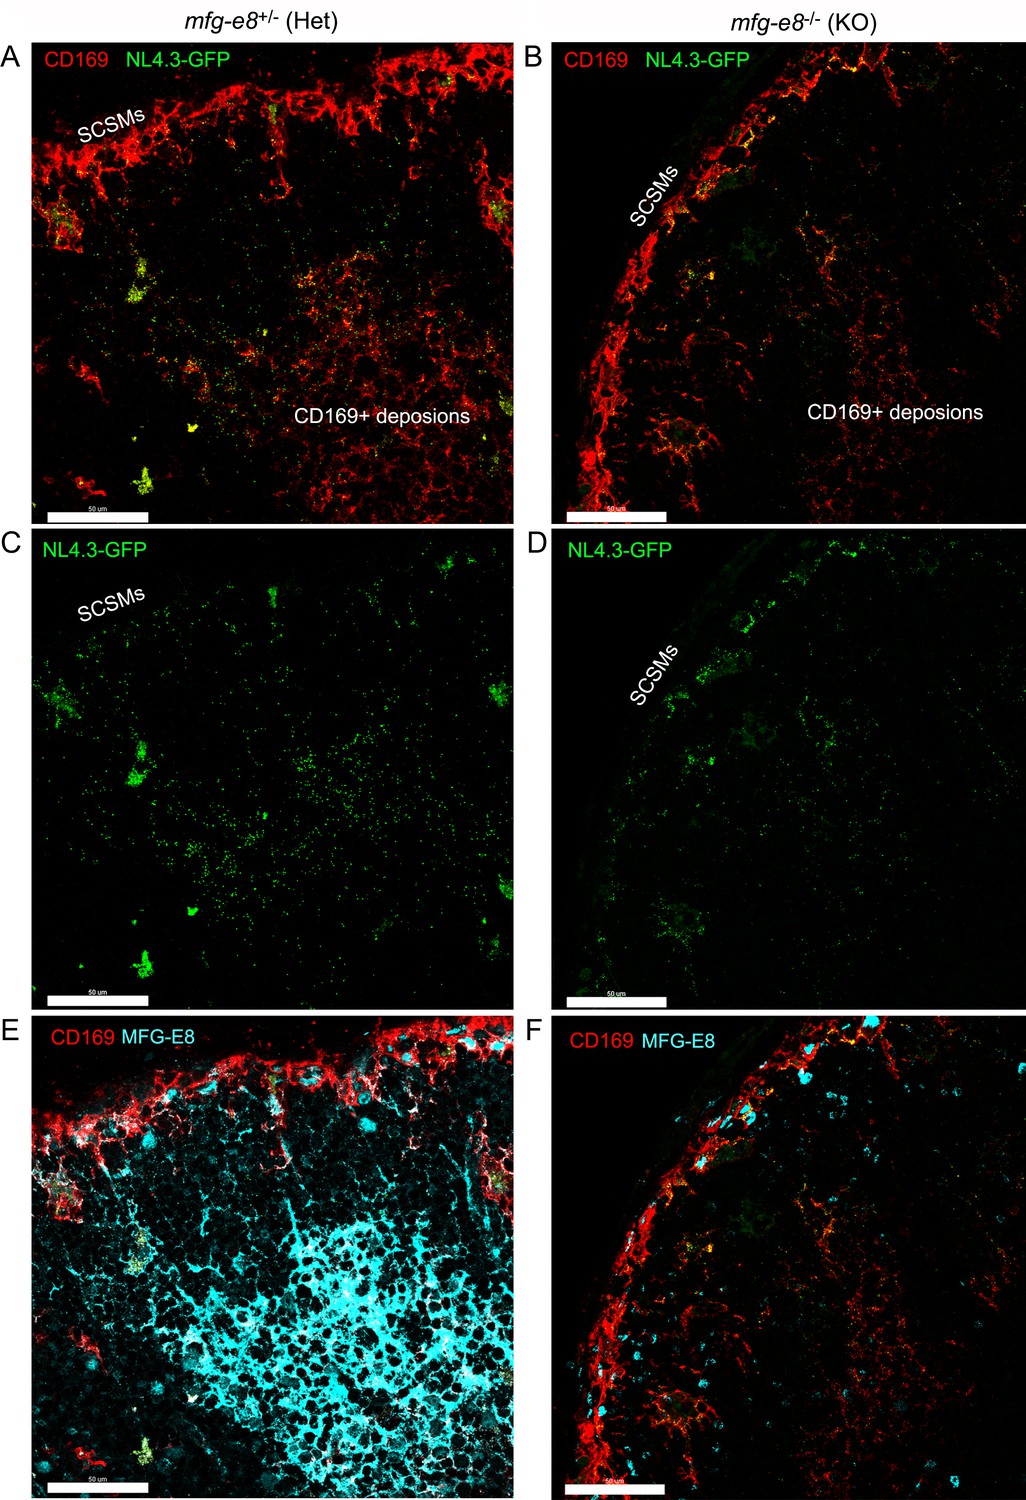
In Mfg-e8-/-LNs HIV-1-VLPs accumulate on the SCSMs yet poorly load the FDC network.
(A, B) Confocal micrographs of NL4.3-GFP (green) in inguinal LN obtained from Mfg-e8+/- mouse (left column) and Mfg-e8-/- mouse (right). LN was harvest 20 hr after VLPs injection. CD169+ depositions on FDC network are indicated. (C, D) Images shown without CD169 signal. (E, F) Images show MFG-E8 expression. Scale bars 50 μm.
Figure 4—figure supplement 5
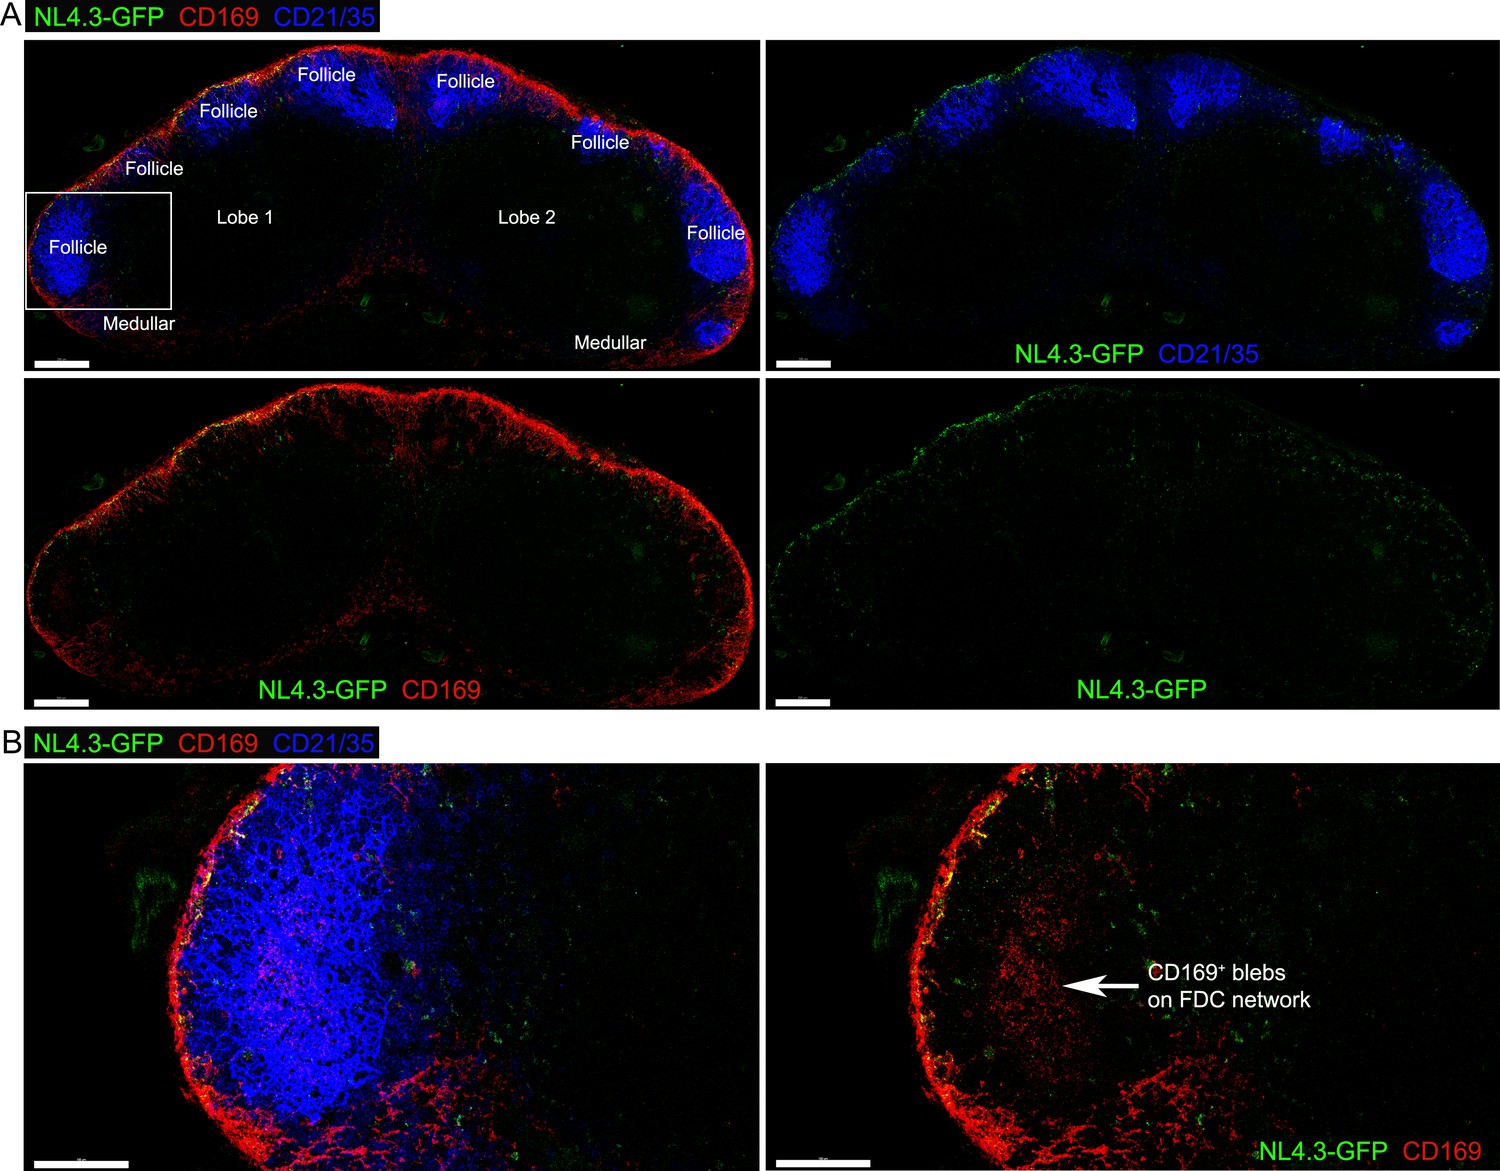
The deposition of CD169+ blebs on FDCs in the middle of B cell follicle.
(A) Tiled confocal micrographs of NL4.3-GFP in inguinal LN harvested 1 hr after injection. Fixed LN section was stained with antibodies of CD169 (red) and CD21/35 (blue). Two separated lobes (lobe 1 and lobe 2) in inguinal LN are indicated. Left upper panel, B cell follicles (Follicle) and medullary area (Medullar) are indicated. Left lower panel, NL4.3-GFP and CD169 signals. Right upper panel, NL4.3-GFP and CD21/35 signals. Right lower panel, NL4.3-GFP signal only. (B) Boxed B cell follicle in (A) was electronically zoomed, left. Deposition of CD169+ blebs on center of FDC network indicated by arrow, right. Scale bars 200 μm (A) and 100 μm (B).
Figure 4—figure supplement 6
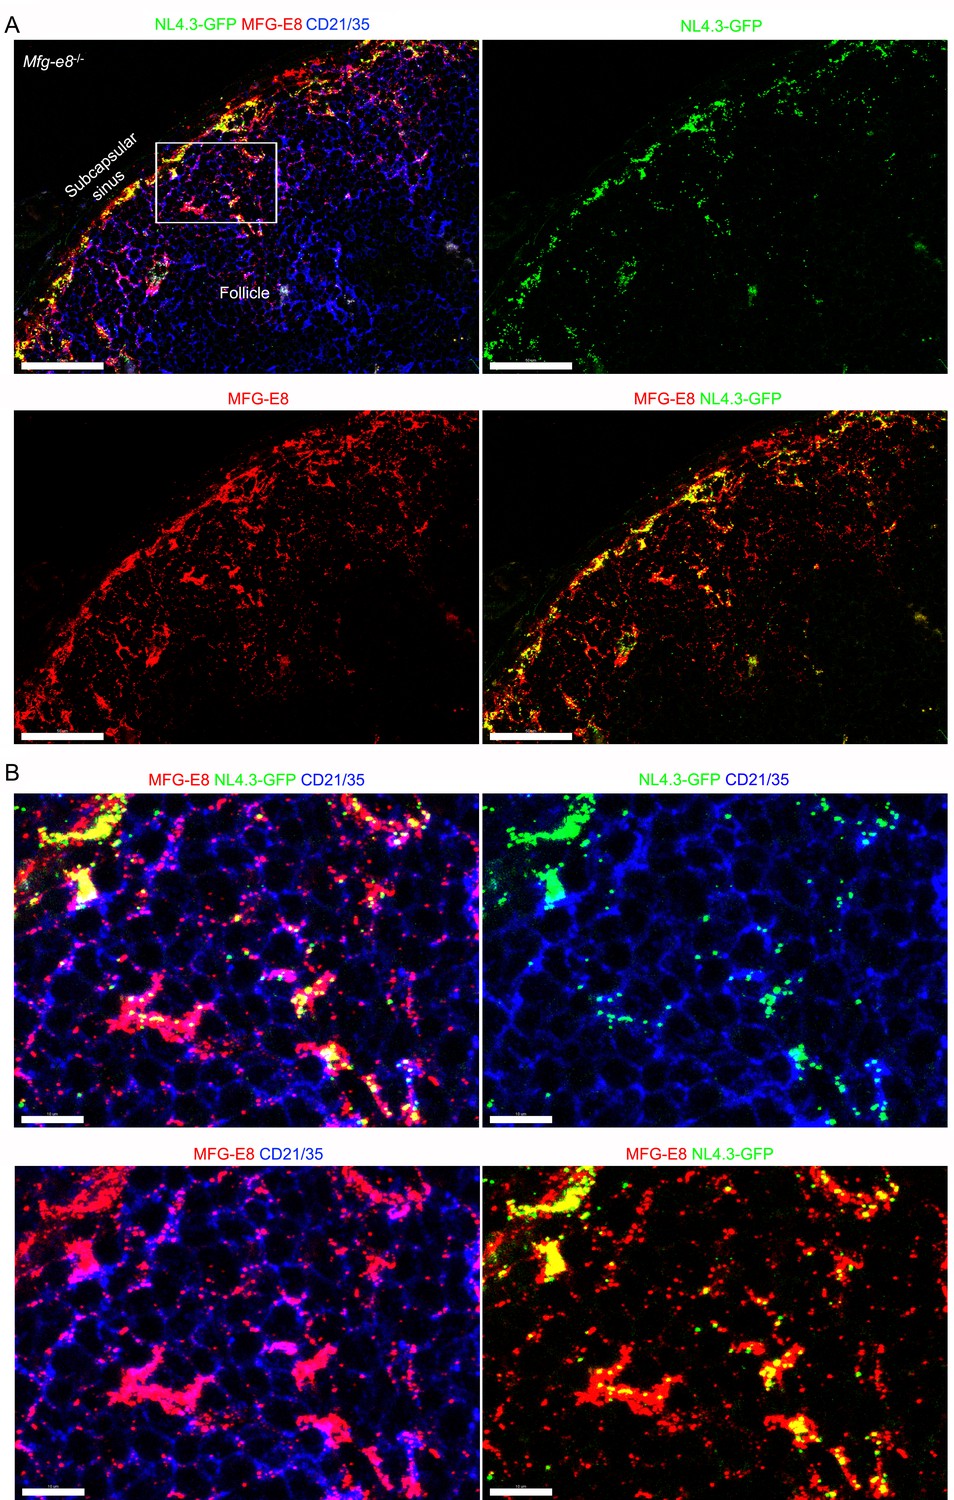
Recombinant MFG-E8/NL4.3-GFP complexes captured by SCSM and subsequently translocated to FDC network.
(A) Confocal micrographs of NL4.3-GFP and recombinant MFG-E8 in the inguinal LN following injection into a Mfg-e8-/- mouse. The LN was harvested after 3 hr after recombinant MFG-E8/NL4.3-GFP complex injection. MFG-E8 detected by antibody staining. The indicated signals are shown in the separate panels. (B) Box from panel A was electronically zoomed (top, left). NL4.3-GFP and CD21/35 signals shown (top, right). MFG-E8 and CD21/35 signals shown (bottom, left). MFG-E8 and NL4.3-GFP signal shown (bottom, right). Scale bars 50 μm (A), 10 μm (B).
Figure 5 with 1 supplement
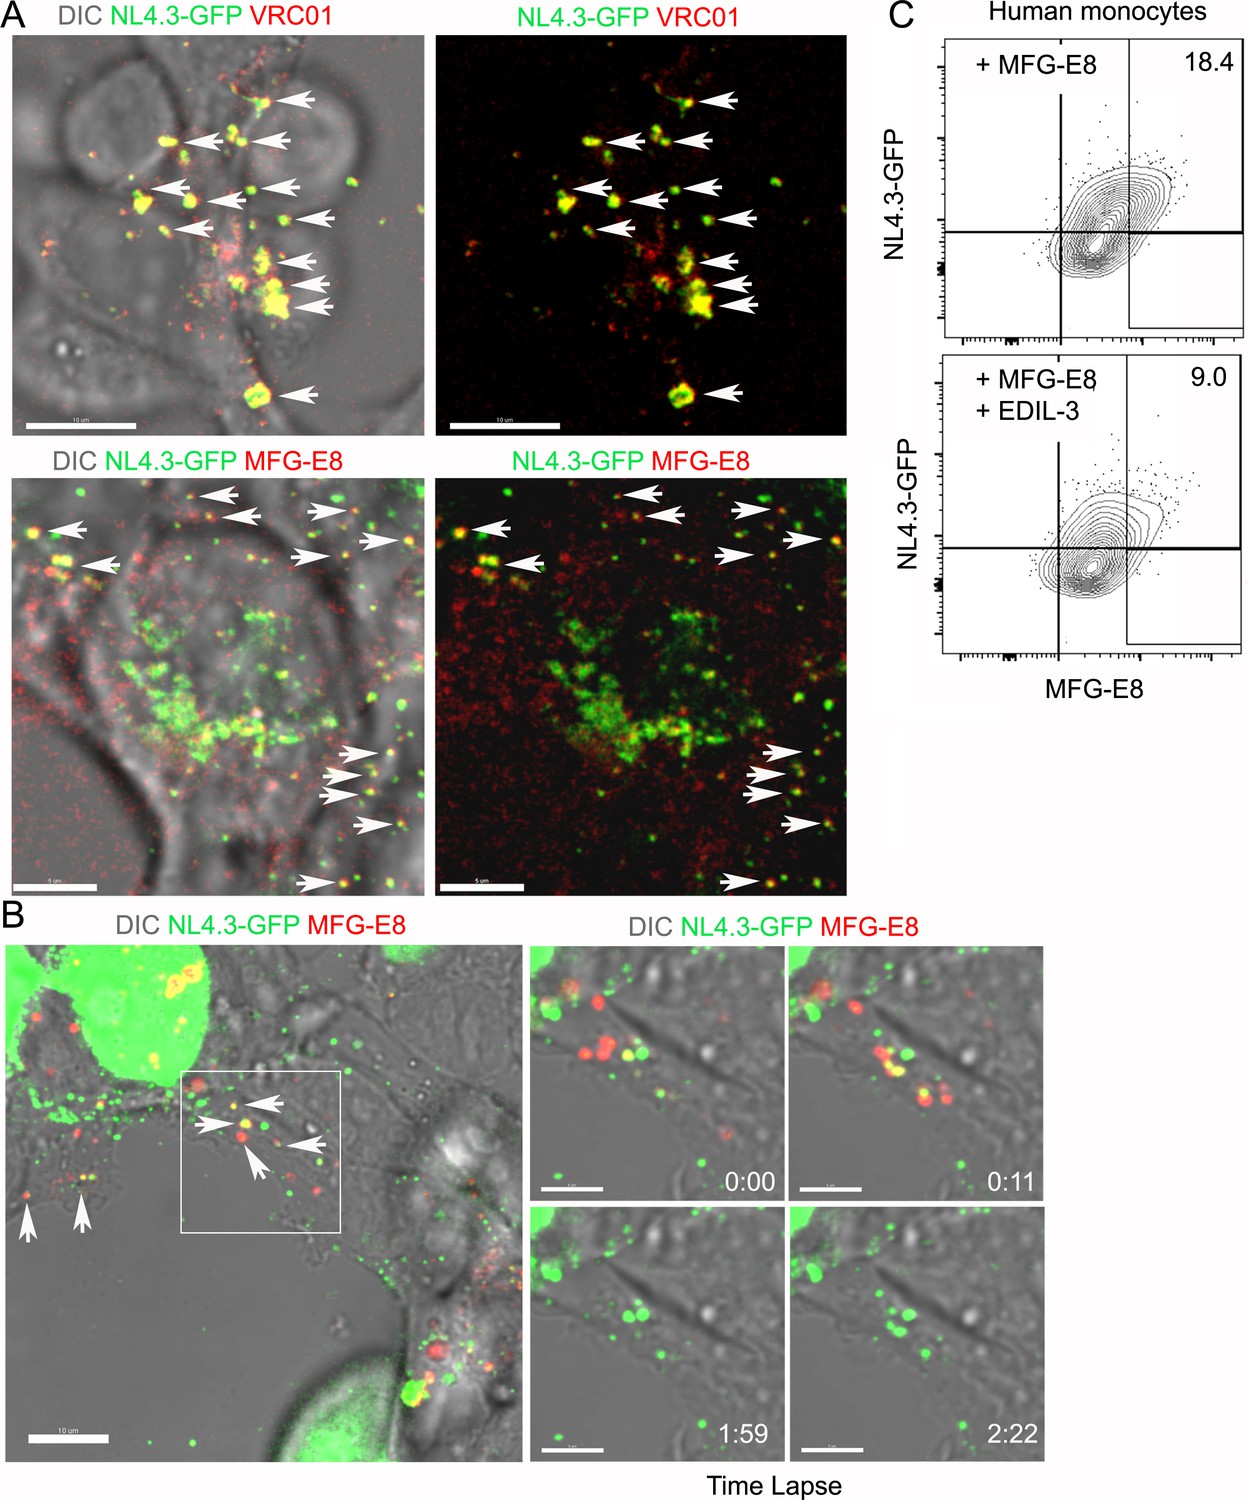
MFG-E8/NL4.3-GFP complexes present in transfected HEK293T cell cultures.
(A) Confocal image from live cell imaging of HEK293T cell previously transfected with NL4.3-GFP plasmid. NL4.3-GFP detected by VRC01 staining (upper row). MFG-E8 detected by antibody staining (lower row). Left image includes DIC image. Arrows indicate merged signal. (B) Confocal image from live cell imaging of HEK293T cell previously transfected NL4.3-GFP plasmid. Labeled recombinant MFG-E8 was added to the cells prior to imaging. MFG-E8 bound NL4.3-GFP virions are indicated (arrows). The box in the left panel was electronically zoomed at four different time points. (C) Flow cytometry indicates competitive inhibition of EDIL-3 to MFG-E8 mediated NL4.3-GFP binding on human monocytes. Scale bar 5 μm (A), 10 and 5 μm (B).
Figure 5—figure supplement 1
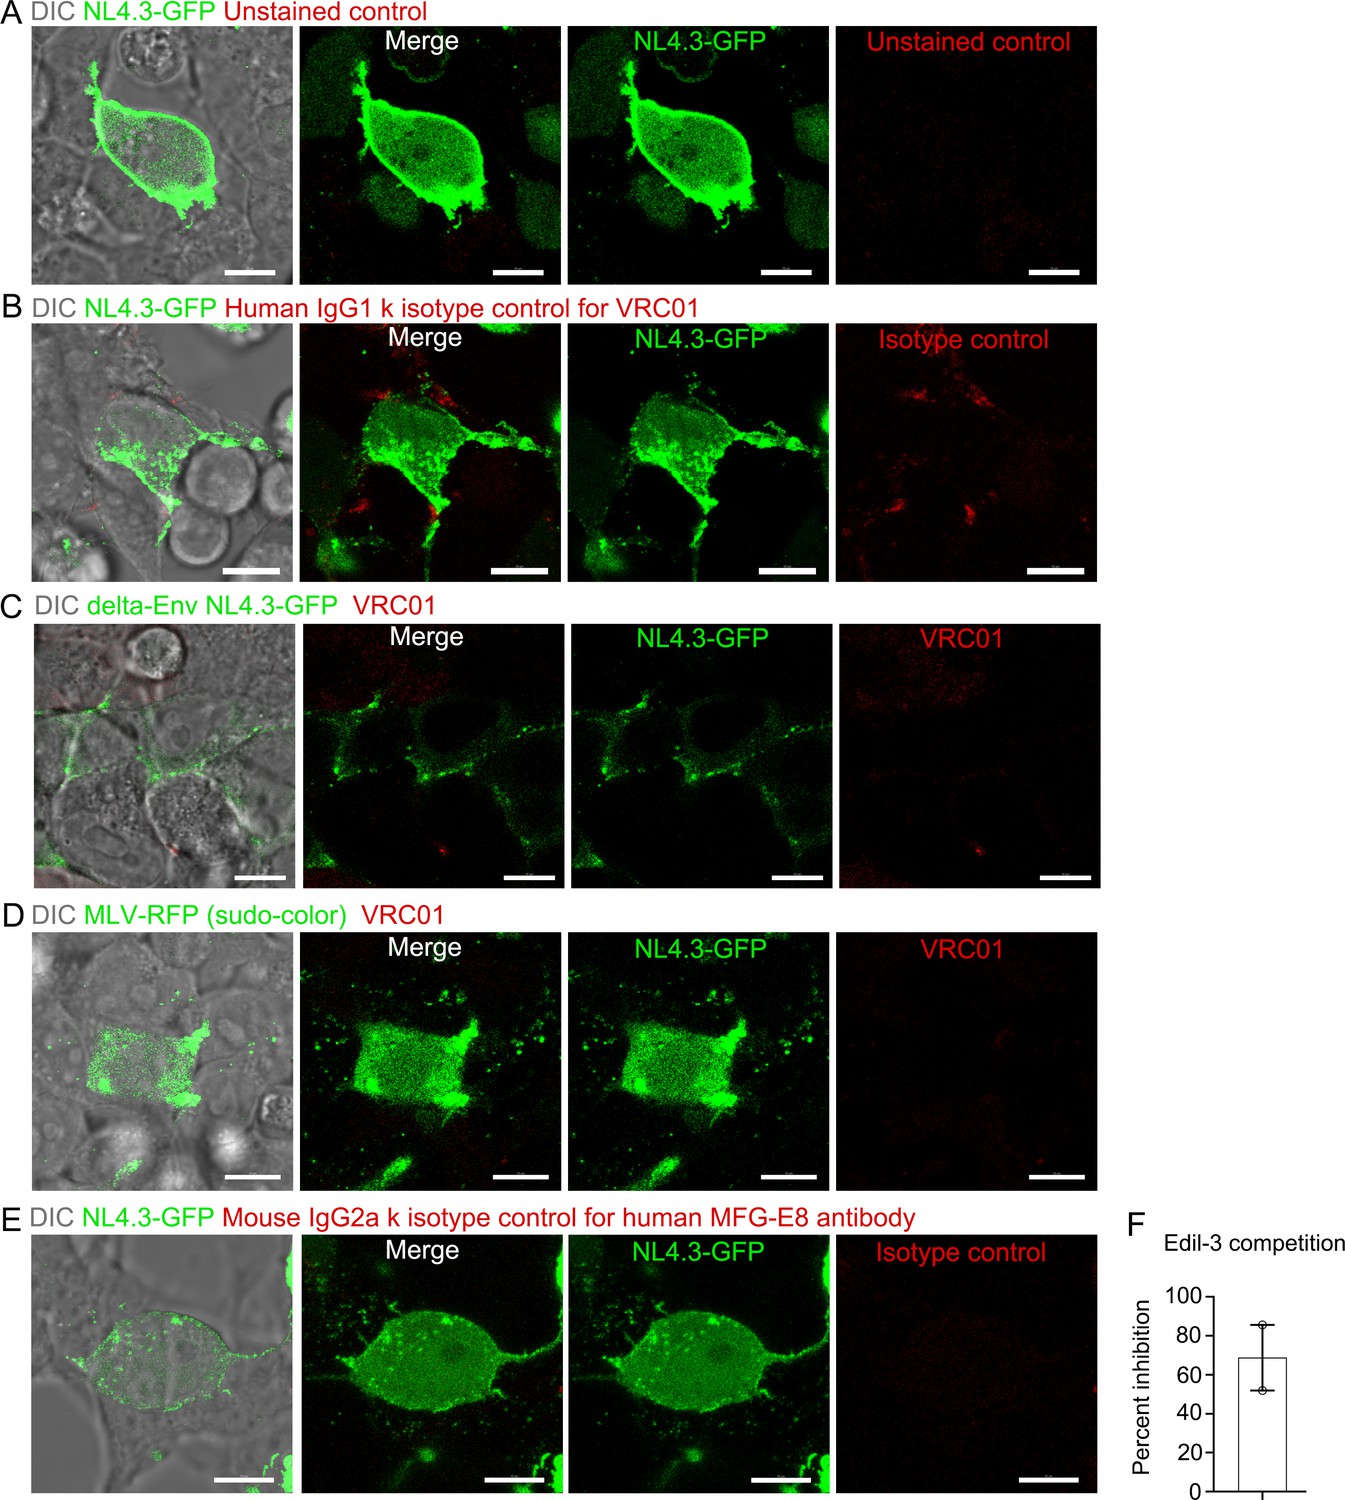
Isotype Controls for HEK293T imaging and Edil-3 competition to MFG-E8 binding on NL4.3-GFP VLPs.
Confocal micrographs from live cell imaging of HEK293T cell previously transfected with NL4.3-GFP plasmid. First panel merged with DIC and fluorescence signals. Other panels shown with indicated signals. (A) Micrographs shown unstained control for antibodies. (B) Micrographs shown isotype control (human IgG1k) stain for VRC01 (C) Micrographs from live cell imaging of HEK293T cell previously transfected with delta-Env NL4.3-GFP plasmid. Micrographs shown VRC01 antibody stain. (D) Micrographs from live cell imaging of HEK293T cell previously transfected with pSV-A-MLV-env, pSV-Ψ-MLV-env- and MLV Gag-RFP. Micrographs shown VRC01 antibody stain. (E) Micrographs shown isotype control (mouse IgG2a k) stain for human MFG-E8 antibody. (F) Percent inhibition by recombinant Edil-3 of recombinant MFG-E8 binding to NL4.3-GFP VLPs is plotted. Results from two separated experiments. Scale bars 10 μm.
Figure 6 with 2 supplements
Immune complexes co-localize with HIV-1 VLPs on SCSMs and trigger the transient abutment of FDCs and SCSMs.
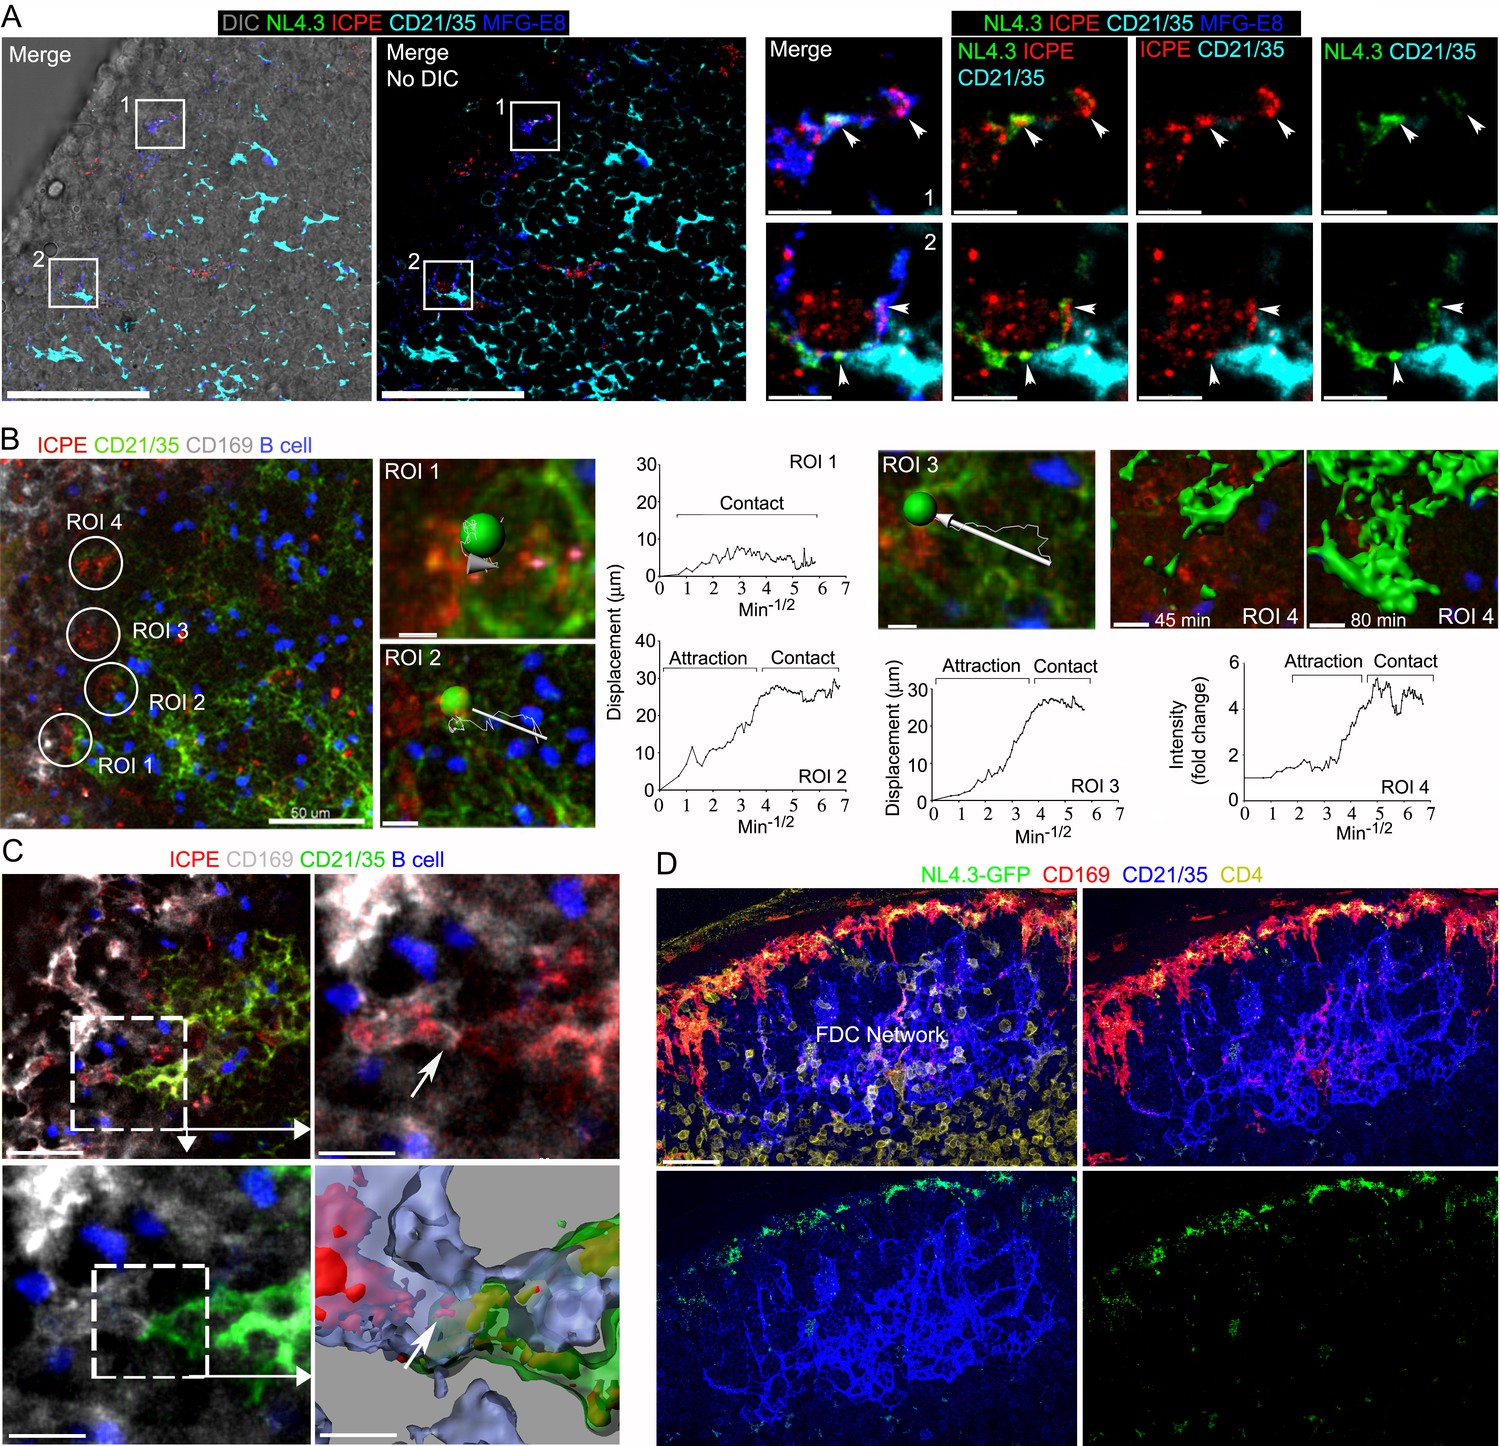
(A) LN confocal micrographs of NL4.3-GFP and ICPE 4 hr after NL4.3-GFP injection. ICPE injected 1.5 hr after NL4.3-GFP. In left panel DIC superimposed image shown. SCSMs in boxes (left and middle panels) zoomed. Arrows indicate NL4.3-GFP, ICPE, and MFG-E8 co-localization. (B) LN TP-LSM image following ICPE injection. In ROI 1–3 arrows show FDC displacement and green balls indicate arbitrary center points of FDC tracked. Graphs show FDC movement relative to SCSM. ROI4 shown as 3D-reconstructed volume of a FDC at indicated times. Graph records time-dependent changes in FDC signal. (C) LN TP-LSM images at SCSM/FDC interface 3 hr after ICPE injection. Dotted white box zoomed in top, right and bottom, left panels. Dotted box reconstructed as 3D-volume, bottom right. Arrows indicate an abutment of SCSM and FDC, which contains ICPE. (D) Confocal images of LN sections showing impact of pertussis toxin on FDC network translocation. Pertussis toxin (500 ng) injected 2 hr before NL4.3-GFP. LN analyzed 6 hr later. Scale bars 50 and 5 μm (A), 50 and 5 μm (B), 30 and 10 μm (C), and 30 μm (D).
Figure 6—figure supplement 1
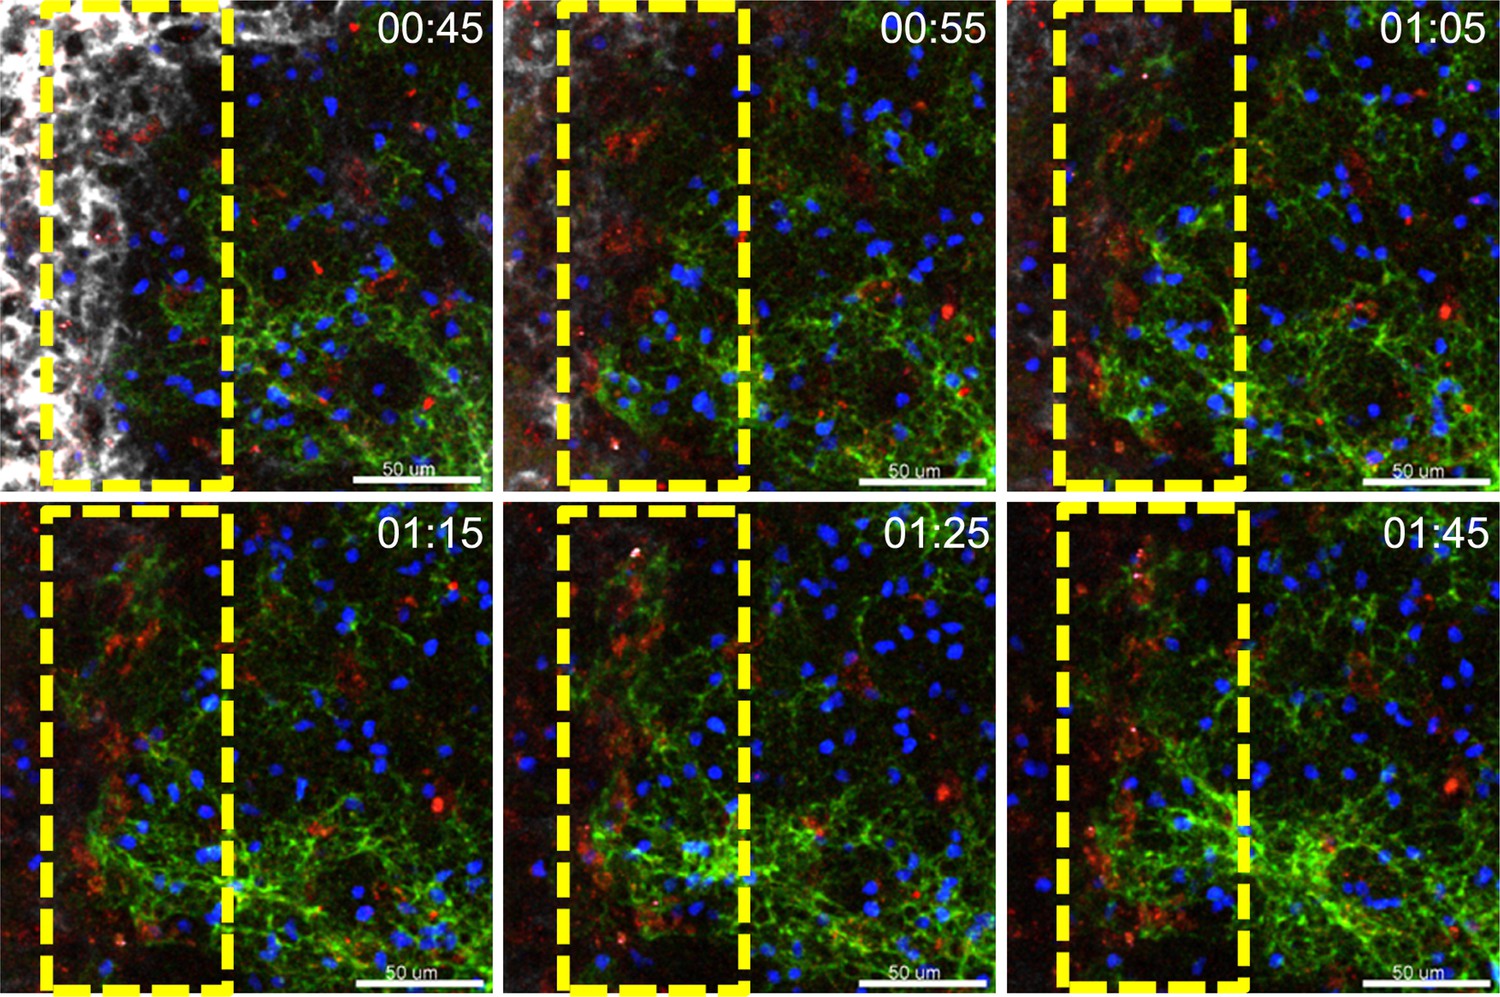
A dynamic FDC network shift towards SCSMs.
TP-LSM images from the inguinal LN from 45 min to 1 hr 45 min after injection of ICPE (red). Dotted yellow box indicates interface between SCSMs and FDCs network revealed by injected CD169 (white) and CD21/35 (green) antibodies. B cells (blue) adoptively transferred the previous day outline the follicle. Time stamp indicates time after ICPE injection, hour:min. Scale bars 50 μm.
Figure 6—figure supplement 2

The impact of pertussis toxin on FDC network localization in B cell follicle.
Confocal micrographs of LN sections showing FDC network location in B cell follicles. Resting LN (A and B) indicates that lymph node collected without treatment. PTx treated LN (C and D) indicates that lymph node collected at 8 hr post treatment of Pertussis toxin (500 ng). CD169 (red) visualized SCSMs overlaying capsule of B cell follicle. CD4 (yellow) stain delineated follicular border to T cell zone. FDCs (blue) were visualized by CD21/35 stain. Signals in each row indicated column A. Scale bars 50 μm.
Figure 7
gp120-specific B cells extract HIV-1 VLPs from SCSMs.
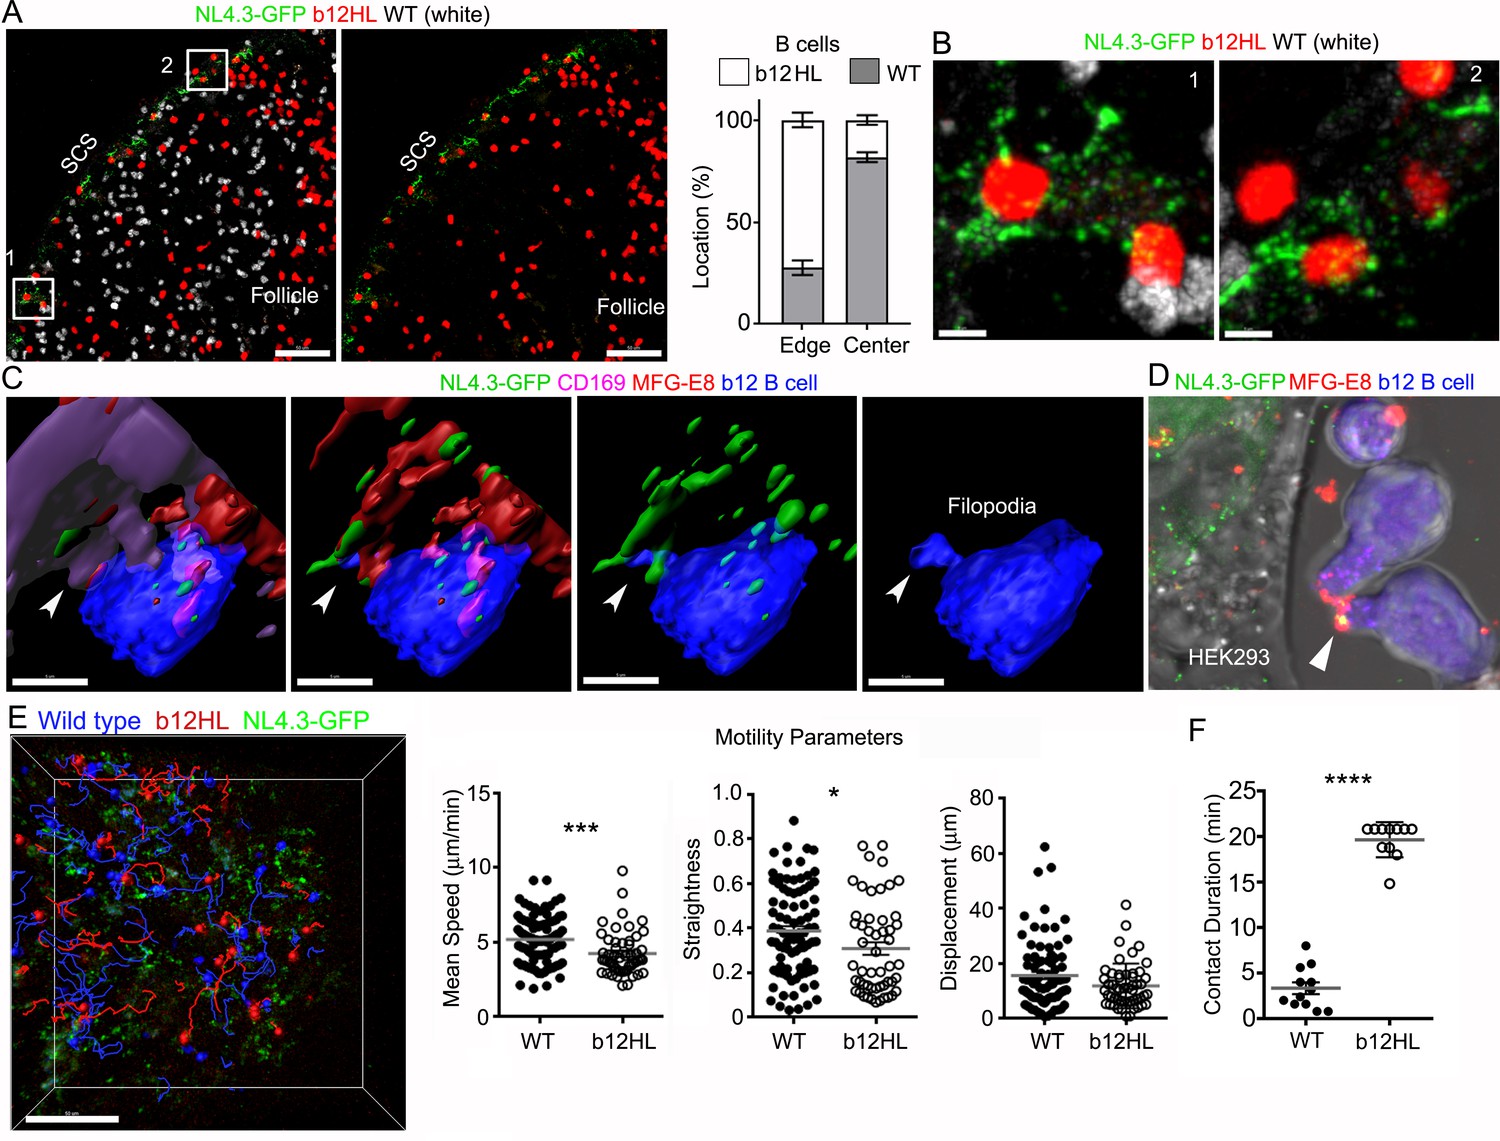
(A) LN confocal images of adaptively transferred b12 and wild type B cells 3 hr after NL4.3-GFP injection. B cells transferred day before. Right panel shows only b12 B cells in the follicle. Graphical analysis shows percent ratio of wild type versus b12 B cells in B cell follicle center (Center) and follicular edge (Edge). (B) Boxes (1 and 2) in right panel zoomed. (C) 3D-reconstructed images of b12 B cell tightly associated with NL4.3-GFP bearing SCSMs. Arrows indicate an MFG-E8+ compartment on SCSM. Final panel shows a b12 B cell filopodia probing MFG-E8+ compartment. (D) Confocal image from live cell imaging of HEK293T cell previously transfected with NL4.3-GFP plasmid. Directly labeled recombinant MFG-E8 (red) was added 1 hr prior to imaging. Arrow indicates MFG-E8 binding NL4.3-GFP VLP. (E) TP-LSM image overlaid with the tracks of wild type (blue) and b12 B cells (red). B cells were adoptively transferred 1 day before NL4.3-GFP VLP injection. 1 hr after NL4.3-GFP injection intravital images were taken and used to analyzed B cells behavior. (F) Motility parameters were calculated and shown. A comparison between contact durations between B cells (WT or b12 B cells) and VLP bearing SCSM are shown (right panel). Scale bars 50 μm (A), 5 μm (B), 5 μm (C), and 50 μm (E). *; p<0.1, **; p<0.01, ****; p<0.0001.
Videos
Video 1
TP-LSM thick volume images show accumulation of VLPs in SCSM layer and FDC network.
Animation shows a volume image of B cell follicle by TP-LSM. The volume image was acquired from inguinal LN of live mouse at 6 hr and 20 hr after VLPs injection. LN structure was visualized by second harmonic (blue) of capsule and sinus floor. Subcapsular floor and follicular cortex are indicated with arrows. Accumulations of NL4.3-GFP (green) is shown in SCSM rich floor at 6 hr post VLP injection and in FDC rich follicular center at 20 hr post VLP injection. Scale bars 30 μm. The volume image spacing is 10 μm.
Video 2
3D-reconstruction of thick section images shows NL4.3-GFP overlying the SCSM MFG-E8+ sites, which we termed the MFG-E8+ compartment.
Animation shows volume image of thick section confocal image and its 3D-reconstruction. Thick section from inguinal LN collected 3 hr after VLPs injection was stained with FDC-M1 (MFG-E8, blue). NL4.3-GFP (green) and MLV-RFP (red) in MFG-E8+ compartment of SCSMs are indicated with arrows.
Video 3
Visualization of MFG-E8/NL4.3-GFP complexes in the subcapsular sinus and on the SCSMs.
TP-LSM live imaging shows complexes (yellow) of NL4.3-GFP (green) and recombinant MFG-E8 (red) in subcapsular sinus of inguinal LN. Recombinant MFG-E8 which was directly labeled with Alexa Fluor 594 was incubated with NL4.3-GFP for 30 min. This mixture was injected into tail base of MFG-E8 KO mouse. Images were acquired from 25 min after injection. Second harmonic signal (blue) delineated capsule of LN. Highlighted circle indicated visible MFG-E8/NL4.3-GFP complex which captured by SCSM in sinus. The right panel video shows signals without MFG-E8 signal from the left video. Second part of video shows that complexes of endogenous MFG-E8/NL4.3-GFP on SCSM. NL4.3-GFP (green) was injected 1 hr before imaging and endogenous MFG-E8 (red) was visualized by antibody injection into tail base (5 μg/mouse) at 30 min before imaging. Arrow indicated a typical MFG-E8/NL4.3-GFP complex. Time counter is hour:minute:second.
Video 4
Visualization of MFG-E8/NL4.3-GFP complexes in transfected HEK293T cell cultures.
Time lapse images of HEK293T cells transfected with NL4.3-GFP plasmid 24 hr earlier. A MFG-E8 antibody (red) was added to the culture to visualize NL4.3-GFP/MFG-E8 complexes. The fluorescent images and corresponding DIC image are shown. Two different z-sections are shown, one near the top of the cell and other through the middle of the cell. End of video shows only the fluorescent images. Time counter is hour:minute:second.
Video 5
The dynamic FDC network movement and its shift towards the ICPE bearing SCSMs.
TP-LSM live imaging shows the inguinal LN from 45 min to 1 hr 45 min after injection of ICPE (red). SCSMs and FDCs network revealed by injected CD169 (white) and CD21/35 (green) antibodies. B cells (blue) adoptively transferred the previous day outline the follicle. ICPE bearing SCSMs were indicated with arrows. End of two separated video indicate additional examples of FDC network movement. Time counter is hour:minute:second.
Video 6
The direct contact between SCSM bearing ICPE (or HIV-VLPs) and FDCs.
TP-LSM live imaging shows the inguinal LN at the SCSM (white)/FDC (green) interface 3 hr after ICPE (red) injection. SCSMs and FDCs network revealed by injected CD169 (white) and CD21/35 (green) antibodies. B cells (blue) adoptively transferred the previous day outline the follicle. The SCSM/FDC interface were indicated with arrows. Second video shows the inguinal LN at NL4.3-GFP bearing SCSM (green)/FDC (red) interface 6 hr after NL4.3-GFP injection. FDCs network revealed by injected CD21/35 (red) antibodies. The third video zoomed in a contact point between SCSM and FDC in which contains HIV-1 VLPs. Arrows indicate VLP transit from SCSM to FDC. The last portion of the video shows the FDC network and VLPs in the B cell follicle at 6 hr after injection. Time counter is hour:minute:second.
Video 7
The impact of pertussis toxin on FDC network and B cell movement in a follicle.
In part 1, TP-LSM live imaging movies in upper row show the inguinal LN at the subcapsular sinus (SCS) area for 40 min from 1.5 hr after ICPE (red) injection. FDC (green) contacted and fluctuated around ICPE (red) bearing SCSM. B cells (blue) adoptively transferred the previous day outline a B cell follicle. In the lower row movies, the same subcapsular sinus (SCS) area is shown for 40 min 1 hr after pertussis toxin (PTx, 500 ng) injection. Evans blue (red) was co-injected with PTx to visualize the SCS. Indicated numbers in each movie show the distance from SCSM floor to imaged area. All movies have 15 μm of thickness. In part 2, two comparable videos from part one were enlarged and to show the movement of FDCs and B cells. Arrow in PTx treated video shows loss of transient abutments. Time counter is hour:minute:second.
Video 8
b12 B cells attracted to, and in contact with NL4.3-GFP bearing SCSMs, while wild type B cells had much less interest.
TP-LSM live imaging shows behavior of b12 (red) and wild type B (white) cells in inguinal LN. First video shows new arriving B cells in inguinal at 3 hr after NL4.3-GFP (green) injection. FDCs network revealed by injected CD21/35 (blue) antibodies 30 min before imaging. Images were acquired from 40 min after B cell transfer. HEV indicated base on transferred B cell attachment. B cell follicle (white circle) indicated by FDC network spreading. Sinus floor indicated by NL4.3-GFP accumulations in SCSMs. LN capsule was delineated by second harmonic signals (blue). Sinus indicated in between sinus floor and capsule. Second video shows behavior of B cells were adoptively transferred 1 day before the NL4.3-GFP injection. Images were acquired from 1 hr after NL4.3-GFP injection. Tracks of b12 (red) and wild type B cells (blue) were visualized with dragon tail which tracked path of each cells past 20 time points. SCSMs were delineated by NL4.3-GFP accumulations. Time counter is hour:minute:second.
Video 9
b12 B cells and wild type B cells actively probe NL4.3-GFP bearing SCSMs but b12 B cells show longer contact duration and NL4.3-GFP bearing uropods.
TP-LSM live imaging shows behavior of B cells were adoptively transferred 1 day before the NL4.3-GFP injection. Images were acquired from 3 hr after NL4.3-GFP injection. SCSMs were delineated by NL4.3-GFP accumulations. In first video b12 B cell (red) were highlighted with square box to indicate their long contact duration, while wild type B cells (blue) show much less interest. b12 B cell which acquired and accumulated NL4.3-GFP in its uropod is highlighted with white circle. The second video shows a SCSM bearing NL4.3-GFP to which a b12 and wild type B cells interact. Wild type B cell and SCSM contact was indicated with blue circle. The third portion of the video shows a b12 b cell actively probe NL4.3-GFP on SCSM with its filopodia. Final video shows a b12 B cell extracting NL4.3-GFP and pulling away with the VLP localized on its uropod. Time counter is hour:minute:second.
Video 10
b12 B cells actively extracting NL4.3-GFP with their filopodia by directly probing the SCSM MFG-E8+ compartment.
Animation shows 3D-reconstructed images of b12 B cells (blue) associated with NL4.3-GFP (green) bearing SCSMs. b12 B cells were adoptively transferred 1 day before the NL4.3-GFP injection. Thick section from inguinal LN collected 3 hr after VLPs injection was stained with CD169 (purple) and MFG-E8 (red). Arrowhead indicates tight contact between b12 B cell and MFG-E8+ compartment which contains NL4.3-GFP. b12 B cell actively starched filopodia toward MFG-E8+ compartment and accumulated NL4.3-GFP in its cytoplasm.
Tables
Key resources table
| Reagent type (species) or resource | Designation | Source or reference | Identifiers | Additional information |
|---|---|---|---|---|
| Strain, strain background (Mus musculus) | C57BL/6J | The Jackson Laboratory | 000664 | |
| Strain, strain background (Mus musculus) | Ightm1.1(b12)Nemz | (Ota et al., 2013) | Available in The Jackson Laboratory 23065 | A floxed neomycin resistance cassette replaced the DQ52-JH cluster in the Igh locus with HIV antibody b12 variable region coding sequence. Cre-mediated recombination removed the neomycin resistance cassette. |
| Strain, strain background (Mus musculus) | Igktm1.1(b12)Nemz | (Ota et al., 2013) | Available in The Jackson Laboratory 23065 | A floxed neomycin resistance cassette replace the J cluster in the Igk locus with the HIV antibody b12 L chain VJ element. Cre-mediated recombination removed the neomycin resistance cassette. |
| Strain, strain background (Mus musculus) | B6.129P2(Cg)-Cx3cr1tm1Litt/J | The Jackson Laboratory | 23065 | CX3CR1-GFP mice |
| Strain, strain background (Mus musculus) | Mfg-e8-/- (MFG-E8 KO) | (Neutzner et al., 2007) | Milk Fat Globule-EGF Factor 8 (MFG-e8) deficient mice | |
| Transfected construct (Human immunodeficiency virus type 1) | pCMV NL4-3 Gag-eGFP | (Guzzo et al., 2017) | Dr. Walter Mothes (Yale University) | Plasmid for NL4.3-GFP VLPs |
| Transfected construct (Human immunodeficiency virus type 1) | pCMV NL4-3 Gag-mCherry | This paper (Materials and methods section) | Dr. John Kehrl (NIAID/NIH) | Plasmid for NL4.3-mCherry VLPs |
| Transfected construct (Human immunodeficiency virus type 1) | HIV-1 NL4-3 Gag-iGFP ΔEnv | NIH AIDS Reagent Program | 12455 | Plasmid for delta-Env NL4.3-GFP VLPs |
| Transfected construct (Friend murine leukemia virus) | pSV-A-MLV-env | NIH AIDS Reagent Program | 1065 | Plasmid for MLV VLPs |
| Transfected construct (Friend murine leukemia virus) | pSV-Ψ-MLV-env- | NIH AIDS Reagent Program | 3422 | Plasmid for MLV VLPs |
| Transfected construct (Friend murine leukemia virus) | MLV Gag-RFP | Addgene | 1814 | Plasmid for MLV VLPs |
| Chemical compound, drug | 1,2-dioleoyl-sn-glycero-3-phosphocholine (DOPC) | Avanti Polar Lipids | 850375 | |
| Chemical compound, drug | 1-oleoyl-2-{6-((7-nitro-2–1,3-benzoxadiazol-4-yl)amino)hexanoyl}-sn-glycero-3-phosphocholine (NBD-PC) | Avanti Polar Lipids | 810132 | |
| Chemical compound, drug | 1,2-dioleoyl-sn-glycero-3-phospho-L-serine (DOPS) | Avanti Polar Lipids | 840035 | |
| Chemical compound, drug | 4-Hydroxy-3-nitrophenylacetyl hapten-Phycoerythrin (NP-PE) | Biosearch Technologies | N-5070–1 | |
| Chemical compound, drug | Pertussis toxin (PTX) | Millipore Sigma | 70323-44-3 | |
| Antibody | αv blocking antibody (αCD51) (RMV-7), (Rat monoclonal) | BioLegend | 104108 | in vivo blocking (10 µg) |
| Antibody | Mouse MFG-E8 Antibody (Clone# 340614), (Rat monoclonal) | R and D Systems | MAB2805 | Dilution factor for FACS (1:500), Section (1:1000) |
| Antibody | Human MFG-E8 Antibody (Clone# 278918), (Mouse monoclonal) | R and D Systems | MAB27671 | Dilution factor for FACS (1:500) |
| Antibody | Anti-Mouse Follicular Dendritic Cell (FDC-M1), (Rat monoclonal) | BD Biosciences | 551320 | Dilution factor for section (1:1000) |
| Antibody | anti-human αvβ3 integrin (23C6), (Mouse monoclonal) | BioLegend | 304413 | Dilution factor for FACS (1:500) |
| Antibody | anti-mouse CD21/35 (7E9), (Rat monoclonal) | BioLegend | 123421, 123411, 123409 | BV421, PE, APC, Dilution factor for section (1:1000) |
| Antibody | anti-mouse CD35 (8C12), (Rat monoclonal) | BD Biosciences | 740029 | Dilution factor for section (1:1000) |
| Antibody | anti-mouse CD169 (3D6.112), (Rat monoclonal) | BioLegend | 142403 | Dilution factor for FACS (1:600), Section (1:1500) |
| Antibody | Anti-HIV-1 gp120 Monoclonal (VRC01), (Human monoclonal) | NIH AIDS Reagent Program | 12033 | Dilution factor for FACS (1:500) |
| Peptide, recombinant protein | Recombinant Mouse MFG-E8 Protein | R and D Systems | P21956 | |
| Peptide, recombinant protein | Recombinant Human MFG-E8 Protein | R and D Systems | Q08431 | |
| Peptide, recombinant protein | Recombinant Human EDIL-3 Protein | R and D Systems | 6046-ED-050 | |
| Peptide, recombinant protein | Recombinant Human Integrin alpha V beta 3 Protein | R and D Systems | 2308-VN | |
| Peptide, recombinant protein | Cyclo(-RGDyK) | AnaSpec | AS-61183–5 | |
| Commercial assay or kit | TransIT-293 Transfection Reagent | Mirus Bio LLC | MIR 2704 | |
| Software, algorithm | Imaris software v.9.0.1 64x | Oxford Instruments plc | https://imaris.oxinst.com/ | |
| Software, algorithm | LSA AF Lite software | Leica Microsystem | https://www.leica-microsystems.com/ | |
| Software, algorithm | FlowJo | BD Biosciences | https://www.flowjo.com/solutions/flowjo | |
| Software, algorithm | Prism software | GraphPad Software | https://graphpad.com |
Additional files
Download links
A two-part list of links to download the article, or parts of the article, in various formats.
Downloads (link to download the article as PDF)
Open citations (links to open the citations from this article in various online reference manager services)
Cite this article (links to download the citations from this article in formats compatible with various reference manager tools)
An integrin/MFG-E8 shuttle loads HIV-1 viral-like particles onto follicular dendritic cells in mouse lymph node
eLife 8:e47776.
https://doi.org/10.7554/eLife.47776


