A single clonal lineage of transmissible cancer identified in two marine mussel species in South America and Europe
- Pacific Northwest Research Institute, United States
- Howard Hughes Medical Institute, United States
- ISEM, Université de Montpellier, CNRS- EPHE-IRD, France
- IHPE, Université de Montpellier, CNRS-Ifremer-UPVD, France
- Instituto de Biología de Organismos Marinos (IBIOMAR) (CCT CONICET - CENPAT), Argentina
- Universidad Andres Bello, Chile
- LABÉO Frank Duncombe, France
- Environmental Resources Management, Canada
- Environment and Climate Change Canada, Canada
- University of British Columbia, Canada
- Columbia University Medical Center, United States
- FRE BOREA, MNHN, UPMC, UCN, CNRS-7208, IRD-207, Université de Caen Normandie, France
Figures
Figure 1
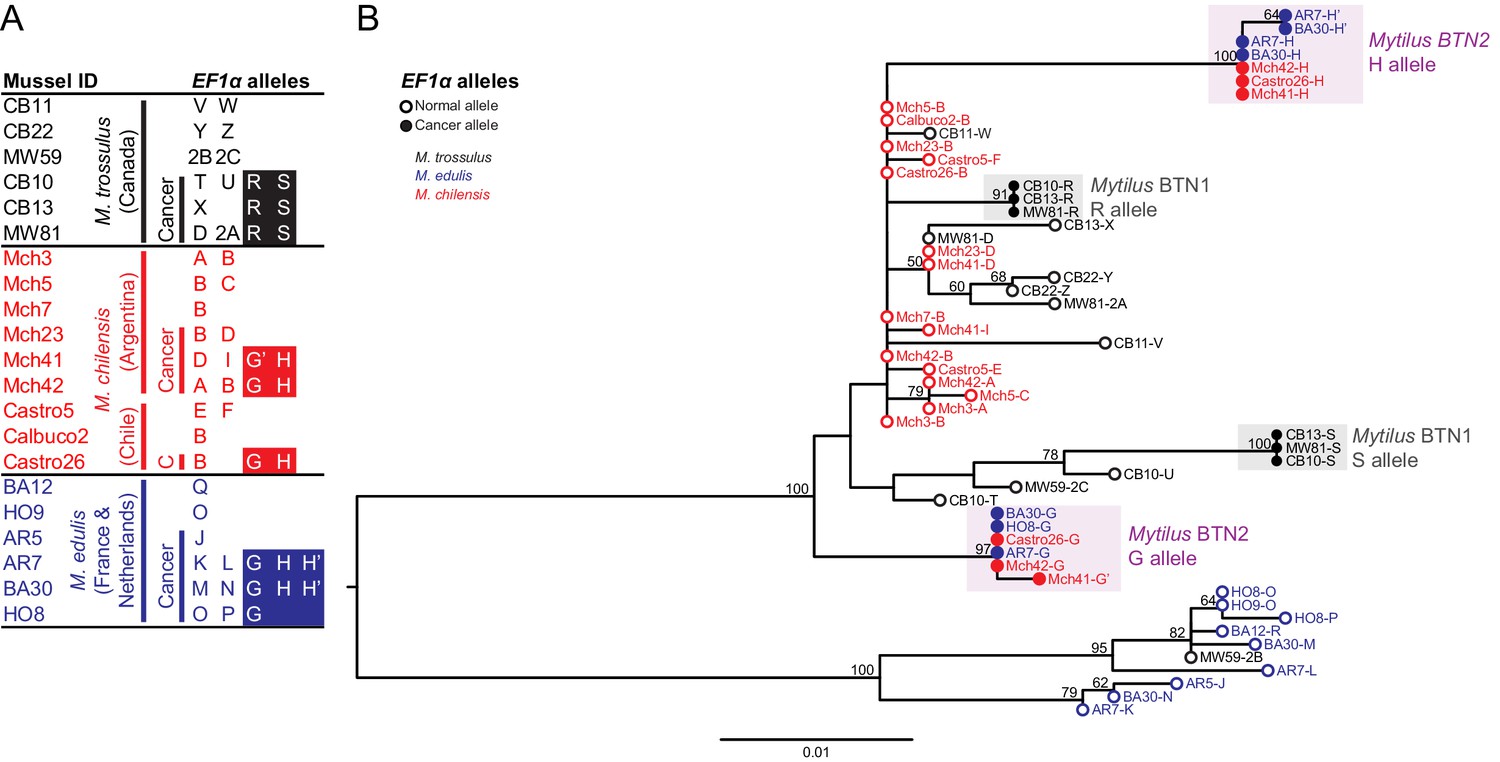
Phylogenetic analysis of EF1α alleles from normal and diseased mussels.
The EF1α locus was amplified, and multiple alleles were cloned from different individual normal and diseased mussels of different species and locations: M. trossulus from BC (black), M. chilensis from Argentina and Chile (red), and M. edulis from France and the Netherlands (blue). (A) A list of cloned alleles is shown, with filled boxes marking cancer-associated alleles. (B) Phylogenetic analysis of aligned alleles shows groups of related alleles (see Figure 1—source data 1). Names of alleles on the tree specify individual ID and allele ID. Open circles mark alleles from normal individuals and host alleles from diseased individuals. Filled circles mark cancer-associated alleles on the tree (colored by host species). The tree was rooted at the midpoint, with bootstrap values below 50 removed. Model used was HKY85+G. The scale bar marks genetic distance.
-
Figure 1—source data 1
FASTA formatted text file of EF1α sequence alignment.
- https://doi.org/10.7554/eLife.47788.004
Figure 2
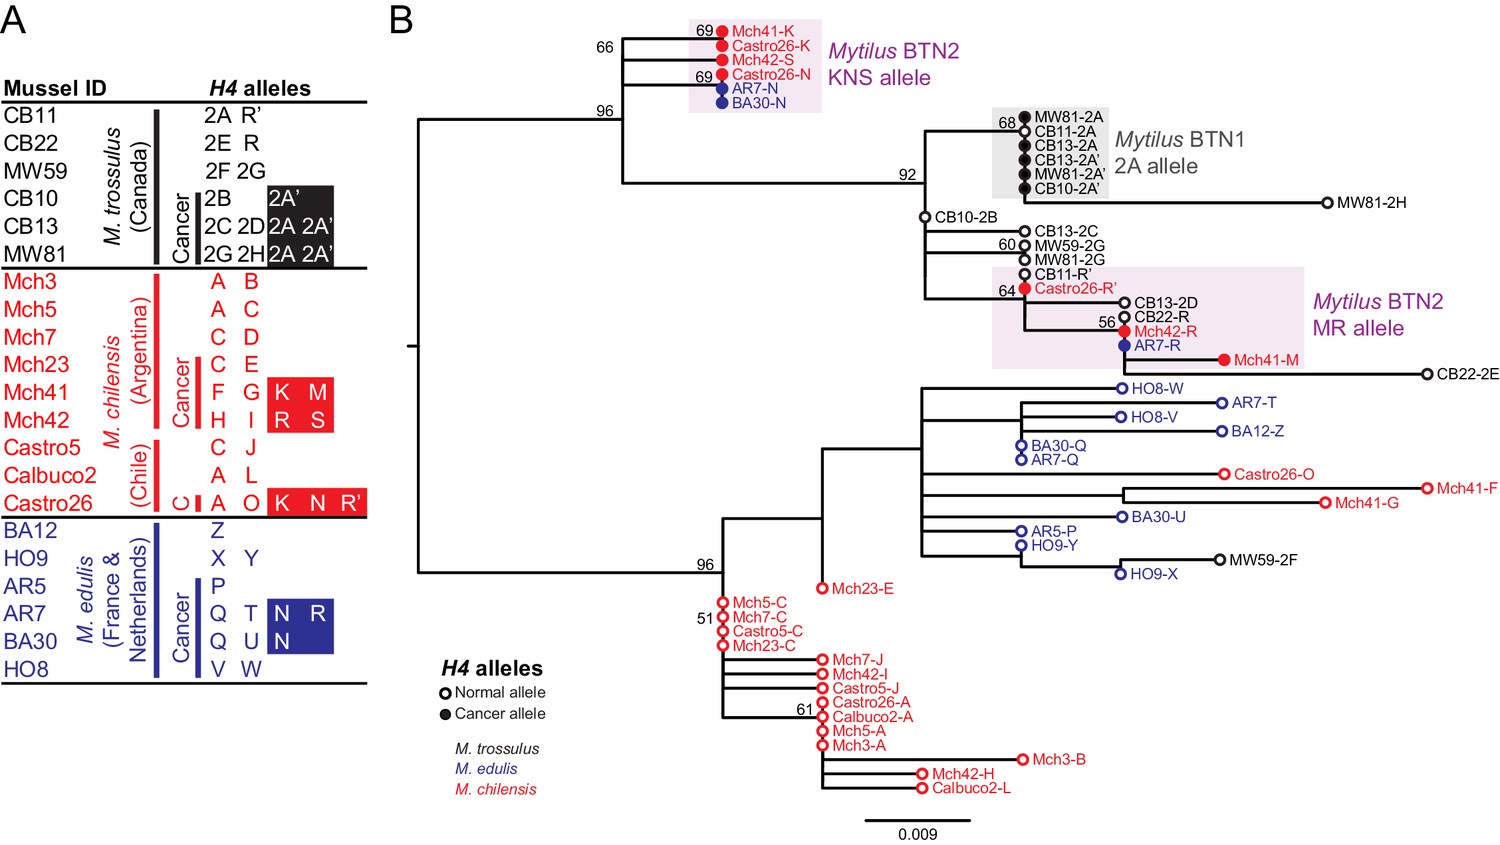
Phylogenetic analysis of H4 alleles from normal and diseased mussels.
The H4 locus was amplified, and multiple alleles were cloned from different individual normal and diseased mussels of different species and locations: M. trossulus from BC (black), M. chilensis from Argentina and Chile (red), and M. edulis from France and the Netherlands (blue). (A) A list of cloned alleles is shown, with filled boxes marking cancer-associated alleles. (B) Phylogenetic analysis of aligned alleles shows groups of related alleles (see Figure 2—source data 1). Names of alleles on the tree specify individual ID and allele ID. Open circles mark alleles from normal individuals and host alleles from diseased individuals. Closed circles mark cancer-associated alleles (colored by host species). The tree was rooted at the midpoint, with bootstrap values below 50 removed. Model used was HKY85+I. The scale bar marks genetic distance. Three sequences (AR7-2I, BA30-2J, and Castro26-2J) are consistent with recombination between the two cancer-associated alleles and were removed from the tree for clarity. The two alleles identified in the Mytilus BTN1 lineage (2A and 2A’) are distinguished by a unique single base deletion in 2A’, which does not show up as a difference in the tree, as gaps are treated as missing data.
-
Figure 2—source data 1
FASTA formatted text file of H4 sequence alignment.
- https://doi.org/10.7554/eLife.47788.006
Figure 3
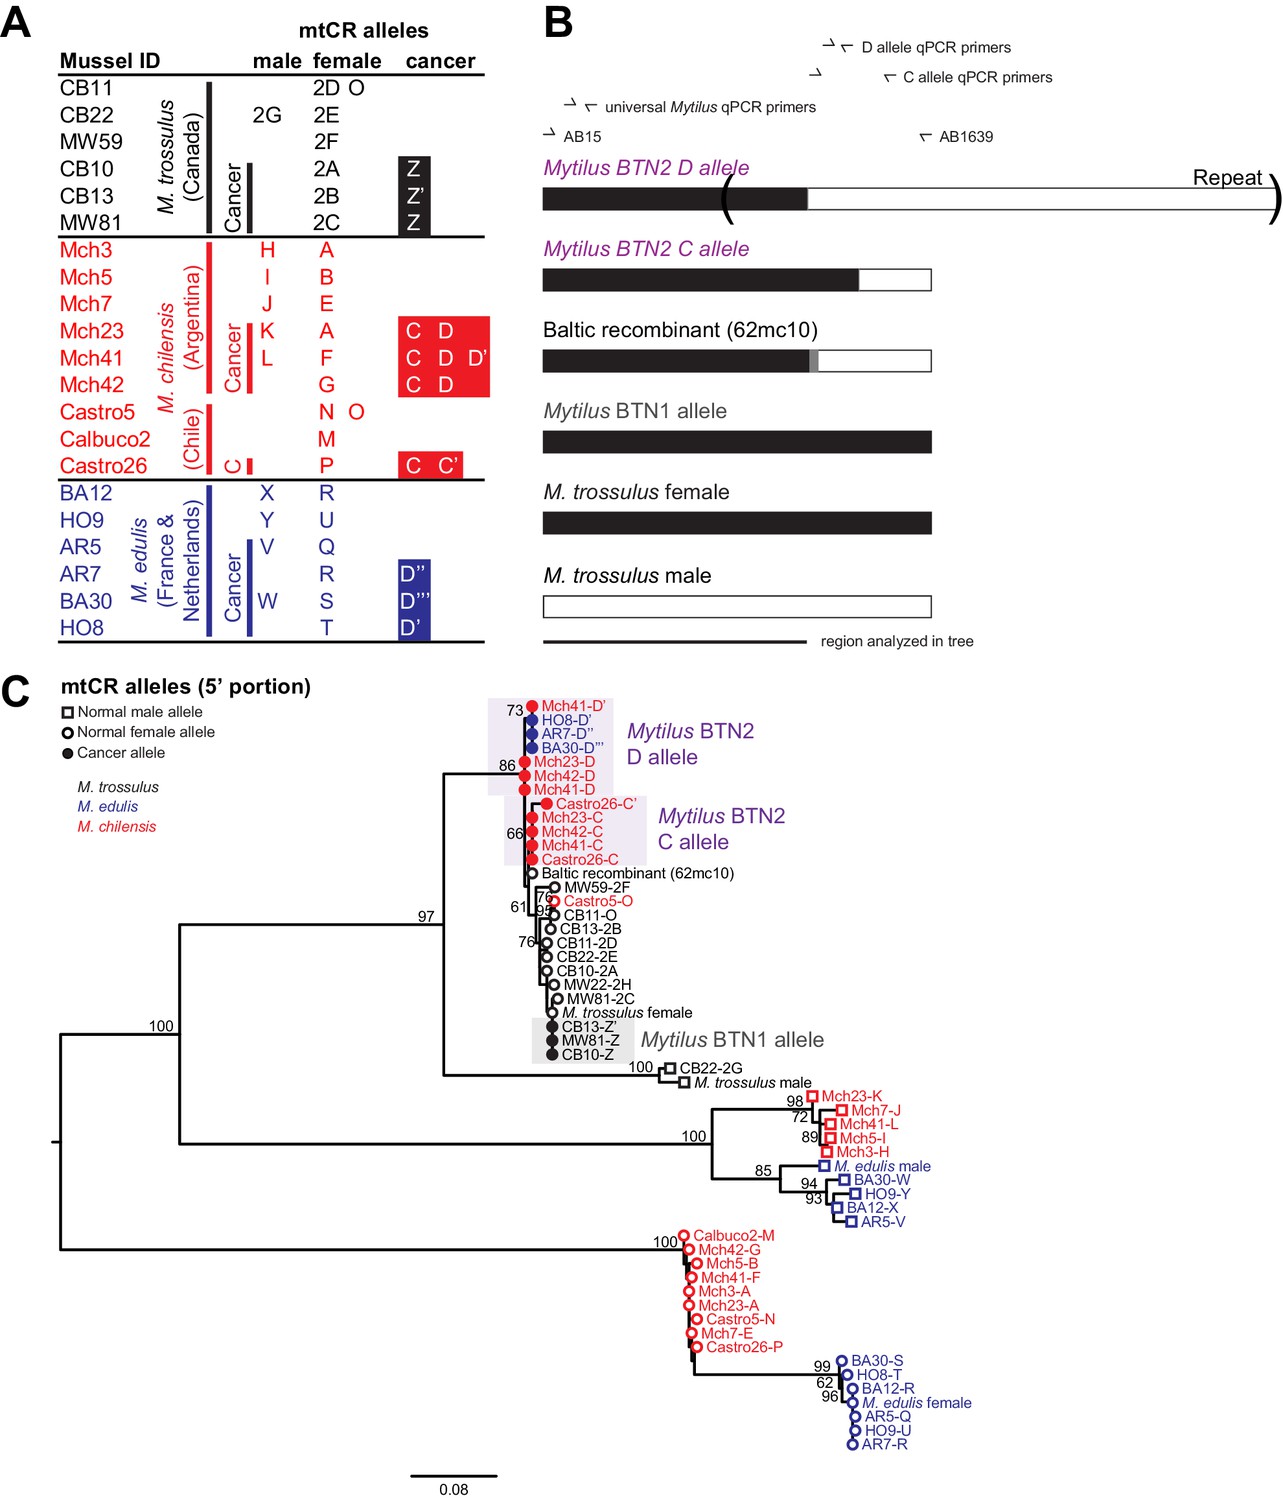
Phylogenetic analysis of mitochondrial CR alleles from normal and diseased mussels.
The CR region of mitochondrial DNA was amplified, and multiple alleles were cloned from different individual normal and diseased mussels of different species and locations: M. trossulus from BC (black), M. chilensis from Argentina and Chile (red), and M. edulis from France and the Netherlands (blue). (A) A list of cloned alleles is shown, with filled boxes marking cancer-associated alleles. (B) A schematic of the rearrangement found in the cancer-associated alleles is shown with black boxes representing female-derived sequence and white boxes representing male-derived sequence (gray bars represent the likely recombination region). Parentheses mark the repeat region in allele D. (C) Phylogenetic analysis of aligned alleles shows groups of related alleles (see Figure 3—source data 1). Names specify individual ID and allele ID. Alleles from normal individuals and host alleles from diseased individuals are marked with open circles (female allele) and open squares (male allele). Closed circles mark cancer-associated alleles (colored by host species). The tree was rooted at the midpoint, with bootstrap values below 50 removed. Model used was GTR+I. The scale bar marks genetic distance. Multiple male alleles were identified in M. chilensis samples, and a representative with the greatest number of clones was chosen for each individual. Reference sequences include female M. trossulus (AY823625.1), male M. trossulus (HM462081.1), female M. edulis (DQ198231.2), male M. edulis (AY823623.1), and the M. trossulus recombinant 62cm10 (KM192133.1).
-
Figure 3—source data 1
FASTA formatted text file of mtCR sequence alignment.
- https://doi.org/10.7554/eLife.47788.008
Figure 4
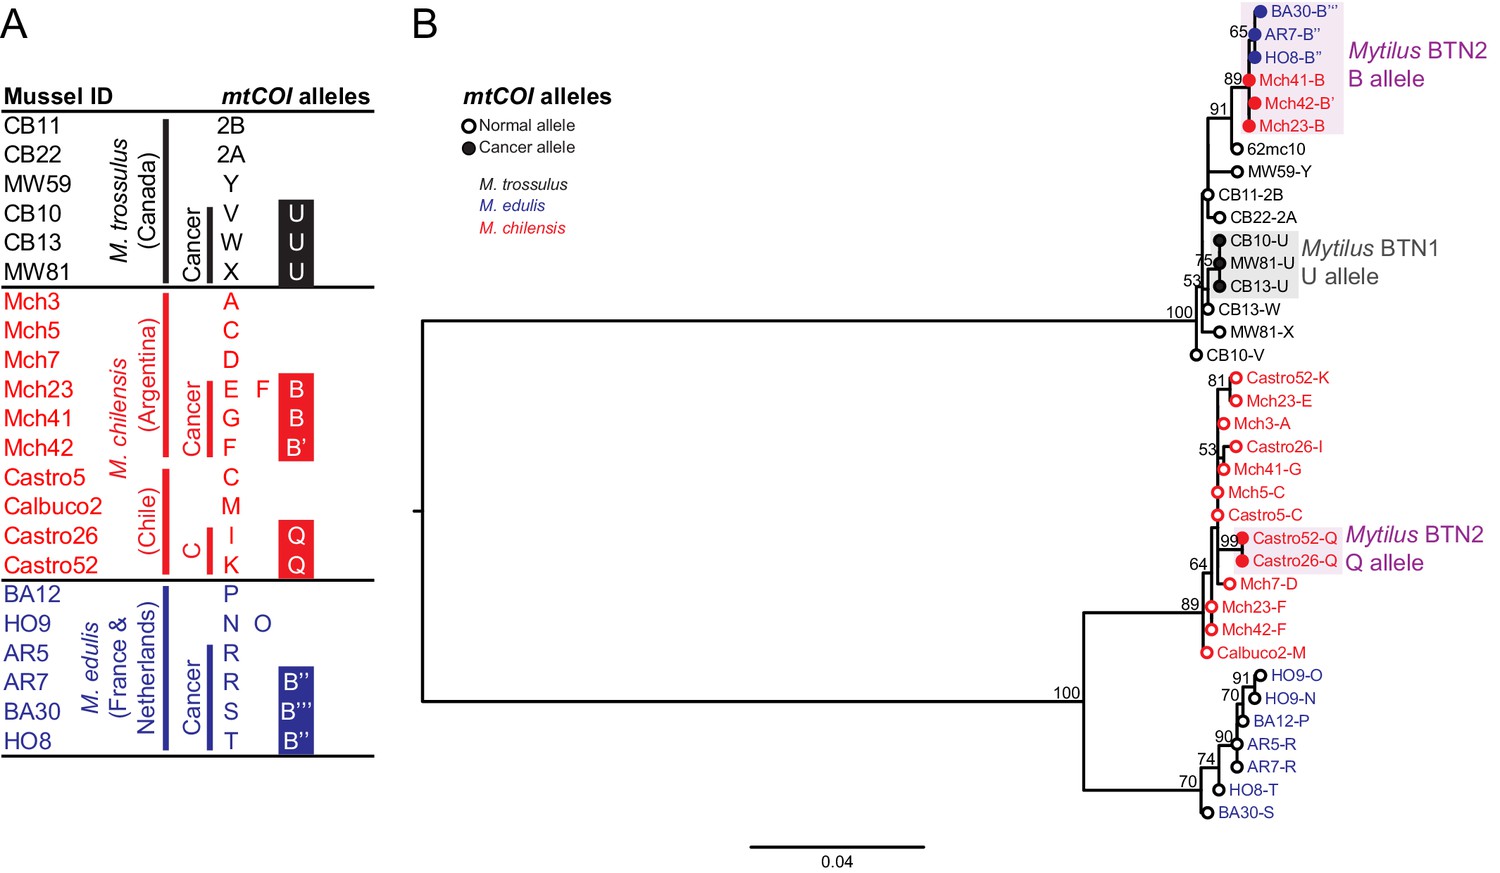
Phylogenetic analysis of mitochondrial COI alleles from normal and diseased mussels.
The mtCOI locus was amplified, and multiple alleles were cloned from different individual normal and diseased mussels of different species and locations: M. trossulus from BC (black), M. chilensis from Argentina and Chile (red), and M. edulis from France and the Netherlands (blue). (A) A list of cloned alleles is shown, with filled boxes marking cancer-associated alleles. (B) Phylogenetic analysis of aligned alleles shows groups of related alleles (see Figure 4—source data 1). Names of alleles on the tree specify individual ID and allele ID. Open circles mark alleles from normal individuals and host alleles from diseased individuals. Closed circles mark cancer-associated alleles (colored by host species). The tree was rooted at the midpoint, with bootstrap values below 50 removed. Model used was GTR+G. The scale bar marks genetic distance. An additional Chilean sample was used for cloning (Castro52) as Castro26 showed difference from the other samples at this locus and a second sample was needed to infer the cancer-associated allele and confirm the mitochondrial replacement. One clone obtained from Castro26 was a recombinant between a M. trossulus-like sequence and an M. chilensis-like sequence, and it was excluded from the phylogenetic tree for clarity.
-
Figure 4—source data 1
FASTA formatted text file of mtCOI sequence alignment.
- https://doi.org/10.7554/eLife.47788.010
Figure 5
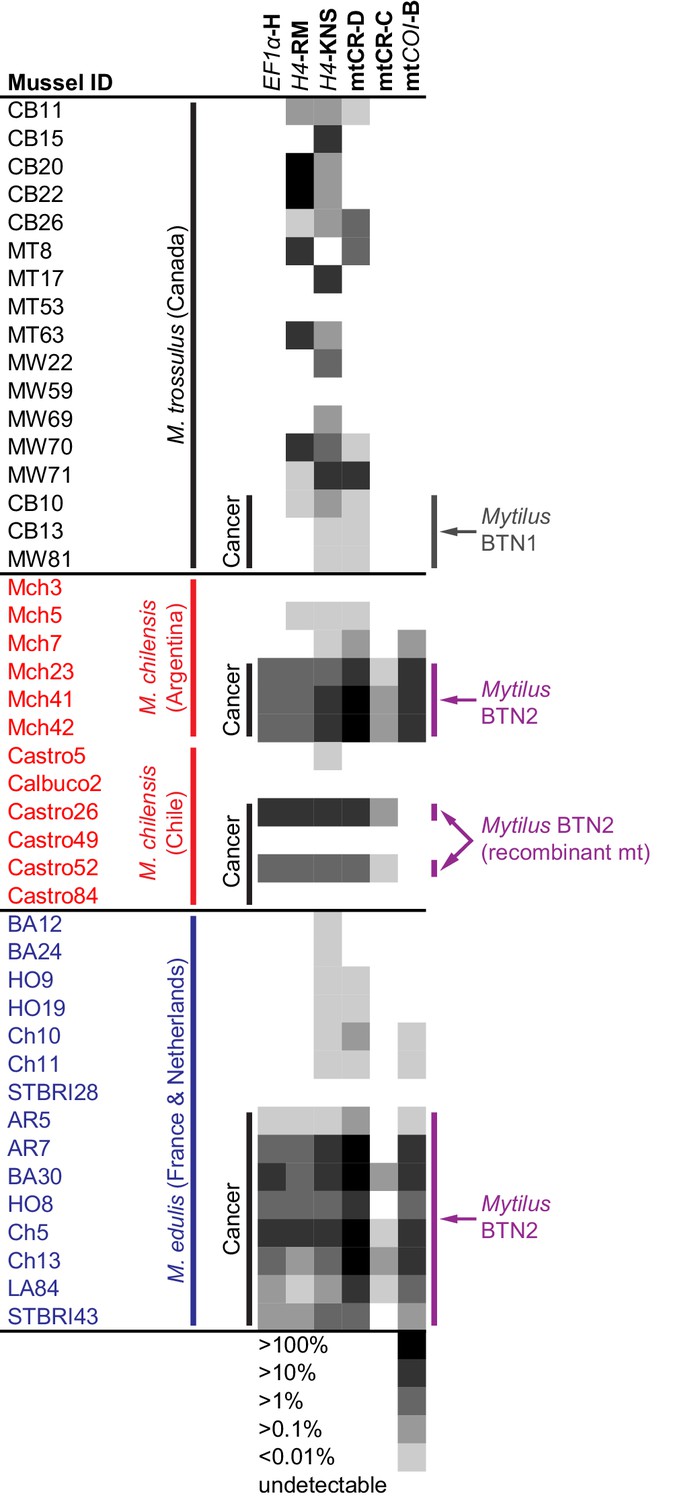
qPCR of multiple loci confirms the presence of the cancer lineage in M. trossulus and M. edulis from multiple populations.
Allele-specific qPCR was conducted to determine the fraction of cancer-associated alleles at the four loci: allele H at EF1α, allele RM and KNS at H4, allele C and D at mtCR, and allele B at mtCOI (see Figure 5—source data 1). Boxes show whether the cancer-specific allele is undetectable or detectible, with a heatmap showing the fraction of the total alleles at each locus that correspond to the specific allele (the quantity of amplification with an allele-specific qPCR reaction divided by the quantity amplified with ‘universal’ Mytilus primers). Each individual mussel is marked with its ID, species, and location, and each animal that was diagnosed as containing disseminated neoplasia is marked ‘Cancer’.
-
Figure 5—source data 1
Tab separated text file with qPCR data (U means undetectable).
- https://doi.org/10.7554/eLife.47788.012
Figure 6
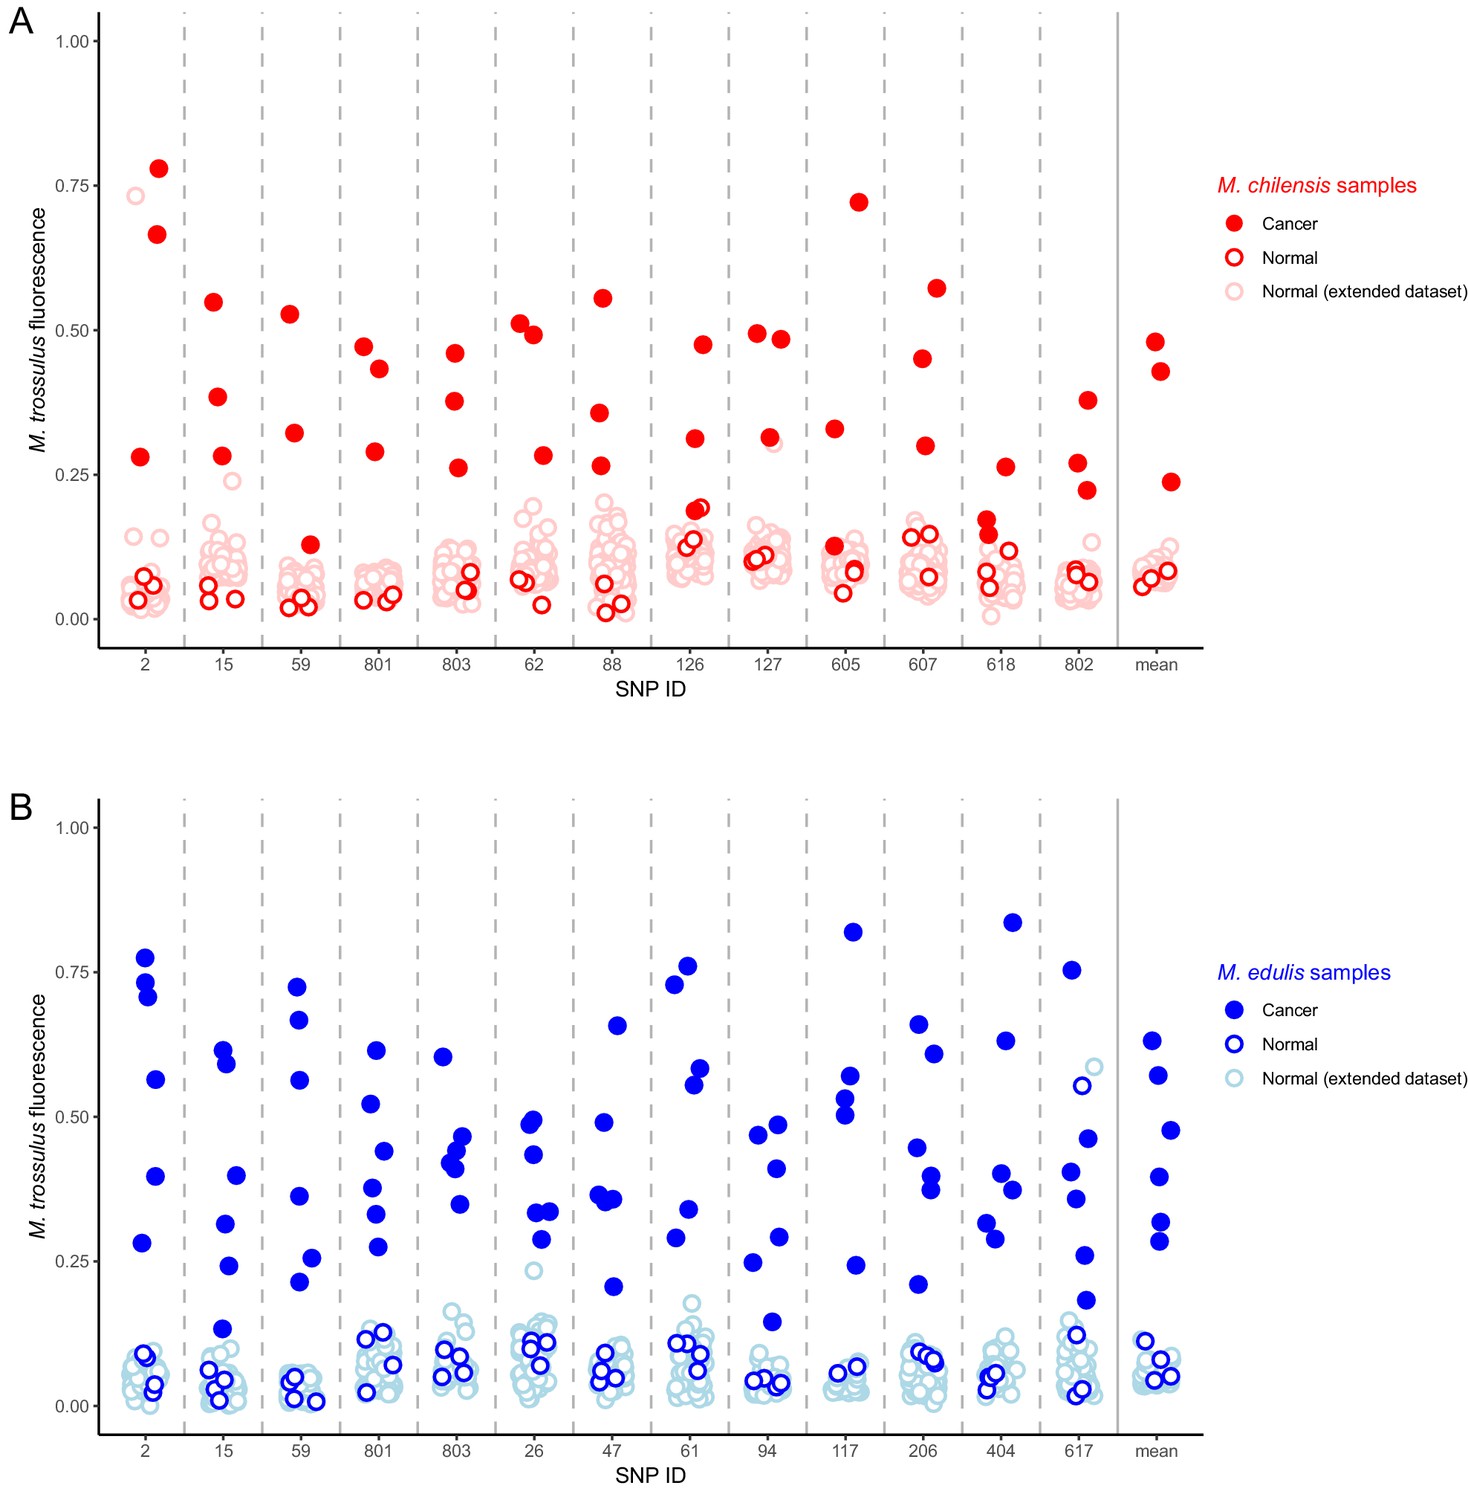
Identification of M. trossulus-specific SNPs in M. chilensis and M. edulis samples.
Cancer and normal samples of (A) M. chilensis from Argentina and (B) M. edulis from Europe were analyzed for the presence of 13 SNPs that are diagnostic for M. trossulus alleles. The fraction of the fluorescence attributable to the M. trossulus allele is shown for each SNP, and the mean multi-locus estimate is shown on the right. SNP IDs indicate shortened names of the specific nuclear SNP loci used (see Supplementary file 3). Red points indicate M. chilensis and blue indicate M. edulis. Dark filled circles represent cancer samples, dark open circles represent normal samples which were a part of the sequence and qPCR analysis (Figures 1–4), and light open circles represent samples from an extended set of normal individuals from the same populations. Cancer samples included: Mch23, Mch41, and Mch42 for M. chilensis, and BA30, HO8, Ch5, Ch13, LA84, and STBRI43 from M. edulis. Normal samples included Mch3, Mch5, and Mch7 for M. chilensis, and HO9, HO19, Ch10, and Ch11 for M. edulis, as well as 109 additional normal M. chilensis and 62 additional normal M. edulis. See Figure 6—source data 1 for M. chilensis data and Figure 6—source data 2 for M. edulis data.
-
Figure 6—source data 1
Comma separated text file with SNP data from M. chilensis samples.
- https://doi.org/10.7554/eLife.47788.014
-
Figure 6—source data 2
Comma separated text file with SNP data from M. edulis samples.
- https://doi.org/10.7554/eLife.47788.015
Figure 7

Map of the spread of Mytilus BTN1 and 2.
The locations of all collections in the current study are shown with circles. Diseased animals were found at all collection locations. The species collected at each location is marked. The Mytilus BTN1 lineage (gray) was only identified in M. trossulus populations in BC, Canada, while the Mytilus BTN2 lineage (purple) was identified in both M. edulis and M. chilensis populations in both the Pacific and Atlantic Oceans. Both cancer lineages originated in an M. trossulus individual, although the exact locations of the origins are unknown. The direction of spread of these cancers is unknown. Winkel-Tripel map was created by Flappiefh (Wikimedia Commons) using gringer's perlshaper script, and Natural Earth (naturalearthdata.com).
Additional files
-
Supplementary file 1
Table of PCR primers used for amplification and sequencing.
- https://doi.org/10.7554/eLife.47788.017
-
Supplementary file 2
Table of qPCR primers used.
- https://doi.org/10.7554/eLife.47788.018
-
Supplementary file 3
Table of diagnostic SNP loci used to discriminate M. trossulus from M. edulis and M. chilensis.
- https://doi.org/10.7554/eLife.47788.019
-
Transparent reporting form
- https://doi.org/10.7554/eLife.47788.020
Download links
A two-part list of links to download the article, or parts of the article, in various formats.
Downloads (link to download the article as PDF)
Open citations (links to open the citations from this article in various online reference manager services)
Cite this article (links to download the citations from this article in formats compatible with various reference manager tools)
A single clonal lineage of transmissible cancer identified in two marine mussel species in South America and Europe
eLife 8:e47788.
https://doi.org/10.7554/eLife.47788


