Site-specific phosphorylation and caspase cleavage of GFAP are new markers of Alexander disease severity
- University of North Carolina, United States
- University of Durham, United Kingdom
- Thermo Fisher Scientific, United States
- Columbia University, United States
- National Tsing Hua University, Taiwan, Republic of China
- Mie University Graduate School of Medicine, Japan
Figures
Figure 1 with 1 supplement
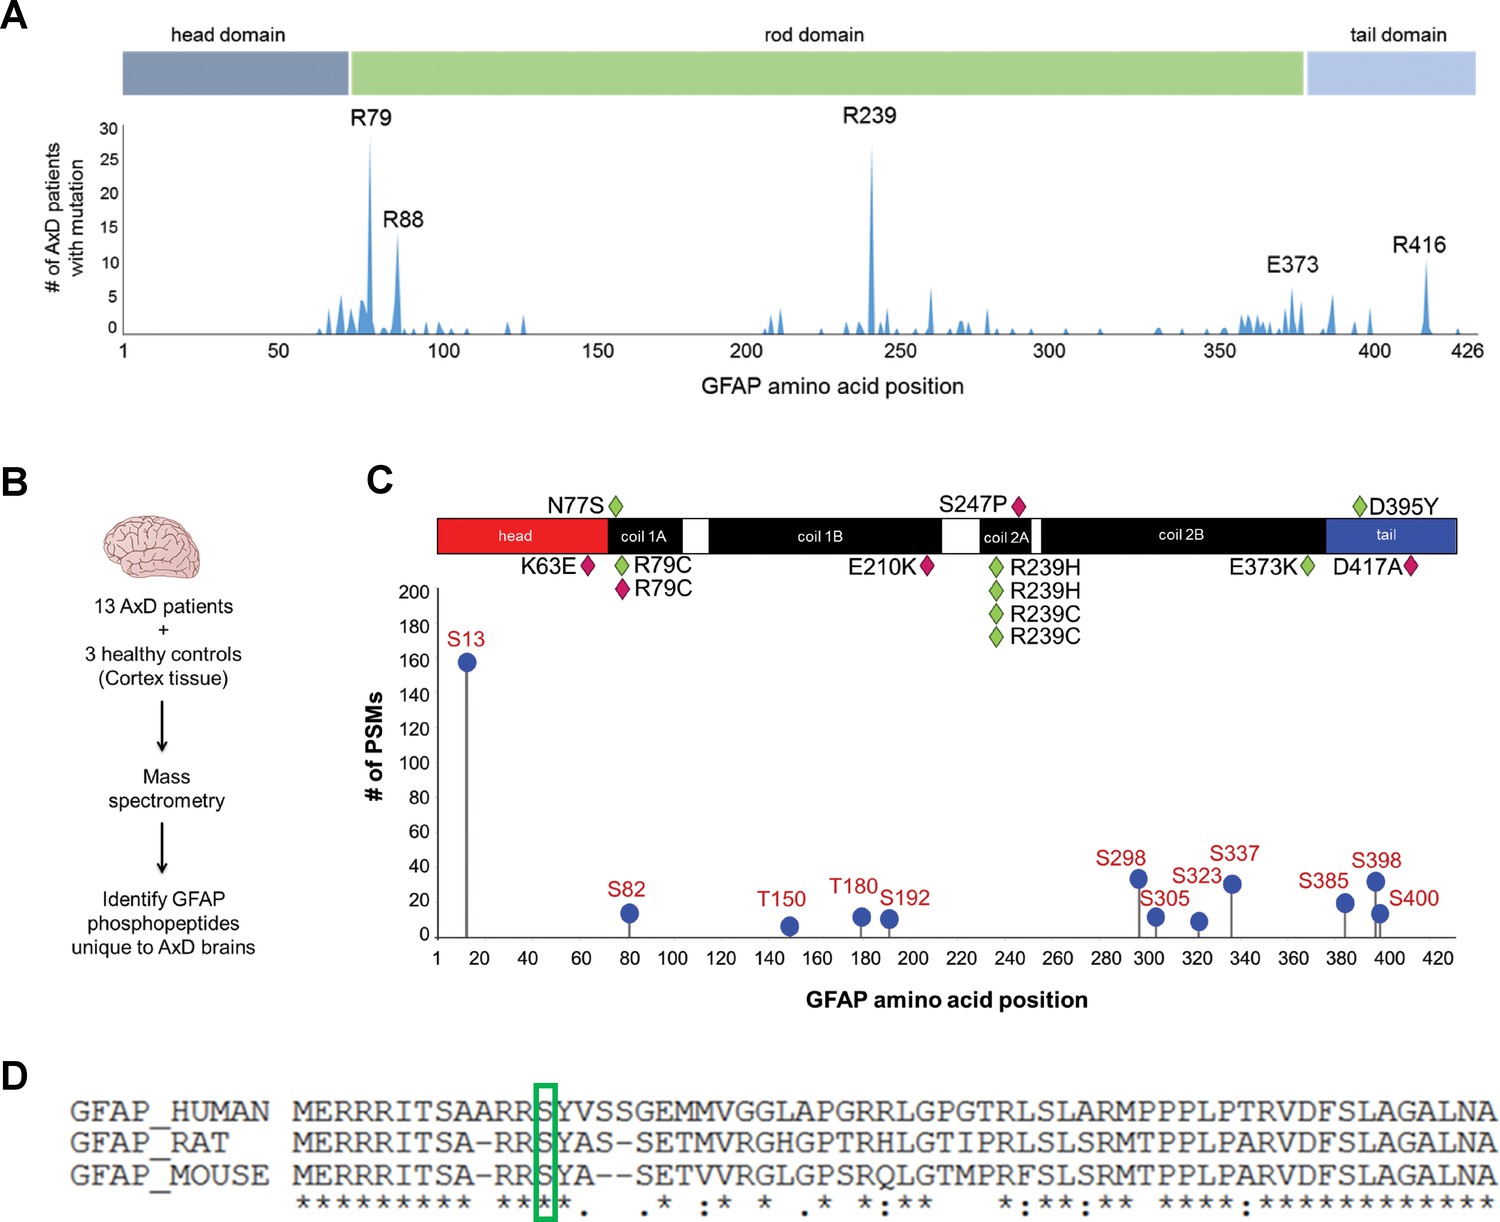
GFAP is phosphorylated on head domain Ser13 in human AxD brain.
(A) Schematic displays the frequency and location of AxD patient GFAP mutations. (B) Method used to identify GFAP phospho-peptides. (C) Graph of AxD-specific GFAP phospho-peptides identified by mass spectrometry and type/position of patient mutations. PSM = peptide spectrum match. Green diamonds represent GFAP mutations in young patients (median age at death = 1.7 years; range 0.5–14 years) and pink diamonds represent older patients (median age at death = 38 years; range 27–50 years). (D) Amino acid conservation at the N-terminus of human, rat and mouse GFAP. The green box indicates the serine corresponding to human Ser13, which is conserved in rat and mouse.
Figure 1—figure supplement 1

Preparation of brain high salt extracts (HSE) for mass spectrometry analysis of GFAP.
Isolation of intermediate filament proteins using high salt extraction. Shown is an abbreviated version of the protocol referenced in Materials and methods. Adopted from Snider & Omary, Methods in Enzymology 2016. In the panel on the right, purified GFAP is resolved in parallel with a representative HSE from an AxD patient brain cortex tissue. Arrow points to the band that was excised for MS/MS phospho-proteomic analysis.
Figure 2

GFAP is phosphorylated on head domain Ser13 primarily in AxD brain from young patients.
(A) Quantification of pSer13-GFAP abundance by mass spectrometry in young (green) vs. old (pink) AxD patients (*=p < 0.05 unpaired t-test). (B) Validation of pSer13-GFAP by western blot of HSE from AxD patients, using a phospho-specific antibody to pSer13-GFAP. The order of samples, by AxD donor ID number, is: 1482, 1070, 885, 5488, 1161, 2768, 338, 613, 5377, 5517, M3596, 5109, and 4858 (listed in Supplementary file 1). (C) Quantification of the relative intensity of pSer13-GFAP on western blot in young (green) and old (pink) AxD patients (*=p < 0.05 unpaired t-test). Signal intensity was normalized to total GFAP in each sample. (D) Western blot of pSer13-GFAP in non-AxD control brain lysates of different ages. The order of samples, by donor ID number, is: 1547, 5941, 103, 1791, 1670, 4898, 1706, 1711, 1011, 632, 4640, and 4915 (listed in Supplementary file 2).
-
Figure 2—source data 1
Raw data from mass spectrometry PTM profiling of GFAP extracted from AxD and control human brain.
- https://cdn.elifesciences.org/articles/47789/elife-47789-fig2-data1-v2.xlsx
Figure 3 with 1 supplement

Effect of phospho-deficient and phospho-mimic S13 substitutions on GFAP filament assembly in cells and in vitro.
(A) Representative images of immunofluorescence staining of DNA (blue) and GFAP (green) in SW13vim- cells transfected with wild-type GFAP (WT), R79H mutant GFAP (R79H), non-phosphorylatable GFAP (S13A), and phospho-mimic GFAP (S13D and S13E) as single or double mutations, as noted in the images. Scale bar = 5 µm. (B) Quantification of percentage of cells containing GFAP filaments, aggregates or both (n = 41–103 cells per condition). RH = R79H; SA = S13A; SD = S13D; SE = S13E. (C) Electron micrographs showing the filament properties of in vitro assembled GFAP (WT, S13A and S13D). Bottom three panels represent magnified areas marked by the white boxes in the top panels. Scale bars = 500 nm.
Figure 3—figure supplement 1

Optimization of transient expression for WT and AxD-associated GFAP mutant proteins in SW13vim- cells.
(A) Western blot of SW13vim- cells transfected for 24 hr with the designated GFAP constructs. NTC, non-transfected control. Top and bottom blots show GFAP and pan-actin, respectively, in the Triton X-100-soluble fraction (TX-100). Middle blot is a total cell lysate (TCL) blot of GFAP from the same transfections. (B) Corresponding immunofluorescence staining of GFAP in SW13vim- cells after 24 hr of transfection. Scale bars = 10 µm.
Figure 4 with 2 supplements
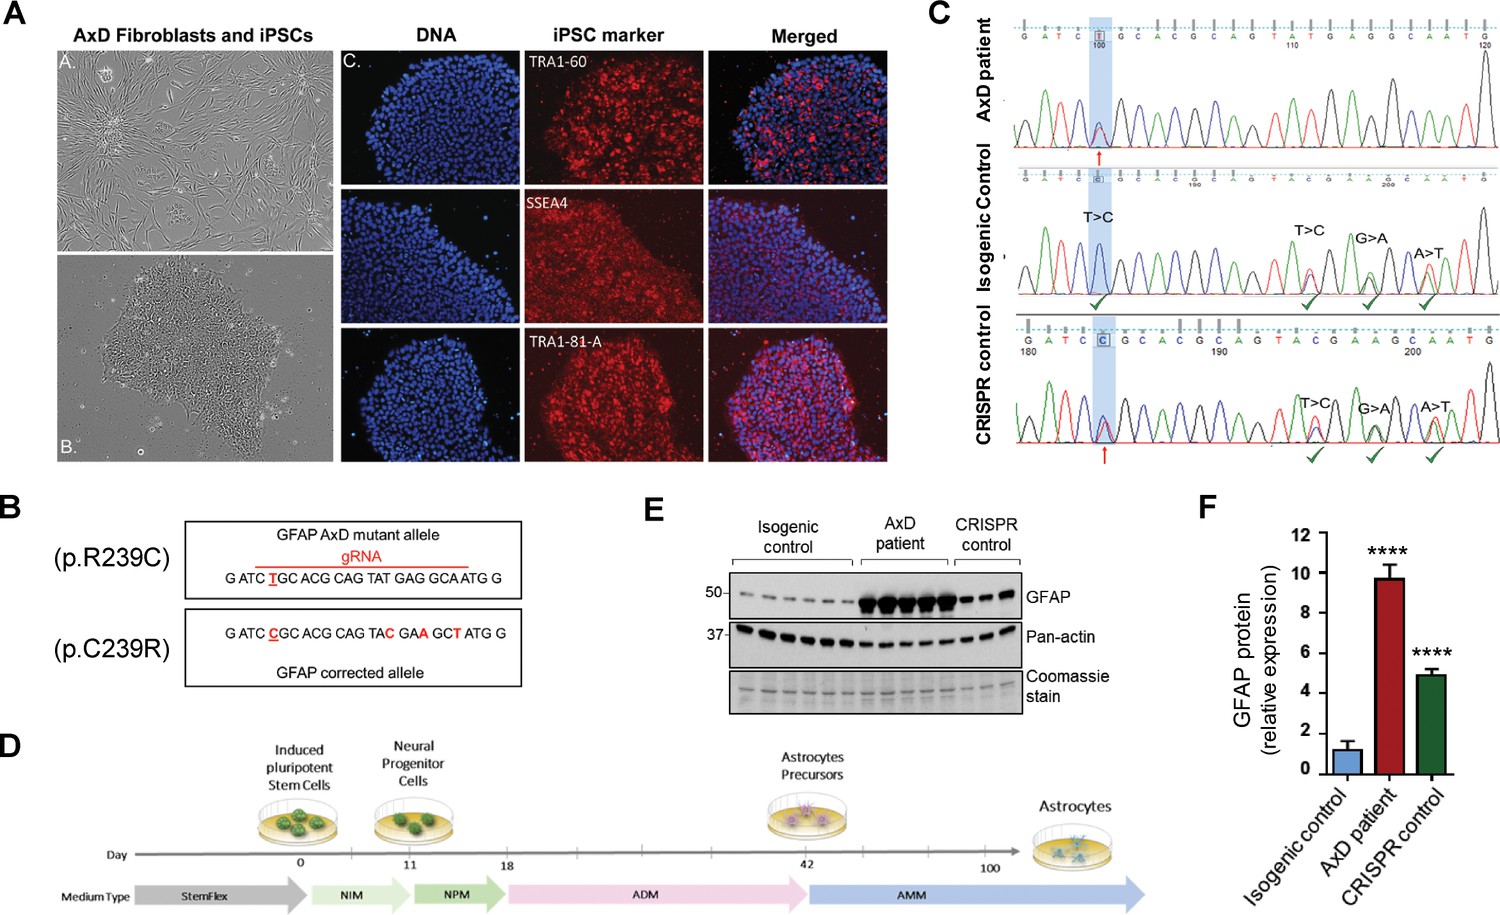
Generation and characterization of AxD patient iPSC-astrocytes and isogenic controls.
(A) Characterization of iPSC pluripotency. Bright field images of AxD patient fibroblasts (top left) and iPSCs (bottom left). Immunofluorescence staining for pluripotency markers in AxD iPSCs. (B) GFAP sequence for the AxD mutant allele and the corrected allele. Differences between the sequences are indicated by red text. The AxD-causing mutation is underlined, and all other changes are silent mutations. The area of gRNA recognition is indicated by the red line. (C) Chromatograms showing AxD heterozygous mutation in the original patient cells (top), correction of the mutant allele in the isogenic control (middle) and correction of the wild-type allele in the CRISPR control (bottom). Red arrows denote presence of the disease mutation and green check mark denote genetic correction and presence of silent mutations. (D) Schematic representation of astrocyte differentiation protocol. NIM, neural induction medium; NPM; neural progenitor medium; ADM, astrocyte differentiation medium; AMM; astrocyte maturation medium. (E) Immunoblot of GFAP in iPSC-astrocytes. Pan-actin blot and Coomassie stain serve as loading controls. (F) Quantification of band intensities for GFAP from panel E. ****p<0.0001 compared to isogenic control; one-way ANOVA.
Figure 4—figure supplement 1
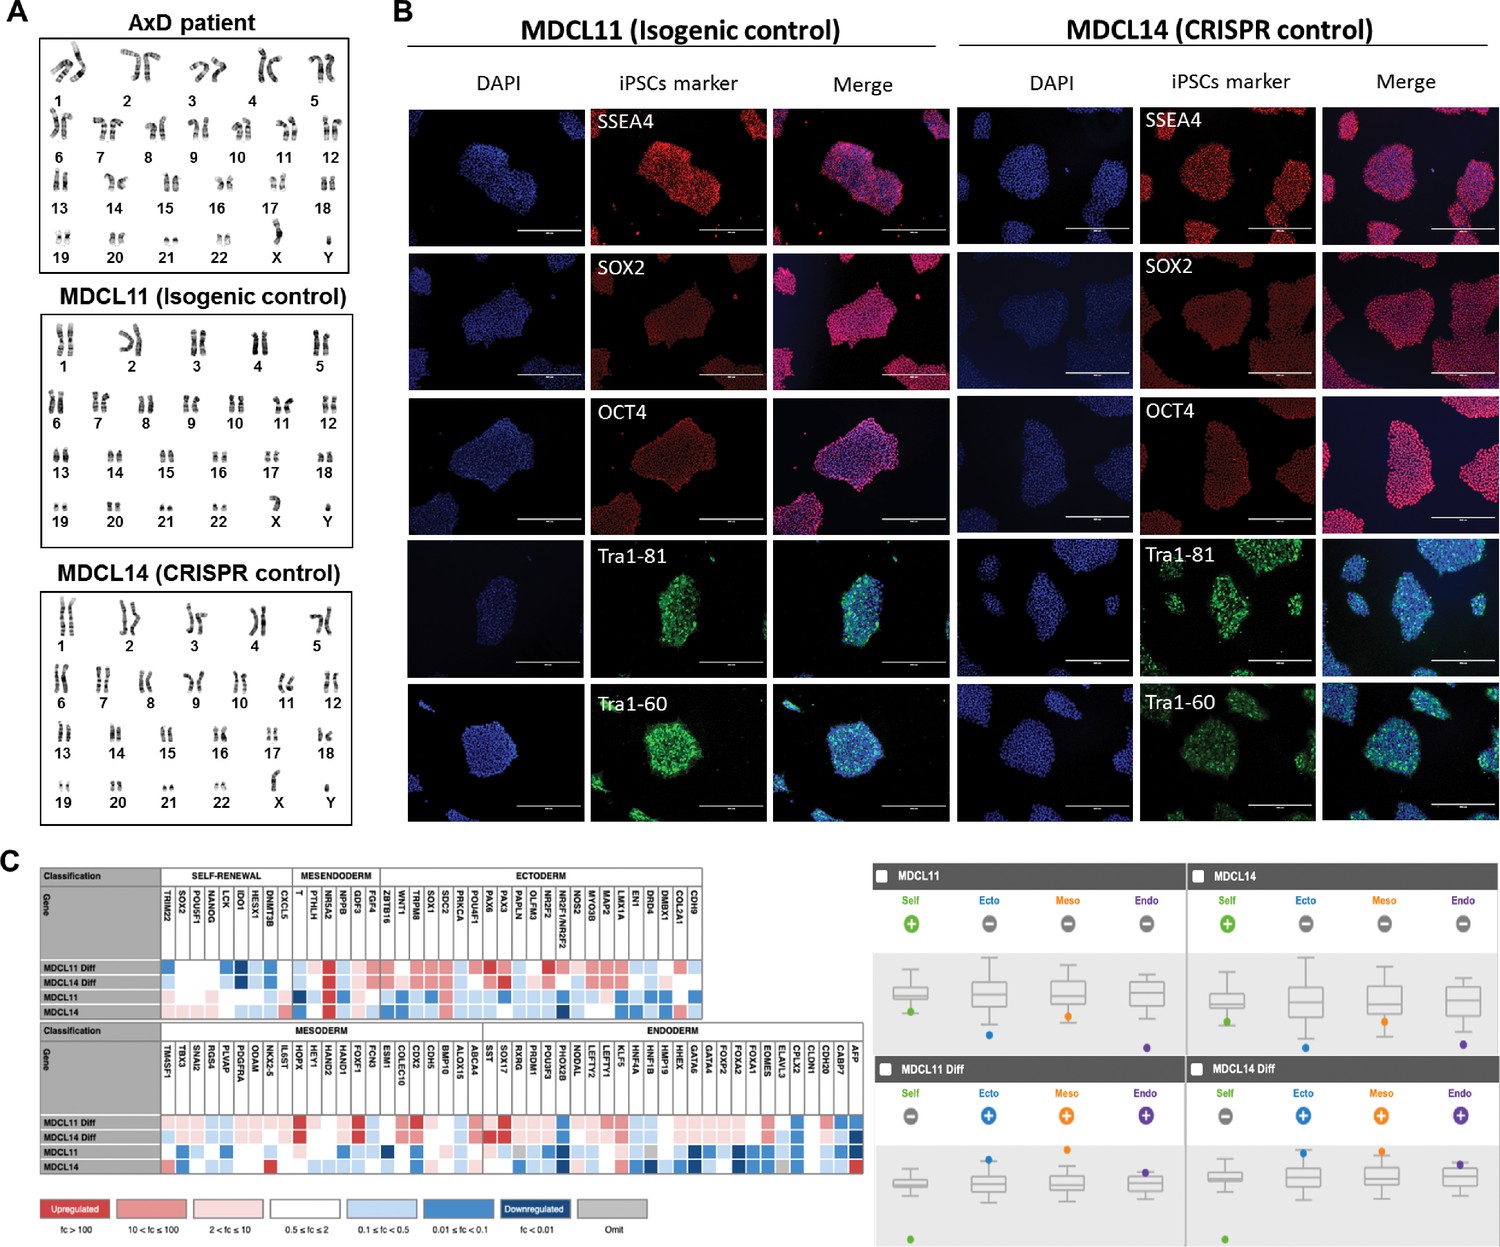
Characterization of pluripotency in AxD and isogenic control iPSCs.
(A) Karyotype analysis for original AxD patient iPSCs, isogenic control (MDCL11) and CRISPR control (MDCL14) iPSCs showing normal karyotypes for all three clones. (B) Immunofluorescence staining for iPSC pluripotency markers (red/green) and DAPI (blue). Scale bars = 400 µm. (C) TaqMan hPSC Scorecard Panel that compares the gene expression profile of the generated iPSCs against nine reference lines. Heat map of the genes that are up-regulated (red), have the same expression level (white) or are down -regulated (blue) in the iPSCs. Colors correlate to the fold change in expression of the indicated gene relative to the undifferentiated or Day seven embryoid body (EB) differentiated reference set. Shown at the bottom are differentiation index plots of changes in self-renewal genes (green) and differentiation genes (blue-ectoderm, orange-mesoderm, purple-endoderm) in the 1 week EB differentiated cells (left) and undifferentiated cells (right).
Figure 4—figure supplement 2
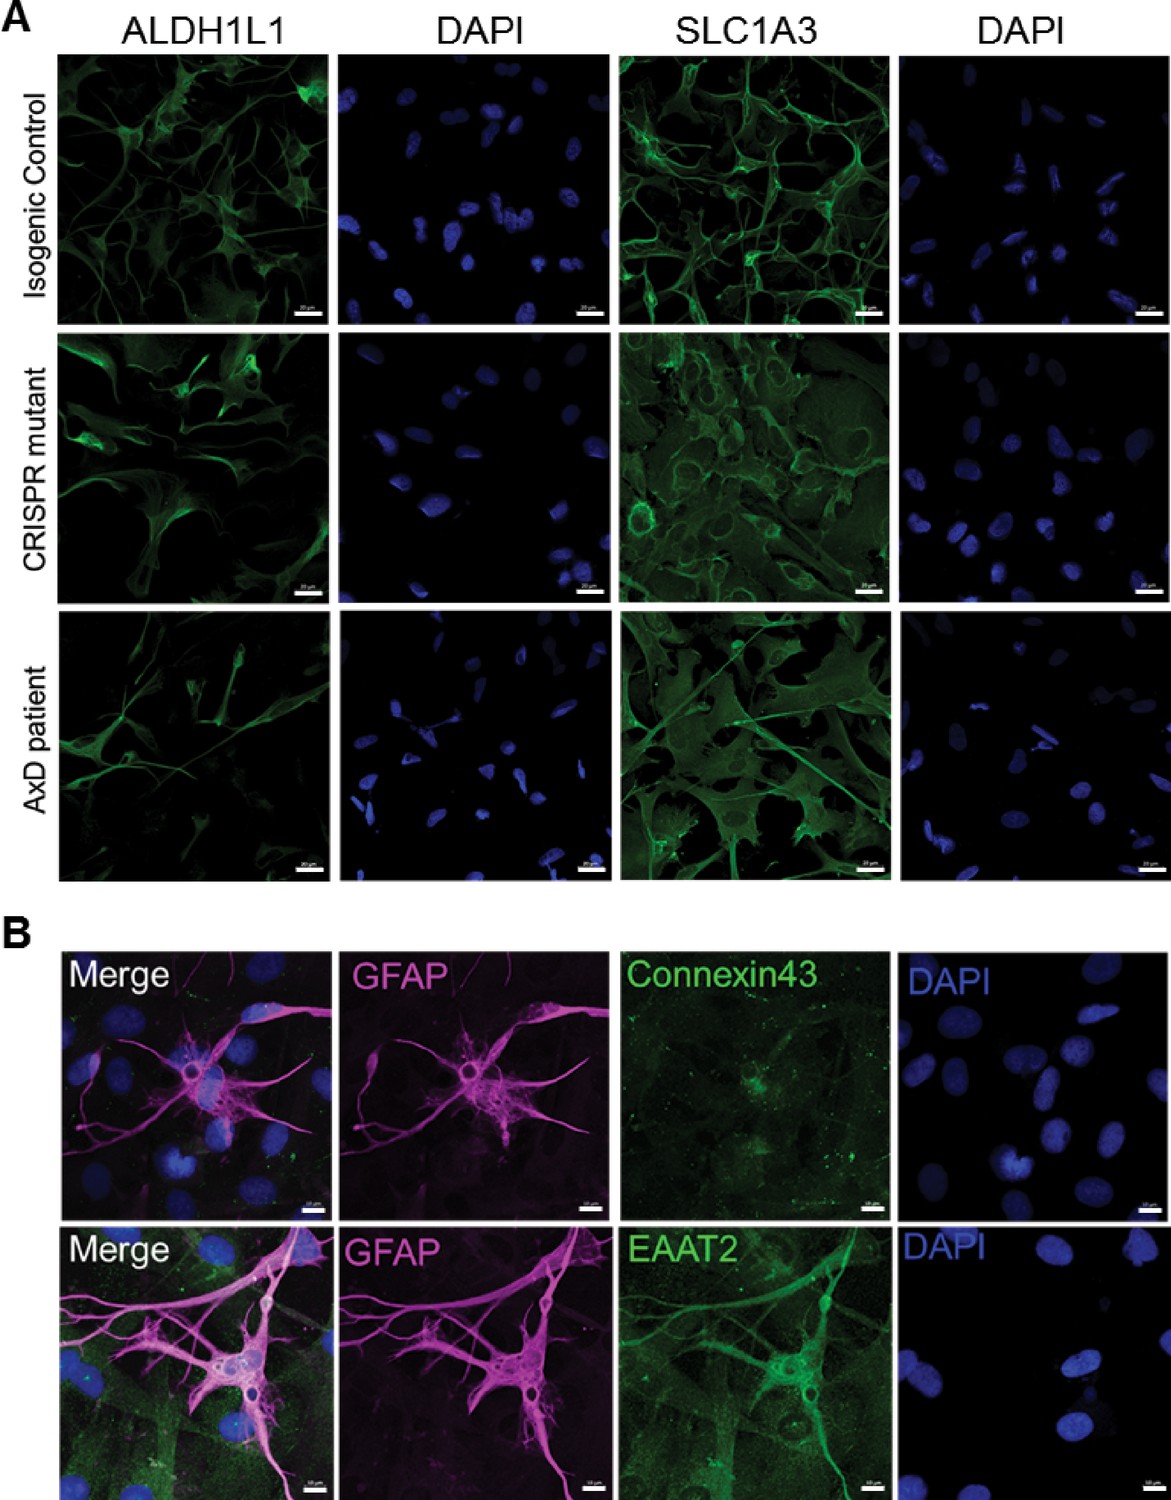
Characterization of astrocyte differentiation.
(A) Immunofluorescence staining for astrocyte markers ALDH1L1 and SLC1A3 (green) and DAPI (blue) in isogenic control, CRISPR mutant and AxD iPSC-astrocytes. Scale bars = 20 µm. (B) Immunofluorescence staining for astrocyte markers GFAP (magenta), Connexin-43 (green, top), EAAT2 (green, bottom) and DAPI (blue) in AxD iPSC-astrocytes. Scale bars = 10 µm.
Figure 5
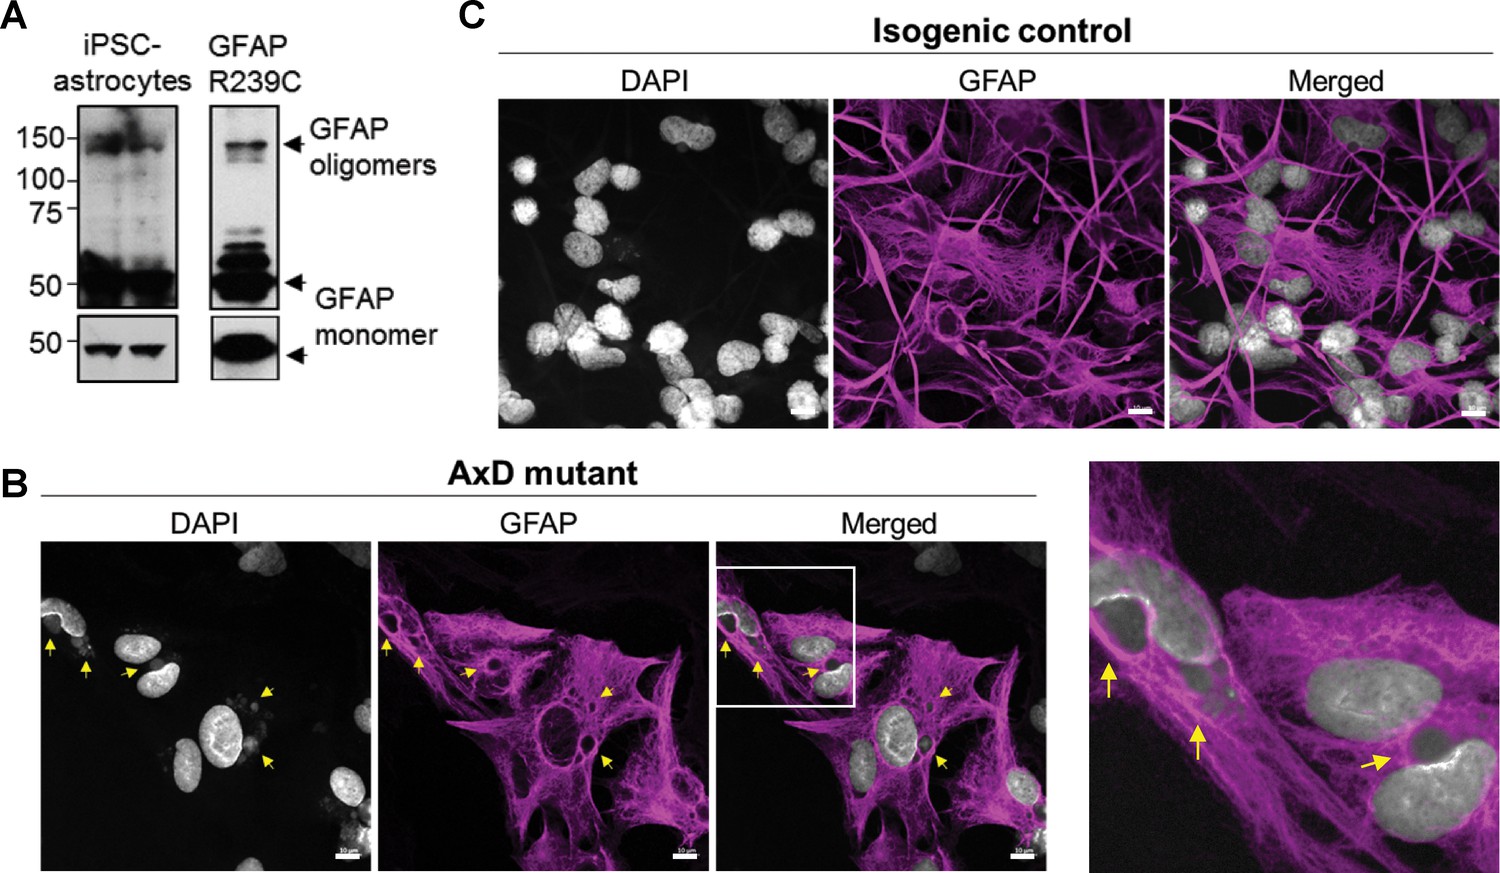
Oligomerization and perinuclear aggregation of GFAP in AxD iPSC-astrocytes.
(A) GFAP blot of AxD iPSC-astrocytes (left) and SW13vim- cells transfected with R239C mutant GFAP (right) reveals GFAP monomer and high-molecular-mass GFAP oligomers. Immunoblots on the bottom are of the same membranes at lower exposure. (B) Immunofluorescence staining for GFAP (magenta) and DAPI (white) in AxD iPSC-astrocytes reveals presence of perinuclear GFAP aggregates, marked by the yellow arrows. Scale bars = 10 µm. Boxed area in the merged image is shown by the enlarged image on the right. (C) Immunofluorescence staining for GFAP (magenta) and DAPI (white) in isogenic control iPSC-astrocytes. Scale bars = 10 µm.
Figure 6 with 1 supplement
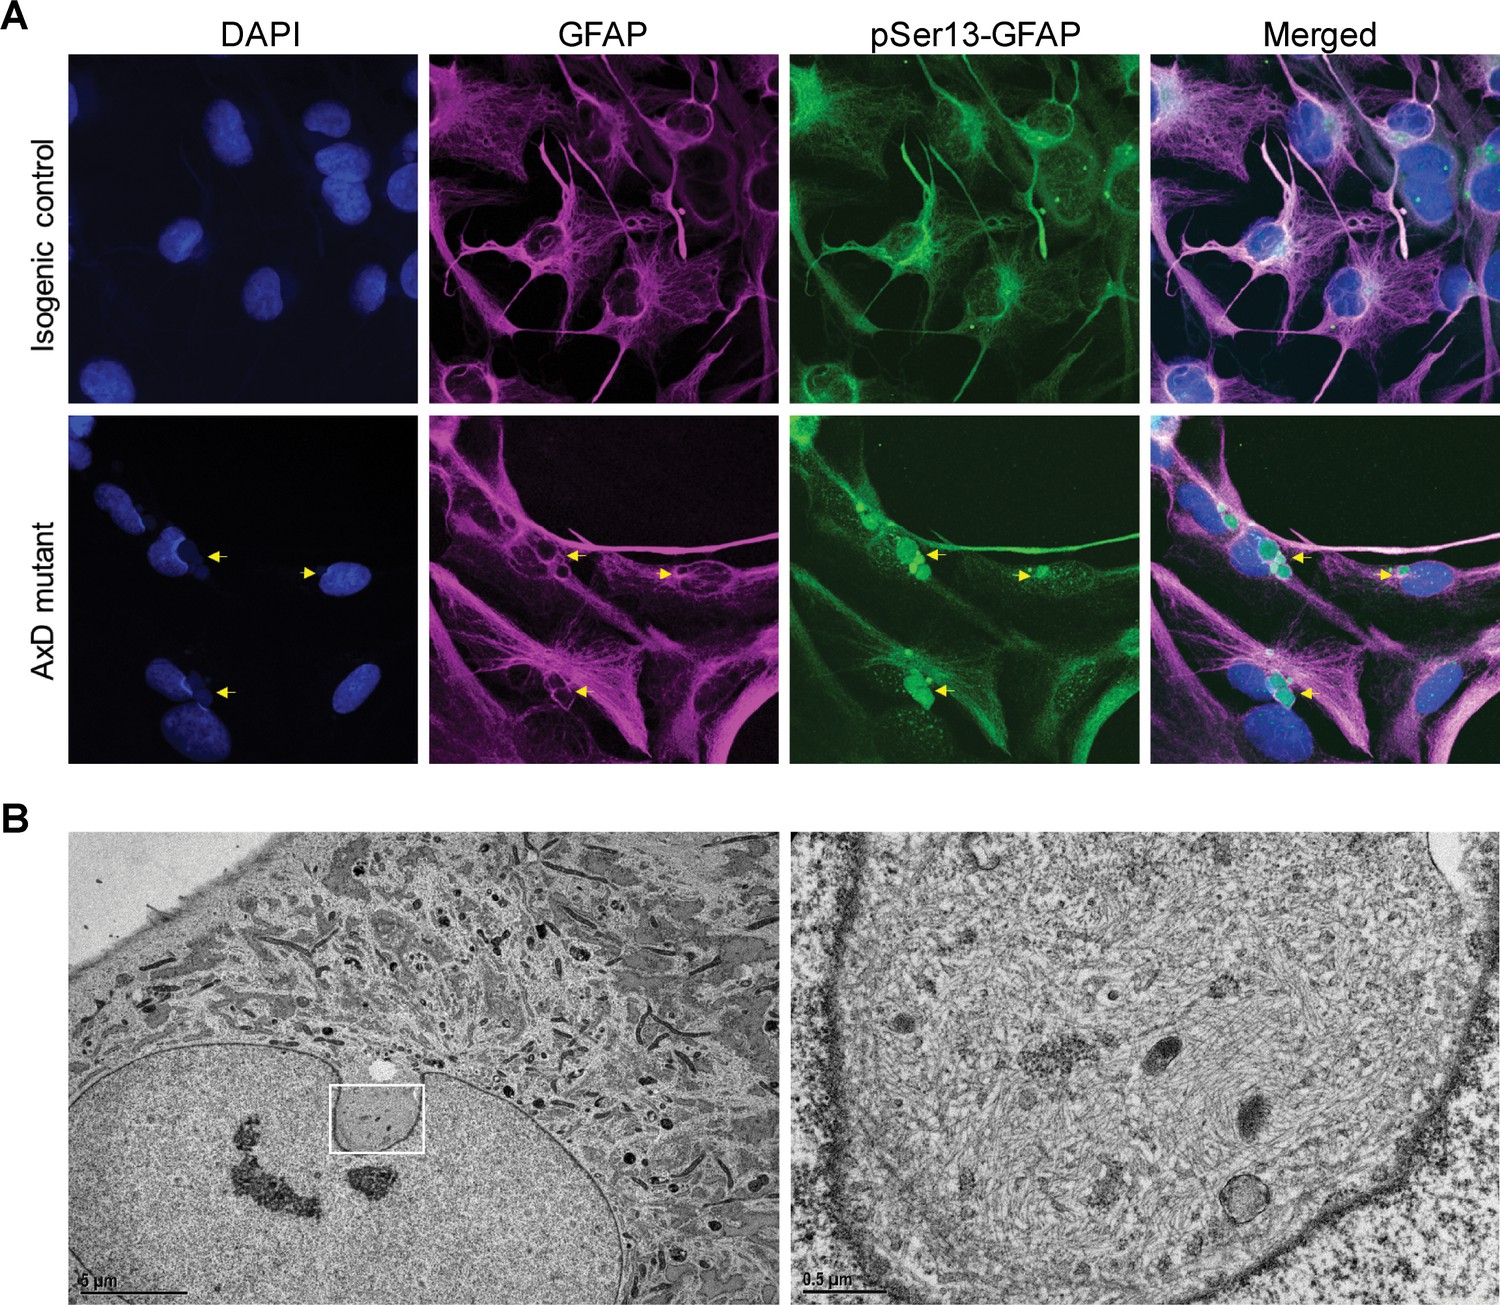
pSer13 marks perinuclear accumulation of GFAP within nuclear invaginations in AxD iPSC-astrocytes.
(A) Immunofluorescence staining of total GFAP (magenta), pSer13-GFAP (green) and DAPI (blue) in isogenic control (top panels) and AxD mutant (bottom panels) iPSC-astrocytes. Perinuclear GFAP aggregates are indicated by the yellow arrows. Scale bars = 10 µm. (B) Electron microscopy images of AxD patient iPSC-astrocytes revealing large, juxtanuclear fibrous bundles (boxed area on left), shown at higher magnification on the right. Scale bar = 5 µm (left) and 0.5 µm (right).
Figure 6—figure supplement 1
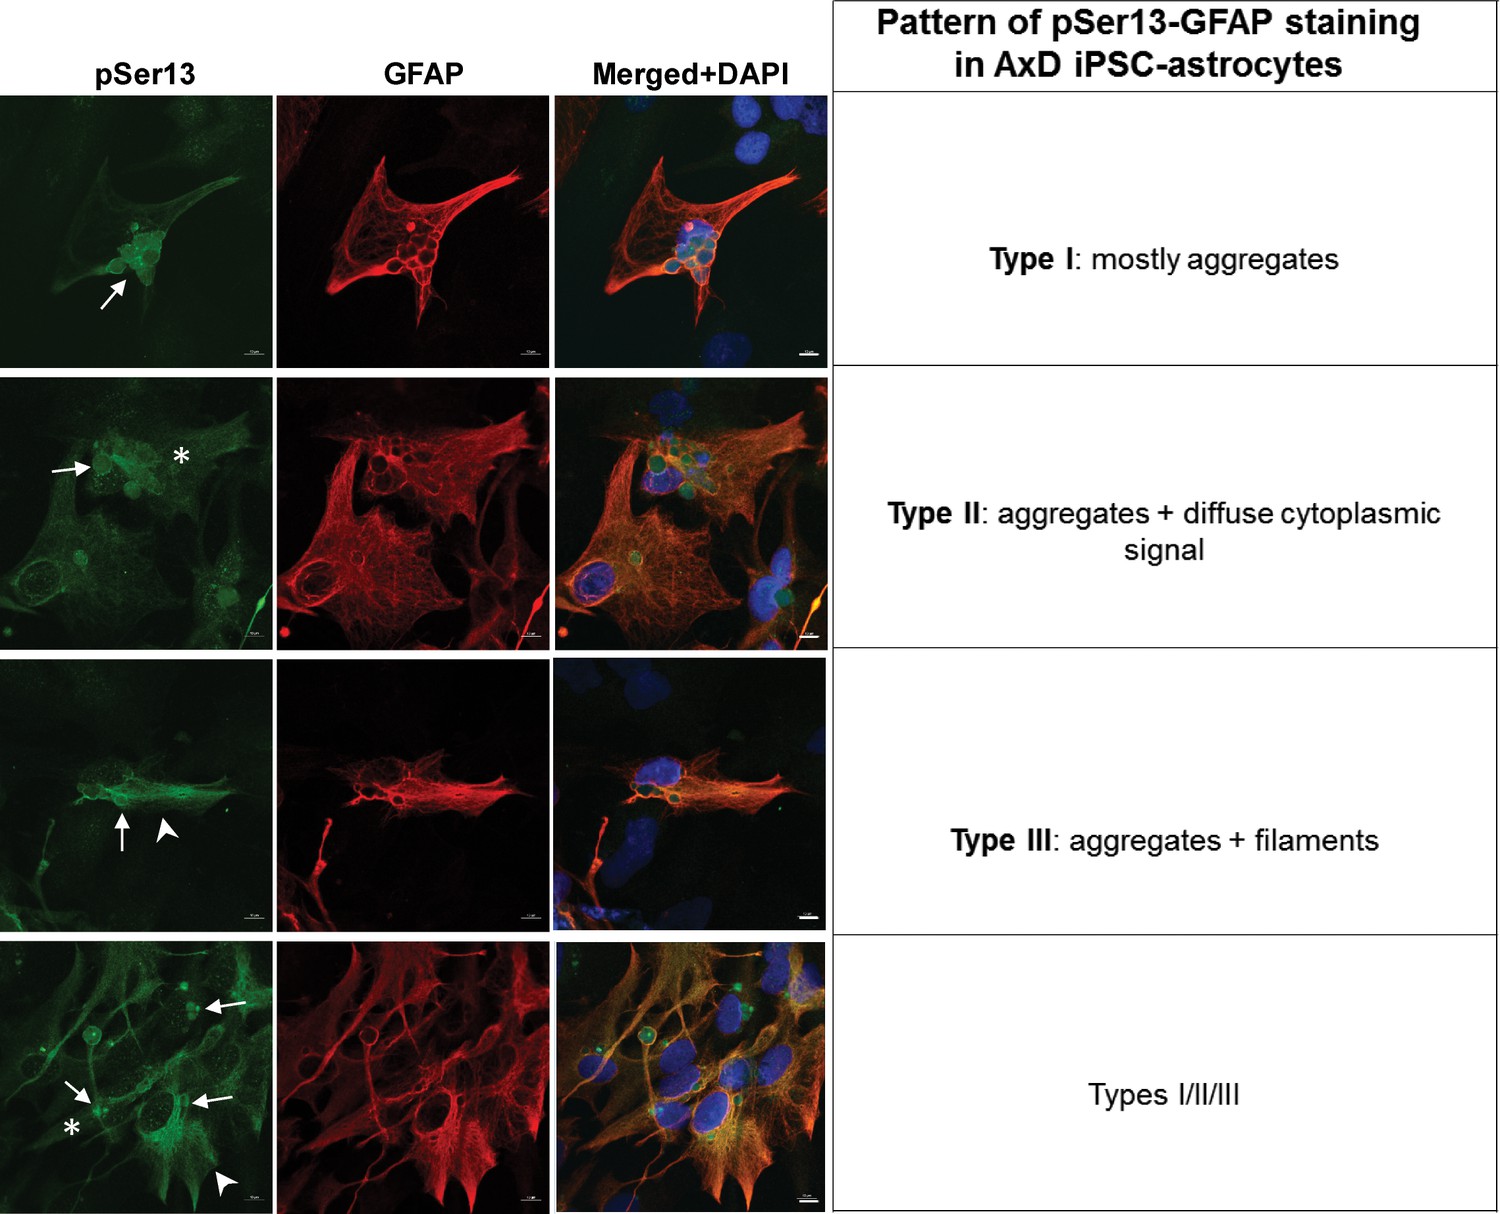
Three types of staining pattern observed with the pSer13 GFAP antibody in AxD iPSC-astrocytes.
Three types of cells were observed with respect to pSer13 signal: Type I: primarily aggregates (arrows); Type II: aggregates and soluble cytoplasmic GFAP (asterisk) and Type III: aggregates and filamentous GFAP (arrowheads).
Figure 7 with 1 supplement

Phosphorylation of Ser13 on GFAP promotes caspase-6 cleavage of GFAP.
(A) GFAP blot of SW13vim- cells transfected with vector, WT, S13A, S13D and S13E - GFAP. Full-length (fl) and cleaved fragment (cf) of GFAP are indicated by arrows. Immunoblot on the bottom shows GFAP monomer (fl) from the same membrane at a lower exposure. (B) Quantification of panel A by densitometry shows cleaved and full-length GFAP in phospho-mutants relative to WT GFAP (mean ± SD from three independent experiments; *p<0.05 two-way ANOVA). (C) GFAP blot in SW13vim- cells transfected with either S13D or S13D/R79H double mutant GFAP and treated for 48 hr with a caspase-6 inhibitor (Ac-VEID-CHO). (D) Quantification of GFAP bands in panel C by densitometry (mean ± SD from three biological replicates; **p<0.01; ****p<0.0001 two-way ANOVA). (E) Immunoblot for GFAP monomer (fl) and cleaved fragment (cf) in isogenic control and AxD iPSC-astrocytes. Different amounts of total protein were loaded to normalize GFAP monomer levels. (F) Immunofluorescence staining of caspase-6 (magenta), GFAP (green) and DAPI (blue) in human AxD and isogenic control iPSC-astrocytes showing caspase-6 co-localization within GFAP aggregates in the AxD cells, indicated by the arrowheads. Scale bars = 20 µm.
-
Figure 7—source data 1
Raw data from mass spectrometry PTM profiling of GFAP R79H extracted from transfected SW13vim-cells.
- https://cdn.elifesciences.org/articles/47789/elife-47789-fig7-data1-v2.xlsx
Figure 7—figure supplement 1
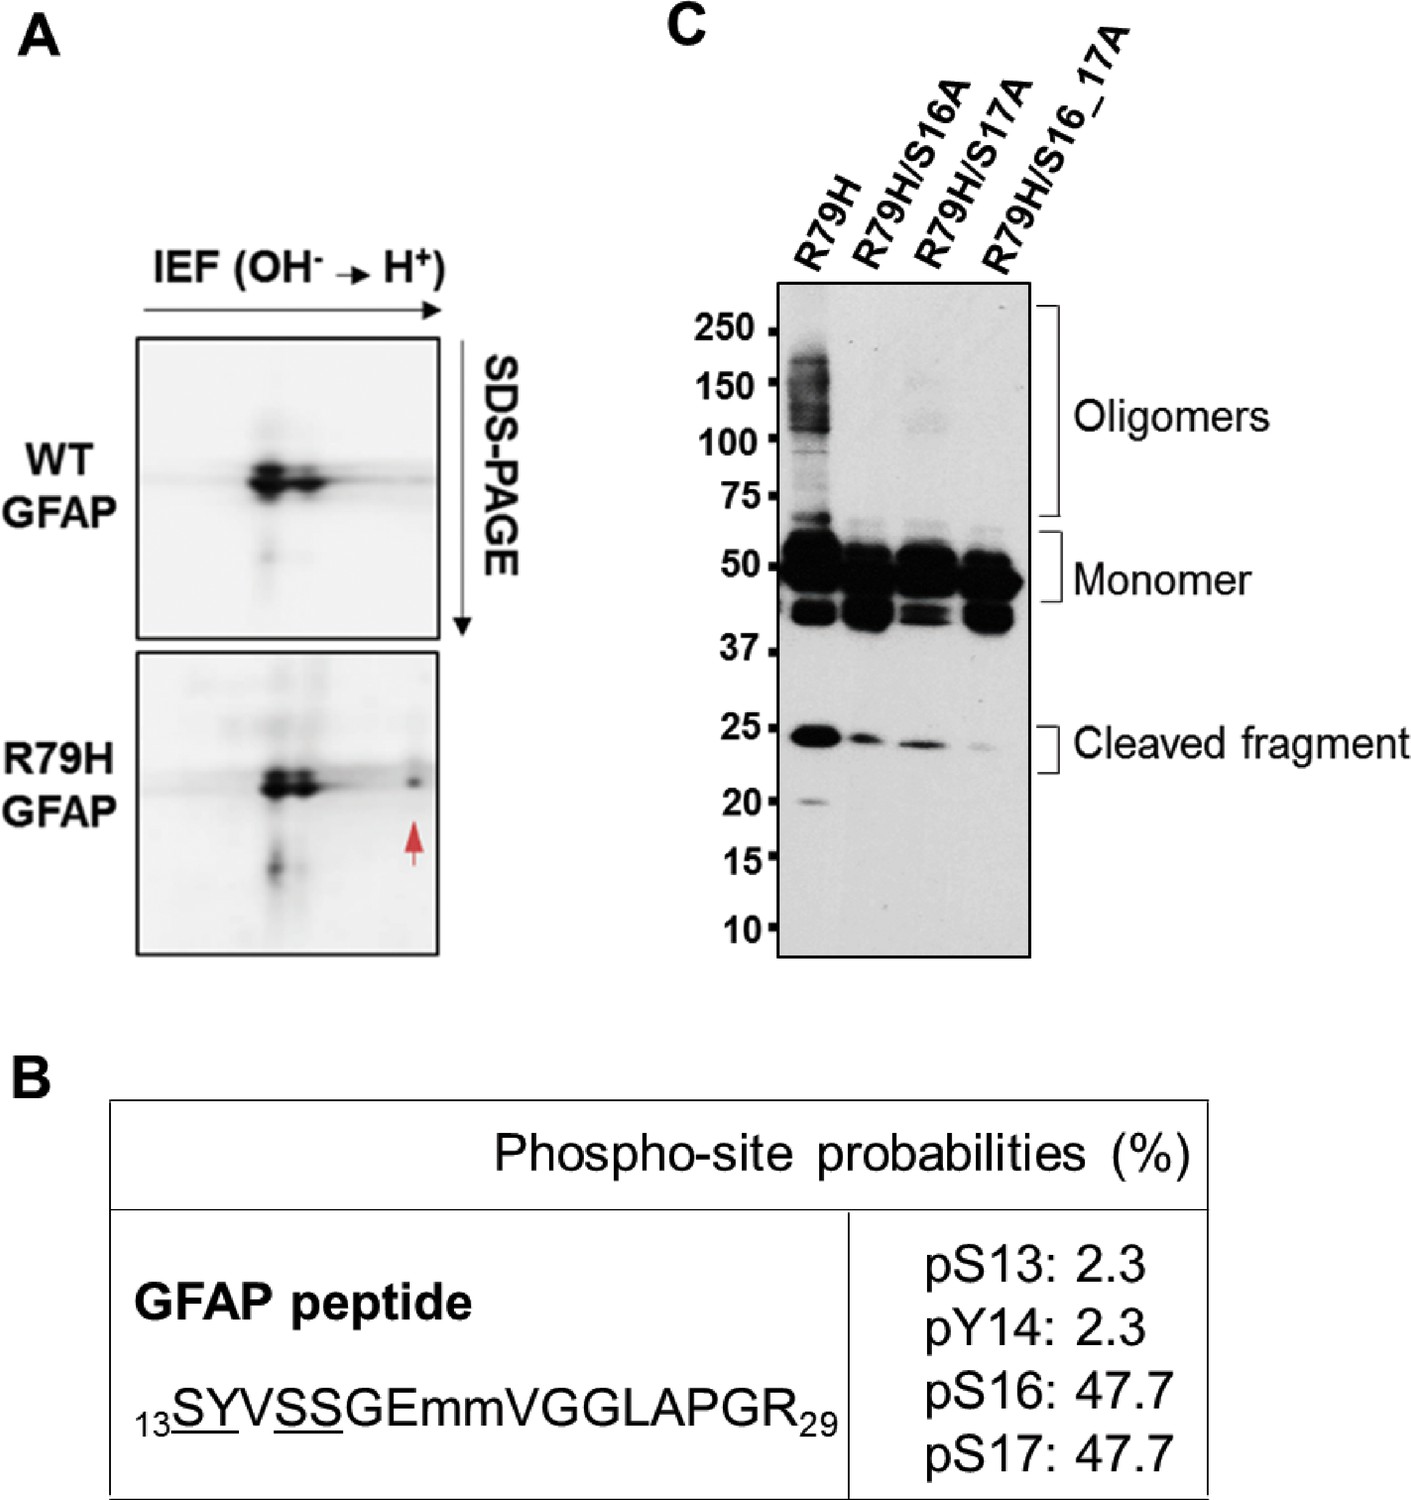
Analysis of major sites of phosphorylation on R79H GFAP expressed in SW13 vim- cells.
(A) Coomassie stain of a HSE extracts from WT and R79H GFAP analyzed by 2-dimensional (2D) gel electrophoresis. Red arrow points to a negatively charged species that was only present in R79H and analyzed by mass spectrometry. (B) Summary of phosphorylation state of the negatively charged GFAP species from panel A. (C) Effect of phospho-deficient mutants S16A and S17A on GFAP R79H oligomerization and cleavage.
Figure 8
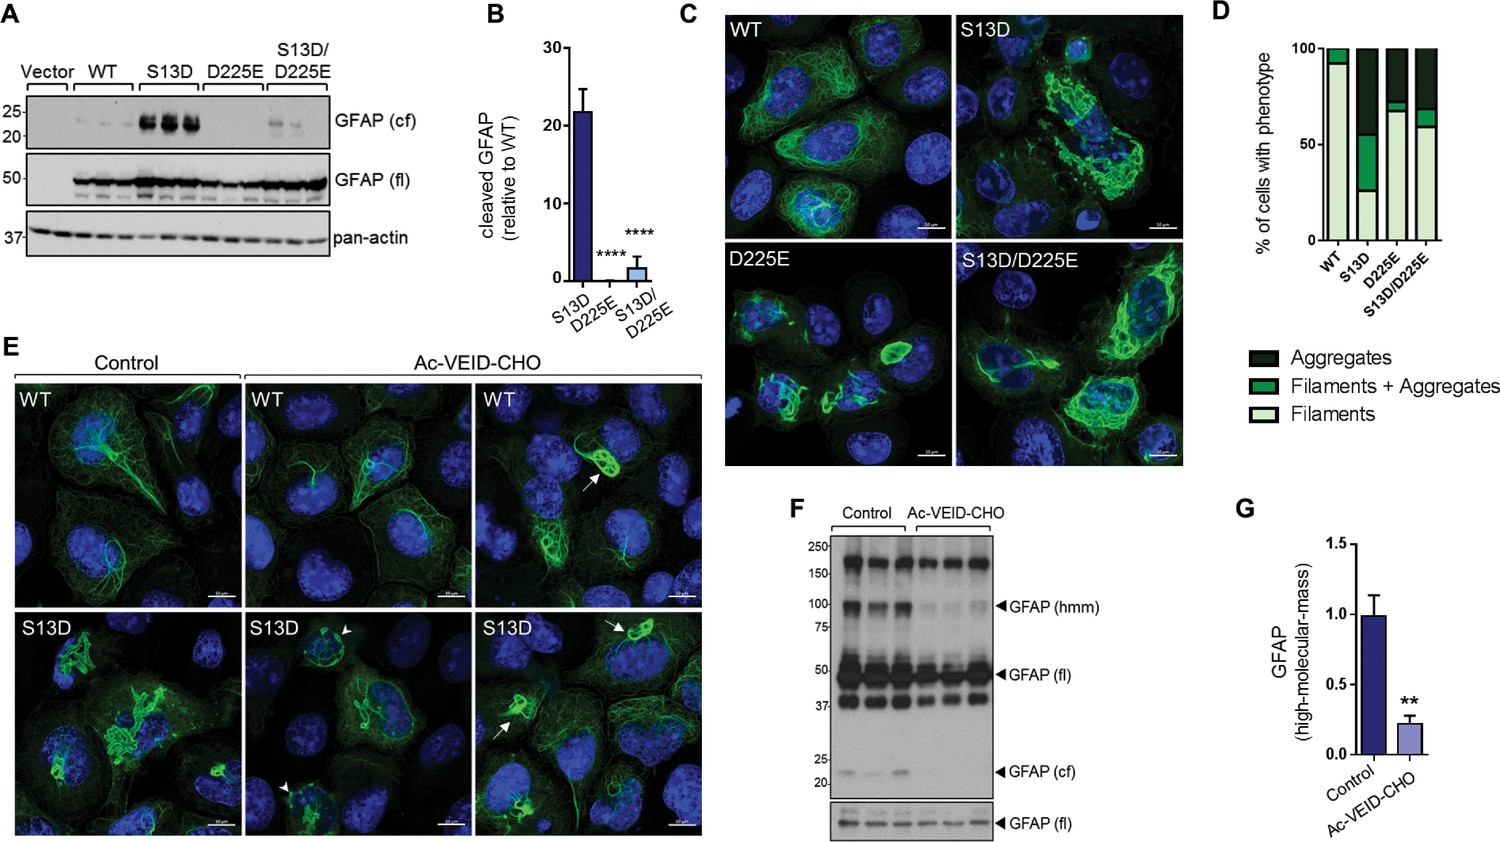
Inhibition of GFAP cleavage by caspase-6 partially alleviates aggregation due to S13D phospho-mimic mutation.
(A) Western blot of GFAP total cell lysates from SW13vim- cells transfected with empty vector control, WT, S13D, D225E, and double S13D/D225E mutants. Shown are GFAP cleaved fragment (cf), full-length (fl) monomer and pan-actin (loading control). (B) Quantification of the abundance of cleaved GFAP in the three mutants shown in panel A relative to WT GFAP (mean ± SD from three biological replicates; ****p<0.0001 compared to S13D; one-way ANOVA). (C) Representative images of immunofluorescence staining of DNA (blue) and GFAP (green) in SW13vim- cells transfected with wild-type GFAP (WT), phospho-mimic GFAP (S13D), and non-cleavable GFAP (D225) as single or double mutations, as noted in the images. Scale bar = 10 µm. (D) Quantification of percentage of cells containing GFAP filaments, aggregates or both (n = 76–85 cells per condition). (E) Representative images of immunofluorescence staining of DNA (blue) and GFAP (green) in SW13vim- cells transfected with wild-type GFAP (WT) or phospho-mimic GFAP (S13D) and treated with vehicle (control) or the caspase-inhibitor Ac-VEID-CHO (10 µM, 48 hr). (F) Western blot analysis of SW13vim- total lysates transfected with S13D GFAP and treated with vehicle (control) or caspase-6 inhibitor Ac-VEID-CHO (10 µM, 24 hr), showing the 24 kDa caspase-cleaved fragment (cf), 50 kDa full-length (fl), and high-molecular-mass ~100 kDa GFAP. (G) Quantification of the relative abundance of hmm GFAP in control and Ac-VEID-CHO – treated cells. n = 3; **p<0.01; unpaired t-test.
Figure 9 with 1 supplement
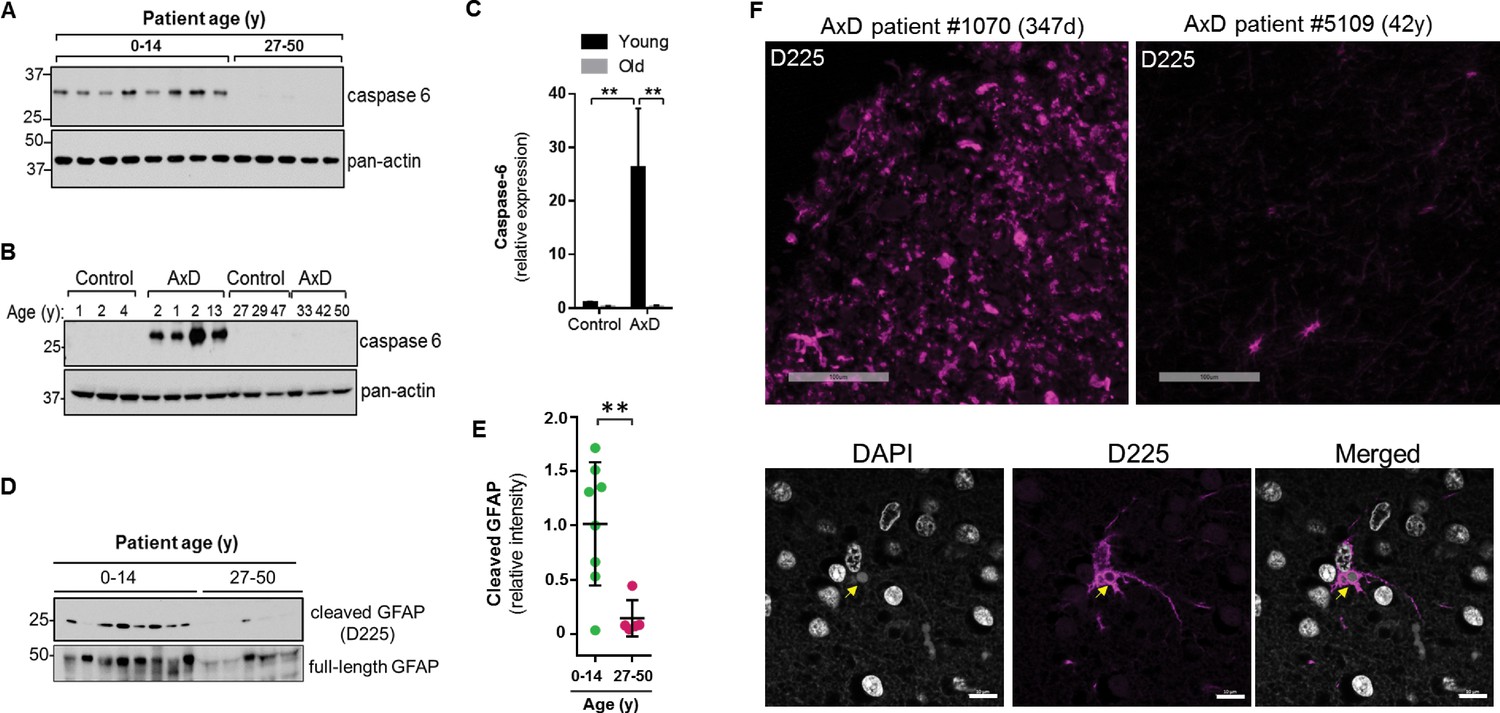
High expression of caspase-6 in young AxD patient brain tissue correlates with increased levels of cleaved GFAP.
(A) Immunoblot for caspase-6 in total lysates from human AxD post mortem brain tissue shows that caspase-6 is upregulated in young AxD patients. Pan-actin is used as a loading control. (B) Immunoblot for caspase-6 in total lysates from young and old non-AxD control and AxD patient post-mortem brain tissue. Pan-actin blot serves as a loading control. (C) Quantification of band intensities in panel B by densitometry of caspase-6 normalized to actin. **p<0.01; two-way ANOVA. (D) Western blotting for full-length GFAP or cleaved GFAP (D225 antibody) in HSEs from human AxD post-mortem brain tissue. (E) Quantification of band intensities from panel D by densitometry of D225, normalized to total GFAP (**p<0.01, unpaired t-test). (F) Immunofluorescence staining showing widespread presence of cleaved GFAP (D225; magenta) in cerebral cortex and underlying white matter of 347 day-old child with AxD and low expression of cleaved GFAP in a 42 year old AxD patient. Wider fields of view and sections from additional patients are shown in Figure 7—figure supplement 1. DAPI nuclei are shown in white in bottom panels, and arrow highlights perinuclear aggregate containing cleaved GFAP and staining positively for DAPI in brain tissue from a child with AxD. Scale bar = 100 µm (top) and 10 µm (bottom).
Figure 9—figure supplement 1
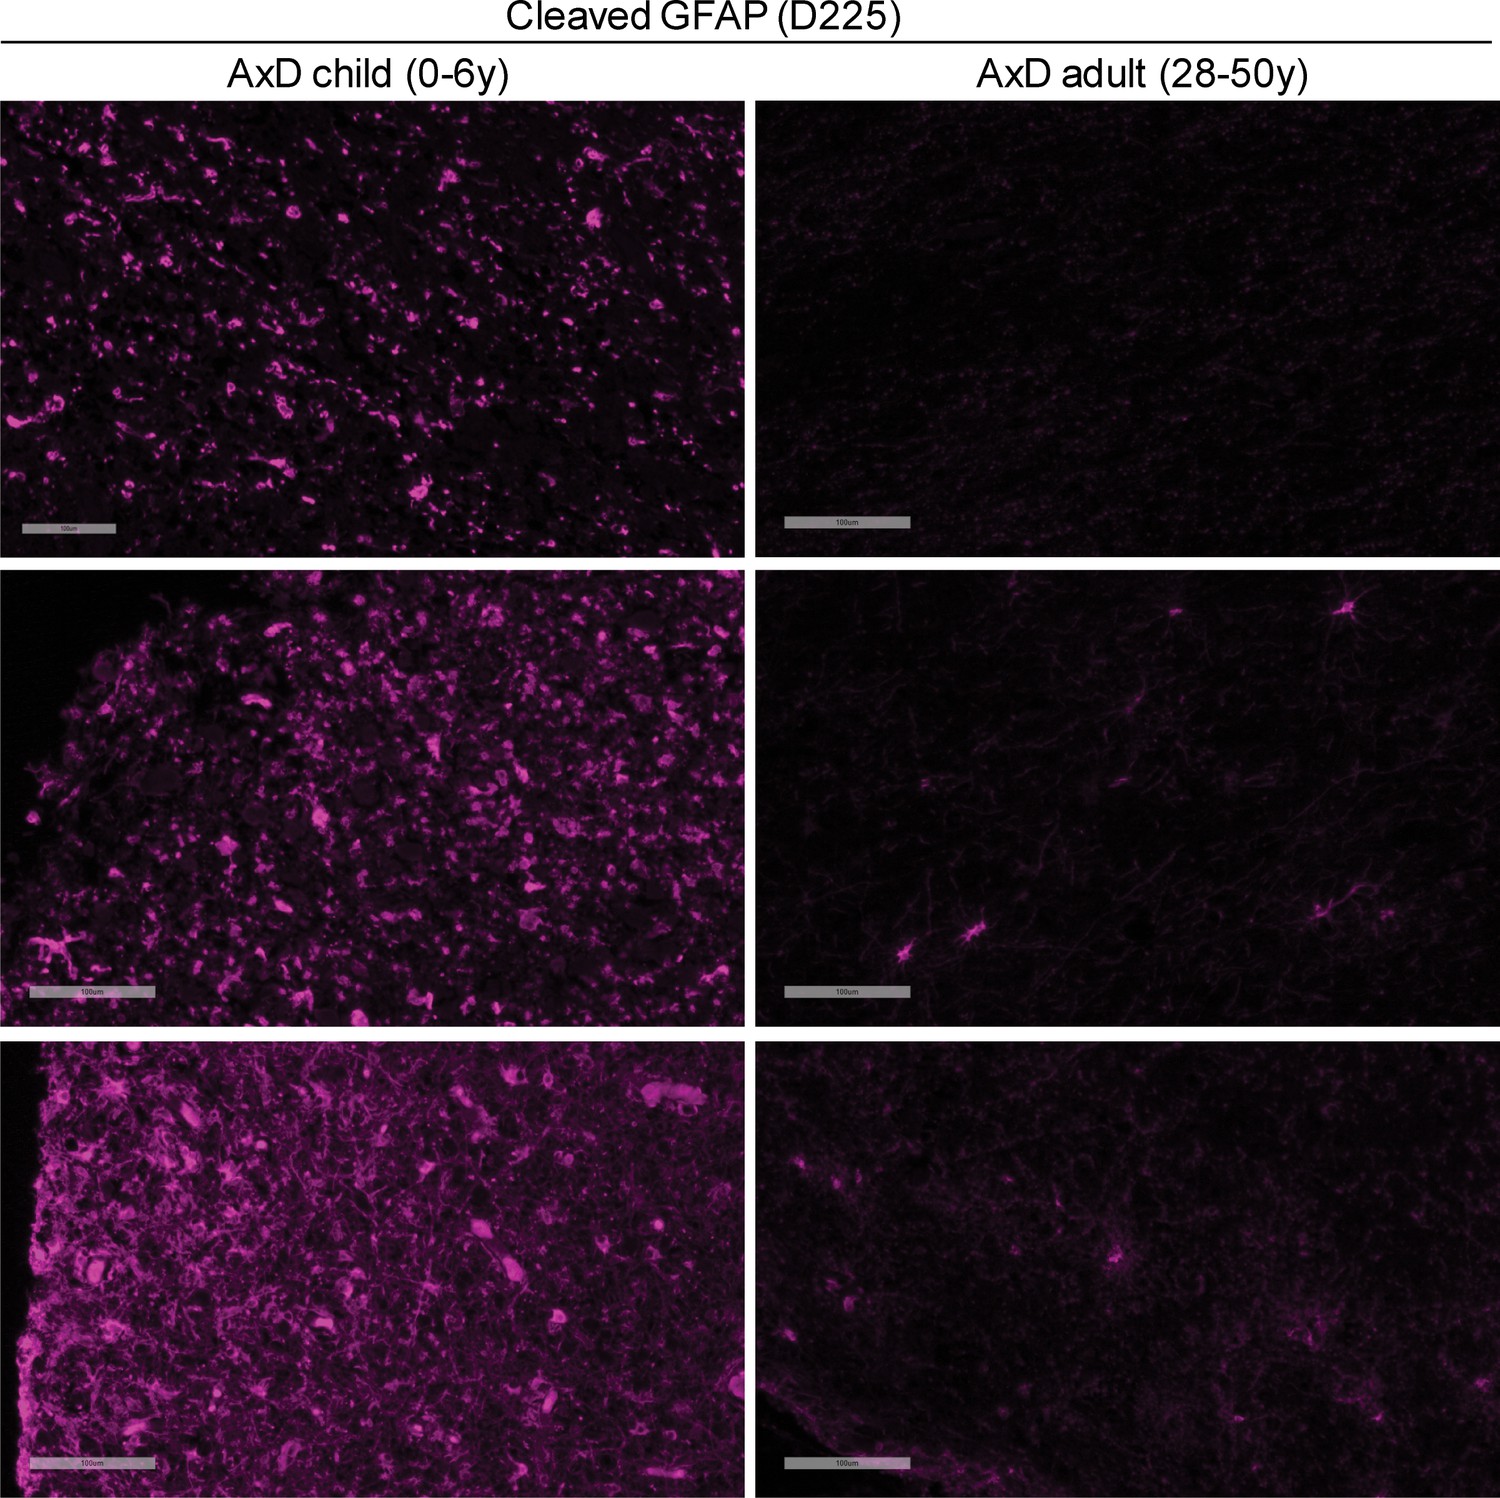
Presence of cleaved GFAP in in post-mortem brain tissue of AxD children versus adults.
Human brain sections were immunostained with the D225 antibody, which recognizes the N-terminal fragment of cleaved GFAP at Asp-225.
Tables
Key resources table
| Reagent type (species) or resource | Designation | Source or reference | Identifiers | Additional information |
|---|---|---|---|---|
| Gene (human) | GFAP | NA | Gene ID: 2670 | |
| Cell line (human) | R239C-GFAP fibroblasts from AxD patient | Coriell Institute | GM16825 | Brenner et al. (2001) |
| Cell line (human) | R239C-GFAP induced pluripotent stem cells | Generated in the study | Generation of the AxD iPSCs (R239C-GFAP) is described in the Materials and methods below. Cells can be obtained by contacting the corresponding author. | |
| Cell line (human) | R239R-GFAP isogenic control induced pluripotent stem cells | Generated in the study | Generation of the AxD iPSCs (R239C-GFAP) is described in the Materials and methods below. Cells can be obtained by contacting the corresponding author. | |
| Cell line (human) | SW13 vim- | Sarria, A.J et al. J Cell Sci 1994 | ||
| Biological sample (human) | Human brain specimens | NIH NeuroBioBank | Listed inSupplementary files 1 and 2 | |
| Antibody | rabbit anti-GFAP | Agilent/DAKO | Clone Z0334 | Dilution = 1:10,000 immunoblot, 1:500 immunofluorescence |
| Antibody | rabbit anti-caspase-6 | Cell Signaling Technology | Cat# 9762 | Dilution = 1:1000 immunoblot |
| Antibody | rabbit anti-caspase-6 | abcam | Cat# ab185645 | Dilution = 1:100 immunofluorescence |
| Antibody | rabbit anti-D225 | PMID: 24102621 | gift from Dr Ming Der Perng, Dilution = 1:5000 immunoblot (overnight), 1:150 immunofluorescence | |
| Antibody | mouse anti-GFAP | Sigma | Clone GA5, Cat# G3893 | Dilution = 1:3000 immunoblot, 1:300 immunofluorescence |
| Antibody | mouse anti-pSer13 GFAP | PMID: 8647894 | gift from Dr Masaki Inagaki, Dilution = 1:500 immunoblot (overnight), 1:20 immunofluorescence | |
| Antibody | mouse anti-pan Actin | NeoMarkers | Cat# MS-1295 | Dilution = 1:3000 immunoblot |
| Antibody | mouse anti-Tra-1–60 | ThermoFisher | Cat# 41–1000 | Dilution = 1:300 |
| Antibody | mouse anti-Tra-1–81 | ThermoFisher | Cat# 41–1100 | Dilution = 1:300 |
| Antibody | mouse anti-SSEA4 | ThermoFisher | Cat#41–4000 | Dilution = 1:300 |
| Antibody | rabbit anti-Oct4 | abcam | Cat# ab19857 | Dilution = 1:40 |
| Antibody | rabbit anti-Sox2 | ThermoFisher | Cat# 48–1400 | Dilution = 1:125 |
| Antibody | Alexa 488-conjugated goat anti-mouse | ThermoFisher | Cat# A32723 | Dilution = 1:500 |
| Antibody | Alexa 488-conjugated goat anti-rabbit | ThermoFisher | Cat# A32731 | Dilution = 1:500 |
| Antibody | Alexa 594-conjugated goat anti-mouse | ThermoFisher | Cat# A32742 | Dilution = 1:500 |
| Antibody | Alexa 594-conjugated goat anti-rabbit | ThermoFisher | Cat# A32740 | Dilution = 1:500 |
| Recombinant DNA reagent | pCMV6-XL6-GFAP | Origene | Cat# SC118873 | |
| Peptide, recombinant protein | TrueCut Cas9 Protein v2 | ThermoFisher | Cat# A36499 | |
| Commercial assay or kit | Precision gRNA Synthesis Kit | ThermoFisher | Cat# A29377 | |
| Commercial assay or kit | Agilent Quikchange II | Agilent | Cat# 200524 | |
| Commercial assay or kit | Rneasy Kit | Qiagen | Cat# 74104 | |
| Commercial assay or kit | Taqman Scorecard | ThermoFisher | Cat# A15870 | |
| Chemical compound, drug | ECL Reagents | Perkin Elmer | NEL103E001EA | |
| Chemical compound, drug | Ac-VEID-CHO | Millipore Sigma | A6339 | |
| Software, algorithm | CRISPR off-target | PMID: 27380939 | http://crispor.tefor.net/ |
Additional files
-
Supplementary file 1
Donor information for AxD post-mortem human brain specimens.
- https://cdn.elifesciences.org/articles/47789/elife-47789-supp1-v2.docx
-
Supplementary file 2
Donor information for control (non-AxD) post-mortem human brain specimens.
- https://cdn.elifesciences.org/articles/47789/elife-47789-supp2-v2.docx
-
Supplementary file 3
Summary from off-target sequencing from CRISPR/Cas9 editing.
- https://cdn.elifesciences.org/articles/47789/elife-47789-supp3-v2.docx
-
Supplementary file 4
GFAP phosphorylation motifs and candidate kinases.
- https://cdn.elifesciences.org/articles/47789/elife-47789-supp4-v2.docx
-
Transparent reporting form
- https://cdn.elifesciences.org/articles/47789/elife-47789-transrepform-v2.pdf
Download links
A two-part list of links to download the article, or parts of the article, in various formats.
Downloads (link to download the article as PDF)
Open citations (links to open the citations from this article in various online reference manager services)
Cite this article (links to download the citations from this article in formats compatible with various reference manager tools)
Site-specific phosphorylation and caspase cleavage of GFAP are new markers of Alexander disease severity
eLife 8:e47789.
https://doi.org/10.7554/eLife.47789


