Spinal V2b neurons reveal a role for ipsilateral inhibition in speed control
- Washington University School of Medicine, United States
- National Institute for Basic Biology, Japan
Figures
Figure 1 with 2 supplements

V2b neurons are found throughout the rostral-caudal axis of zebrafish spinal cord.
(A) Transmitted DIC image (top) and confocal image (bottom) of a 5 dpf Tg(gata3:loxP-dsRed-loxP:GFP) animal. Scale bars = 0.5 mm. (B) Lateral view of a midbody spinal cord hemisegment; dashed lines mark muscle segments. In this and all subsequent figures, rostral is to the left and dorsal is to the top. Purple triangles mark CSF-cN neurons and orange stars mark ISN. Scale bar = 20 μm. (C) V2b cell counts per hemisegment quantified along the rostrocaudal body axis, n = 7 fish from three clutches. (D) Example cell morphology using two techniques to label single V2b axons: single-cell dye electroporation (top) and Kaede photoconversion (bottom). Scale bar = 20 μm. (E) Midbody V2b neurons extend axons through more segments than V2b neurons in other rostrocaudal locations. *p<0.01 (p=3.17×10⁻³); **p<0.001 (p=4.44×10⁻⁴). (F) Ball and stick plots indicate soma position and axon extension along the body axis for 35 V2b neurons in 12 animals from two clutches.
-
Figure 1—source data 1
V2b axon length quantification.
- https://doi.org/10.7554/eLife.47837.005
Figure 1—figure supplement 1
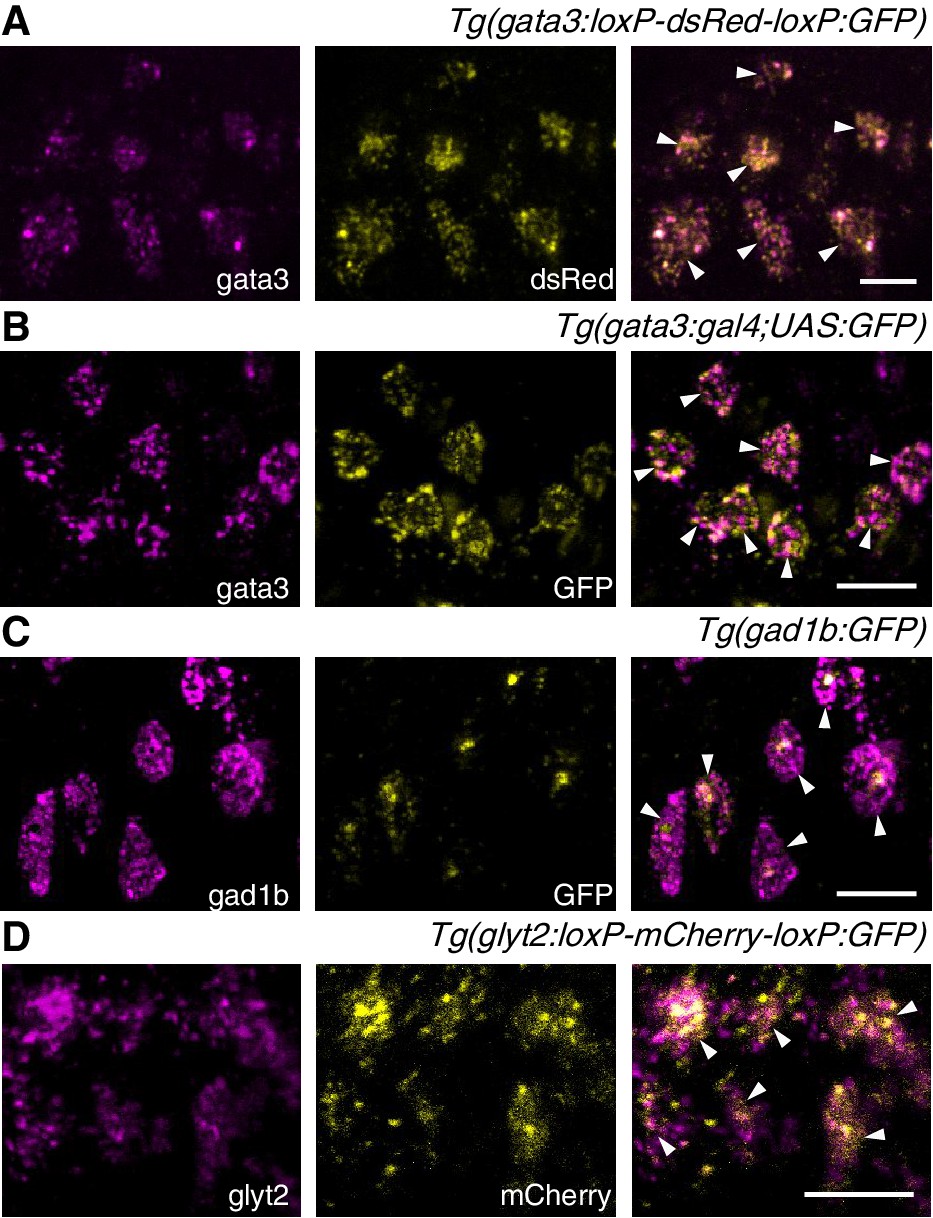
Two-color fluorescent in-situ hybridization validates transgenic line expression patterns.
Confocal images (z-projection of ~5 µm) showing fluorescent in-situ hybridization for endogenous RNA (magenta, left), transgenic fluorophore (yellow, middle) and overlaid two-color image (right). White arrowheads indicate colocalization. (A) Tg(gata3:loxP-dsRed-loxP:GFP); (B) Tg(gata3:Gal4; UAS:GFP); (C) Tg(gad1b:GFP); (D) Tg(glyt2:loxP-mCherry-loxP:GFP). Scale bars = 10 μm.
Figure 1—figure supplement 2
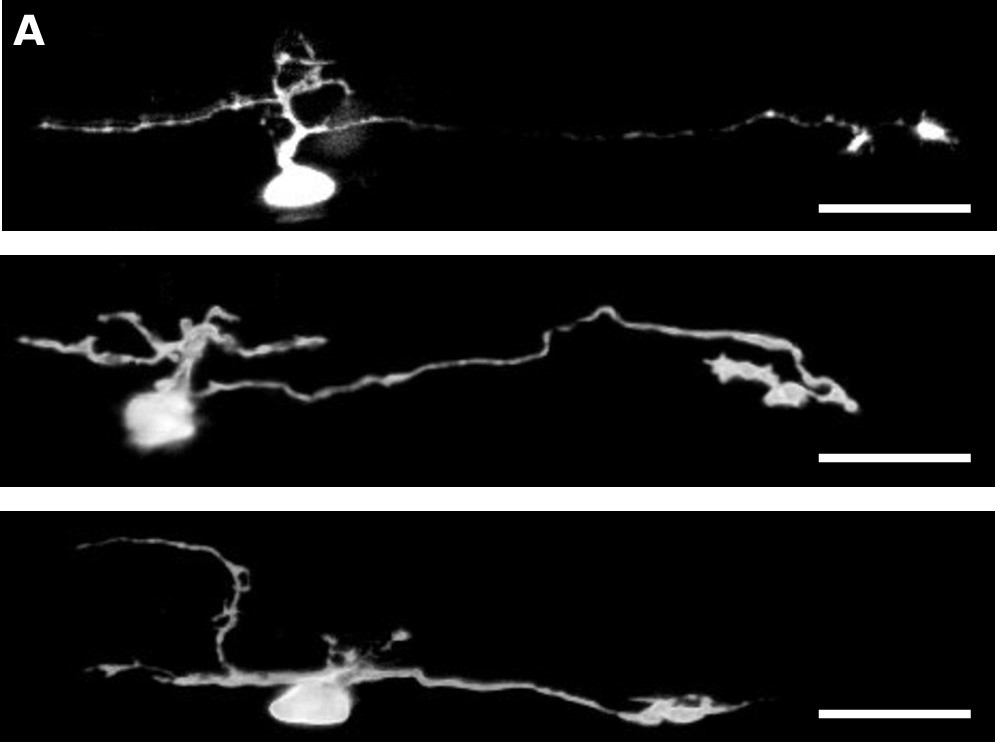
Example cell fills of the ventralmost cells in Tg(gata3:Gal4; UAS:Kaede) animals indicates intraspinal serotonergic neuron identity.
(A) Z-projection of photoconverted neurons showing descending axons with distinctive growth cone-like terminals and ascending or local processes. Scale bars. = 20 μm.
Figure 2
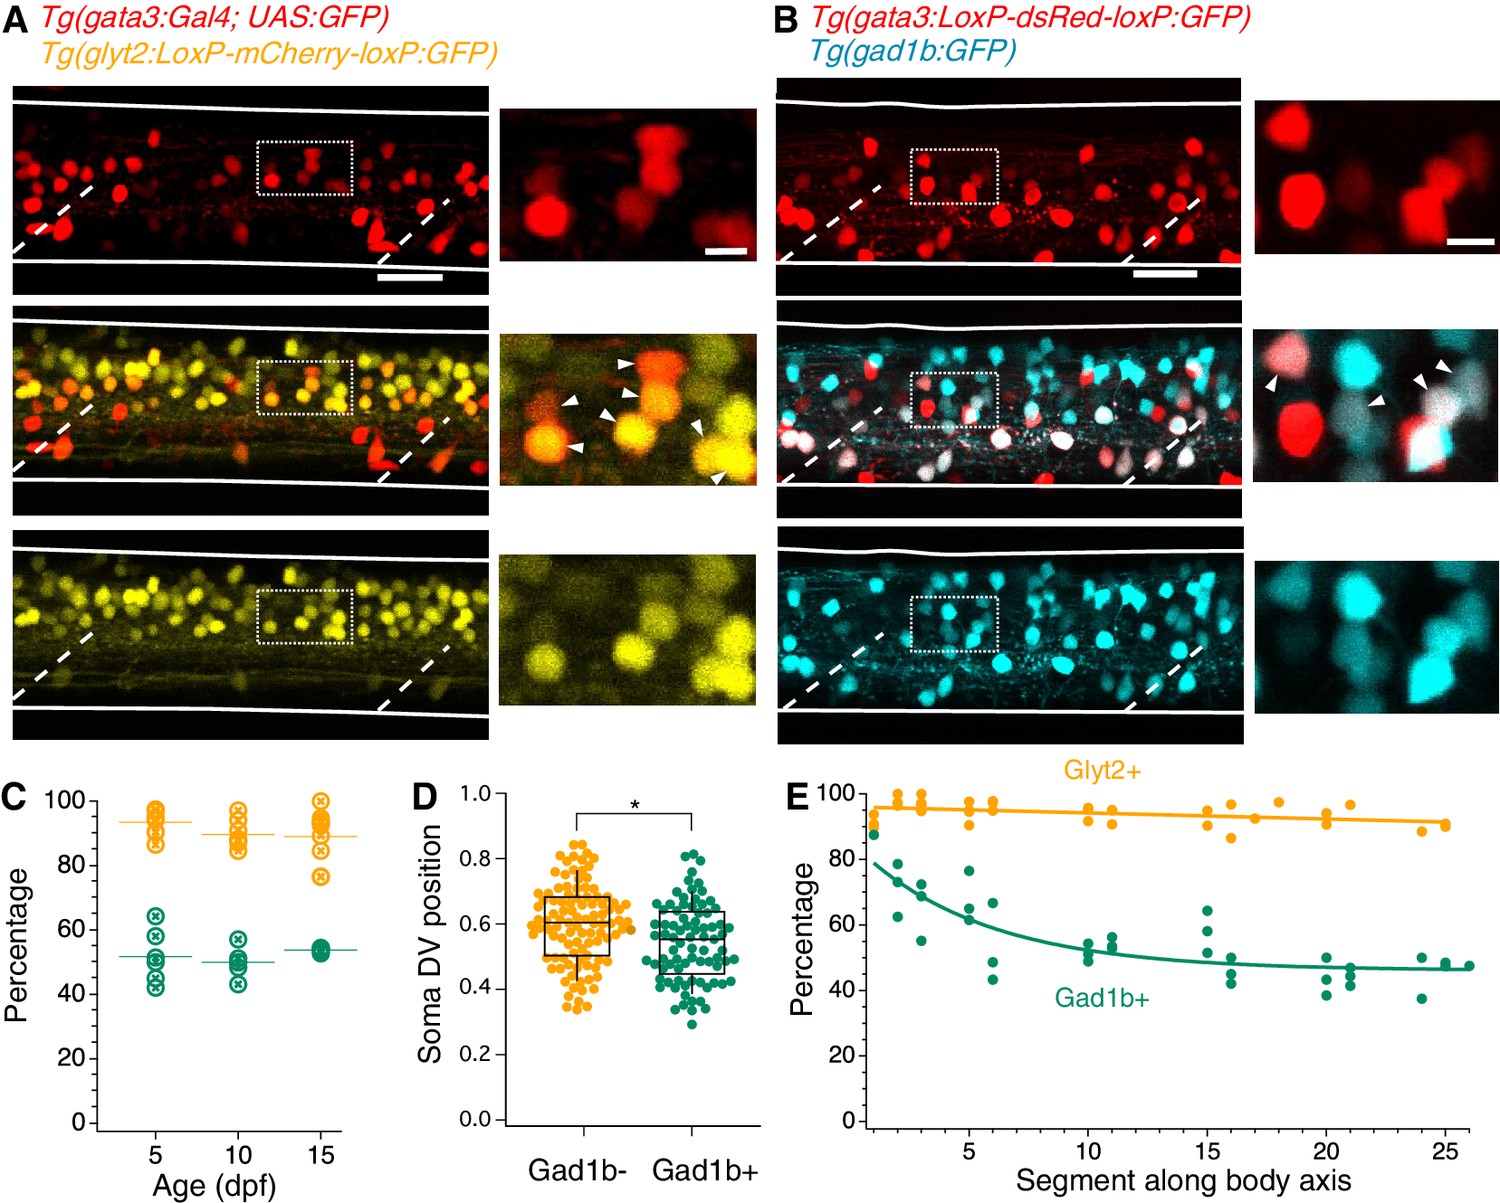
V2b neurons express the inhibitory neurotransmitter markers Glyt2 and Gad1b.
(A) Lateral z-projection of a spinal cord hemisegment in a Tg(gata3:Gal4,UAS:GFP;glyt2:loxP-mCherry-loxP:GFP) (Gata3, top; Glyt2, bottom) double transgenic animal with composite image (middle). Dashed lines indicate muscle segments and solid lines indicate the spinal cord dorsal and ventral boundaries. Magnified inset, from dashed box, showing soma-level colocalization is shown to the right. Soma colocalization indicated with white arrowheads. Scale bar = 20 μm; inset 5 μm. (B) Tg(gata3:loxP-DsRed-loxP:GFP;gad1b:GFP) (Gata3, top; Gad1b, bottom) and dual-color composite image (middle). Magnified inset, from dashed box, is shown to the right. Soma colocalization indicated with white arrowheads. Scale bar = 20 μm; inset 5 μm. (C) Percentage of V2b neurons co-expressing Glyt2 (yellow) or Gad1b (green) is stable from ages 5–15 dpf, as measured in body segments 15–16. N = 6 animals at each time point, two clutches. (D) V2b soma position for Gad+ and Gad- neurons differs slightly in the dorsoventral axis, *p<0.01 (p=1.87×10⁻³), N = 108 neurons in N = 6 animals from two clutches, Student’s t-test. (E) Percentage of V2b neurons co-expressing Glyt2 or Gad1b along the rostrocaudal body axis, N = 6 animals from two clutches.
-
Figure 2—source data 1
Data underlying quantification of Gad1b/GlyT2 co-expression.
- https://doi.org/10.7554/eLife.47837.008
Figure 3
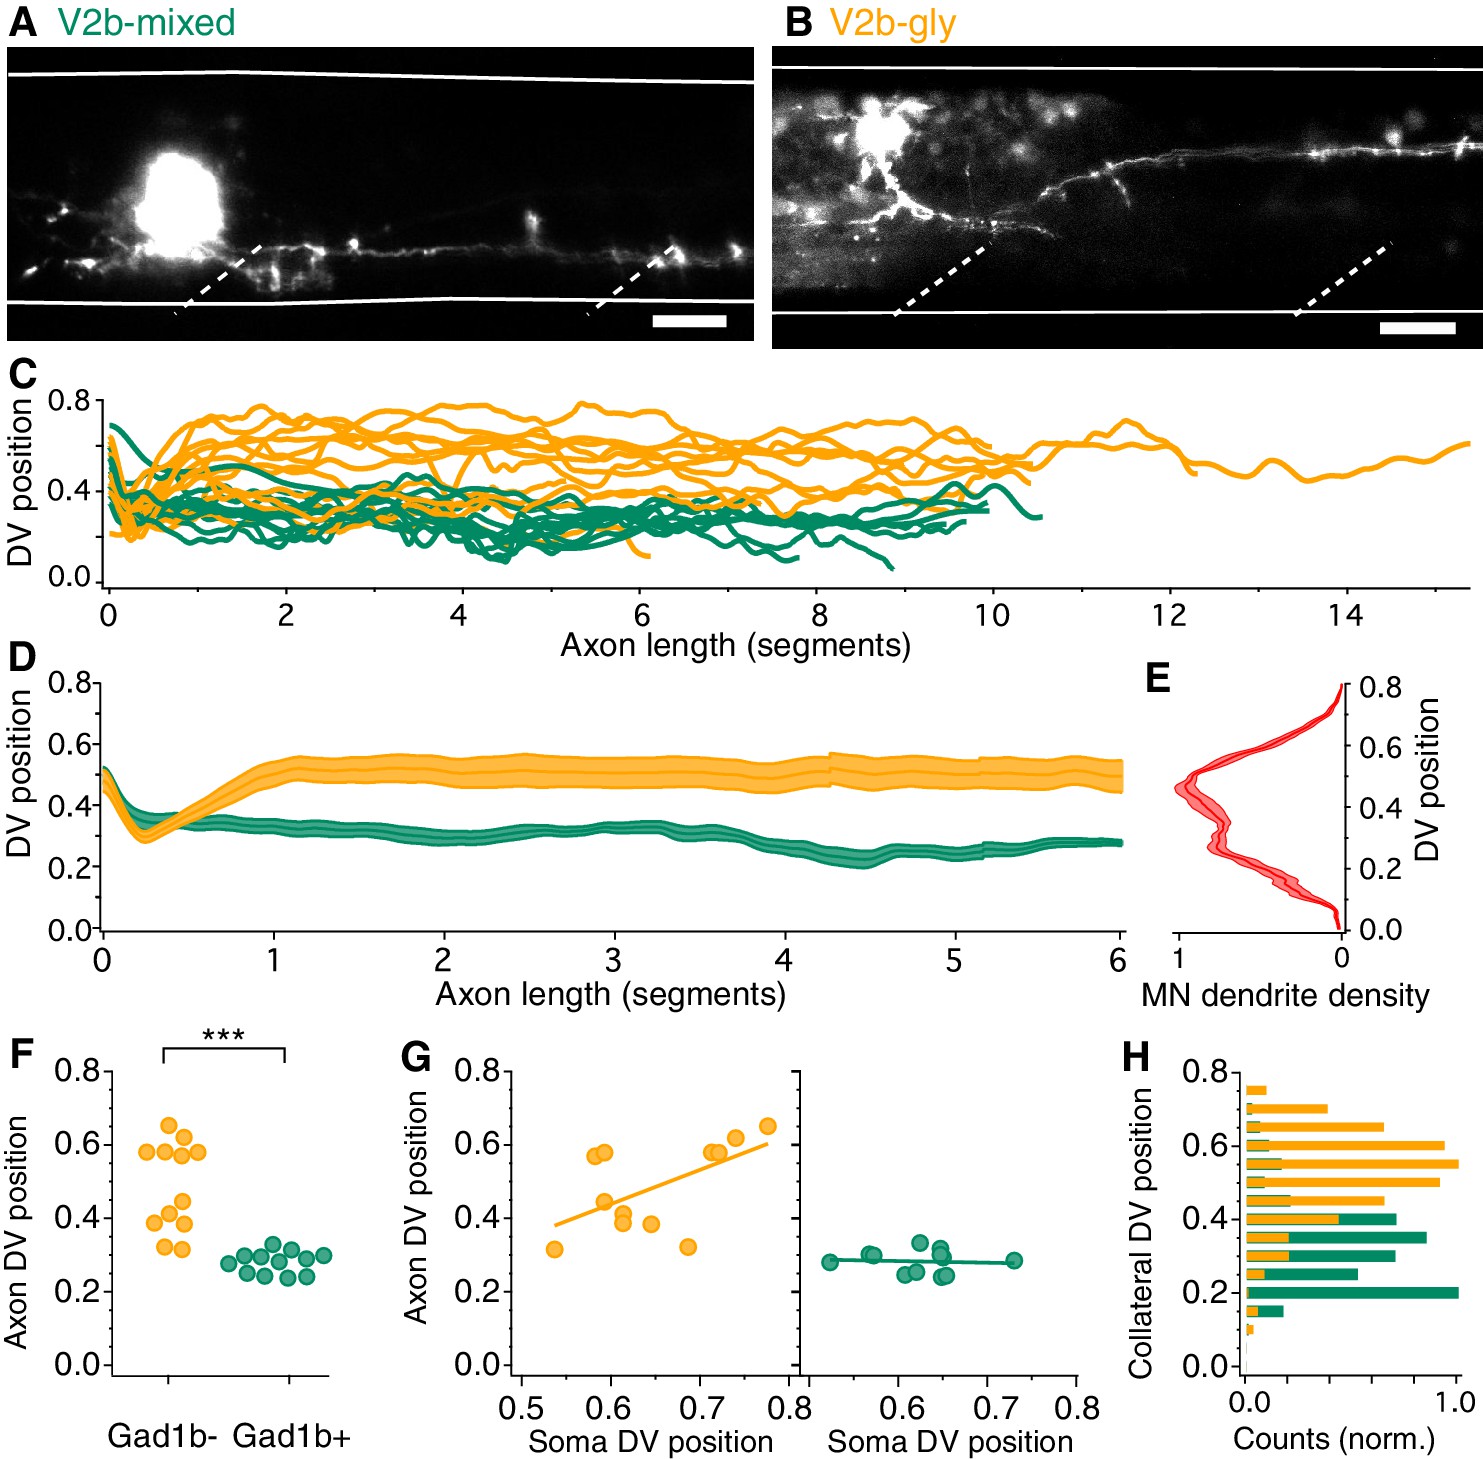
V2b-gly and V2b-mixed neurons have distinct axon morphology and innervation territories.
(A) Examples of a V2b-mixed (Tg(gad1b:GFP)+) and a (B) V2b-gly (Tg(gad1b:GFP)-) single-cell dye fill. Dashed lines indicate muscle segments and solid lines indicate the spinal cord dorsal and ventral boundaries. Scale bars = 20 μm. (C) Axon traces for V2b neurons, aligned at the segment of origin, relative to the spinal cord dorsoventral boundaries (V2b-mixed, green, N = 12; V2b-gly, orange, N = 12 from eight clutches). All axons were exclusively descending. (D) Mean and SEM of V2b-gly and V2b-mixed axon trajectories. (E) Motor neuron dendrite fluorescence intensity, measured in Tg(mnx:GFP), relative to the same dorsoventral landmarks. (F) Mean axon position for each traced axon. ***p<0.0001 (p=8.23×10⁻⁵), Student’s t-test. (G) Average axon position of V2b-mixed (green, left) and V2b-gly (orange, right) relative to soma position for each neuron. A correlation between soma position and axon position is observed for V2b-gly but not V2b-mixed neurons. V2b-gly: r2 = 0.33, p<0.05, V2b-mixed: r2 = 0.0059, p=n .s. (H) Axon collaterals of V2b-gly neurons also innervate more dorsal spinal cord territory than V2b-mixed axons.
-
Figure 3—source data 1
Data underlying quantification of axon position.
- https://doi.org/10.7554/eLife.47837.010
Figure 4 with 1 supplement
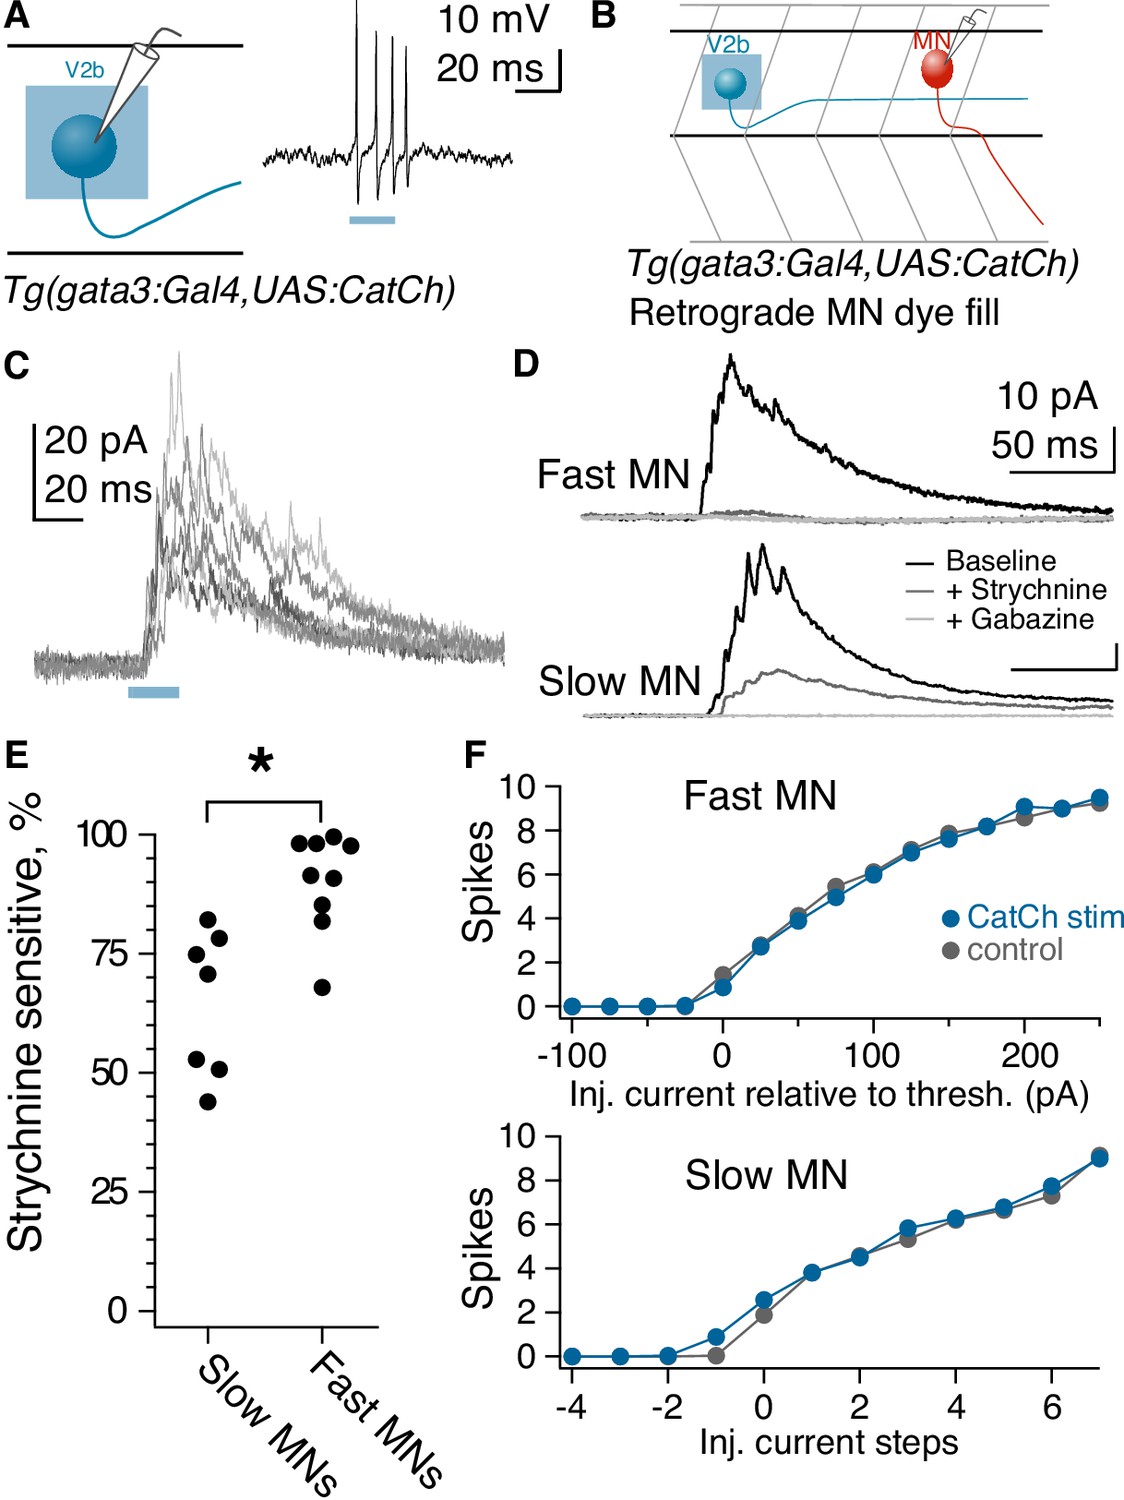
Fast motor neurons receive predominantly glycinergic V2b inputs, whereas V2b synaptic inputs to slow motor neurons are mediated by both GABA and glycine receptors.
(A) Schematic of recording to validate CatCh expression in V2b neurons and cell-attached recording from a V2b neuron expressing CatCh during a 20 ms illumination epoch. Note that evoked action potentials outlast the duration of illumination, presumably due to membrane depolarization and/or Ca influx. (B) Schematic illustrating whole-cell recordings from motor neurons paired with optogenetic stimulation of V2b neurons. (C) Six overlaid sweeps showing ISPCs barrages recorded in a motor neuron in response to optogenetic activation of V2b neurons. Blue bar represents the light stimulus. All recordings were carried out in the presence of NBQX. (D) Average IPSC responses to light stimulation in fast (top) and slow (bottom) motor neurons, as identified by soma location and input resistance. Response during baseline (black), after application of strychnine (dark gray), and after additional application of gabazine (light gray). In all cases, the IPSC was entirely abolished by the combination of strychnine and gabazine. N = 7 slow motor neurons from two clutches, N = 9 fast motor neurons from four clutches. (E) Percentage peak current reduction by strychnine in fast and slow motor neurons. *p<0.01 (p=2.0×10⁻³). (F) Elicited spike counts in motor neurons (fast motor neurons, top; slow, bottom) during 30 ms depolarizing steps, ranging from sub- to supra-threshold, with (blue) and without (black) concurrent optogenetic activation of V2bs. Input resistance varied across slow motor neurons, and accordingly the number of current steps relative to threshold is shown rather than the actual injected current (stepsize range: 5–25 pA).
-
Figure 4—source data 1
Characteristics of V2b-evoked inhibition in motor neurons, source data.
- https://doi.org/10.7554/eLife.47837.013
Figure 4—figure supplement 1
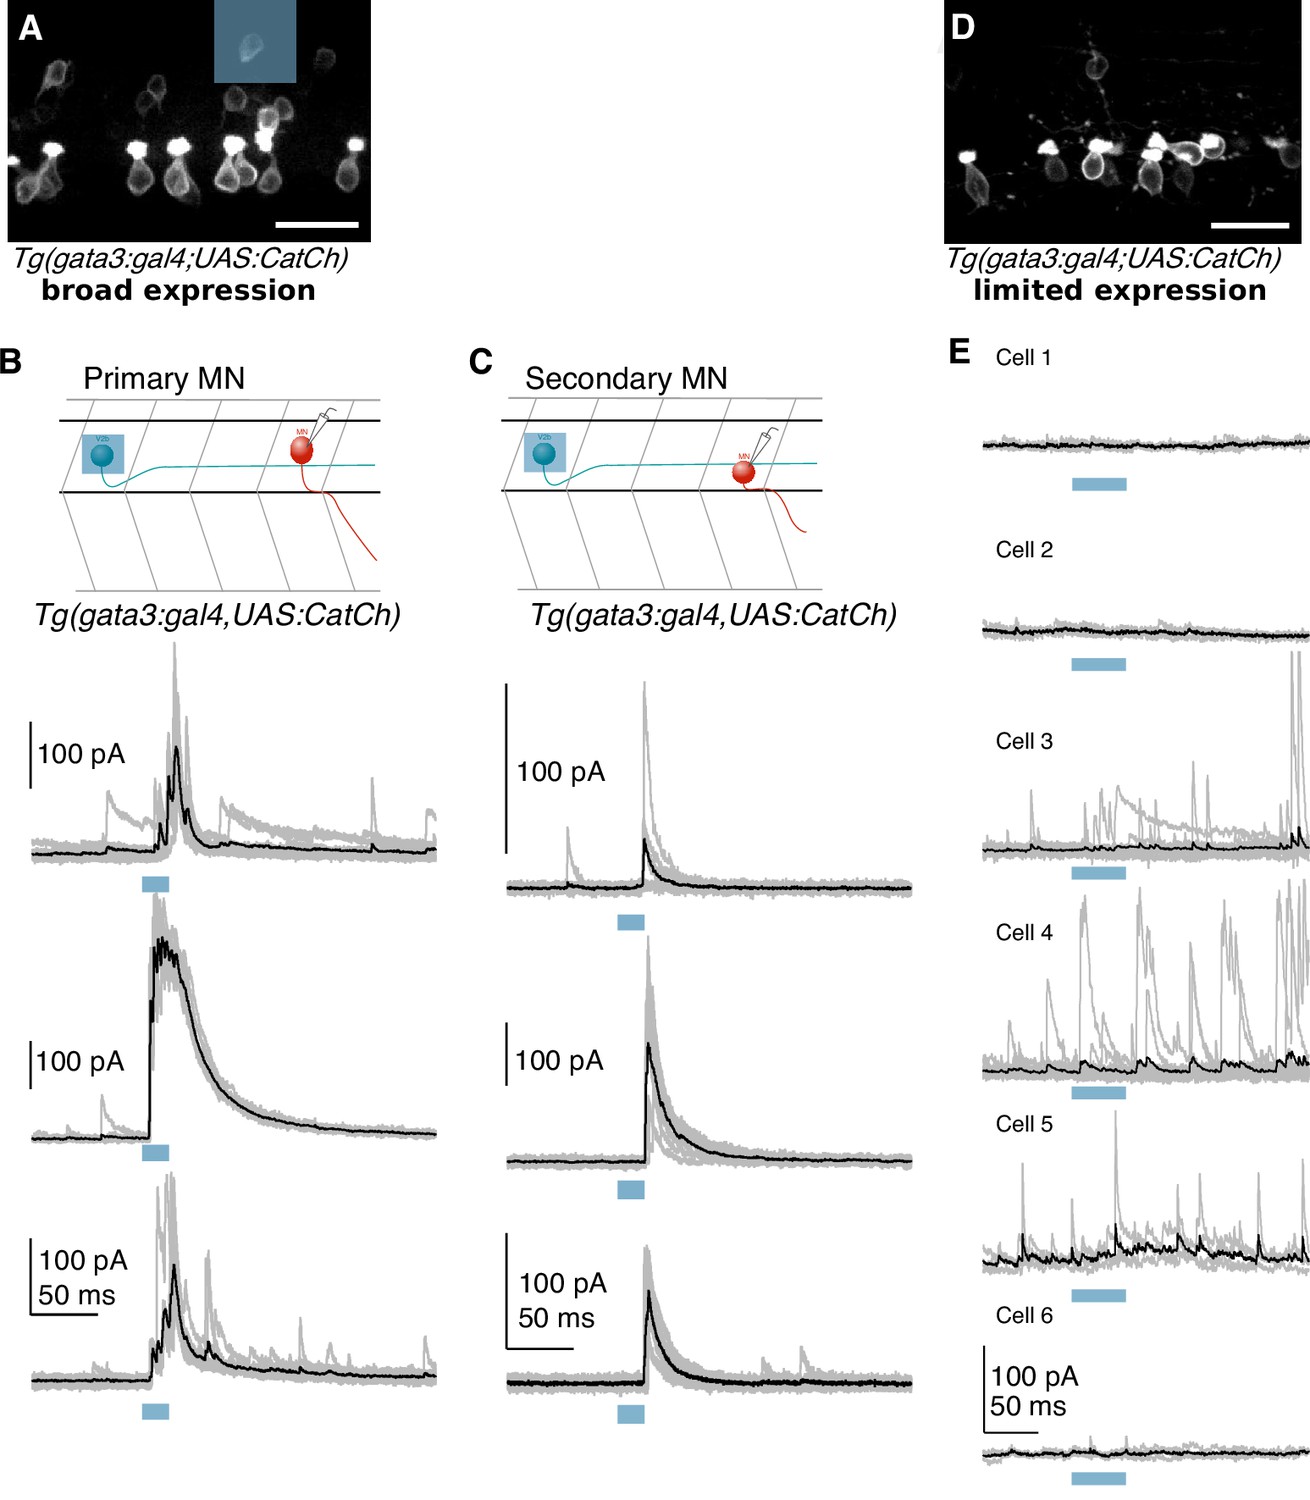
Optogenetically evoked IPSCs originate from V2b neurons, not CSF-cNs.
(A) Confocal projection of a hemisegment of spinal cord in a Tg(gata3:Gal4; UAS:CatCh) animal with broad CatCh expression. A blue square panel shows an example 20 μm x 20 μm DMD stimulation pattern in which 1–2 V2b cells are targeted. Scale bar = 20 μm. (B) Schematic and whole cell recordings from fast motor neurons in animals with broad CatCh expression, such as in (A). Shorter stimulation times (20 ms) and targeted illumination, as schematized in (A), reliably elicit IPSCs in fast motor neurons. (C) Schematic and recordings from secondary (slow) motor neurons similar to (D). Light stimulation evoked IPSCs in slow motor neurons in 12/18 neurons. (D) Confocal image showing limited CatCh expression in a hemisegment of spinal cord in Tg(gata3:Gal4; UAS:CatCh) animals. CatCh is widely expressed in CSF-cN in both animals (A and D), but from animal to animal, there were variations in the intensity of CatCh expression in V2b neurons. Scale bar = 20 μm. (E) Whole cell recordings of fast motor neurons in animals with low V2b CatCh expression. Individual traces are shown in gray and averages in black. Blue bar represents the optical stimulation timing. Longer stimulation times (50 ms) and full field illumination were used to maximize IPSC responses in the recorded cell. Motor neurons receive few light-triggered currents in animals with low CatCh expression in V2b neurons. Together this demonstrates that synaptic currents in Figures 5 and 6 originate from V2b and not CSF-cN neurons.
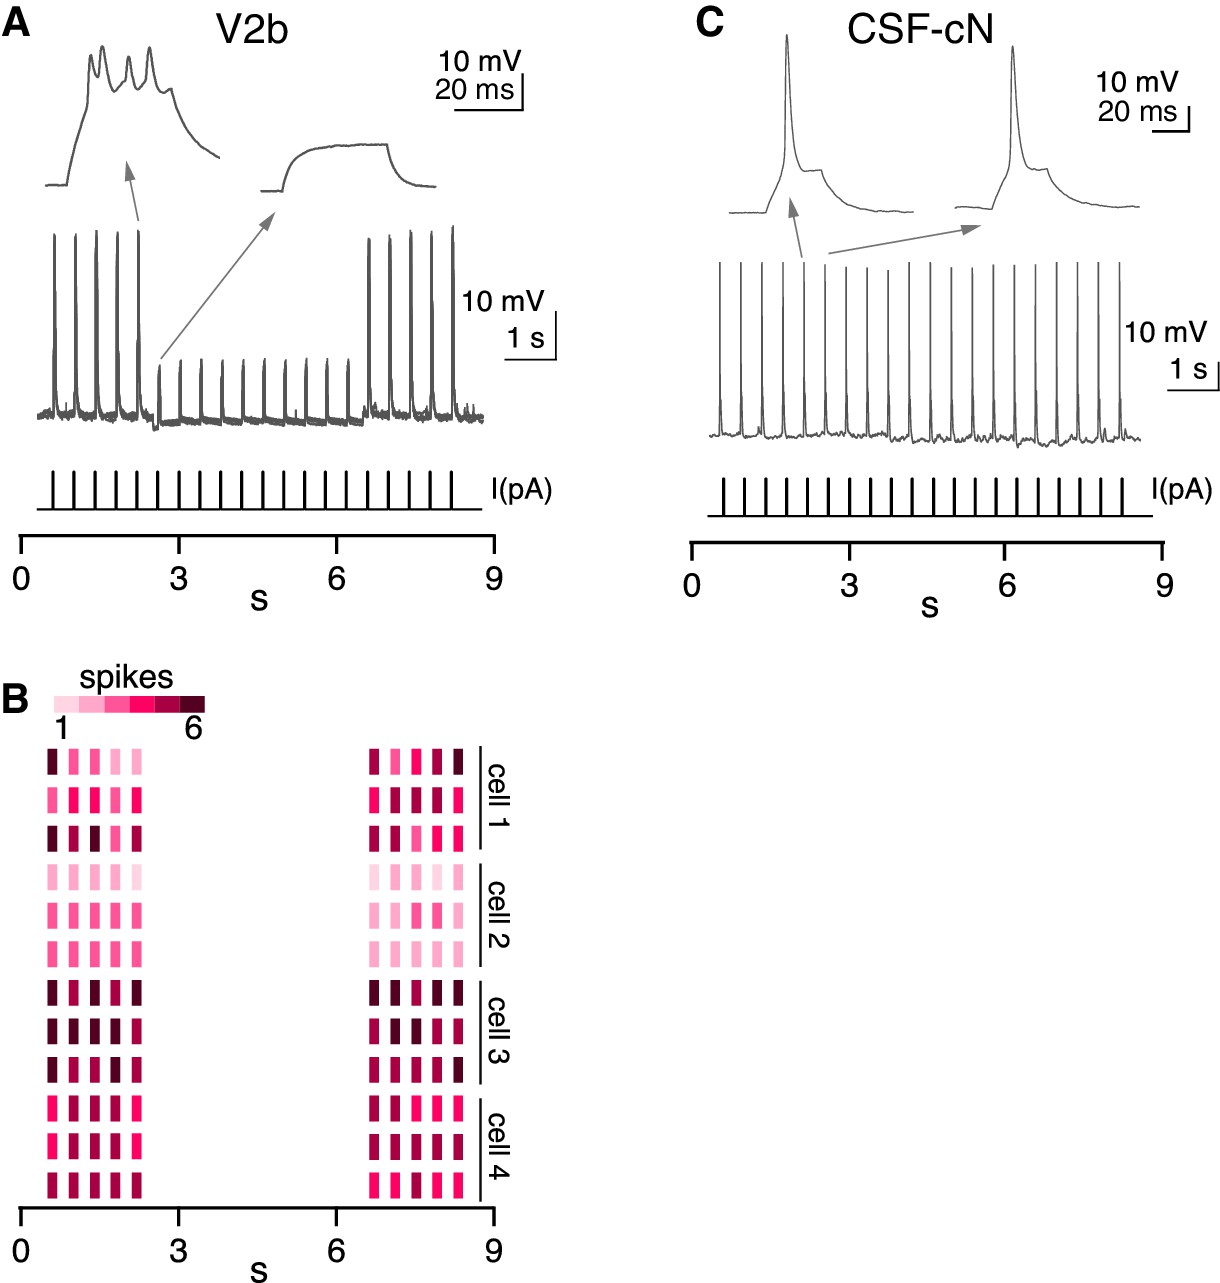
Figure 5

Rostral V2b neurons inhibit more caudal V2b neurons, providing circuit disinhibition; V2b-gly and V2b mixed populations are physiologically indistinguishable.
(A) Experimental schematic for V2b-to-V2b connectivity recordings. (B) Evoked IPSCs recorded in an example V2b neuron in response to optogenetic stimulation of more rostral V2b neurons, black, and the response after the successive addition of glycine and GABAA receptor antagonists, dark gray and light gray traces respectively. The blue bar represents the duration of optogenetic stimulation. (C) Percentage peak current sensitivity to strychnine. (D) Example action potential magnified from (E) responses to step depolarizations in both classes of V2b neurons. Most recorded neurons in both groups could not sustain action potentials across a step. (F) Input resistance measured via hyperpolarizing test pulse. N = 10 Gad- (orange), 9 Gad+ (green), from 5 and 6 clutches, respectively. Two neurons were excluded that were spontaneously firing on patch, both of which were round and near the canal, as putative CSF-cns. (G) Action potential half-widths are not significantly different between the two groups.
-
Figure 5—source data 1
Characteristics of V2b neuron physiology.
- https://doi.org/10.7554/eLife.47837.015
Figure 6 with 2 supplements
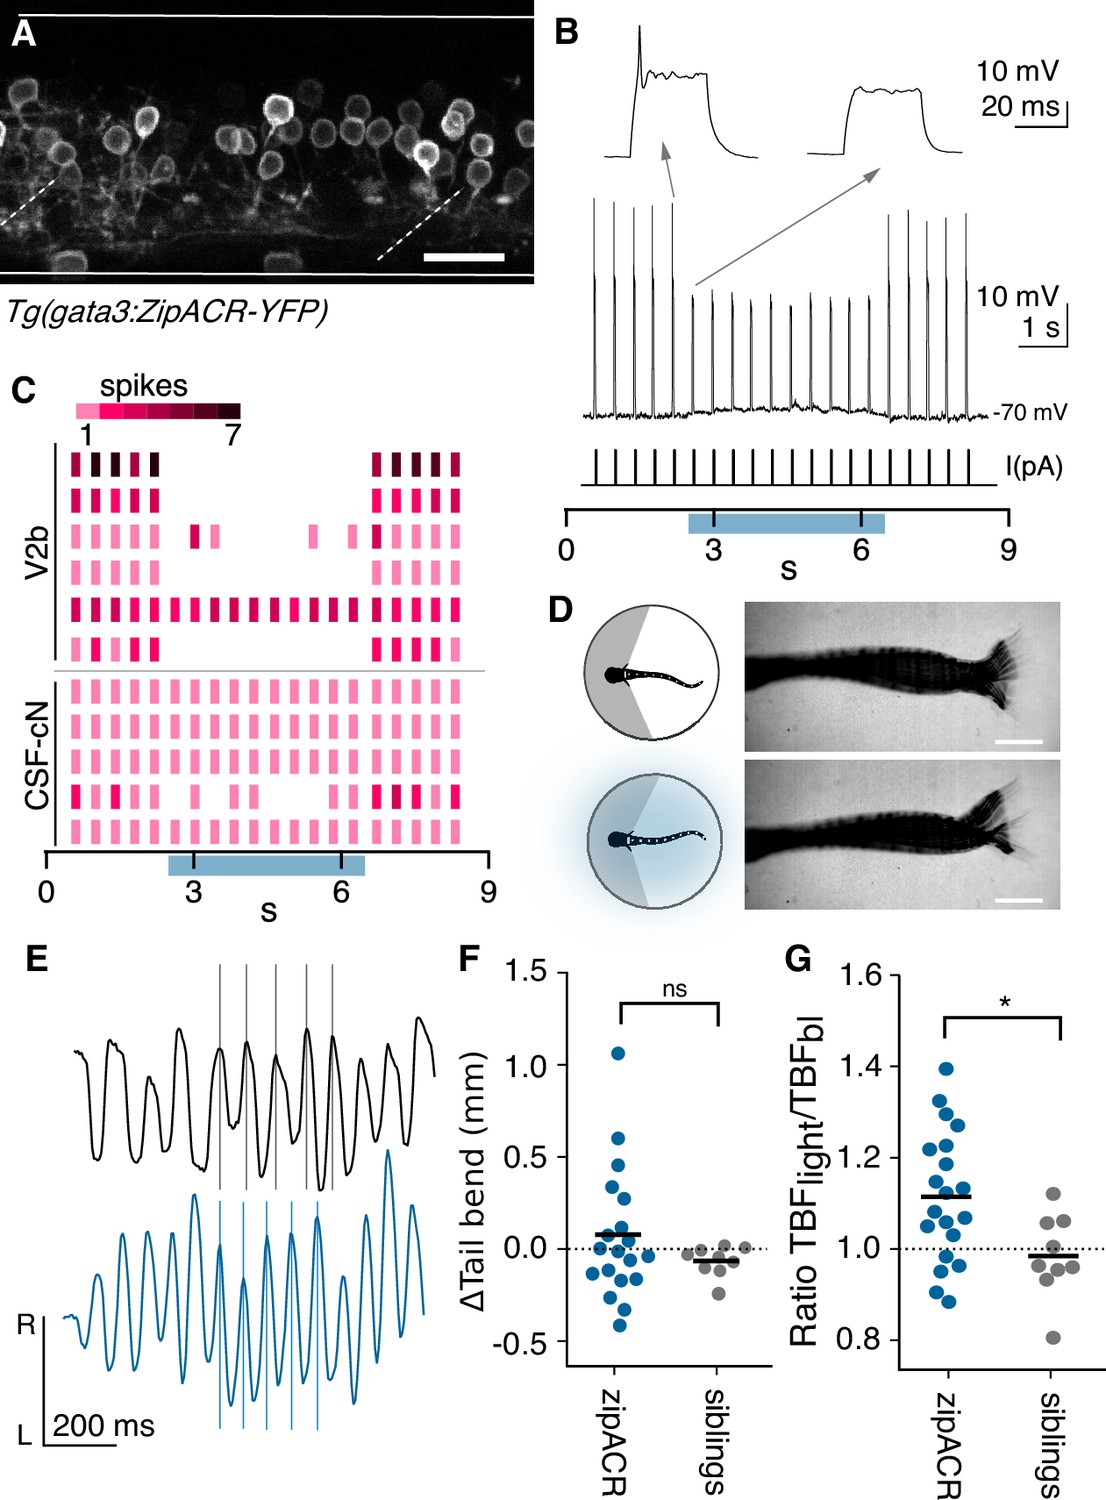
Optogenetic suppression of V2b activity leads to increased locomotor speeds.
(A) Z-projection of Tg(gata3:zipACR-YFP) over one full segment of spinal cord showing expression in V2b but not CSF-cN somata. CSF-cN apical extentions show some YFP expression. See also Figure 6—figure supplement 1. Scale bar = 20 μm. (B) A whole cell recording during repeated current steps (30 ms duration) is shown for an example V2b neuron in a Tg(gata3:zipACR-YFP) animal. Blue bar indicates period of optical stimulation. An expanded view of current steps before and during optical stimulation are shown above with arrows. Recordings indicate that current steps normally elicit bursts of action potentials, but coincident optogenetic suppression prevents spiking, yielding only subthreshold depolarizations. (C) Raster plot of action potentials for 6 V2b cells and 5 CSF-cN cells summarizes optogenetic suppression across cell types. Color value represents number of spikes elicited during each current step. 5/6 V2b neurons were mostly or entirely suppressed, whereas only 1/5 CSF-cN were affected. (D) Schematic of behavioral recording depicting the NMDA-induced tail movements of spinalized head-embedded animals without and with optogenetic stimulation. Image overlay of 100 ms of tail movements without and with light stimulation in a Tg(gata3:zipACR-YFP) animal show similar amplitude tail displacement during swim. Scale bar = 0.5 mm. (E) Tracked left-right tail position during recordings with (blue) and without (black) optical stimulation for the same Tg(gata3:zipACR-YFP) animal. Lines for each recording are aligned to consecutive peaks in the baseline trace to illustrate the phase advance and increased tail beat frequency during optogenetic stimulation. (F) Average change in tail bend amplitude between stimulation and control recordings during swim movements for each animal, ns (p=0.14). (G) Ratio of average TBF during stimulation to baseline TBF for each animal, cohort averages shown with black dash. N = 20 Tg(gata3:zipACR-YFP) and N = 9 siblings. *p<0.01 (p=7.23×10⁻³).
-
Figure 6—source data 1
Quantification of zipACR suppression.
- https://doi.org/10.7554/eLife.47837.019
Figure 6—figure supplement 1
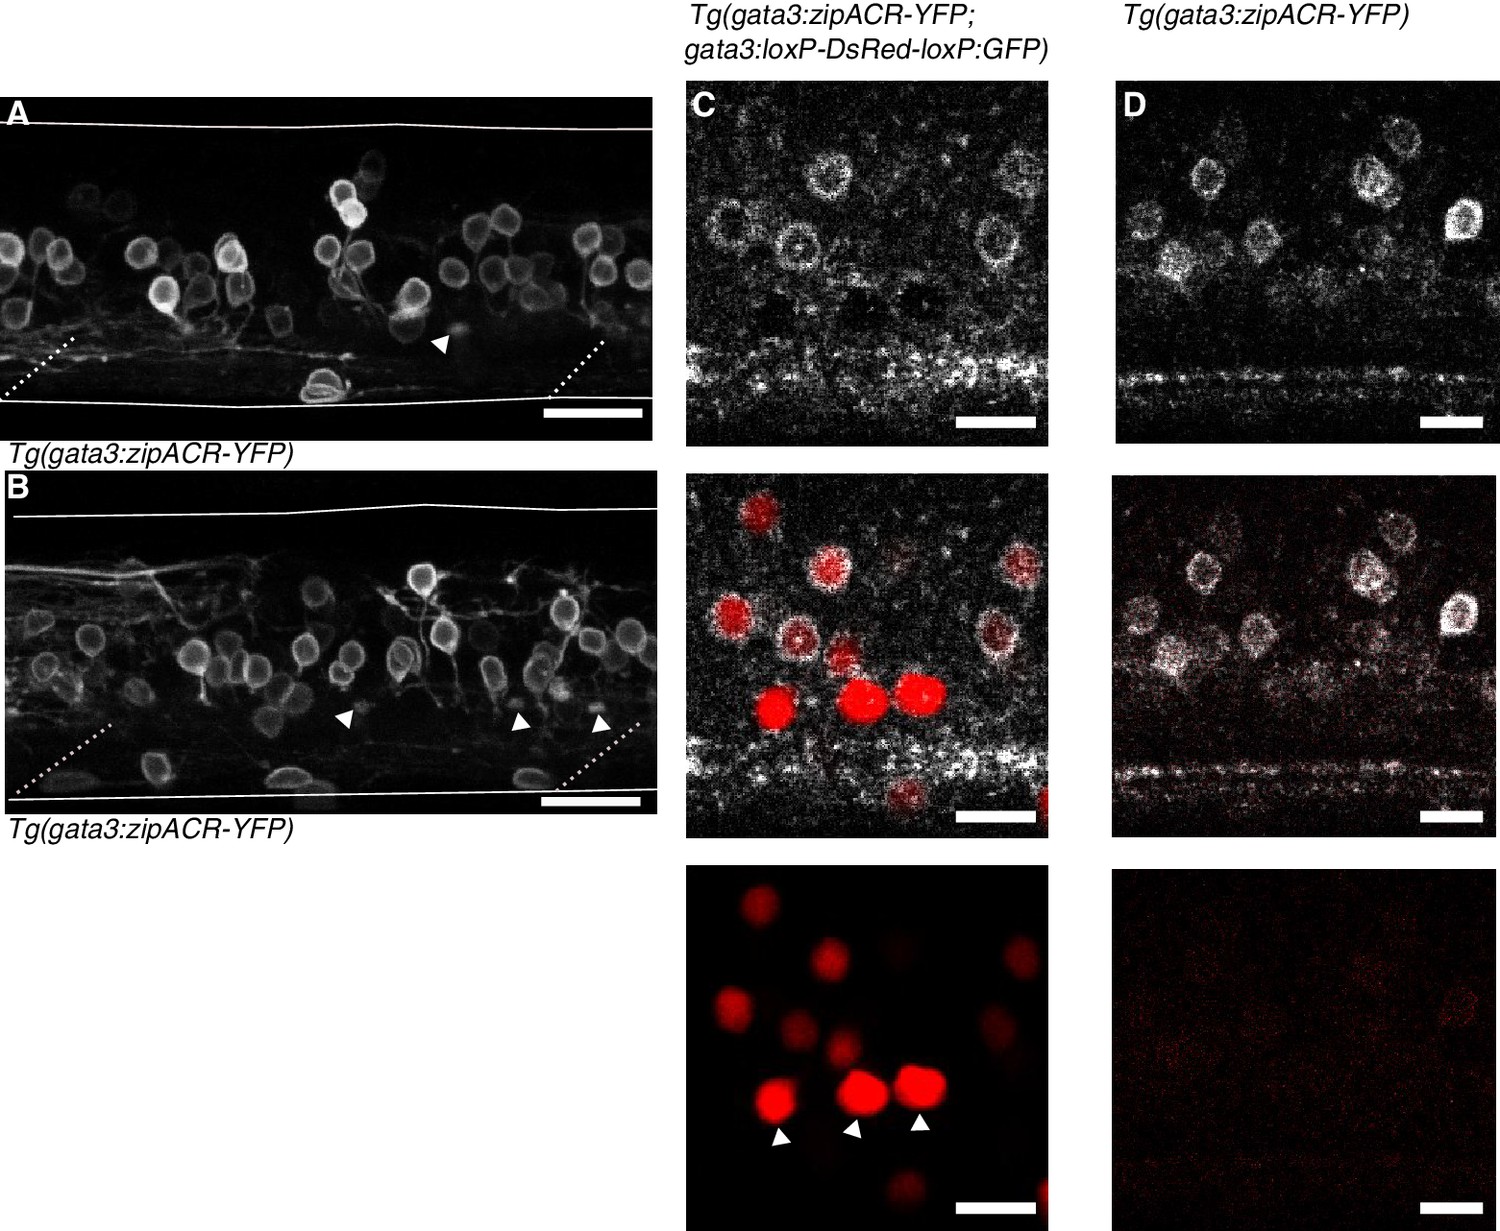
Anatomy of Tg(gata3:zipACR-YFP) expression.
(A) and (B) depict additional images of Tg(gata3:zipACR-YFP) expression in the full mediolateral extent of the spinal cord in one segment. White triangles mark putative CSF-cN appical extensions into the central canal. Noteably CSF-cN soma are not labeled with YFP. Scale bars = 20 μm. (C) Spectrally deconvolved images of Tg(gata3:zipACR-YFP; gata3:loxP-DsRed-loxP:GFP), see Materials and methods. White (top) shows YFP emission and red (bottom) shows DsRed emission. Dorsal CSF-cN are noted with white triangles. CSF-cN somata are distinctly labeled with DsRed (BAC generated line) but not YFP (CRISPR generated line). Scale bar = 10 μm. (D) Example spectral deconvolution of Tg(gata3:zipACR-YFP) showing negligible DsRed emission in control sample. Scale bar = 10 μm.
Figure 6—figure supplement 2
Additional recordings in Tg(gata3:zipACR-YFP) animals.
(A) A whole cell recording during repeated current steps (20 ms duration) is shown for an example V2b neuron in a Tg(gata3:zipACR-YFP) animal. High intensity light stimulation is indicated by the blue bar. An expanded view of current steps before and during optical stimulation are shown above with arrows. (B) Raster plot of action potentials for 3 trials of 4 V2b cells demonstrates the robust supression of spiking in V2b with high intensity light. Color value represents number of spikes elicited during each current step. (C) A whole cell recording is shown for an example CSF-cN neuron in a Tg(gata3:zipACR-YFP) animal, low intensity light stimulation, similar to Figure 7, is provided and indicated by the blue bar. An expanded view of current steps before and during optical stimulation are shown above with arrows.
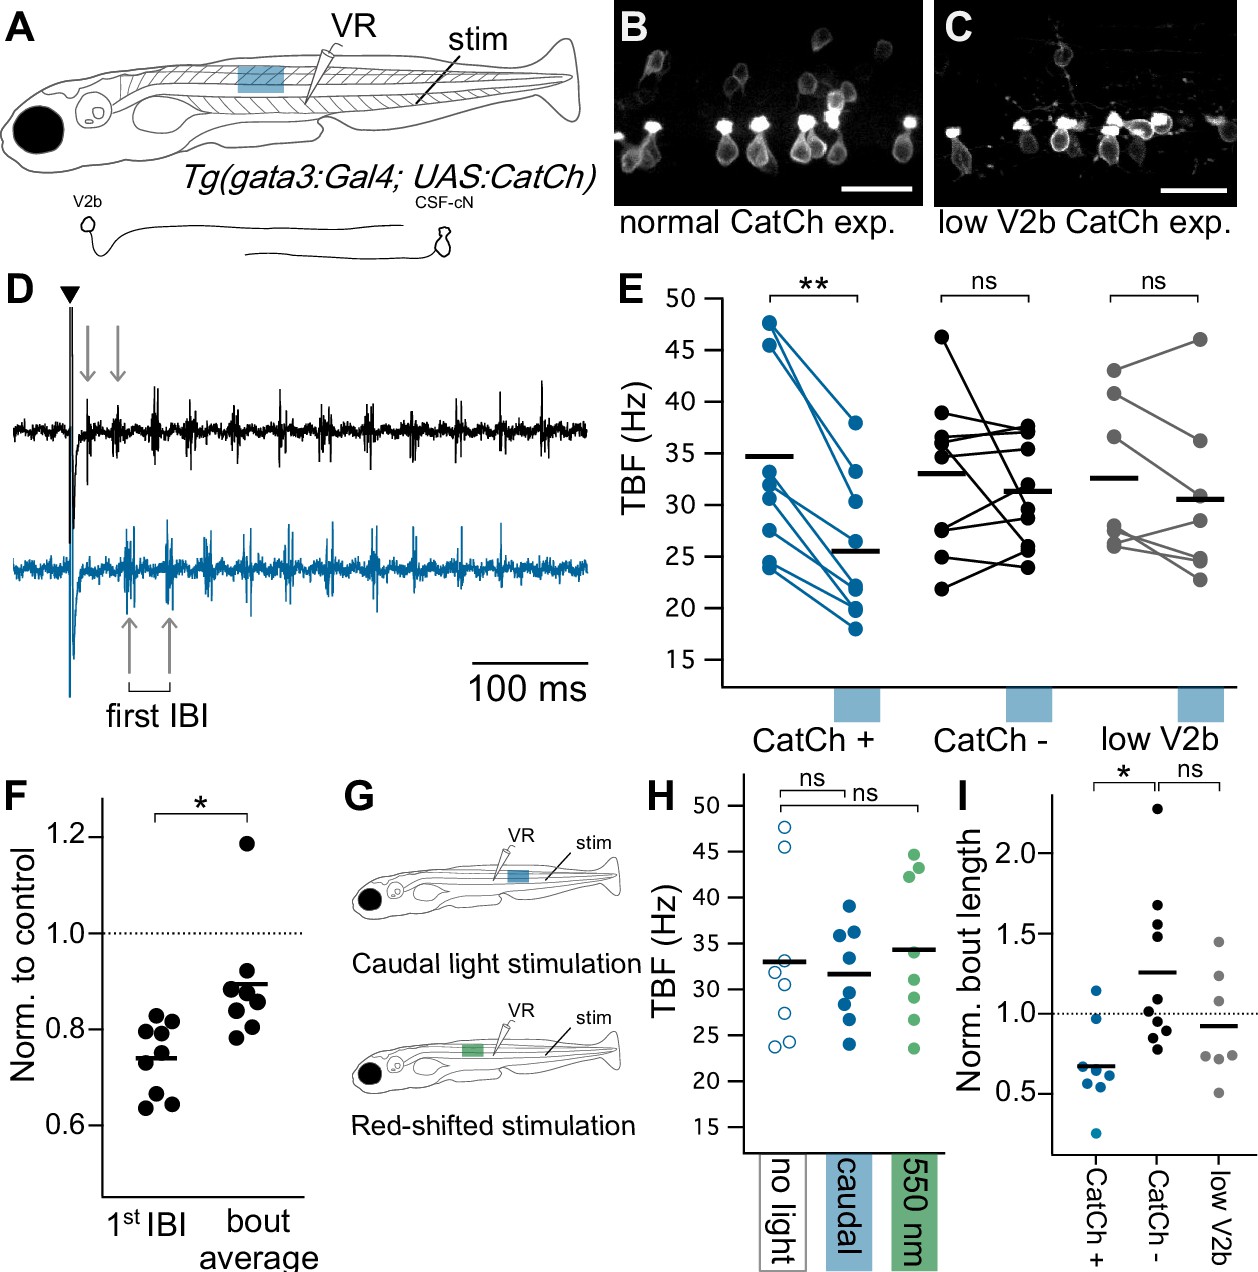
Figure 7
Optogenetic activation of Gata3+ neurons leads to decreased locomotor speeds.
(A) Schematic of ventral root recording and electrical tail stimulation with rostrally-positioned optogenetic stimulation in Tg(gata3:Gal4; UAS:CatCh) animals. Representation of V2b and CSF-cN cellular morphology. Confocal z-projections show CatCh expression in one segment of spinal cord in (B) an animal with broad CatCh expression in V2b and CSF-cN cell types and (C) an animal with low CatCh expression in V2b neurons. Scale bars = 20 μm. (D) Example recording of ventral root motor activity after electrical stimulation (caret) showing the swim rhythm in the control (black) and optogenetically stimulated trial (blue) for the same animal. Arrows distinguish the first inter-burst interval (IBI), showing a difference in tail beat frequency. (E) Multi-trial average of first IBI compared between trials with (blue x-axis bar) and without optogenetic stimulation for animals with broad CatCh expression (CatCh+), sibling controls (CatCh-), and low V2b-expressing CatCh+ animals (low V2b). Dashes represent cohort averages. **p<0.001 (p=1.72×10⁻⁴). (F) TBF during rostral optogenetic stimulation normalized to no-light control for the first IBI and swim bout average IBI. *p<0.01 (p=1.23×10⁻³). (G) Experimental schematic of additional control experiments including a caudally-located stimulation (top) and a red-shifted light stimulation (bottom). (H) Multi-trial average of first IBI in Tg(gata3:Gal4; UAS:CatCh) animals with broad CatCh expression show that caudal stimulation (blue) and red-shifted light stimulation controls (green) do not vary from baseline non-optogenetic stimulation IBIs (open circles). (I) Bout duration during rostral optogenetic stimulation is shown normalized to the baseline bout duration *p<01 (p=4.65×10⁻³). Broad CatCh-expressing animals, n = 9, CatCh- siblings, n = 10, low V2b expression, n = 7.
-
Figure 7—source data 1
Quantification of behavioral effects of V2b activation.
- https://doi.org/10.7554/eLife.47837.021
Tables
Table 1
Summary of in-situ hybridization transgenic line validation, including completeness and accuracy.
https://doi.org/10.7554/eLife.47837.006| Transgenic line | Completeness (%) | Sd | Accuracy (%) | Sd |
|---|---|---|---|---|
| Tg(gata3:loxP-DsRed-loxP:GFP) | 96.57 | 5.34 | 95.75 | 6.45 |
| Tg(gata3:Gal4; UAS:GFP) | 84.36 | 10.79 | 89.64 | 5.92 |
| Tg(gad1b:GFP) | 93.33 | 6.67 | 88.77 | 12.69 |
| Tg(glyt2:loxP-mCherry-loxP:GFP) | 86.51 | 7.26 | 92.21 | 2.70 |
Key resources table
| Reagent type (species) or resource | Designation | Source or reference | Identifiers | Additional information |
|---|---|---|---|---|
| Genetic reagent (Danio rerio) | gata3:loxP-DsRed-loxP:GFP | This paper | ZFIN ID: ZDB-TGCONSTRCT-190724–1 | BAC line generation |
| Genetic reagent (Danio rerio) | gata3:Gal4 | This paper | ZFIN: ZDB-TG CONSTRCT-190724–2 | BAC line generation |
| Genetic reagent (Danio rerio) | gata3:ZipACR-YFP | This paper | ZFIN: ZDB-ALT-190813-3 | CRISPR knock-in |
| Genetic reagent (Danio rerio) | Gad1b:GFP | (Satou et al., 2013) | ZFIN: ZDB-ALT-131127–6 | BAC line generation |
| Genetic reagent (Danio rerio) | glyt2:loxP-DsRed-loxP:GFP | (Kimura et al., 2014) | ZFIN: ZDB-FISH -150901–22721 | CRISPR knock-in |
| Genetic reagent (Danio rerio) | UAS:CatCh | McLean lab (Bagnall and McLean, 2014) | Plasmid and Tol-2 mediated DNA insertion | |
| Software | WinWCP | J. Dempster, University of Strathclyde | RRID: SCR_014713 | |
| Software | Igor Pro procedure file | This paper | Github: https://github.com/bagnall- lab/V2b_paper_igor_code | |
| Software | Tail tracking Matlab code | This paper, adapted from Severi et al. (2018) | https://github.com/bagnall-lab/V2b_behavior |
Additional files
-
Transparent reporting form
- https://doi.org/10.7554/eLife.47837.022
Download links
A two-part list of links to download the article, or parts of the article, in various formats.
Downloads (link to download the article as PDF)
Open citations (links to open the citations from this article in various online reference manager services)
Cite this article (links to download the citations from this article in formats compatible with various reference manager tools)
Spinal V2b neurons reveal a role for ipsilateral inhibition in speed control
eLife 8:e47837.
https://doi.org/10.7554/eLife.47837


