Proximity labeling of protein complexes and cell-type-specific organellar proteomes in Arabidopsis enabled by TurboID
- Stanford University, United States
- Howard Hughes Medical Institute, United States
- Carnegie Institution for Science, United States
- Massachusetts Institute of Technology, United States
- Chan Zuckerberg Biohub, United States
Figures
Figure 1 with 5 supplements
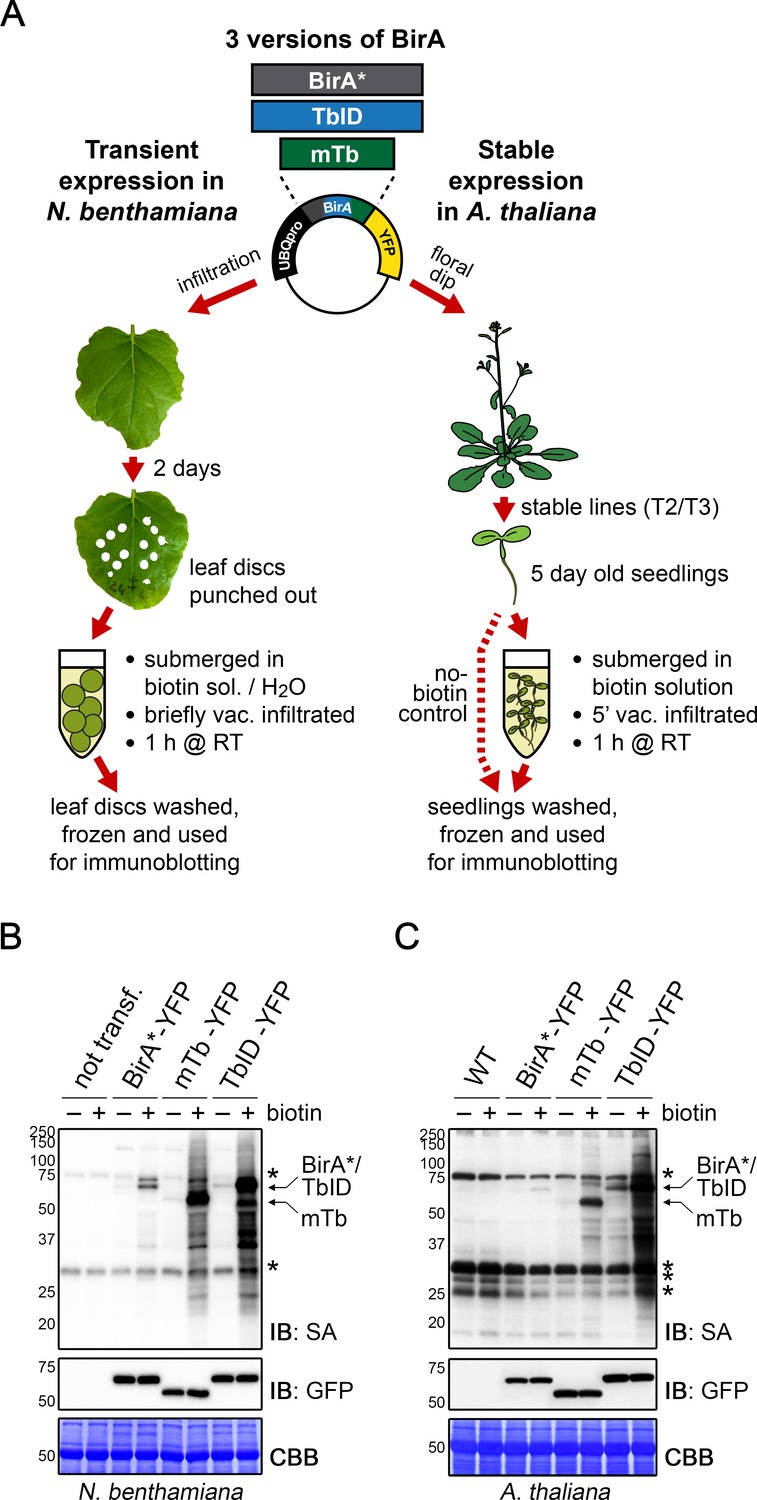
TbID and mTb exhibit robust biotinylation activity in N. benthamiana and Arabidopsis.
(A) Overview of the experimental setup. UBQ10pro::BirA*/TbID/mTb-YFP constructs with an NLS or NES for nuclear or cytosolic localization were used for transient and stable transformation of N. benthamiana and A. thaliana, respectively. Tobacco leaf discs or whole Arabidopsis seedlings were submerged in a 250 µM biotin solution, briefly vacuum infiltrated, incubated for 1 h at room temperature (RT,~22°C) and frozen. Untreated controls were infiltrated with H2O or frozen directly. Expression and activity of the BirA versions were analyzed by immunoblotting. (B–C) Biotin ligase activity in N. benthamiana (B) and Arabidopsis (C). Streptavidin (SA) and anti-GFP immunoblots (IB) of protein extracts from tobacco leaf discs and Arabidopsis expressing the cytosolic BirA variants without (-) and with (+) biotin treatment. Untransformed tobacco leaves and Col-0 wild-type (WT) seedlings were used as controls. Each sample is a pool of 3 leaf discs or ~ 30 seedlings. Coomassie Brilliant Blue-stained membranes (CBB) are shown as a loading controls. Asterisks mark the positions of naturally biotinylated proteins. For microscopy images showing the subcellular localization of the BirA variants in N. benthamiana and Arabidopsis see Figure 1—figure supplements 1 and 2. For immunoblots showing the activity and expression of both cytosolic and nuclear BirA versions in N. benthamiana and Arabidopsis see Figure 1—figure supplements 3 and 4. For a schematic overview over the generation and composition of the available vectors in the ‘PL toolbox’ see Figure 1—figure supplement 5.
Figure 1—figure supplement 1
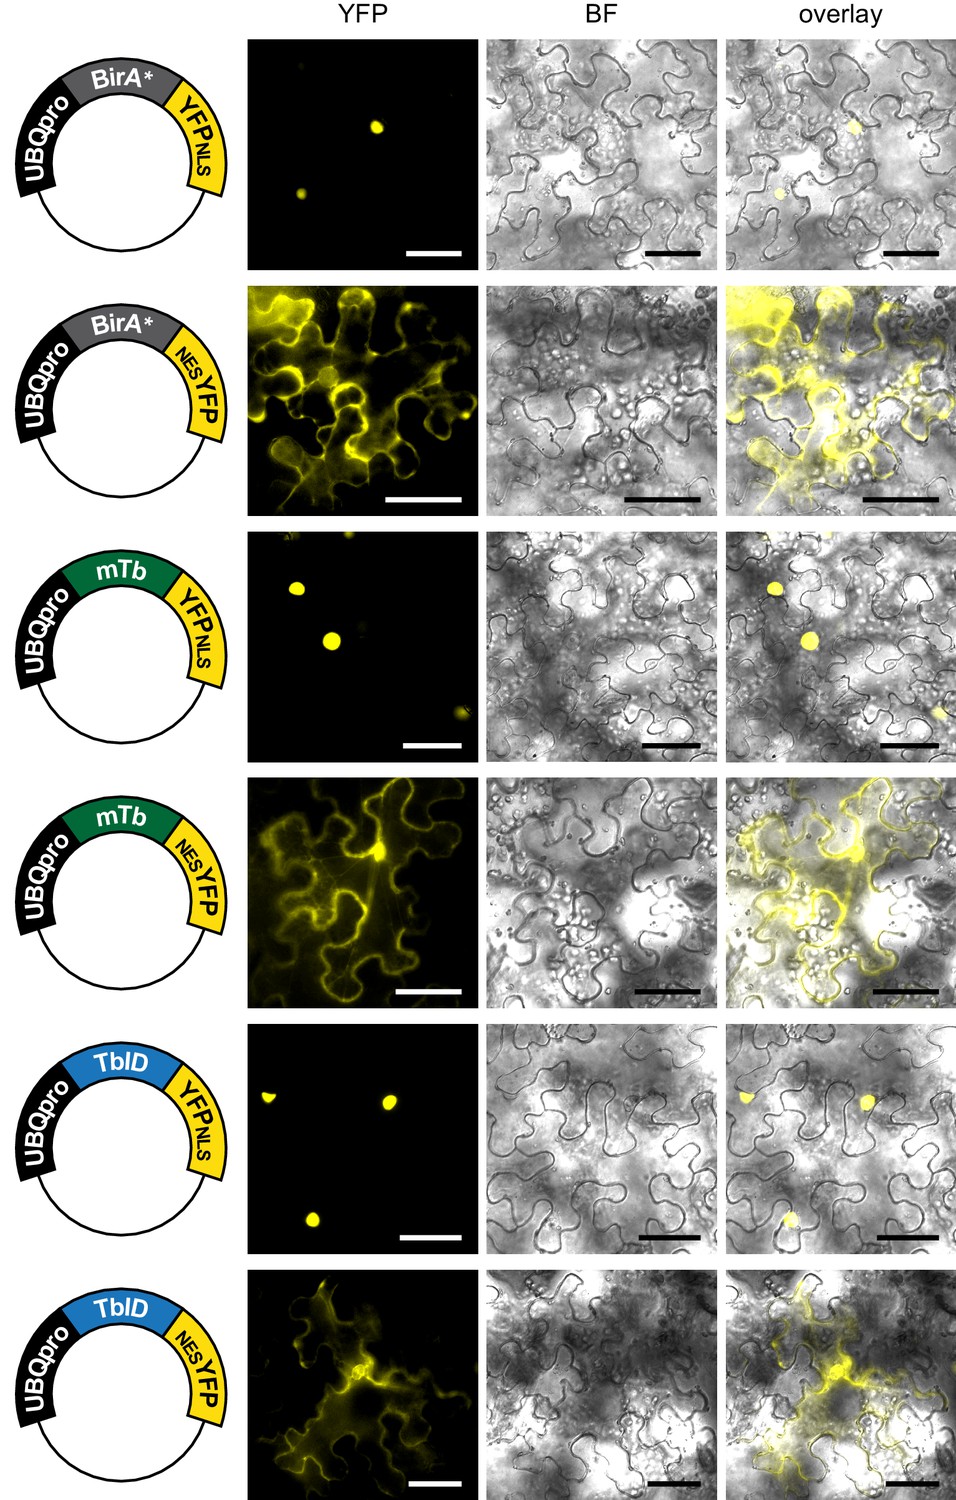
Subcellular localization of biotin ligase constructs in transiently transformed N. benthamiana leaves.
Epifluorescence images of N. benthamiana leaves transformed with UBQ10pro::BirA-YFPNLS or UBQ10pro::BirA-NESYFP expression vectors (BirA = BirA*, mTb or TbID) 2 days after transformation. Shown are the YFP and brightfield (BF) channels and an overlay. Scale bar = 50 µm. Constructs are indicated on the left. Nuclear targeted BirA-YFP (NLS) constructs were largely nuclear and cytosol targeted BirA-YFP versions (NES) constructs largely cytosolic.
Figure 1—figure supplement 2
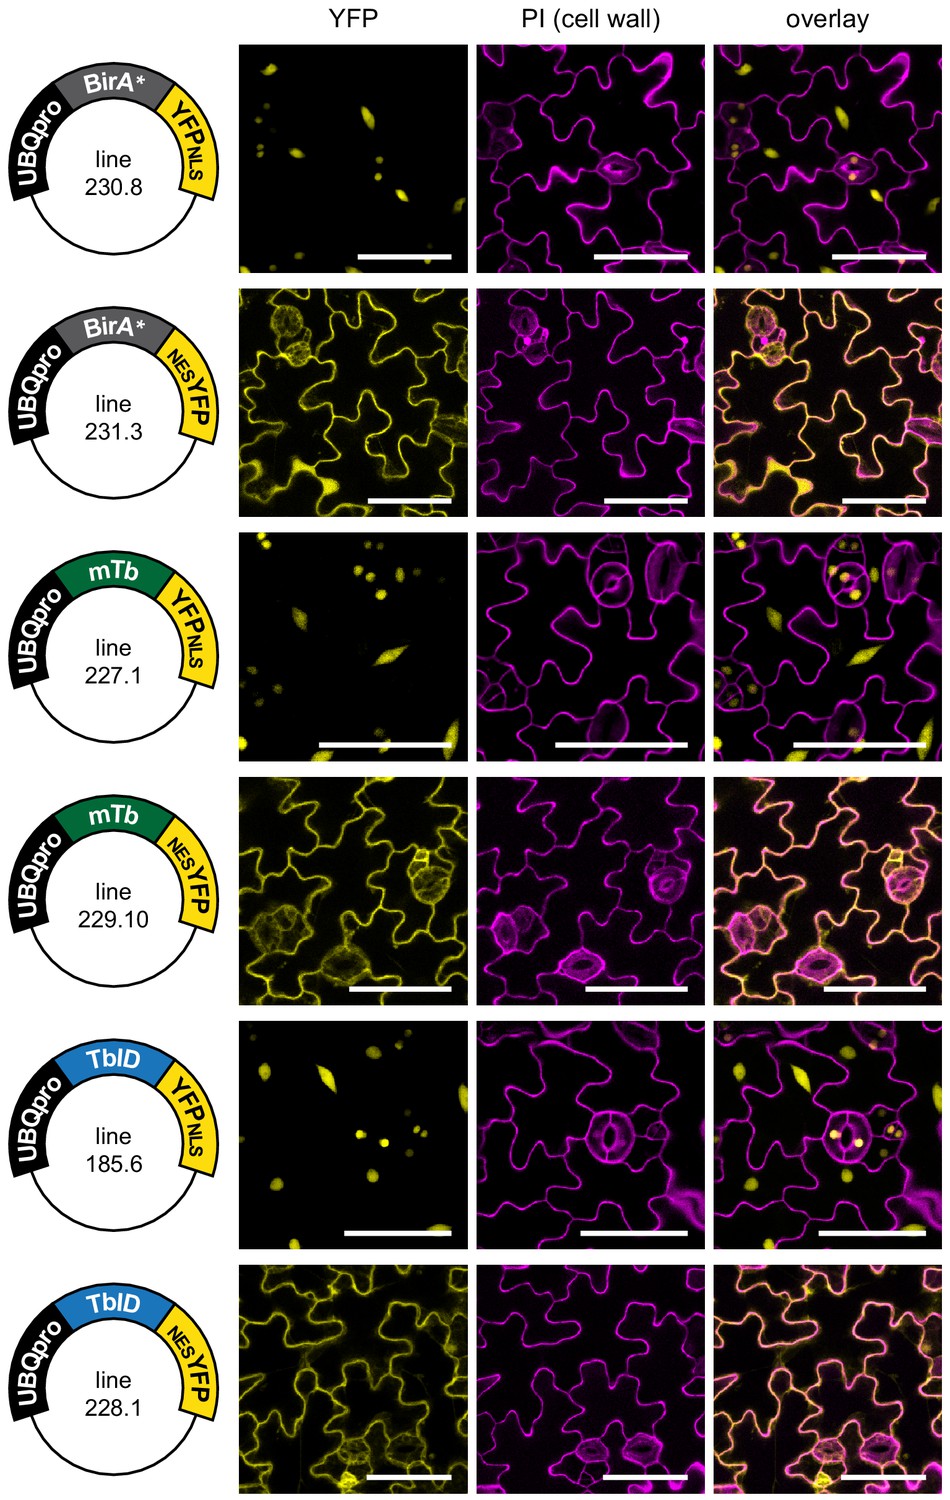
Subcellular localization of biotin ligase constructs in stable Arabidopsis lines.
Confocal microscopy images of the cotyledon epidermis of 5-day-old Arabidopsis seedlings transformed with UBQ10pro::BirA-YFPNLS or UBQ10pro::BirA-NESYFP expression vectors (BirA = BirA*, mTb or TbID). Shown are the YFP channel (yellow), the cell walls stained with propidium iodide (purple) and an overlay. Scale bar = 50 µm. Constructs and lines used for images are indicated on the left. Nuclear targeted BirA-YFP (NLS) constructs were mostly nuclear, and cytosol targeted (NES) constructs were excluded from the nucleus.
Figure 1—figure supplement 3
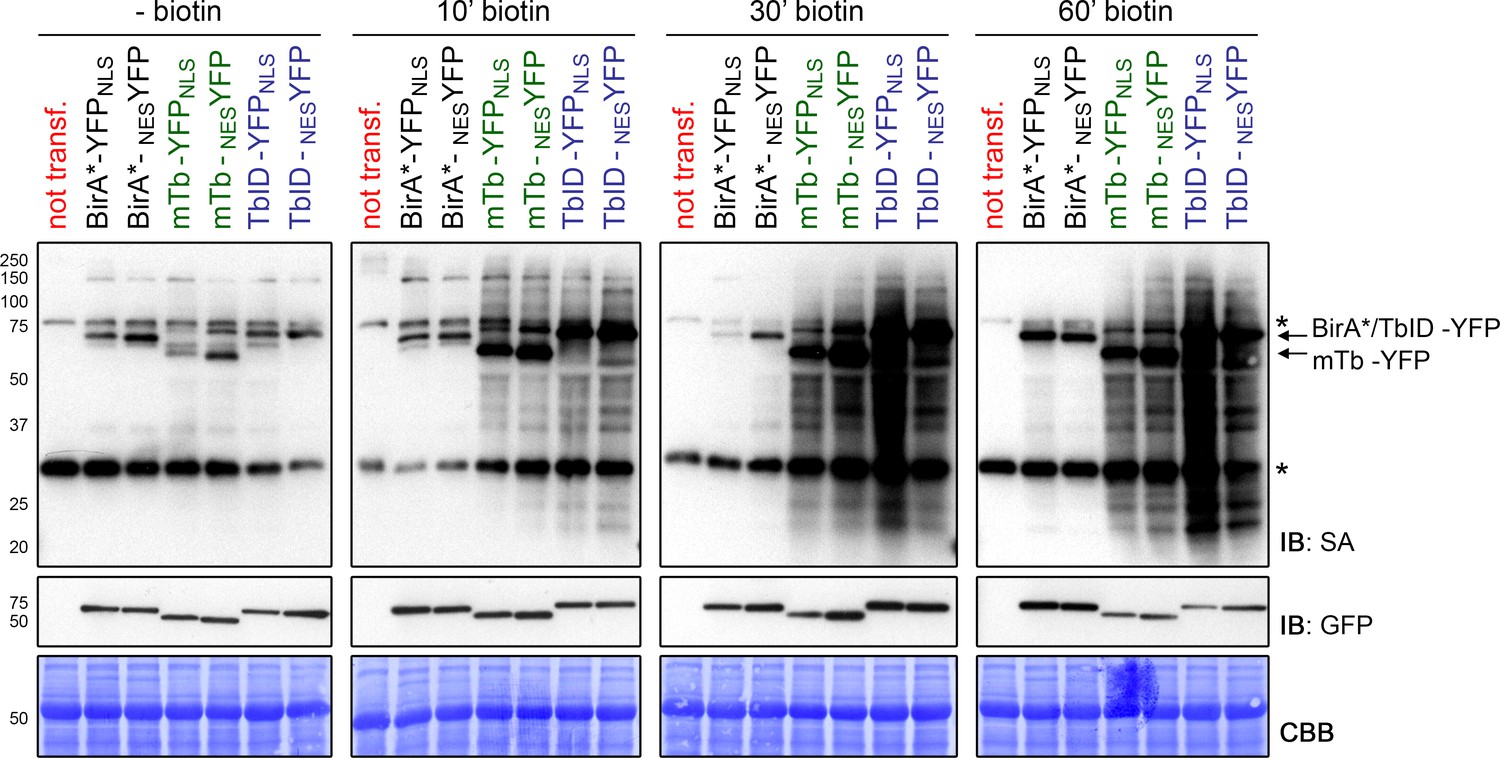
TbID and mTb are highly active in the cytosol and nucleus of transiently transformed N. benthamiana leaves.
N. benthamiana leaves were transformed with UBQ10pro::BirA-YFPNLS or UBQ10pro::BirA-NESYFP expression vectors (BirA = BirA*, mTb or TbID). Two days after infiltration, leaf discs expressing either of the six constructs or non-transformed leaves (not transf.) were briefly vacuum infiltrated with 50 µM biotin and incubated for 10, 30 or 60 min at room temperature (~22°C). Untreated samples were used as controls to visualize the background activity of the biotin ligases with endogenous biotin. Each sample is a pool of two leaf discs. Activity and expression of the BirA-YFP variants were analyzed by immunoblots (IB) with streptavidin-HRP (SA) and anti-GFP antibodies. Coomassie Brilliant Blue-stained membranes (CBB) are shown as loading controls. Asterisks mark the positions of naturally biotinylated proteins.
Figure 1—figure supplement 4
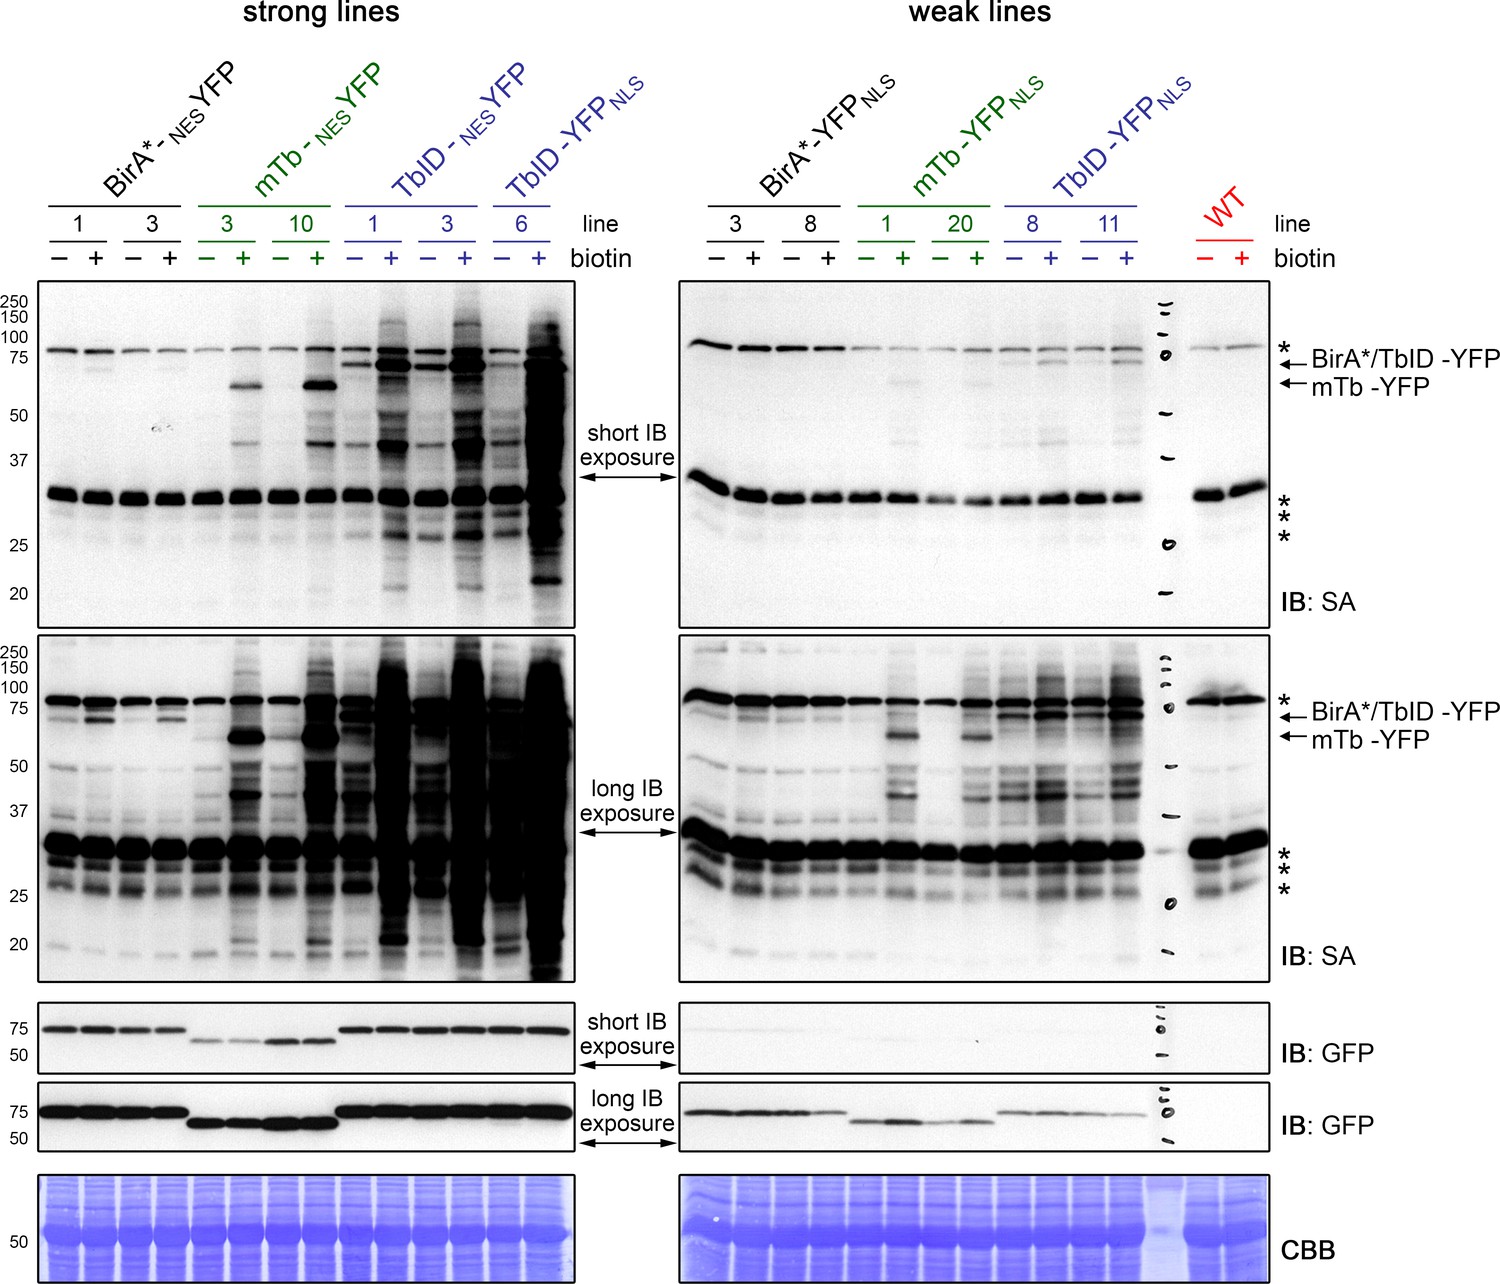
TbID is more active than mTb, but also produces more background labeling in Arabidopsis.
Five-day-old Arabidopsis seedlings expressing UBQ10pro::BirA-YFPNLS or UBQ10pro::BirA-NESYFP constructs (BirA = BirA*, mTb or TbID) were submerged in 250 µM biotin, briefly vacuum infiltrated and incubated at room temperature (22°C) for one hour (+). Non-treated seedlings were used as controls (-) to visualize the background activity of the biotin ligases with endogenous biotin. Activity and expression of the BirA-YFP variants were analyzed by immunoblots (IB) with streptavidin-HRP (SA) and anti-GFP antibodies. Coomassie Brilliant Blue-stained membranes (CBB) are shown as loading controls. Asterisks mark the positions of naturally biotinylated proteins. Each sample is a pool of ~30 seedlings. At least two lines were tested per construct; strong cytosolic lines and a strong nuclear TbID line are on the left, weak nuclear lines and WT are on the right. Blots were made and exposed in parallel. Different exposure times are shown to enable comparison of weak and strong lines. Short exposure times were 5 s, long exposures times were 30 s (SA blot) and 70 s (anti-GFP blot). mTb is less active than TbID, but has less background labeling with endogenous biotin, especially in low-expressing lines. WT samples and samples from lines 3, 10 and 3 of the BirA*-NESYFP, mTb-NESYFP and TbID-NESYFP plants, respectively, were also used for the blots shown in Figure 1C.
Figure 1—figure supplement 5
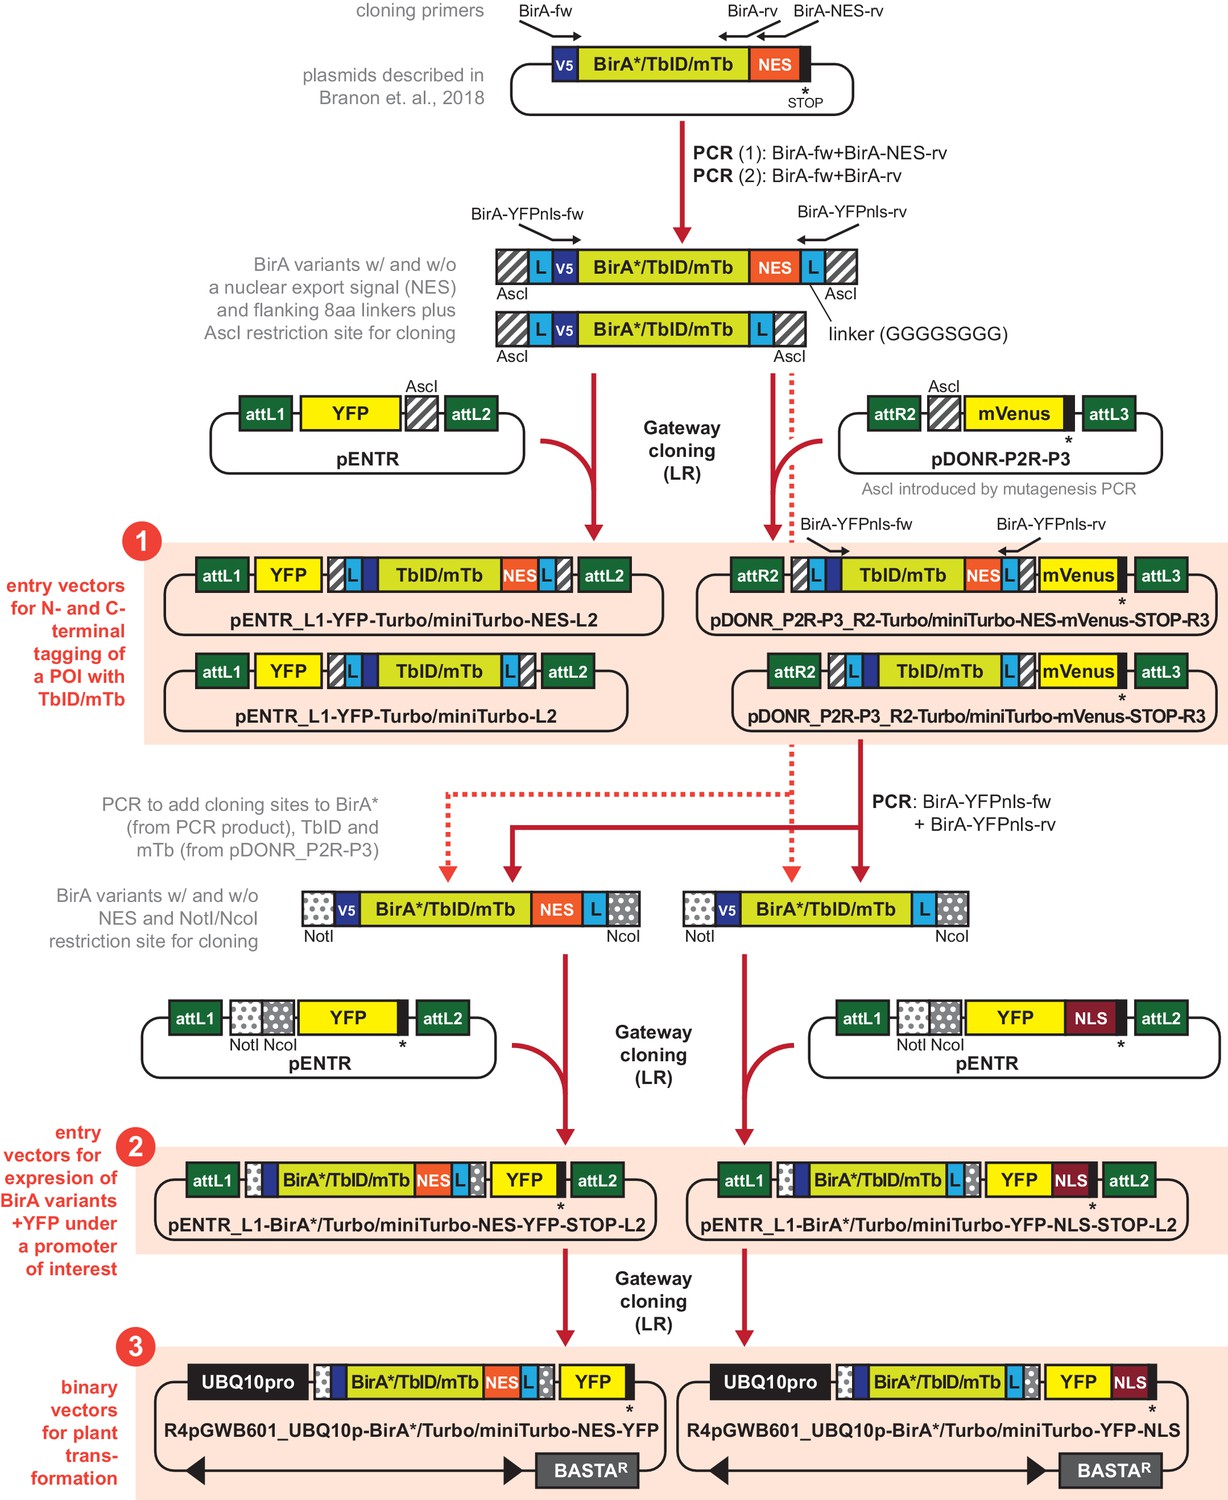
Generating a toolbox of gateway-compatible vectors for PL in plants.
Schematic overview over cloning steps involved in the generation of the PL toolbox and over the available vectors (highlighted as orange boxes). Analogous constructs for different biotin ligase variants are summarized (indicated by BirA*/TbID/mTb or TbID/mTb). Primers and restriction sites used for PCR and restriction cloning are indicated on the top or bottom of the constructs. V5 = V5 tag, L = 8 amino acid linker (GGGGSGGG), NES = nuclear export signal, NLS = nuclear localization signal, POI = protein of interest. Available plasmids include: ❶ eight entry vectors for N- and C-terminal tagging of proteins of interest with TbID or mTb plus a fluorophore, ❷ six entry vectors for expressing any of the three BirA variants under a promoter of interest with a NES or NLS and a fluorophore, and ❸ six binary plant transformation vectors for expressing any of the three BirA variants with an NES or NLS under the UBQ10 promoter. A detailed description and primer sequences are included in the Materials and methods section. A list of available plasmids with Addgene catalogue number can also be found in the Materials and methods section.
Figure 2 with 3 supplements

TbID and mTb work quickly and tolerate a range of experimental conditions in Arabidopsis seedlings.
(A–D) Dependency of TbID and mTb activity on labeling time, temperature, biotin concentration and biotin application. Four- to 5-day-old seedlings were treated with biotin as described below. Activity and expression of the TbID/mTb-YFP constructs were analyzed by immunoblots (IB) with streptavidin-HRP (SA) and anti-GFP antibodies. Coomassie Brilliant Blue-stained membranes (CBB) are shown as a loading controls. Asterisks mark the positions of naturally biotinylated proteins. Each sample is a pool of ~30–50 seedlings. (A) Labeling time. Wild-type (WT) and UBQ10pro::TbID-YFPNLS (TbID-YFP) seedlings were submerged in 250 µM biotin, briefly vacuum infiltrated and incubated for the indicated time at room temperature (22°C). A control sample was taken before treatment (0’). (B) Temperature-dependency. WT, UBQ10pro::TbID-YFPNLS (TbID-YFP) and UBQ10pro::mTb-NESYFP (mTb-YFP) seedlings were submerged in 250 µM biotin and incubated for 1 h at the indicated temperature. Control samples (-) were incubated in H2O at 22°C. (C) Biotin concentration. UBQ10pro::TbID-NESYFP (TbID-YFP) and UBQ10pro::mTb-NESYFP (mTb-YFP) seedlings were submerged in 0.5 to 250 µM biotin and incubated for 1 h at room temperature. A control sample was taken before treatment (0 µM). (D) Biotin application. WT and UBQ10pro::TbID-YFPNLS (TbID-YFP) seedlings were submerged in 250 µM biotin, briefly vacuum infiltrated (vac. inf.) or not and incubated for 1 h at room temperature. A control sample was taken before treatment. For a longer time course in Arabidopsis and quantification of the immunoblots shown in (C) see Figure 2—figure supplements 1 and 3. For a short time course and temperature dependency of TbID and mTb in N. benthamiana see Figure 1—figure supplement 3 and Figure 2—figure supplement 2.
Figure 2—figure supplement 1
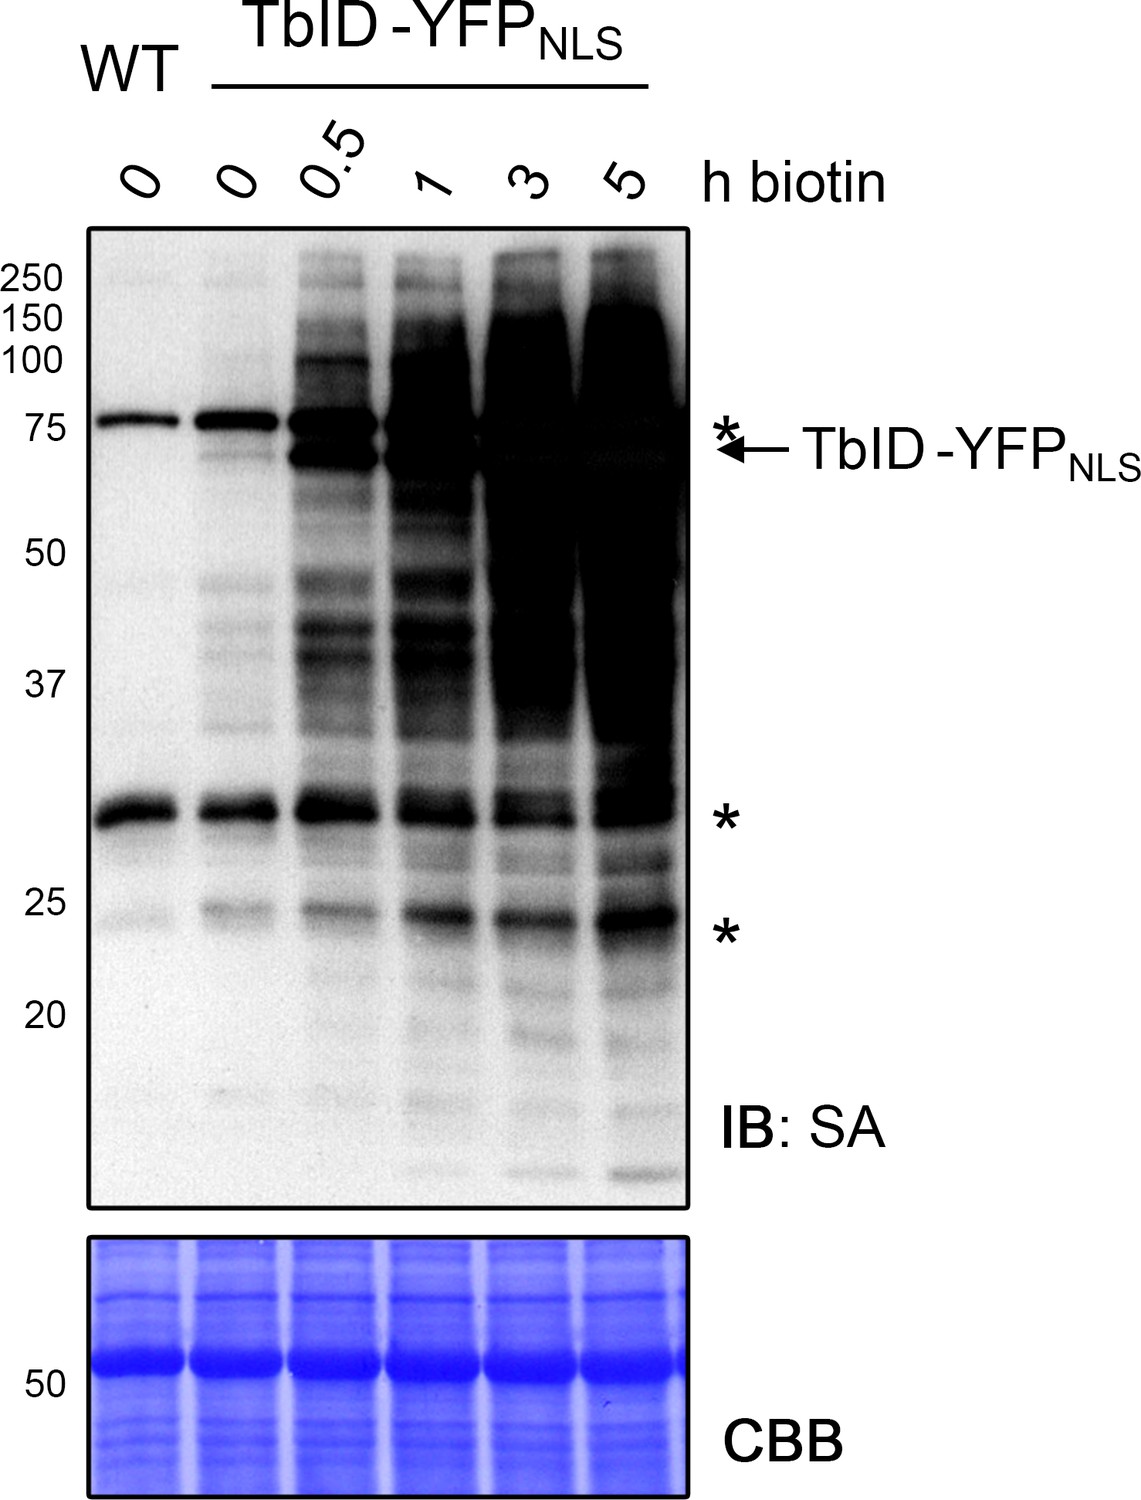
Biotinylation by TbID in Arabidopsis increases over time.
Labeling time course with TbID in 4-day-old Arabidopsis seedlings expressing the UBQ10pro::TbID-YFPNLS construct (TbID-YFPNLS). Seedlings were submerged in 50 μM biotin, briefly vacuum infiltrated and incubated for the indicated time at room temperature (22°C). A control sample and a wild-type (WT) sample were taken before biotin treatment. Activity of TbID over time was analyzed by immunoblot (IB) with streptavidin-HRP (SA). The Coomassie Brilliant Blue-stained membrane (CBB) is shown as loading control. Asterisks mark the positions of naturally biotinylated proteins. Each sample is a pool of seedlings. The increase of labeling between 3 and 5 hof biotin treatment demonstrates that labeling of nuclear proteins is not saturated after 3 h.
Figure 2—figure supplement 2

TbID and mTb are active from 22°C to 37°C in N. benthamiana.
Streptavidin-HRP (SA) and anti-GFP immunoblots (IB) showing the activity and expression of TbID and mTb at room temperature (22°C), 30°C and 37°C. N. benthamiana leaves were transformed with UBQ10pro::TbID-NESYFP (TbID-NESYFP) or UBQ10pro::mTb-NESYFP (mTb-NESYFP) expression vectors. Two days after infiltration, leaf discs expressing the TbID and mTb constructs and non-transformed leaves were briefly vacuum infiltrated with H2O (-) or 250 µM biotin (+) and incubated at the indicated temperature for 1 h. Each sample is a pool of three leaf discs. The Coomassie Brilliant Blue-stained membrane (CBB) is shown as loading control. Asterisks mark the positions of naturally biotinylated proteins.
Figure 2—figure supplement 3

Quantification of TbID and mTb activity in Arabidopsis at different biotin concentrations.
Quantification of the streptavidin-HRP (SA) immunoblots (IB) shown in Figure 2C. Five-day-old seedlings transformed with UBQ10pro::TbID-NESYFP (TbID-NESYFP) and UBQ10pro::mTb-NESYFP (mTb-NESYFP) were submerged in 0.5 to 250 µM biotin and incubated for 1 h at room temperature (22°C). A control sample was taken before treatment (0 µM). The anti-GFP blot shows expression of the YFP fusion proteins. Quantification was done in FIJI (ImageJ) by drawing five parallel vertical lines through each of the lanes at different positions and reading out the signal intensity along the line. The graphs on the right show the average signal intensity of the five lines along the length of the gel. The peaks associated with TbID-YFP and mTb-YFP are indicated and the positions of naturally biotinylated proteins are marked by asterisks.
Figure 3 with 3 supplements
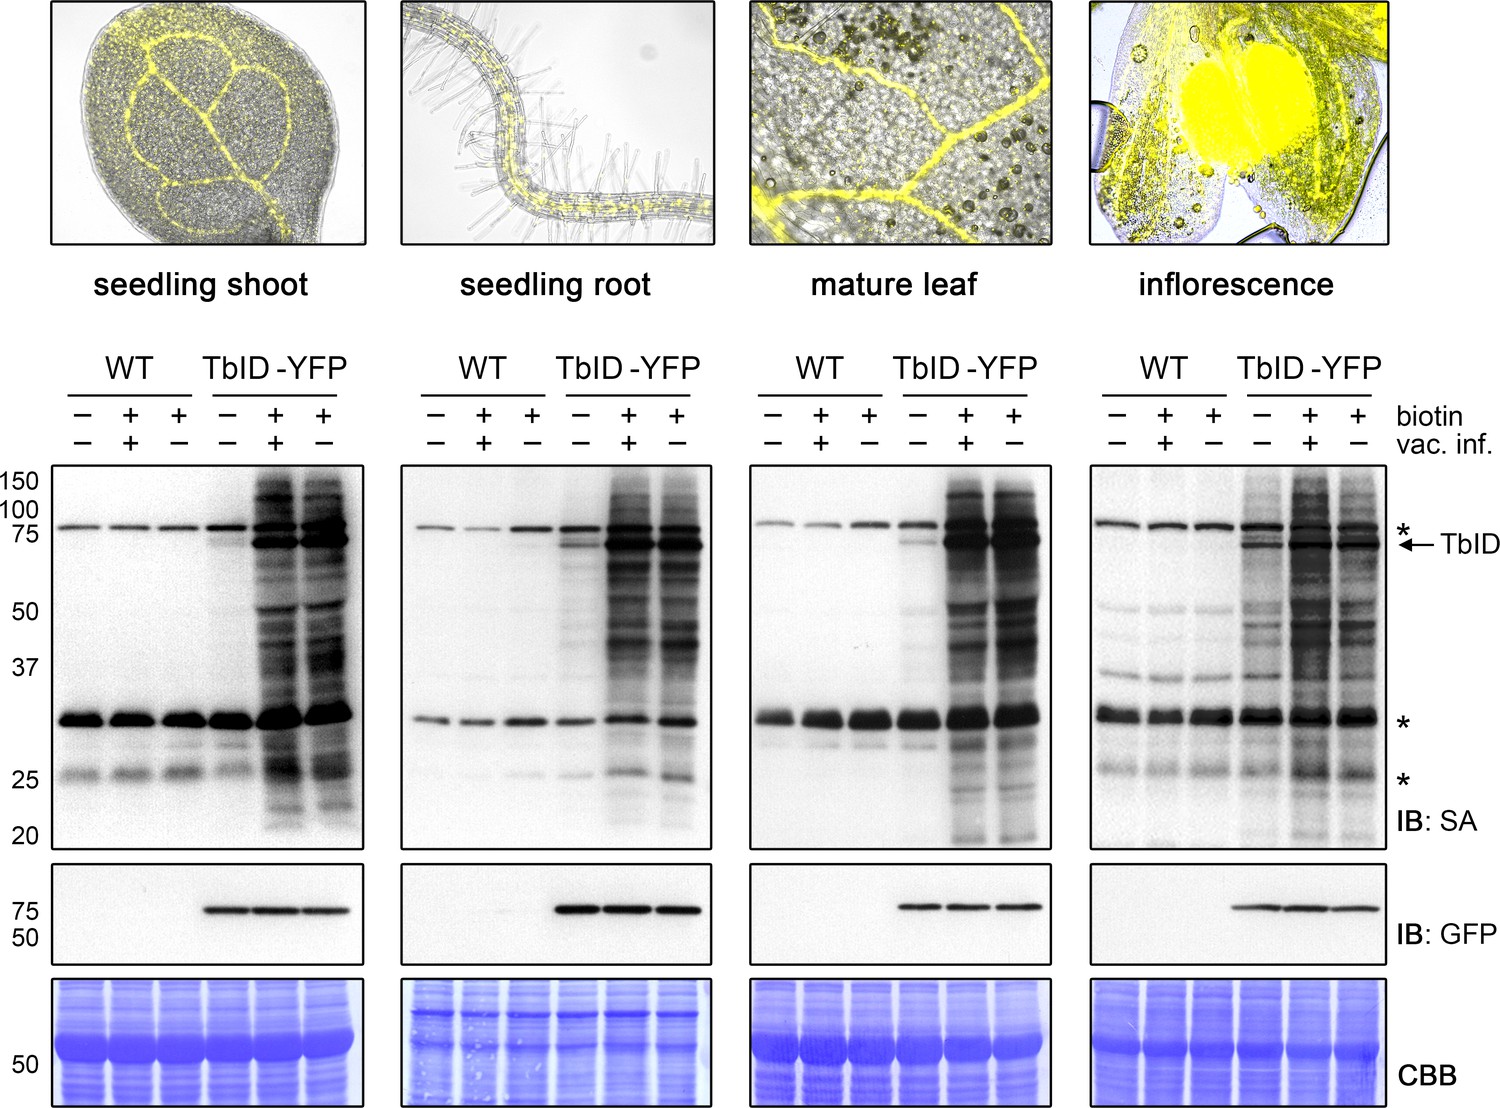
TbID works in different developmental stages and organs of Arabidopsis and does not require vacuum infiltration of biotin.
TbID activity in shoots and roots of 10-day-old plate-grown UBQ10pro::TbID-YFPNLS (TbID-YFP) seedlings, and in rosette leaves and unopened flower buds of mature soil-grown plants. Col-0 wild-type (WT) was used as control. The plant material was submerged in a 250 µM biotin solution, briefly vacuum infiltrated until air spaces were filled with liquid or not vacuum infiltrated and incubated at room temperature (22°C) for 1 h. Control samples were taken before biotin treatment. Samples are pools of three shoots or roots, two rosette leaves or four inflorescences. Activity and expression of TbID-YFP were analyzed by immunoblots (IB) with streptavidin-HRP (SA) and anti-GFP antibodies. Coomassie Brilliant Blue-stained membranes (CBB) are shown as a loading controls. Asterisks mark the positions of naturally biotinylated proteins. Epifluorescence images of seedlings and mature tissues of the TbID-YFP line are shown on top. For immunoblots showing TbID activity and background in 4- to 14-day-old whole seedlings and shoots and roots of 6- to 14-day-old seedlings see Figure 3—figure supplements 1 and 2. For further microscopy images of the TbID-YFP line see Figure 3—figure supplement 3.
Figure 3—figure supplement 1
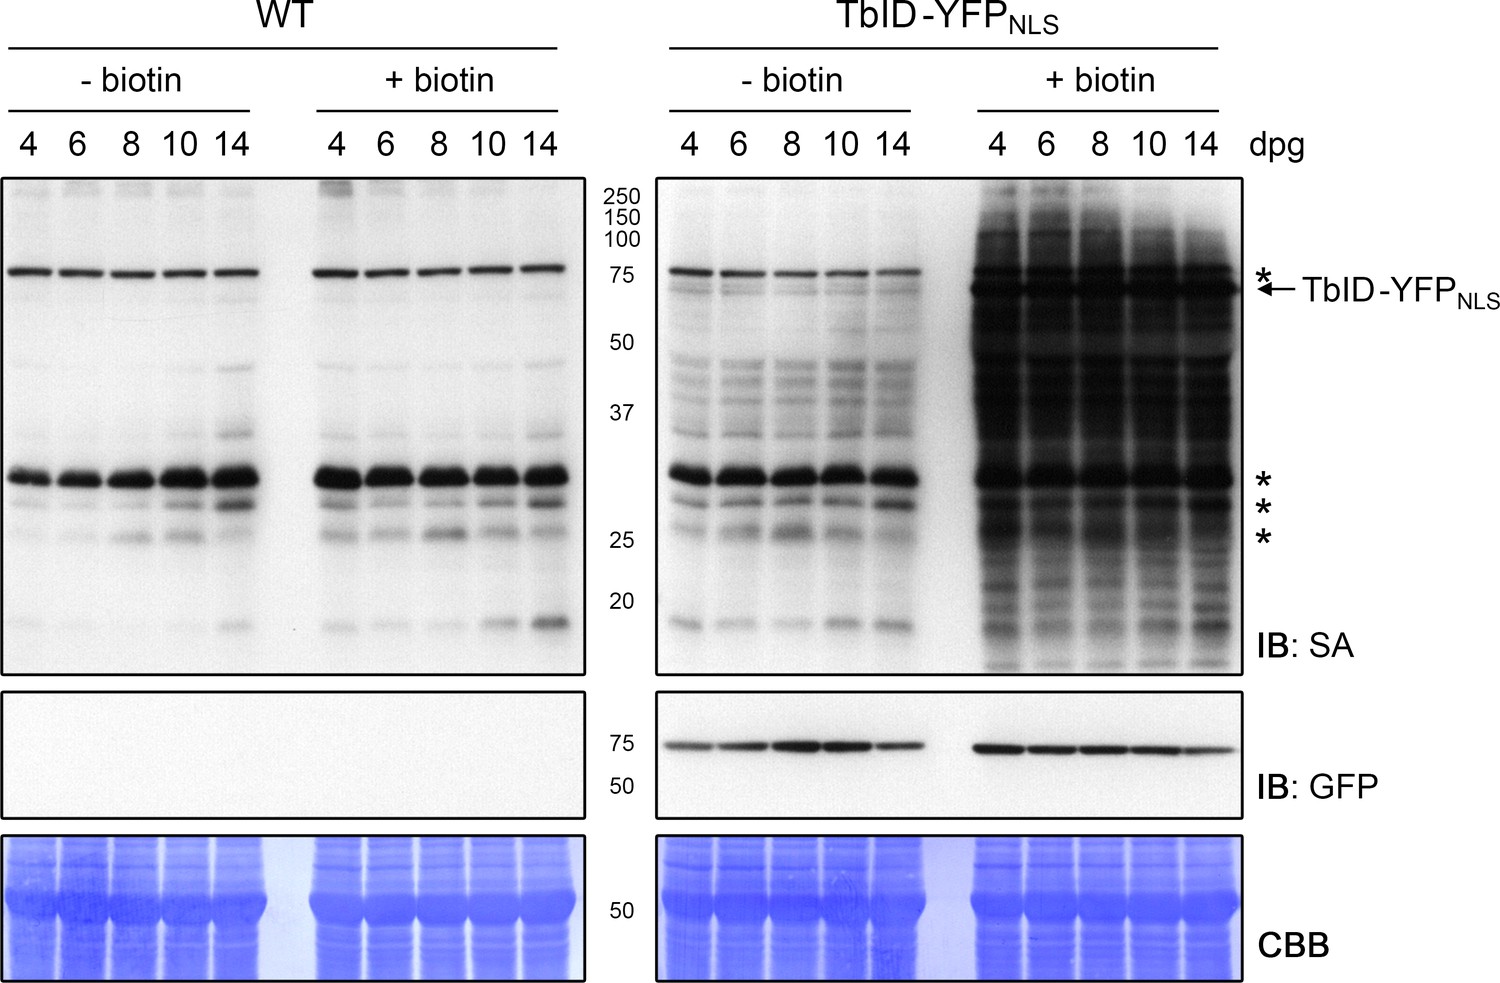
Activity and background labeling of TbID are similar in seedlings ranging from 4 to 14 days of age.
Plate-grown Arabidopsis wild-type (WT) and UBQ10pro::TbID-YFPNLS (TbID-YFPNLS) seedlings of the indicated age (dpg = days post germination) were submerged in a 250 µM biotin solution, briefly vacuum infiltrated and incubated for 1 h at room temperature (22°C; + biotin). Non-treated control samples (- biotin) were taken at the same time. Each sample is a pool of seedlings. Activity and expression of TbID-YFPNLS were analyzed by immunoblots (IB) with streptavidin-HRP (SA) and anti-GFP antibodies. Coomassie Brilliant Blue-stained membranes (CBB) are shown as a loading controls. Asterisks mark the positions of naturally biotinylated proteins.
Figure 3—figure supplement 2

Activity and background labeling of TbID are similar in roots and shoots of 6- to 14-day-old seedlings.
Six, 10 and 14 days post germination (dpg), plate-grown Arabidopsis wild-type (WT) and UBQ10pro::TbID-YFPNLS (TbID-YFPNLS) seedlings were divided into a shoot and root section. Shoots and roots were submerged separately in a 250 µM biotin solution, briefly vacuum infiltrated and incubated for 1 h at room temperature (22°C; +). Non-treated control samples (-) were taken at the same time. Each sample is a pool of seedlings. Activity and expression of TbID-YFPNLS were analyzed by immunoblots (IB) with streptavidin-HRP (SA) and anti-GFP antibodies, respectively. Coomassie Brilliant Blue-stained membranes (CBB) are shown as a loading control. Asterisks mark the positions of naturally biotinylated proteins.
Figure 3—figure supplement 3
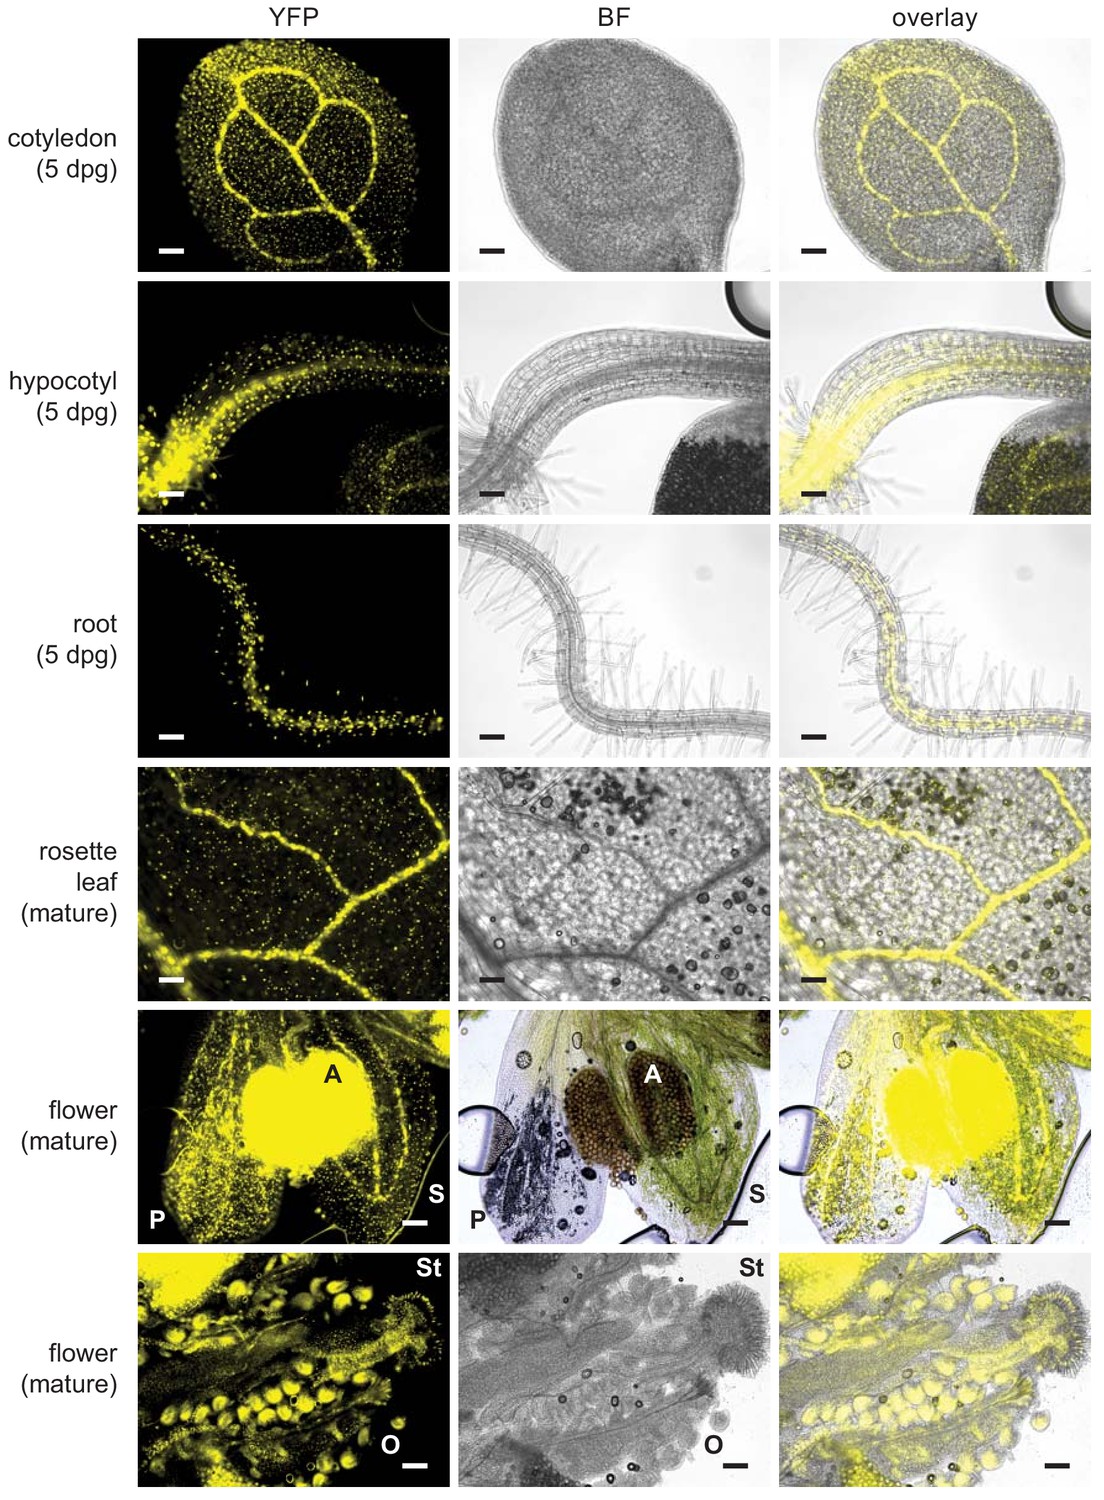
UBQ10pro::TbID-YFPNLS is expressed throughout the whole plant.
Epifluorescence microscopy images of plate-grown Arabidopsis seedlings and soil-grown mature tissues from the strong TbID-YFPNLS line used in Figures 2 and 3 and the PL experiments in Figures 4–6. Shown are the YFP and brightfield (BF) channel and an overlay. Scale bar = 100 μm. Abbreviations: P, petal; S, sepal; A, anther; St, stigma; O, ovary. The overlay images of the 5-day-old cotyledon and root and of mature flowers are also used in Figure 3.
Figure 4 with 7 supplements
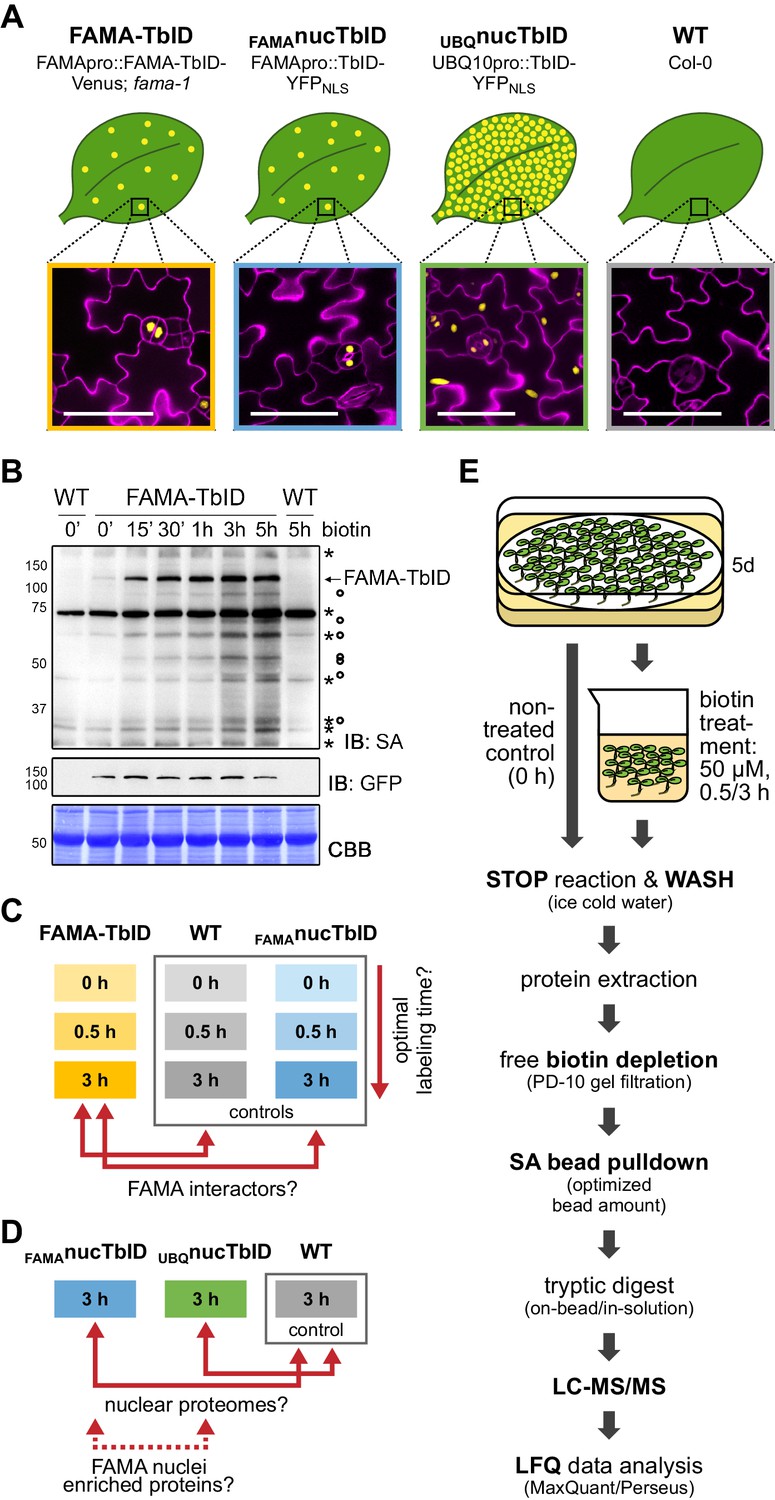
Testing TbID’s potential to label protein interactors and subcellular proteomes in a rare cell type in Arabidopsis.
(A) Plant lines generated for the ‘FAMA interactome’ and ‘nuclear proteome’ experiments. Line names and genotypes are given on the top, schematic expression of the TbID fusion proteins (yellow dots) in a leaf and confocal microscopy images of the epidermis of 5-day-old seedlings are shown below (TbID fusion protein = yellow; propidium iodide-stained cell wall = purple; scale bar = 50 μM). FAMA-TbID and FAMAnucTbID constructs are expressed in young guard cells, while the UBQnucTbID construct is expressed ubiquitously. (B) Time course to optimize time points for the experiments. Five-day-old wild-type (WT) and FAMA-TbID seedlings were submerged in 250 µM biotin, briefly vacuum infiltrated and incubated for the indicated time at room temperature 22°C). Control samples were taken before treatment (0’). Samples are pools of ~30 seedlings. Activity and expression of FAMA-TbID were analyzed by immunoblots (IB) with streptavidin-HRP (SA) and anti-GFP antibodies. The Coomassie Brilliant Blue-stained membrane (CBB) is shown as loading control. Asterisks and circles mark the positions of naturally biotinylated proteins and putative FAMA-TbID targets, respectively. (C–D) Scheme of samples and comparisons used in the ‘FAMA interactome’ (C) and ‘nuclear proteome’ (D) experiments. (E) Simplified workflow of the experimental procedure from biotin labeling to protein identification by liquid chromatography coupled to mass spectrometry (LC-MS/MS). Three biological replicates were used. Abbreviations: SA, streptavidin; LFQ, label free quantification. For larger extracts of the confocal microscopy images of the plant lines used in the PL experiments shown in (A) see Figure 4—figure supplement 1. For complementation of the fama-1 phenotype by the FAMApro::FAMA-TbID-Venus construct see Figure 4—figure supplement 2. For another labeling time course with the FAMA-TbID line using shorter labeling times with and without vacuum infiltration of biotin see Figure 4—figure supplement 3. For immunoblots showing successful labeling and purification of proteins for the ‘FAMA interactome’ and ‘nuclear proteome’ experiments see Figure 4—figure supplements 4 and 5. For immunoblots demonstrating the importance of the biotin depletion step and a comparison of different biotin depletion strategies see Figure 4—figure supplements 6 and 7.
Figure 4—figure supplement 1

Expression of the TbID constructs in lines used for the ‘FAMA interactome’ and ‘nuclear proteome’ PL experiments.
Confocal microscopy images of the cotyledon epidermis of 5-day-old Arabidopsis seedlings. Shown are the YFP channel (yellow), the cell walls stained with propidium iodide (purple) and an overlay. Scale bar = 50 µm. Excerpts of the overlay images were used in Figure 4A. FAMA-TbID-Venus and TbID-YFPNLS controlled by the FAMA promoter are expressed in developing guard cells (GCs). Expression is highest in dividing and young GCs and decreases as GCs mature. We did not see expression in developing myrosin cells (Li and Sack, 2014), but cannot rule out expression at growth stages that were not used in our experiments. TbID-YFPNLS controlled by the UBQ10 promoter is expressed ubiquitously (see also Figure 3—figure supplement 3).
Figure 4—figure supplement 2
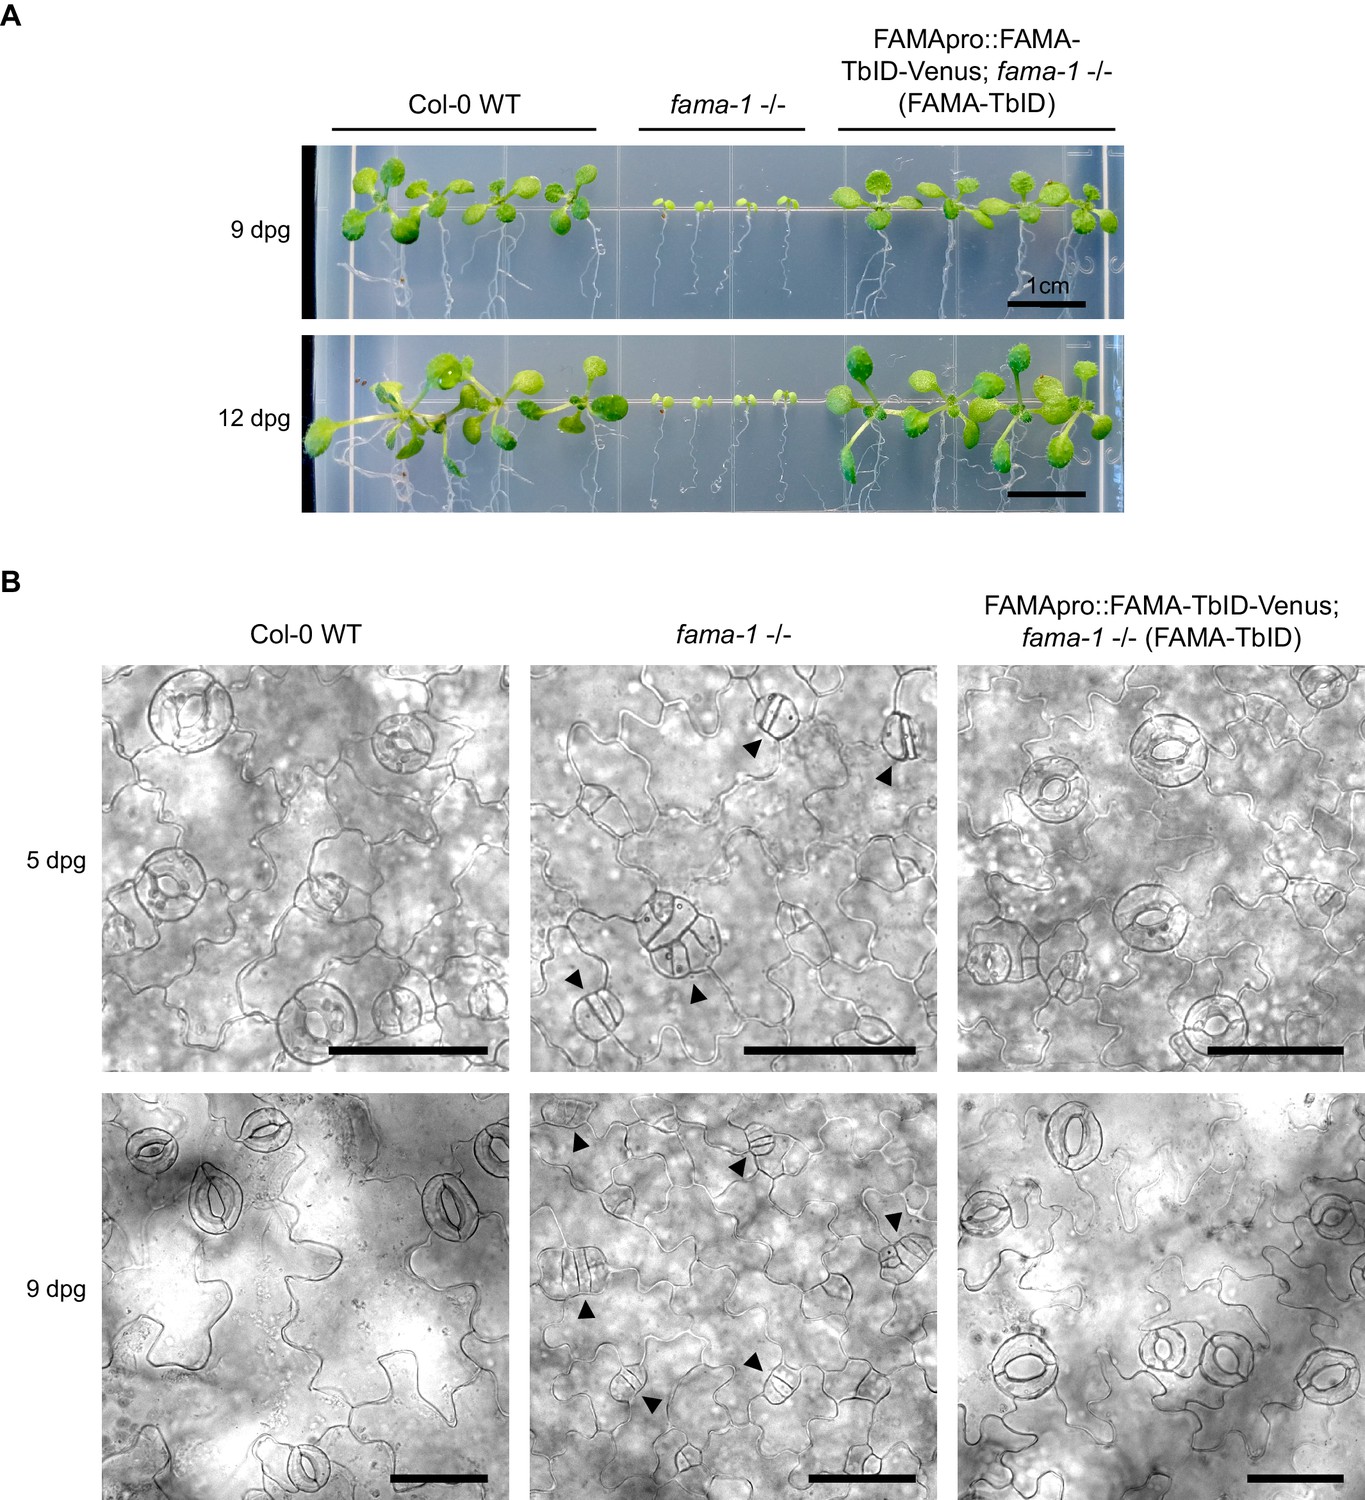
The FAMApro::FAMA-TbID-Venus construct rescues the fama-1 mutant phenotype.
(A) FAMA-TbID-Venus rescues the seedling-lethal growth phenotype of fama-1. Col-0 wild-type (WT), fama-1 -/- and the FAMA-TbID rescue line (FAMApro::FAMA-TbID-Venus in fama-1 - /- background) were grown on ½ MS plates supplemented with 0.5% sucrose. Pictures of the seedlings were taken after 9 and 12 days. (B) FAMA-TbID-Venus rescues the stomatal development phenotype of fama-1. Brightfield images of the cotyledon epidermis of seedlings 5 and 9 days post germination (dpg). Scale bar = 50 μm. In the fama-1 mutant, guard cell precursors continue dividing and fail to differentiate into stomata with a central pore, resulting in clusters of guard cell precursors (black arrowheads).
Figure 4—figure supplement 3
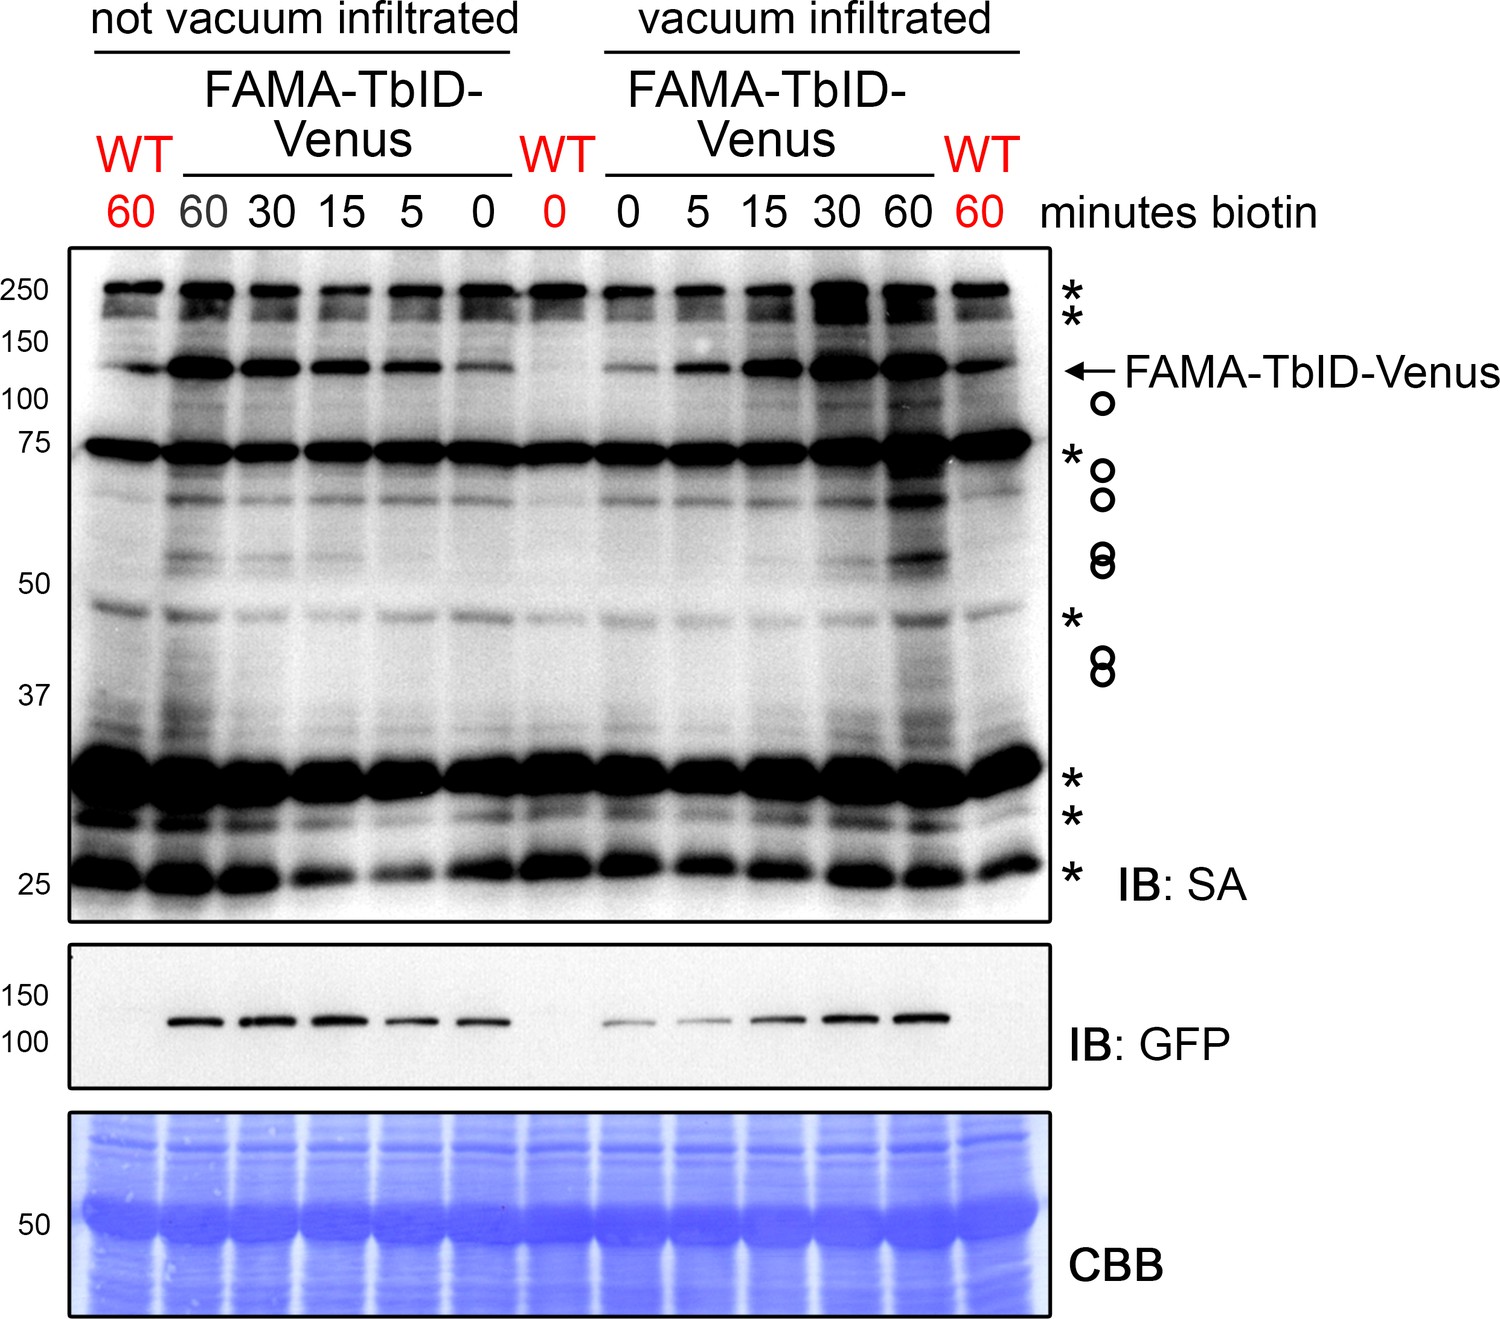
FAMA-TbID self-labeling is visible within 5 min of biotin treatment and increases over time, regardless of vacuum infiltration.
Time course to determine time points for the PL experiments with FAMA-TbID. Five-day-old wild-type (WT) and FAMApro::FAMA-TbID-Venus (FAMA-TbID-Venus) seedlings were submerged in 250 µM biotin, briefly vacuum infiltrated or not and incubated for the indicated time at room temperature (22°C). Control samples were taken before treatment (0 min). Activity and expression of TbID were analyzed by immunoblots (IB) with streptavidin-HRP (SA) and anti-GFP antibodies. The Coomassie Brilliant Blue-stained membrane (CBB) is shown as loading control. Asterisks and circles mark the positions of naturally biotinylated proteins and putative FAMA-TbID targets, respectively. Each sample is a pool of ~20 seedlings.
Figure 4—figure supplement 4
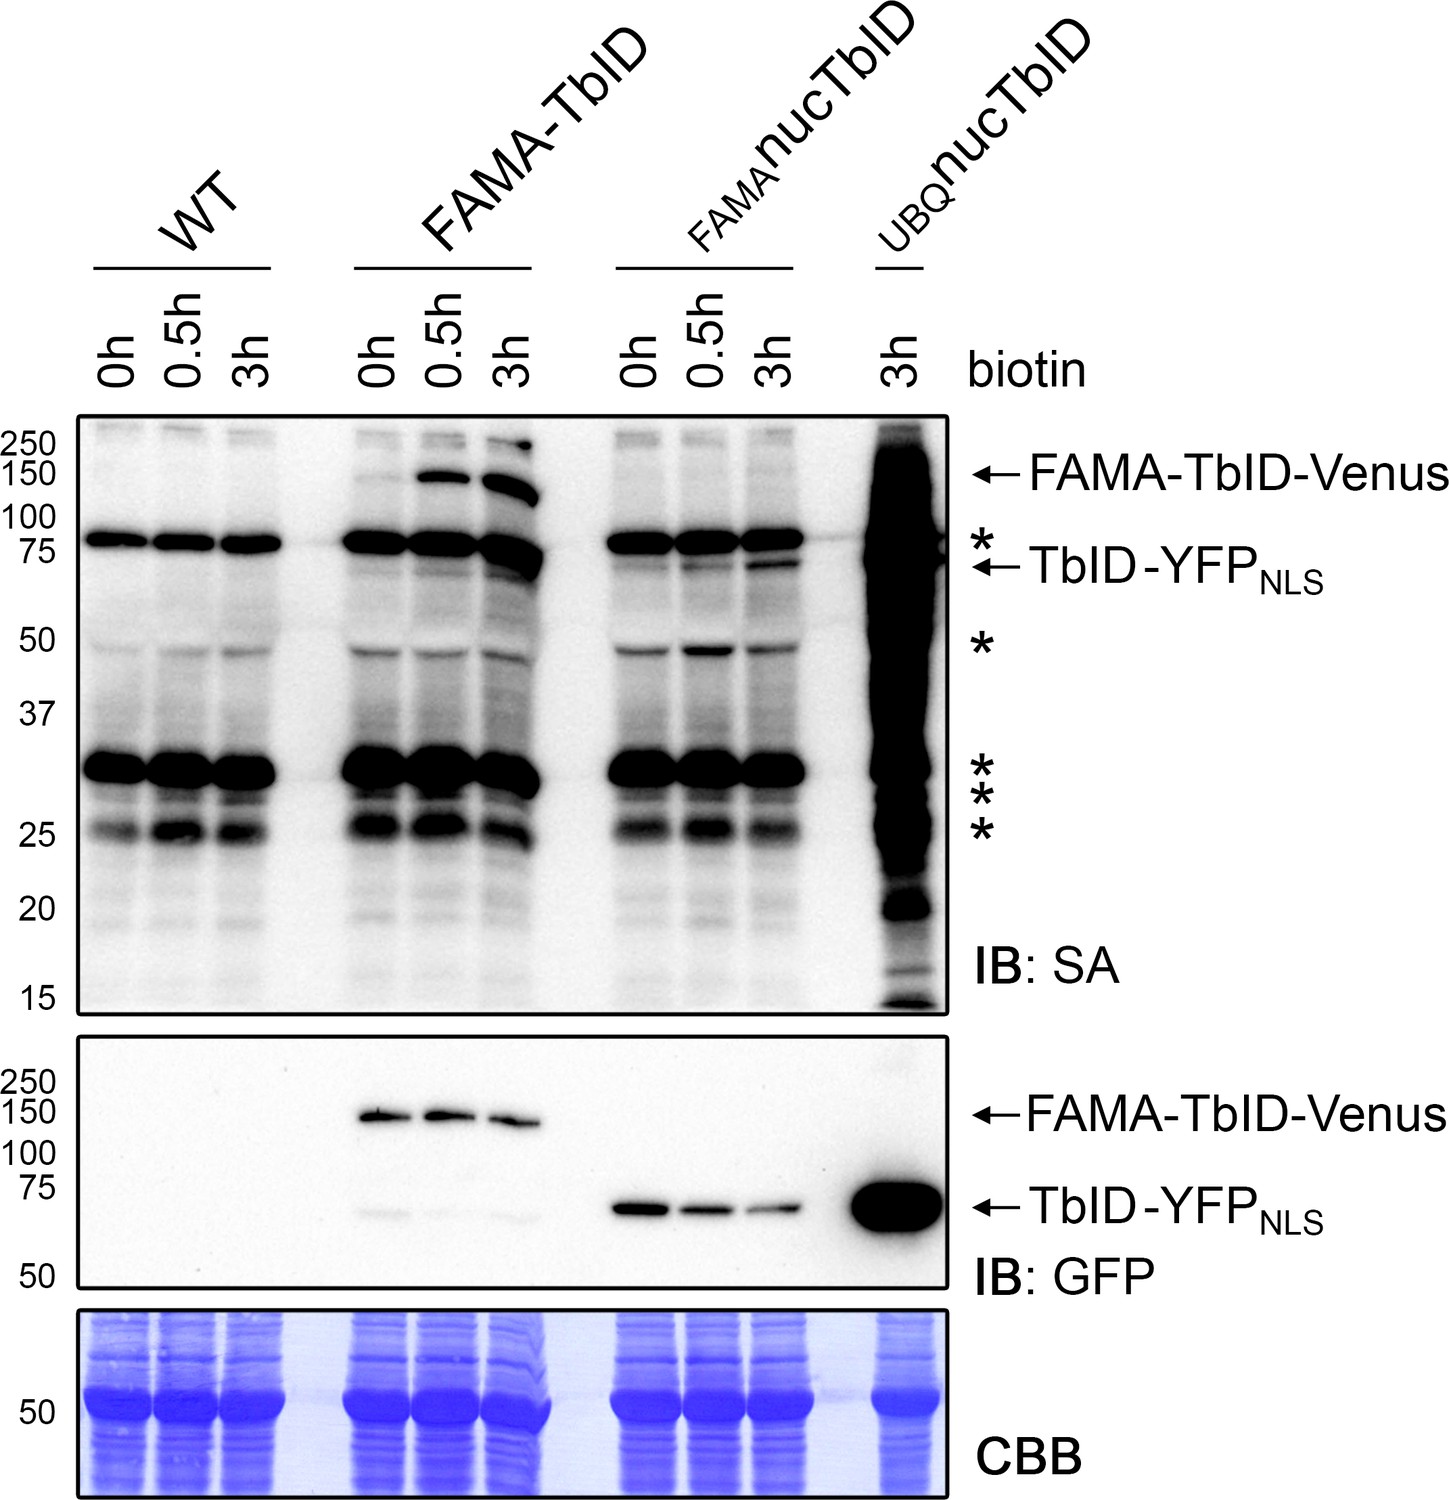
Confirming successful labeling of proteins in the PL experiment.
For the PL experiments shown in Figures 4–6, 5-day-old wild-type (WT), FAMA-TbID, FAMAnucTbID and UBQnucTbID seedlings were submerged in a 50 μM biotin solution for 0, 0.5 and 3 h and washed repeatedly with ice cold water. Activity and expression of the TbID constructs at the three time points were analyzed by immunoblots (IB) with streptavidin-HRP (SA) and anti-GFP antibodies. The Coomassie Brilliant Blue-stained membrane (CBB) is shown as loading control. Asterisks mark the positions of naturally biotinylated proteins. See Figure 4—figure supplement 5 for affinity purification of the biotinylated proteins.
Figure 4—figure supplement 5
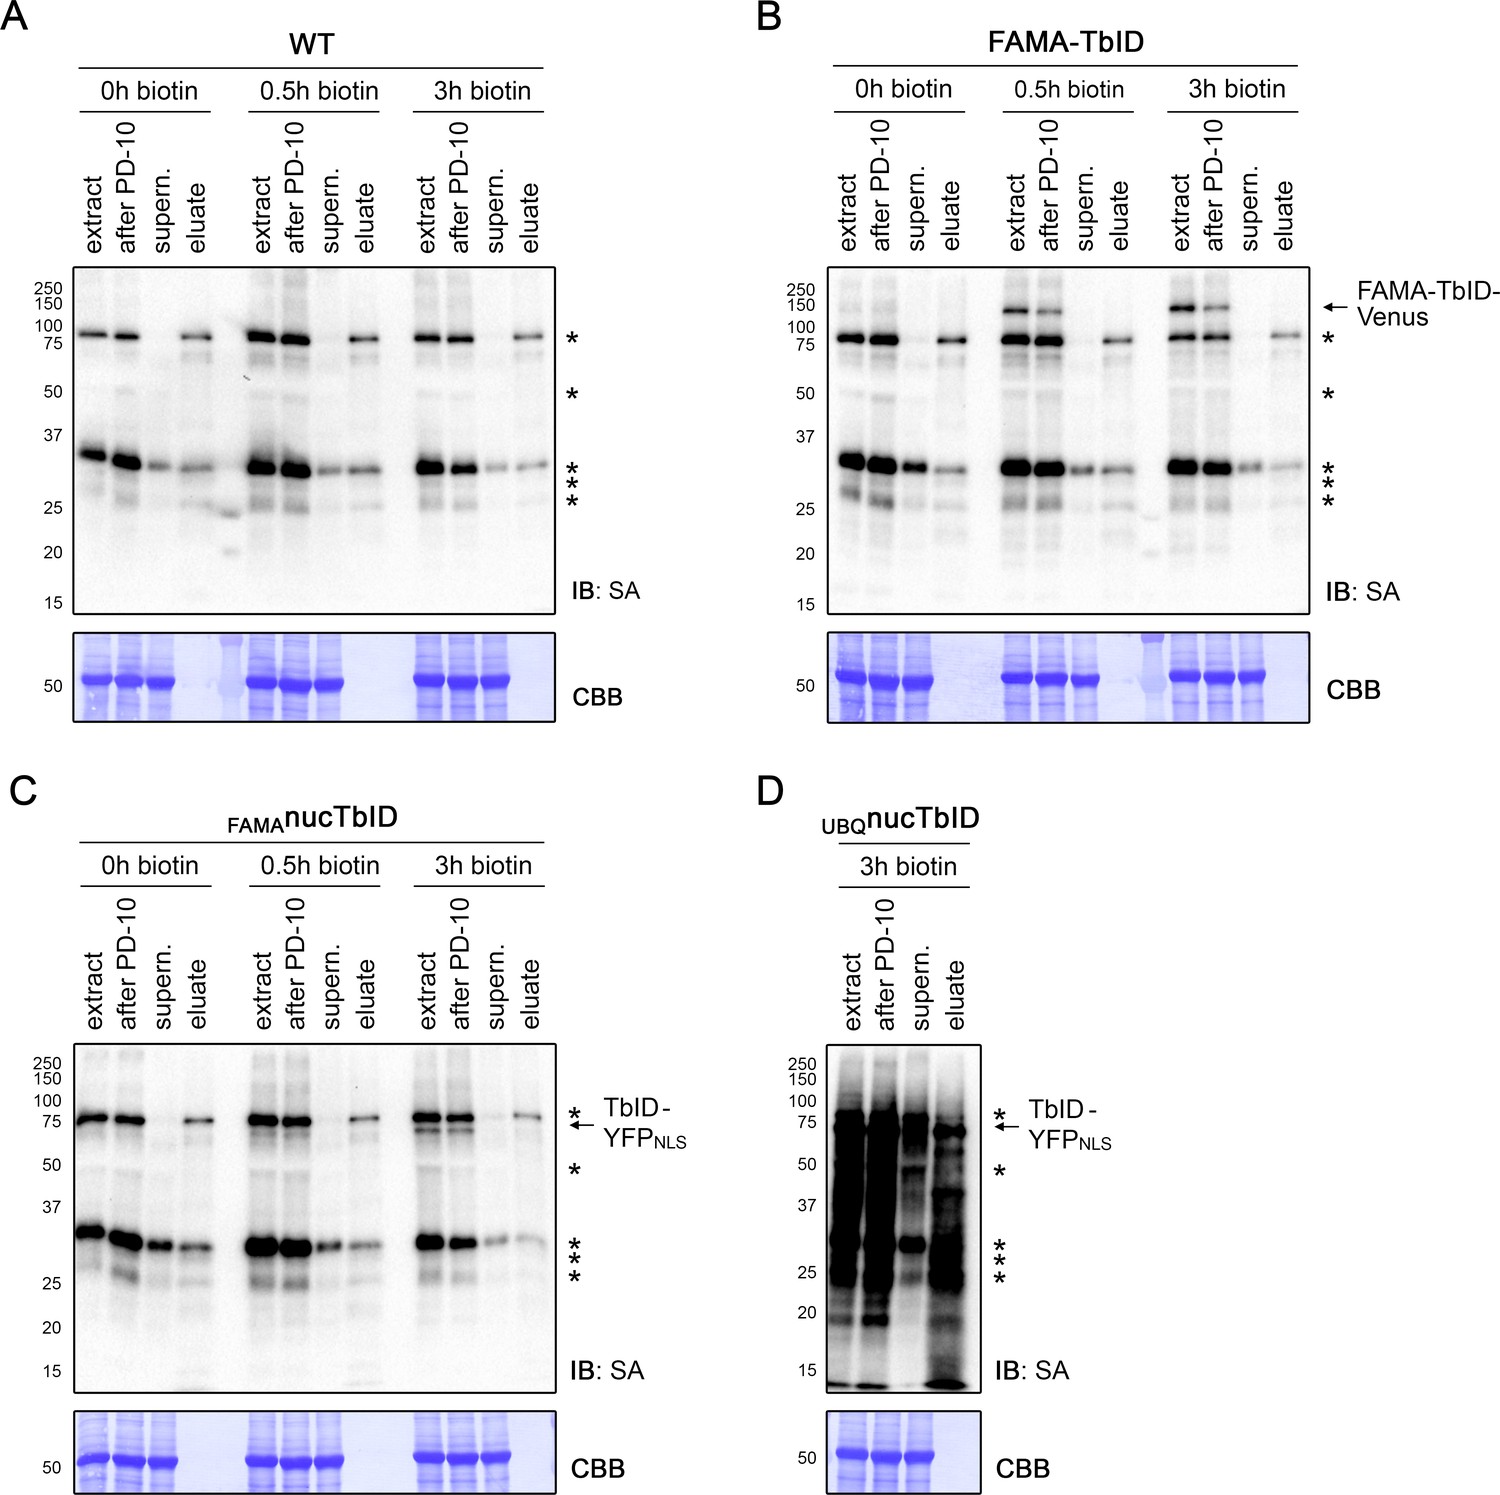
Affinity purification of biotinylated proteins in the PL experiment.
Five-day-old wild-type (WT), FAMA-TbID, FAMAnucTbID and UBQnucTbID seedlings were treated with biotin for 0, 0.5, and 3 h (see Figure 4—figure supplement 4) and used for affinity purification (AP) of biotinylated proteins. Samples were taken at different steps of the AP procedure and used for immunoblots (IB) with streptavidin-HRP (SA) to confirm successful biotin depletion and binding of biotinylated proteins to the beads (A–D). One of three biological replicates is shown for each sample. The positions of the TbID fusion proteins are indicated on the right and naturally biotinylated proteins are marked by asterisks. Protein extracts before (extract) and after biotin depletion (after PD-10) confirm that no significant sample loss occurred at this step. The protein extracts after AP (supern.) were depleted of biotinylated proteins, indicating binding of these proteins to the beads. Small aliquots of the beads were used for elution of bound proteins. In most cases, only the naturally biotinylated proteins could be eluted, presumably because TbID targets are biotinylated on multiple sites and bind the beads more strongly.
Figure 4—figure supplement 6
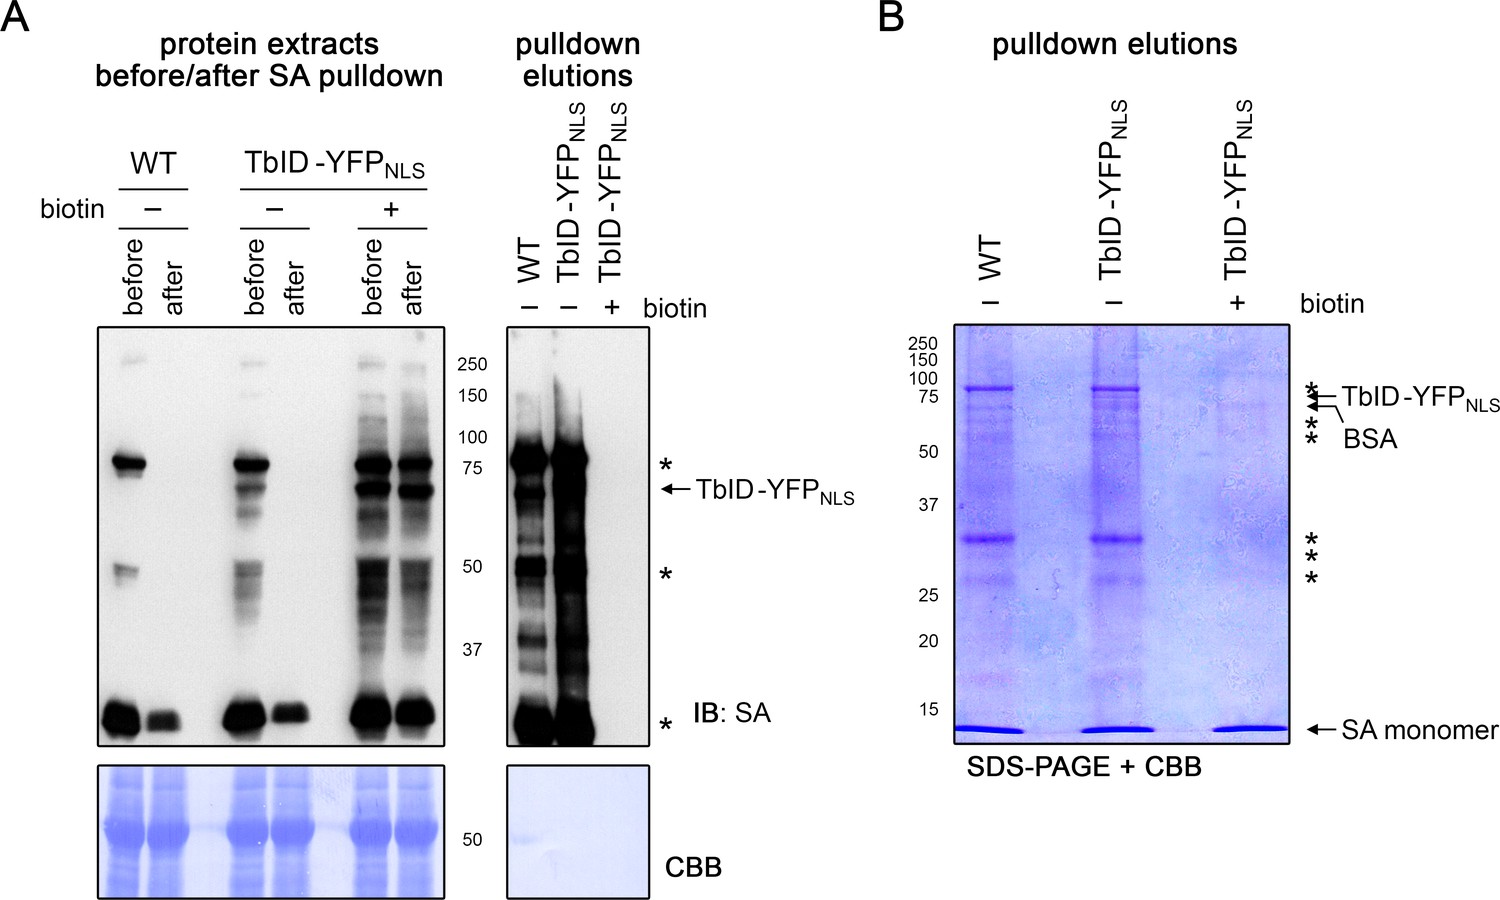
Free biotin from biotin treatment out-competes biotinylated proteins for streptavidin bead binding.
Four-day-old wild-type (WT) and UBQ10pro::TbID-YFPNLS (TbID-YFPNLS) seedlings were submerged in H2O (-) or 50 μM biotin for 1 h and used for affinity purification of biotinylated proteins with streptavidin (SA) beads. Protein extracts before and after overnight incubation with the beads and proteins eluted from the beads were used for immunoblotting (IB) with streptavidin-HRP (SA) (A) and for SDS-PAGE (B) to analyze binding of biotinylated proteins to the beads. Biotin treatment led to an increase of labeling in the TbID-YFPNLS line, but also inhibited AP of biotinylated proteins as can be seen both in the protein extracts after incubation with the beads and in the eluates. Coomassie Brilliant Blue-stained membranes (CBB) are shown as loading controls for the IB. Asterisks mark the positions of naturally biotinylated proteins. The positions of TbID-YFPNLS, as well as of BSA (beads used in this experiment are blocked with BSA) and SA monomers that are eluted from the beads, are indicated.
Figure 4—figure supplement 7
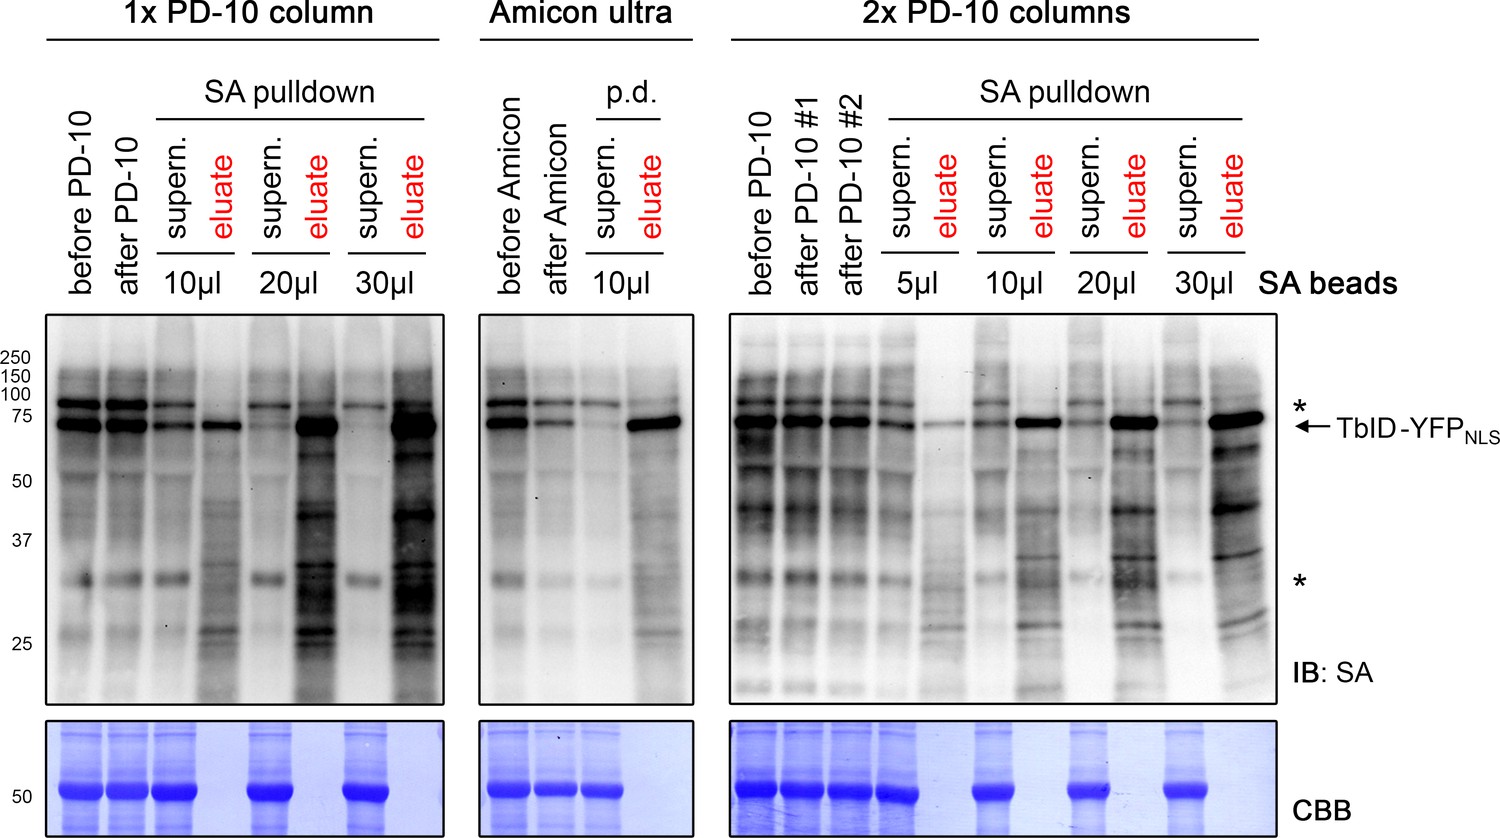
Comparison of different biotin depletion methods and bead concentrations for an effective pulldown of biotinylated proteins.
Five-day-old seedlings expressing the UBQ10pro::TbID-YFPNLS construct were submerged in a 50 μM biotin solution for 3 h and used for biotin depletion-affinity purification (AP) experiments. For biotin depletion, protein extracts were either filtered through one (1x) or two consecutive (2x) PD-10 desalting columns or concentrated repeatedly using an Amicon Ultra centrifugal filter. Samples were taken before and after this step to check for protein loss. From the biotin-depleted extracts, a volume corresponding to 1/5 of the amount used for the PL experiments shown in Figures 4–6 was used for AP with the indicated amount of streptavidin (SA) beads. Samples of the supernatants after AP and of the proteins eluted from the beads were taken to determine the ratio of biotinylated proteins remaining in the protein extract and bound to the beads. All samples were analyzed by immunoblotting (IB) with SA-HRP. The amount of protein extracts and bead eluates loaded correspond to 0.05% and 0.5% of the total volumes, respectively. The Coomassie Brilliant Blue-stained membranes (CBB) are shown as loading controls for the IBs. Asterisks mark the positions of naturally biotinylated proteins. Biotin depletion with the Amicon Ultra Centrifugal filter, but not with PD-10 columns resulted in considerable protein loss. Increasing the amount of beads increased the AP efficiency.
Figure 5 with 6 supplements
‘FAMA interactome’ experiment – PL with TbID reveals potential FAMA interactors involved in transcriptional regulation.
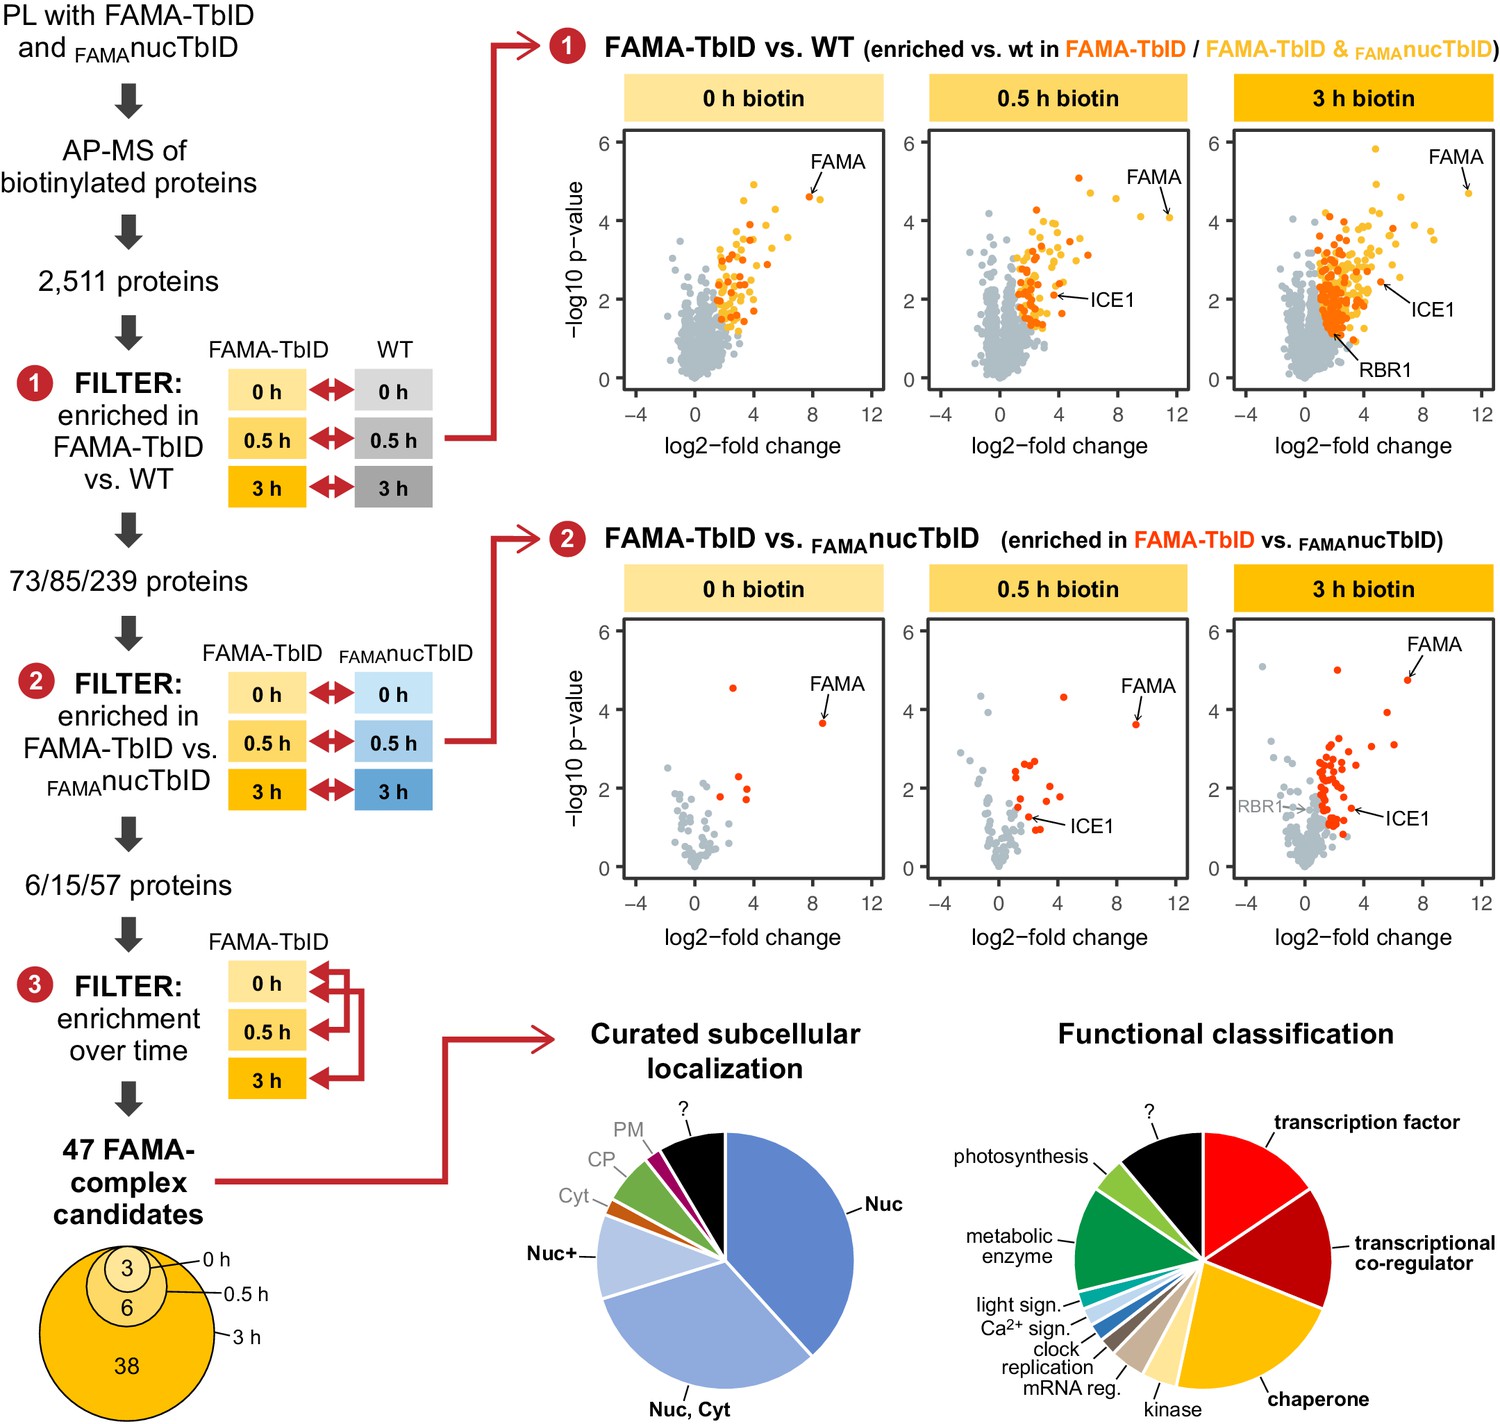
Workflow (left) and results (right) of the experimental setup and data filtering process. Biotinylated proteins from seedlings expressing FAMA-TbID or nuclear TbID in FAMA-stage cells (FAMAnucTbID) and from wild-type (WT) after 0, 0.5 and 3 h of biotin treatment were affinity purified (AP) with streptavidin beads and analyzed by mass spectrometry (MS). Proteins that were identified in all three biological replicates of at least one genotype and time point (2511 proteins) were used to filter for FAMA-complex candidates by three consecutive filtering steps: First, proteins enriched in FAMA-TbID compared to WT were determined for each time point using unpaired two-sided t-tests with a permutation-based FDR for multiple sample correction to remove background from non-specific binding to the beads. Only proteins that were identified in all three replicates of FAMA-TbID at this time point (high confidence identifications) were used for the test (cutoff: FDR = 0.05, S0 = 0.5; ❶). Significantly enriched proteins were then filtered for enrichment compared to FAMAnucTbID (same t-test parameters; ❷) to remove stochastically labeled proteins. Finally, the remaining proteins were filtered for enrichment in biotin-treated versus untreated FAMA-TbID samples (t-test: p<0.05; ❸) to remove proteins that were not labeled in response to biotin treatment. The Venn diagram on the bottom left shows the distribution of the 47 candidates between time points (see Table 1 for candidate list). Scatter plots on the right show log2-fold changes and -log10 p-values from t-test comparisons between FAMA-TbID and WT (top) and FAMA-TbID and FAMAnucTbID (center). Proteins significantly enriched in FAMA-TbID are shown in yellow, orange and red. All filtering steps and statistical analyses were done in Perseus. Subcellular localization and functional distribution of the candidate proteins is shown as pie charts on the bottom right. Data were manually curated from literature. Abbreviations: Nuc, nucleus; Cyt, cytosol; CP, chloroplast; PM, plasma membrane; +, and other. For hierarchical clustering and PCA of samples used in this experiment, see Figure 5—figure supplement 2. For a multi scatterplot of all samples, scatterplots and heatmaps of proteins enriched in FAMA-TbID and FAMAnucTbID compared to WT and for enrichment of proteins over time in all three genotypes, see Figure 5—figure supplements 3, 4 and 6, respectively. For tables summarizing all identified and enriched proteins, see Supplementary file 2 – Tables 1-4. For an overview over the workflow and proteins identified by affinity purification of FAMA-interacting proteins using a classical AP-MS strategy with GFP-Trap beads, see Figure 5—figure supplement 1 and Supplementary file 2 – Table 5. For small-scale validation of selected candidates by Y2H and pairwise PL in N. benthamiana, see Figure 5—figure supplement 5.
Figure 5—figure supplement 1

FAMA-CFP AP-MS experiments identified ICE1, but no novel transcriptional regulators as putative FAMA partners.
(A) Simplified workflow of the AP-MS experiments. Four-day-old seedlings of a FAMA-CFP line (FAMApro::FAMA-CFP in fama-1) and two lines expressing nuclear GFP under stomatal lineage-specific promoters (SPCHpro::GFPNLS and MUTEpro::GFPNLS) were treated with MG-132 to stabilize proteins and with formaldehyde (FA) to cross-link (X-link) proteins. X-linking was done with 0.25% FA in experiment 1 and with 0.125% in experiment 2. Proteins extracted from 15 g of plant material per sample were used for AP with GFP-Trap beads and purified proteins were identified by liquid chromatography coupled to tandem mass spectrometry (LC-MS/MS). Two biological replicates of each line were used in experiment 1, and four of the FAMA-CFP line and two of each control in experiment 2. (B) Significantly enriched proteins. Scatterplots show the log2-fold change and -log10 p-value from unpaired two-sided t-tests between FAMA-CFP samples and the controls with a permutation-based FDR for multiple sample correction (cutoff: AP-MS 1: FDR = 0.2, S0 = 0.5; AP-MS 2: FDR = 0.01, S0 = 0.5; N = number of proteins used in each test). Significantly enriched proteins are shown in orange and FAMA and its heterodimerization partner ICE1 are indicated. The Venn diagram shows the overlap between the candidate proteins identified in the two experiments (inlcuding FAMA). Only FAMA and ICE1 were enriched in the PL experiment shown in Figure 5. Filtering and statistical analysis was done in Perseus. (C) Subcellular and functional distribution of candidates. Candidates were classified into nuclear and non-nuclear proteins based on localization predictions (SUBA4 consensus prediction) and experimentally determined localization data and nuclear localized proteins were further divided into such that are involved in transcriptional regulation (two proteins, including FAMA) or have a different function (six proteins). For a list of identified proteins and the localization predictions see Supplementary file 2 – Table 5.
Figure 5—figure supplement 2
Clustering and PCA of samples for the ‘FAMA interactome’ PL experiment.
(A) Hierarchical clustering. Proteins that were identified in all three replicates of at least one time point of one genotype were used for average linkage clustering with Euclidian distance. Rows and columns represent individual proteins and samples. In the sample dendrogram, genotypes, replicate numbers and time points are labeled with differently colored and numbered triangles, circles and square (same designations as in (B)). In the heatmap, proteins are colored according to their abundance (label free quantification value). White areas represent proteins not identified in a sample. (B) Principal component analysis (PCA). Missing value were imputed (from normal distribution) and the data matrix was used for PCA. Principal component 1 (PC1) was plotted against PC2 or 3. The PC1-PC3 plot (top) shows separation of the samples by genotype and time. Areas where samples cluster by genotypes and time point are shaded. A batch effect separating replicate 1 from replicates 2 and 3 is visible in PC2 (bottom) as well as in (A). Clustering and PCA analysis were done in Perseus using built-in functions.
Figure 5—figure supplement 3

Multi scatter plot of samples for the ‘FAMA interactome’ PL experiment.
Proteins that were identified in all three replicates of at least one time point of one genotype were used for a multi scatter plot. For each pair-wise comparison, LFQ values of individual proteins in sample A (labeled on top, x-axis) and sample B (labeled on the left, y-axis) are plotted against each other. Plots are scaled equally. Pearson correlation coefficients for each comparison are given in the upper left corner of the plots in blue.
Figure 5—figure supplement 4

Significantly enriched proteins in the FAMA-TbID and FAMAnucTbID lines.
For each time point, proteins that were significantly enriched in FAMA-TbID or FAMAnucTbID compared to wild-type (WT) were determined by two-sided t-tests with a permutation-based FDR for multiple sample correction (cutoff: FDR = 0.05, S0 = 0.5). Only proteins identified in all three biological replicates of either FAMA-TbID (A) or FAMAnucTbID (B) at the indicated time point were used for these tests (N = number of proteins used in each test). Scatterplots on the left show log2-fold changes and -log10 p-values from t-tests (plots in (A) are also shown in Figure 5). Significantly enriched proteins are shown in orange/yellow (A) or dark/light blue (B) and increase with the duration of biotin treatment. Known FAMA interactors (ICE1 and RBR1) and nuclear proteins in guard cells (FAMA and SCAP1) are indicated. The heatmaps on the right of each scatter plot show average linkage clustering of significantly enriched proteins in this plot. Proteins are colored according to their abundance (Z-transformed label free quantification values). White areas represent proteins not identified in a sample.
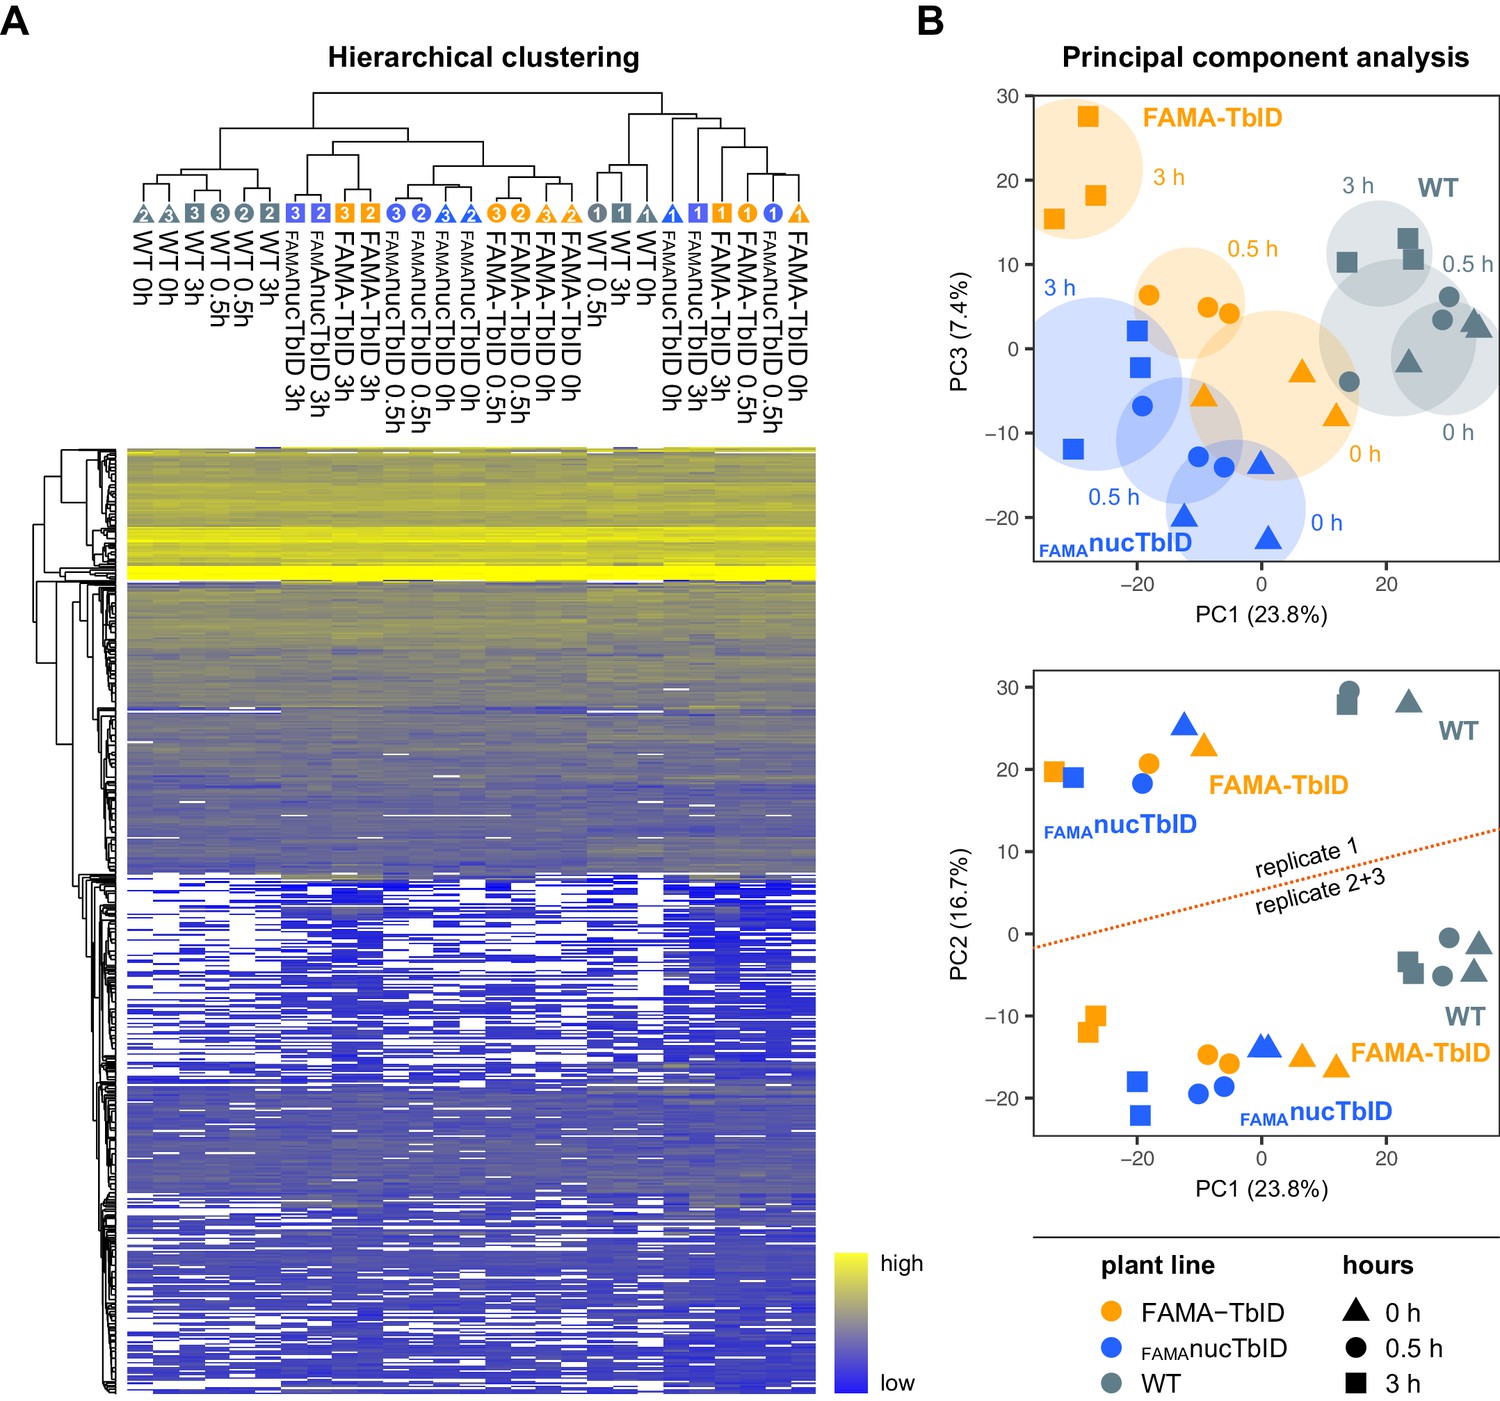
Figure 5—figure supplement 5
Validation of FAMA complex candidates.
Y2H (A–B) and pairwise proximity labeling assays (C) to test direct interaction and relative proximity of four putative FAMA interaction candidates: co-repressor complex components SEU and LUH and BR signaling TFs BZR1 and BIM1. ICE1 and MUTE were used as positive and negative controls, respectively. (A–B) Y2H assays: Yeast strain AH109 was co-transformed with pairwise combinations of BD (Gal4 DNA binding domain) or BD-FAMA and AD (Gal4 activation domain) or AD-bait protein fusions. Successful transformation and bait-prey interactions were tested for by growth on synthetic defined media (-LT: selection for transformants, -LTHA: selection for interaction) (A). To overcome the autoactivation activity of BD-FAMA (see -LTHA plates), 3-AT was added to the plates at two different concentrations to increase selection stringency. For each combination, three dilutions were spotted on the plates and pictures were taken after 6 days. Three clones per combination were tested with the same result. One replicate is shown. We noticed that both ICE1 and SEU cause a delay in yeast growth. Therefore, the clones used for the growth-based interaction assay shown in (A), were also streaked on a selective plate containing X-α-Gal for blue/white selection (B). Blue color indicates positive interaction. The picture was taken after 2 days. (C) Pairwise proximity labeling assays: FAMA-TbID-Venus or TbID-YFPNLS were co-transformed with HA- or myc-tagged versions of ICE1, MUTE, SEU and LUH (all under the control of the UBQ10 promoter) into N. benthamiana leaves. After 2 days, expression of the TbID construct was verified by fluorescent microscopy (see images on the right) and samples were frozen for pulldowns of biotinylated proteins with streptavidin (SA) beads. To avoid over-labeling due to high expression of bait and prey proteins and to label only close interactors of FAMA, no exogenous biotin was added to the leaves. Immunoblots on the right show total amounts of FAMA-TbID-Venus or TbID-YFPNLS (IB: GFP) and the prey proteins (IB: myc, IB: HA) in the protein extracts before pulldowns (input) and as biotinylated proteins eluted from the SA beads (IP). Coomassie stained membranes (CBB) are shown as a loading control. Red arrowheads mark evidence of biotinylation of the bait protein by FAMA-TbID. (D) Summary of observed interactions: Positive interactions with FAMA in (A–C) are indicated by arrows. Line thickness indicates interaction strength. LUH shows weak interaction in the Y2H but was not biotinylated in the PL assay, which could indicate that it is not a direct interactor of FAMA.
Figure 5—figure supplement 6
Increase of biotinylation in the PL samples over time.
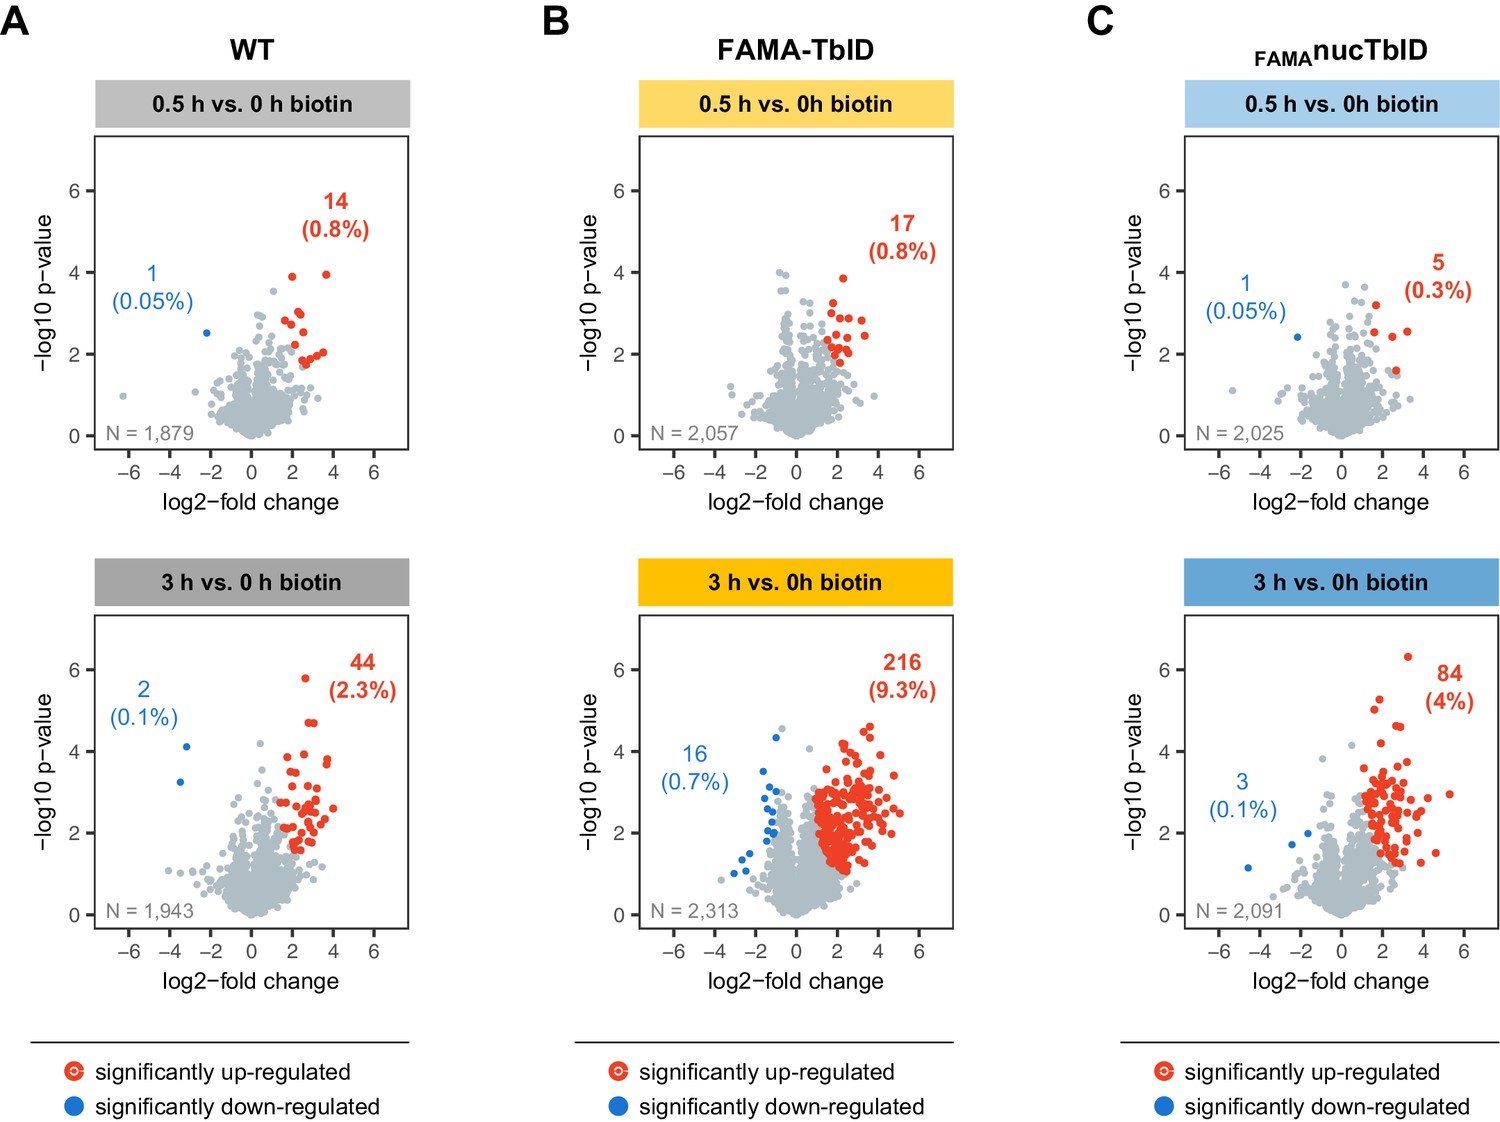
Proteins that were significantly enriched in wild-type (WT), FAMA-TbID or FAMAnucTbID samples after 0.5 and after 3 h of biotin treatment compared to untreated samples were determined by two-sided t-tests with a permutation-based FDR for multiple sample correction (cutoff: FDR = 0.05, S0 = 0.5). Only proteins identified in all three biological replicates of wild-type (WT) (A), FAMA-TbID (B) or FAMAnucTbID (C) at any of the two time points were used for the tests (N = number of proteins used in each test). Scatterplots show log2-fold changes and -log10 p-values from t-tests. Significantly up-and down-regulated proteins are shown in red and blue and their number and percentage of all analyzed proteins are given. Only few proteins are enriched in any of the genotypes after 0.5 h of biotin treatment.
Figure 6 with 4 supplements
‘Nuclear proteome’ experiment – PL with nuclear TbID results in identification of FAMA- and global nuclear proteomes with high organellar specificity.
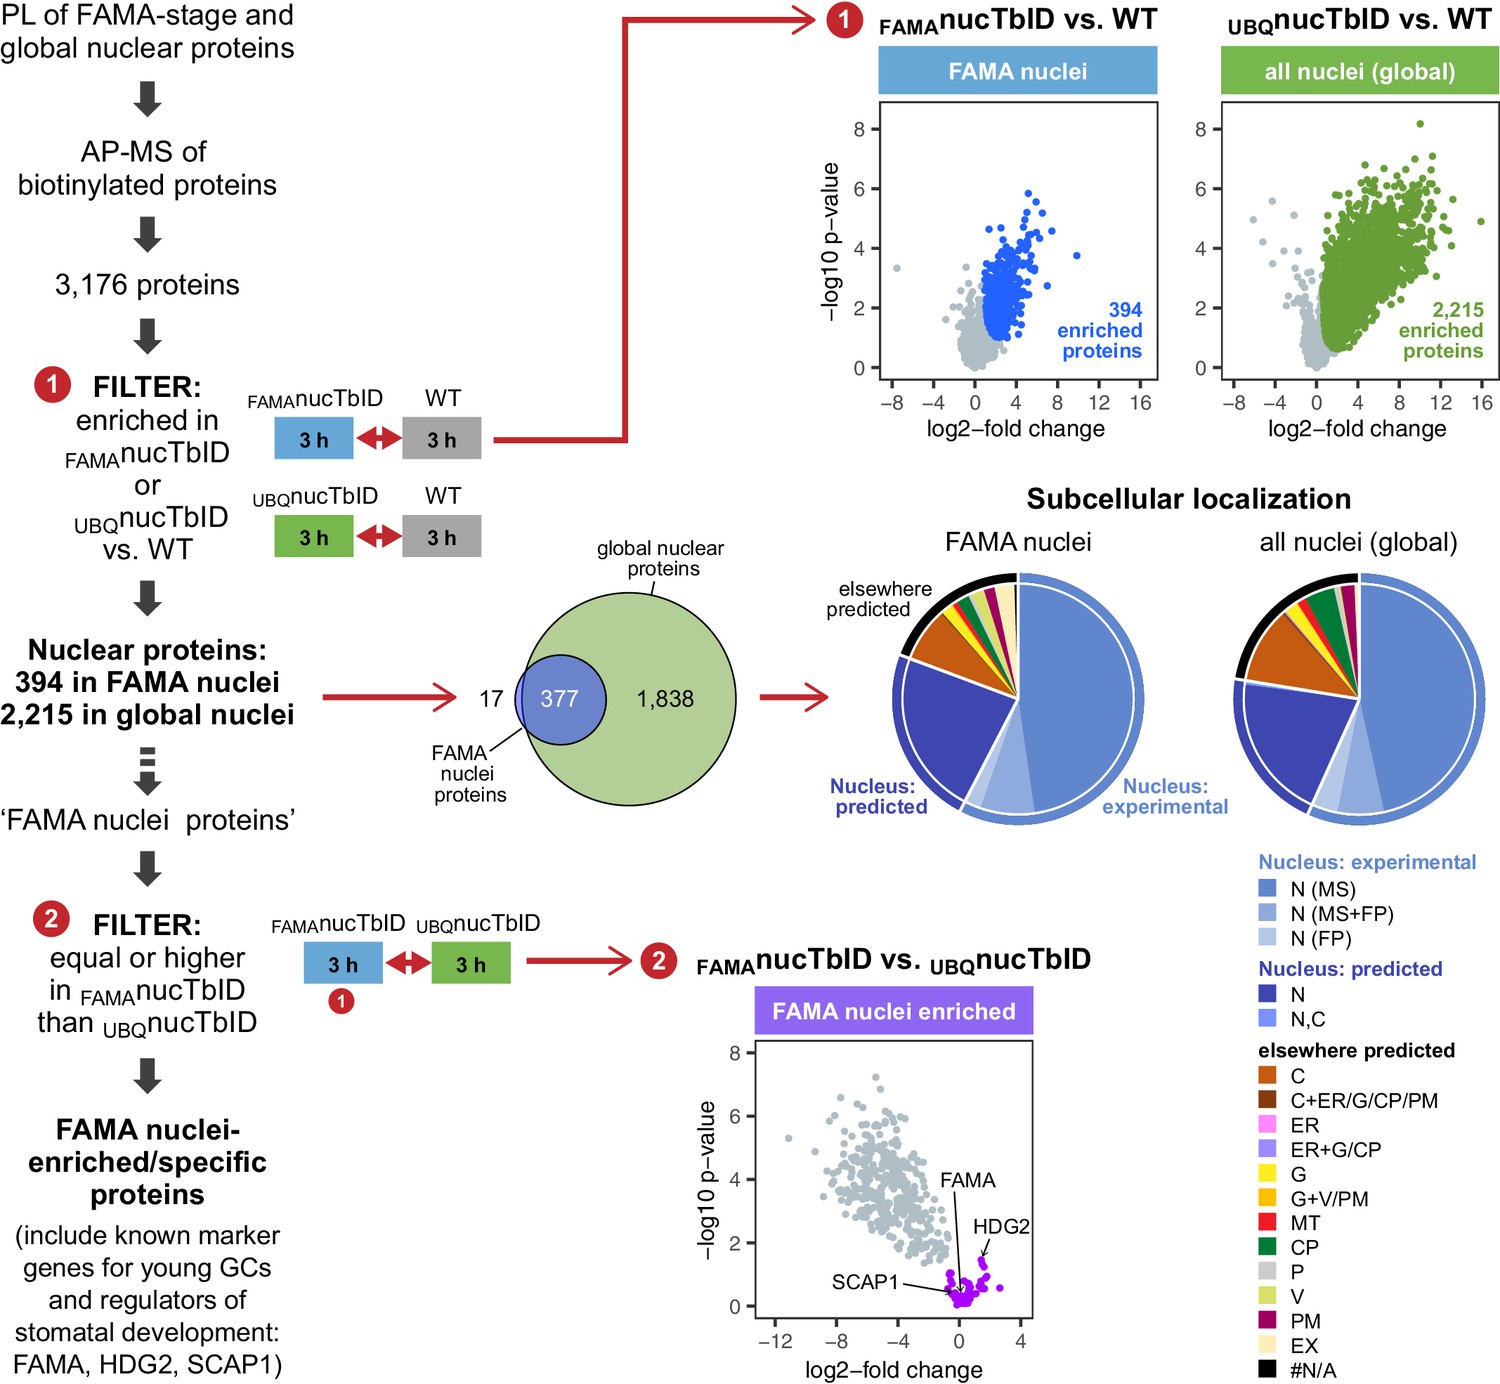
Workflow (left) and results (right) of the experimental setup and data filtering process. Biotinylated proteins from seedlings expressing nuclear TbID under the FAMA (FAMAnucTbID) and UBQ10 (UBQnucTbID) promoters and from wild-type (WT) after 3 h of biotin treatment were affinity purified (AP) with streptavidin beads and analyzed by mass spectrometry (MS). Proteins that were identified in all three replicates of at least one genotype (3,176) were used to filter for the FAMA cell- and global nuclear proteomes: proteins enriched in FAMAnucTbID or UBQnucTbID compared to WT were determined by unpaired two-sided t-tests with a permutation-based FDR for multiple sample correction. Only proteins that were identified in all three replicates of the respective nucTbID line (high confidence identifications) were used for the test (cutoff: FDR = 0.05, S0 = 0.5; ❶). Scatter plots of the log2-fold changes and -log10 p-values from the t-test comparisons are on the top right. Significantly enriched proteins are shown in blue and green. Overlap of the enriched proteins and subcellular distribution are shown as Venn diagrams and pie charts on the center right. Proteins previously found in the nucleus in MS- or fluorescent protein (FP) fusion-based experiments, and proteins predicted to be in the nucleus (SUBA4 consensus prediction) are depicted in different shades of blue (N, nucleus; C, cytosol; CP, plastid; MT, mitochondrion; ER, endoplasmic reticulum; G, golgi; P, peroxisome; V, vacuole; PM, plasma membrane; EX, extracellular; #N/A, not available). Proteins that are highly enriched in or even specific to FAMA nuclei were identified through further filtering by comparing the abundance of the 394 FAMA nuclear proteins between FAMAnucTbID and UBQnucTbID using a two-sided t-test with a permutation-based FDR for multiple sample correction (FDR = 0.01, S0 = 0.1; ❷). Proteins that were not enriched in the UBQnucTbID samples (higher in FAMAnucTbID or equally abundant) were considered ‘FAMA nuclei enriched/specific’. A scatterplot of the t-test results with ‘FAMA nuclei enriched/specific’ proteins in purple is shown at the center bottom. For hierarchical clustering and PCA of samples used in this experiment, see Figure 6—figure supplement 1. For multi scatterplots, scatterplots and heatmaps of proteins enriched in FAMAnucTbID and UBQnucTbID, see Figure 6—figure supplements 2 and 3. For a visualization of enriched GO terms, see Figure 6—figure supplement 4. For tables summarizing all identified and enriched proteins, published nuclear proteins and guard cell proteins, the localization data used for the pie charts in Figure 6, enriched GO terms of the nuclear proteomes and examples of identified proteins from different nuclear compartments, see Supplementary file 3 – Tables 1-8.
Figure 6—figure supplement 1
Clustering and PCA of samples for the ‘nuclear proteome’ PL experiment.
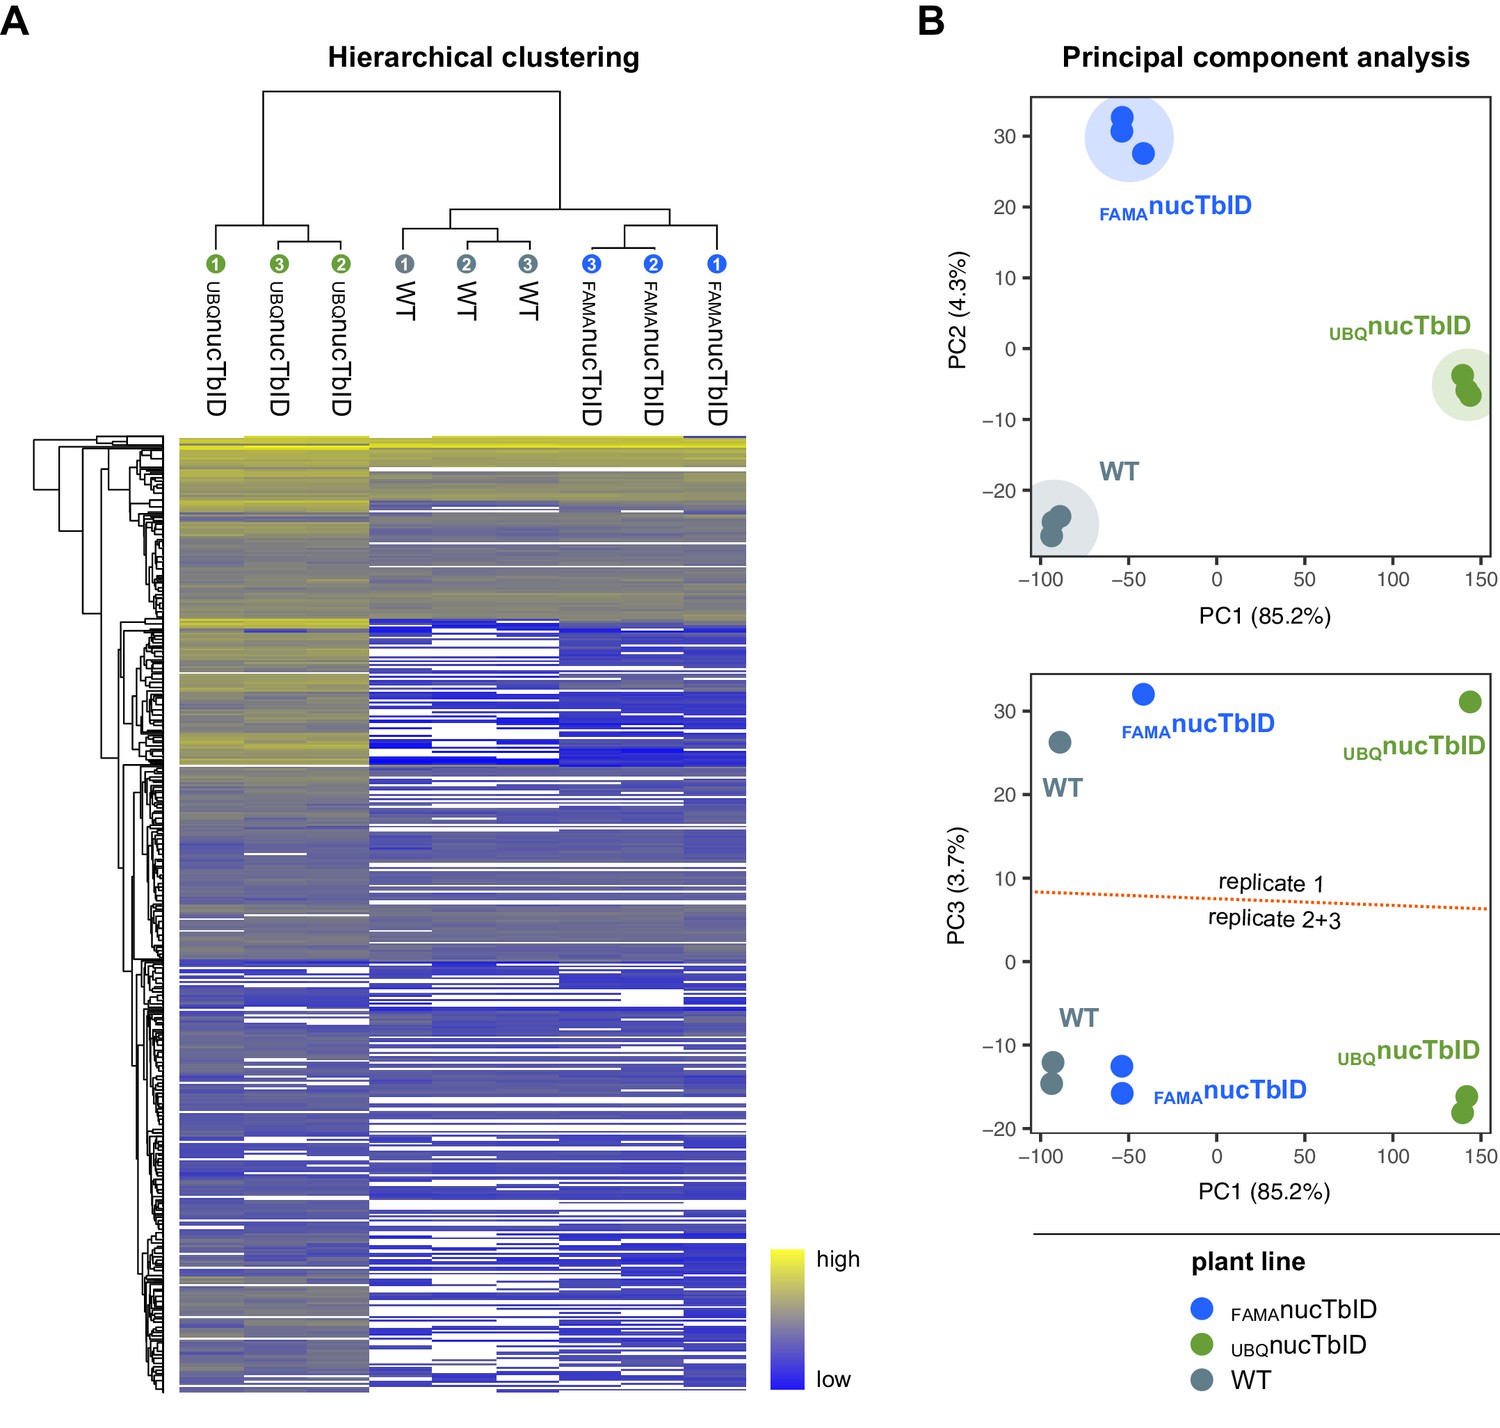
(A) Hierarchical clustering. Proteins that were identified in all three replicates of at least one genotype were used for average linkage clustering with Euclidian distance. Rows and columns represent individual proteins and samples. In the sample dendrogram, genotypes and replicate number are labeled with differently colored and numbered circles. In the heatmap, proteins are colored according to their abundance (label free quantification value). White areas represent proteins not identified in a sample. (B) Principal component analysis (PCA). Missing value were imputed (from normal distribution) and the data matrix was used for PCA. Principal component 1 (PC1) was plotted against PC2 or 3. The PC1-PC2 plot (top) shows clear separation of the samples by genotype. Areas where samples cluster are shaded. A batch effect separating replicate 1 from replicates 2 and 3 is visible in PC3 (bottom). Clustering and PCA analysis were done in Perseus using built-in functions.
Figure 6—figure supplement 2

Multi scatter plot of samples for the ‘nuclear proteome’ PL experiment.
Proteins that were identified in all three replicates of at least one genotype were used for a multi scatter plot. For each pair-wise comparison, LFQ values of individual proteins in sample A (labeled on top, x-axis) and sample B (labeled on the left, y-axis) are plotted against each other. Plots are scaled equally. Pearson correlation coefficients for each comparison are given in the upper left corner of the plots in blue.
Figure 6—figure supplement 3
Significantly enriched proteins in FAMA-expressing and all nuclei.
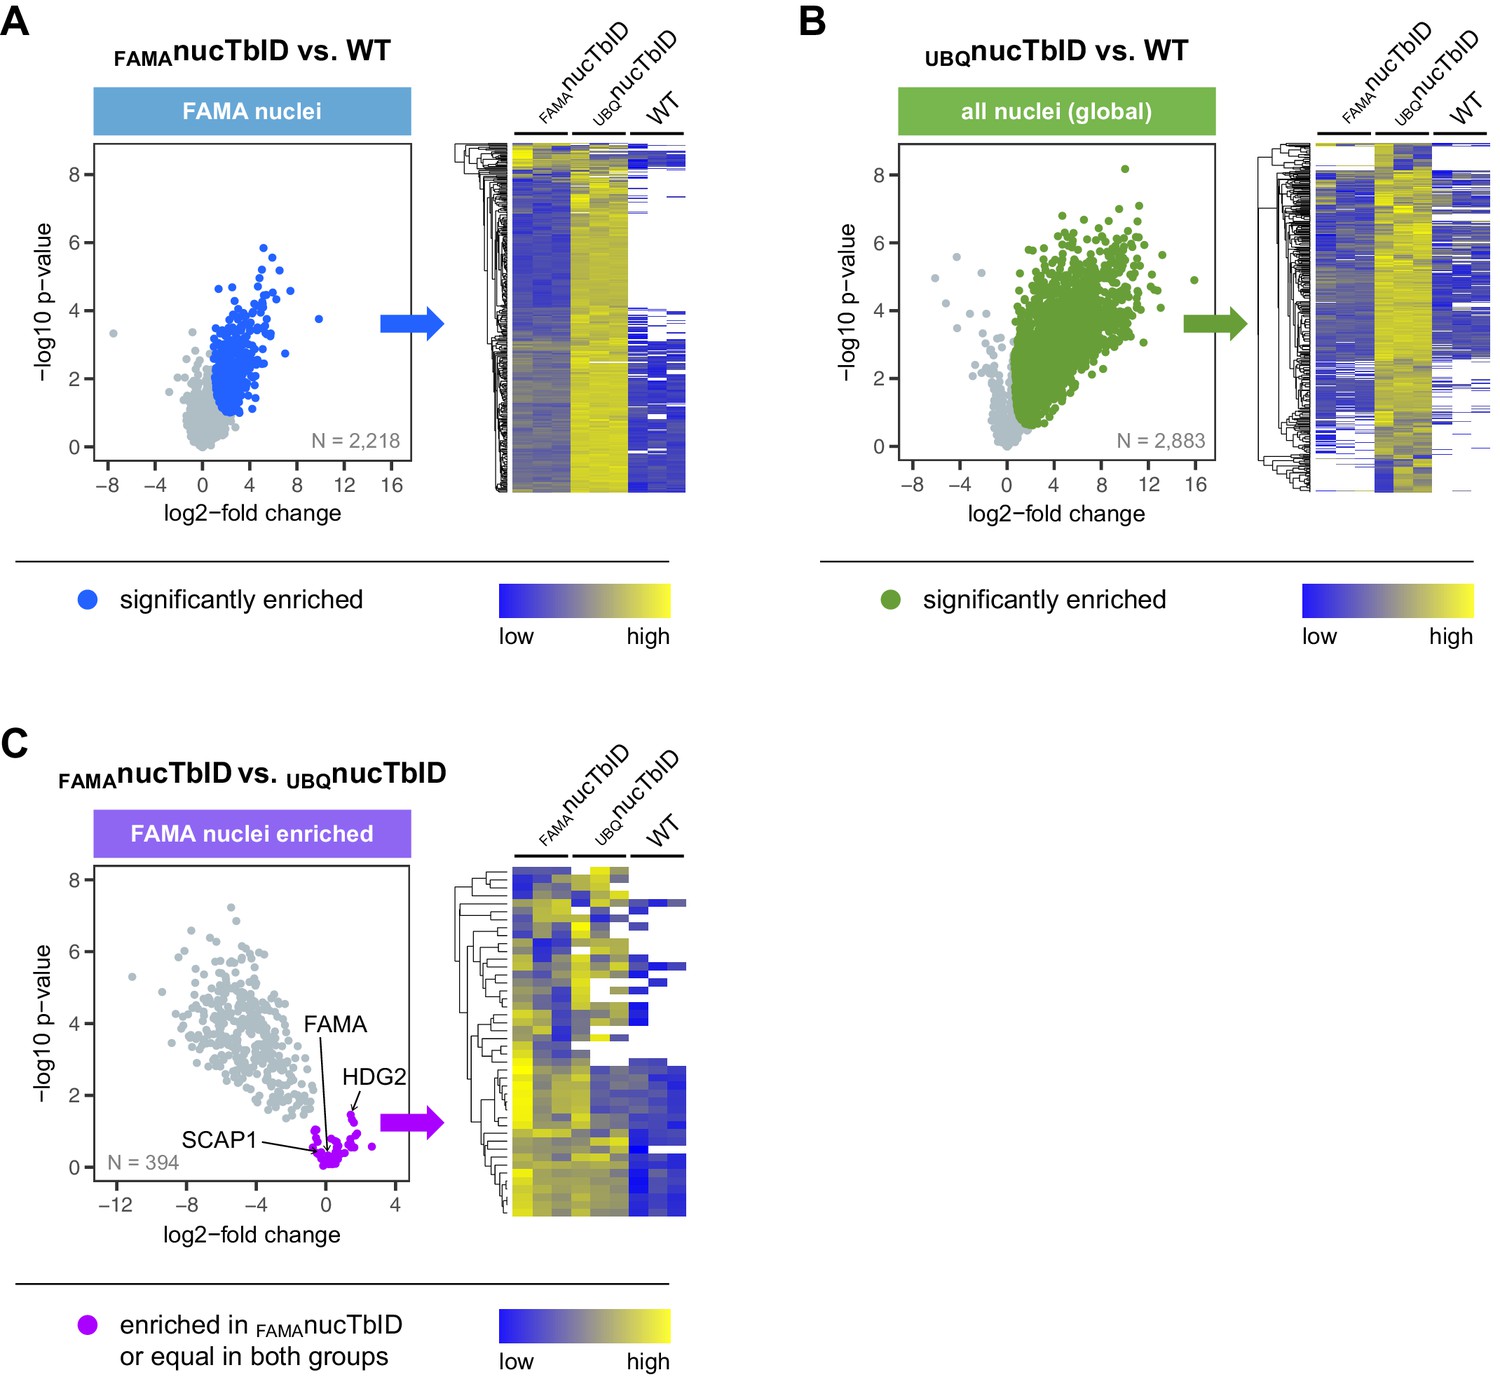
Proteins that were significantly enriched in FAMAnucTbID or UBQnucTbID compared to wild-type (WT) were determined by two-sided t-tests with a permutation-based FDR for multiple sample correction (cutoff: FDR = 0.05, S0 = 0.5). Only proteins identified in all three biological replicates of FAMAnucTbID (A) or UBQnucTbID (B) were used for these tests (N = number of proteins used in each test). Proteins that were enriched in FAMA nuclei compared to all nuclei (C) were determined by a two-sided t-tests with an FDR of 0.01 (S0 = 0.1) using only proteins significantly enriched in FAMAnucTbID compared to WT. Scatterplots on the left are from Figure 6 and show log2-fold changes and -log10 p-values from t-tests. Significantly enriched proteins are shown in blue (A) and green (B) and FAMA nuclei-enriched proteins in purple (C). Known FAMA-nuclei enriched proteins (FAMA, SCAP1, HDG2) are indicated. The heatmaps on the right of each scatter plot show average linkage clustering of significantly enriched proteins in this plot (A–B) or FAMA nuclei-enriched proteins (C). Proteins are colored according to their abundance (Z-transformed label free quantification values). White areas represent proteins not identified in a sample.
Figure 6—figure supplement 4
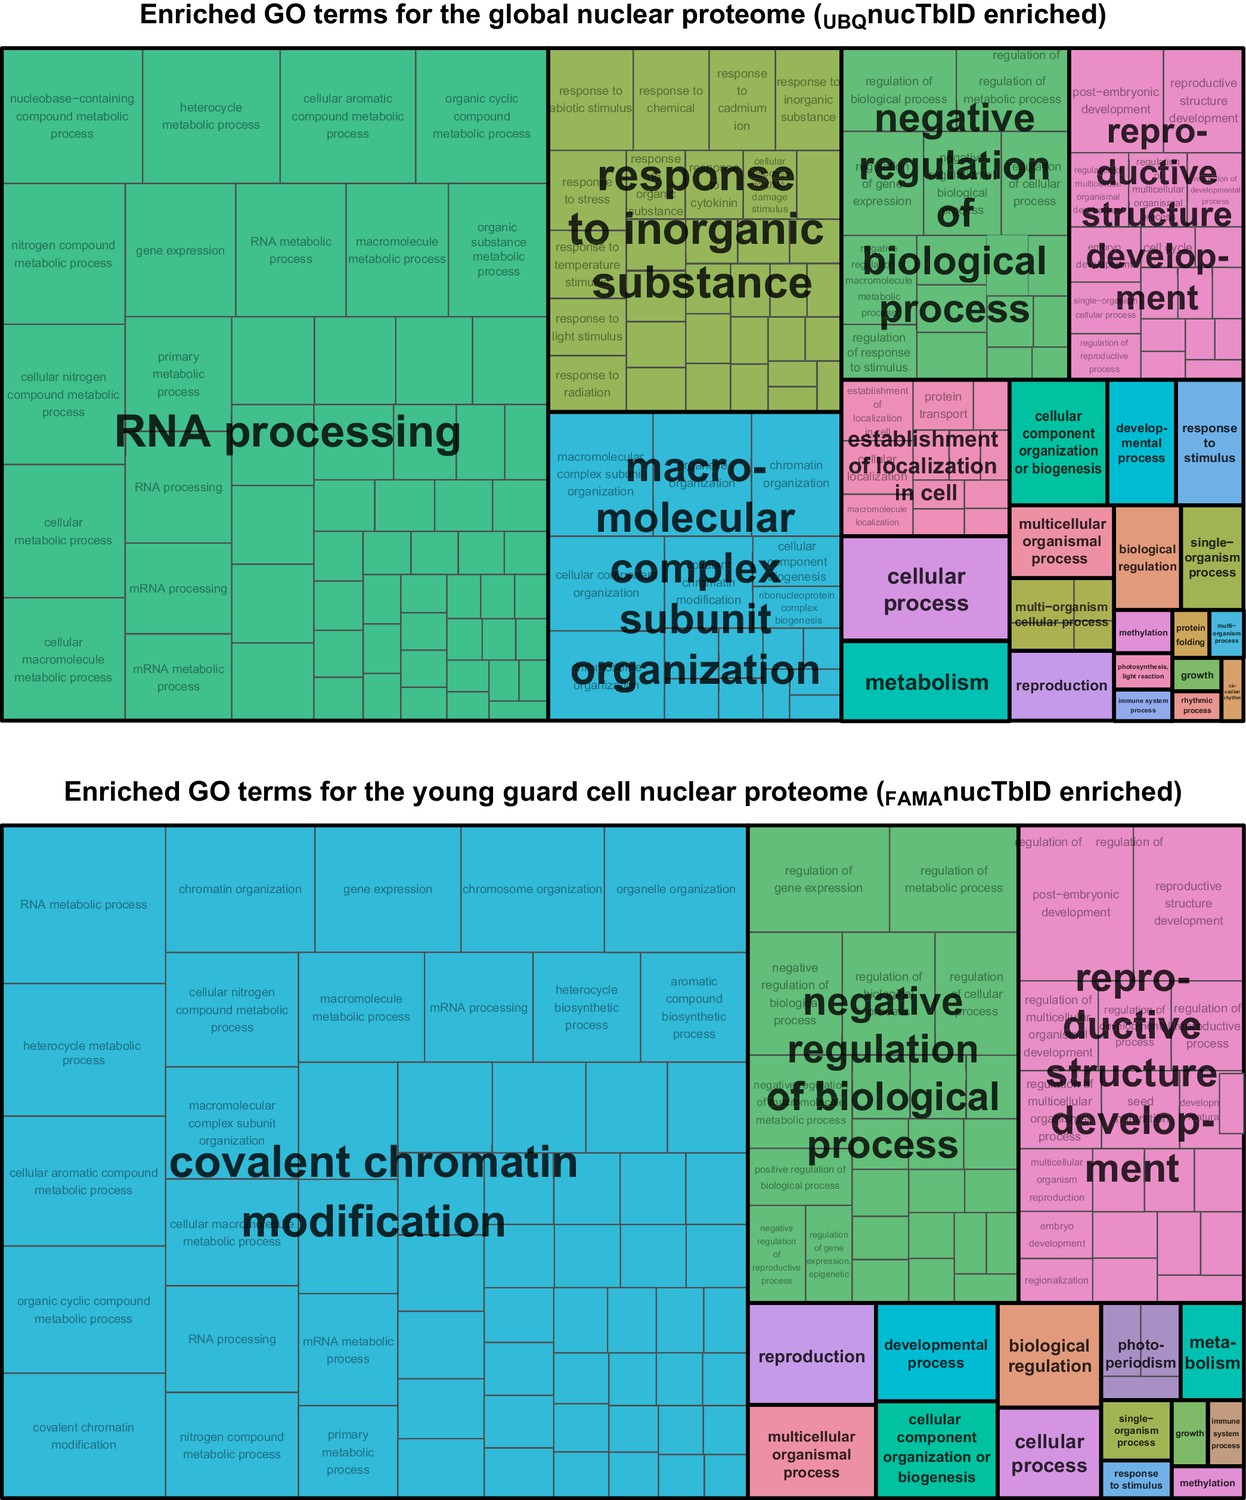
GO terms enriched in global and FAMA nuclear proteomes.
GO terms enriched for global and FAMA nuclear proteins (Figure 6) were determined with AgriGO v2 and visualized with REViGO. Shown is the TreeMap plot of enriched ‘biological processes’ in global (UBQ10 promoter, top) and FAMA (bottom) nuclei. Related GO-terms are clustered into same colored boxes and given summary titles.
Tables
Table 1
FAMA complex candidates from Figure 5.
| Enriched at time point | AGI | Gene name | Functional annotation | Subcellular localization | ||
|---|---|---|---|---|---|---|
| 0 h | 0.5 h | 3 h | ||||
| Y | Y | AT3G26744 | ICE1, SCRM | bHLH transcription factor | N | |
| Y | Y | AT2G46510 | AIB, JAM1 | bHLH transcription factor | N | |
| Y | AT4G16430 | JAM3 | bHLH transcription factor | N, C | ||
| Y | AT5G08130 | BIM1 | bHLH transcription factor | N | ||
| Y | AT1G75080 | BZR1 | Transcription factor | N, C | ||
| Y | Y | AT5G11060 | KNAT4 | Homeobox transcription factor | N, C | |
| Y | AT2G41900 | OXS2, TCF7 | Zinc finger transcription factor | (N), C | ||
| Y | AT1G79000 | HAC1, PCAT2 | Transcriptional co-activator (histone acetyltransferase) | N, C | ||
| Y | AT4G04920 | MED16, SFR6 | Transcriptional co-activator (mediator complex) | N | ||
| Y | AT1G43850 | SEU | Transcriptional co-repressor adapter | N | ||
| Y | AT4G32551 | LUG, RON2 | Transcriptional co-repressor | N | ||
| Y | AT2G32700 | LUH, MUM1 | Transcriptional co-repressor | N | ||
| Y | AT3G15880 | TPR4, WSIP2 | Transcriptional co-repressor | N | ||
| Y | AT5G27030 | TPR3 | Transcriptional co-repressor | N | ||
| Y | AT5G02500 | HSP70-1 | HSP70 chaperone | N, C | ||
| Y | Y | AT5G02490 | HSP70-2 | HSP70 chaperone | N, C | |
| Y | AT3G09440 | HSP70-3 | HSP70 chaperone | N, C | ||
| Y | AT3G12580 | HSP70-4 | HSP70 chaperone | N, C | ||
| Y | AT5G22060 | J2 | HSP70 co-chaperone | N | ||
| Y | AT3G44110 | J3 | HSP70 co-chaperone | N, C, MA | ||
| Y | AT1G62740 | HOP2 | HSP90/70 co-chaperone | (N), C | ||
| Y | AT3G25230 | FKBP62, ROF1 | HSP90/70 co-chaperone | (N), C | ||
| Y | AT4G22670 | HIP1, TPR11 | HSP90/70 co-chaperone | N, C | ||
| Y | Y | Y | AT4G02450 | P23-1 | HSP90 co-chaperone | N, C |
| Y | Y | Y | AT5G56460 | Putative protein kinase | PM | |
| Y | AT5G35410 | SOS2, CIPK24 | Protein kinase | N, C, PM | ||
| Y | AT3G54170 | FIP37 | m6A methyltransferase complex component | N | ||
| Y | AT1G02140 | HAP1, MAGO | Exon-junction complex component | N, C | ||
| Y | AT5G41880 | POLA3, POLA4 | Putative DNA polymerase alpha subunit | N | ||
| Y | AT3G22380 | TIC | Nuclear clock regulation factor | N | ||
| Y | AT2G41100 | TCH3, CAL12 | Calcium-binding protein | N | ||
| Y | AT1G72390 | PHL | Nuclear receptor/co-activator | N, C | ||
| Y | Y | AT1G20110 | FREE1, FYVE1 | ESCRT-I complex component | C, ES, N | |
| Y | AT1G18660 | IAP1 | C3HC4-type RING-finger domain protein | MA, N | ||
| Y | Y | Y | AT1G12200 | FMO | Putative flavin monooxygenase | N/A |
| Y | Y | AT3G53260 | PAL2 | Phenylalanine ammonia-lyase | N, C, EX | |
| Y | AT3G23840 | CER26-LIKE | acyl‐CoA‐dependent acyltransferase | N/A | ||
| Y | AT5G13710 | CPH, SMT1 | C‐24 sterol methyl transferase | N | ||
| Y | AT1G63180 | UGE3 | UDP-Glucose 4-Epimerase | C* | ||
| Y | AT5G17990 | PAT1, TRP1 | Phosphoribosylanthranilate transferase | CP* | ||
| Y | AT1G15980 | NDH48, NDF1 | Chloroplast NAD(P)H dehydrogenase complex subunit | CP | ||
| Y | AT4G30720 | PDE327 | Putative oxidoreductase/electron carrier | CP | ||
| Y | AT1G50570 | Undescribed protein | N | |||
| Y | AT1G30070 | Undescribed protein | N | |||
| Y | AT5G15680 | Undescribed protein | N/A | |||
| Y | AT5G53330 | Undescribed protein | N | |||
| Y | AT4G25290 | Undescribed protein | N/A | |||
-
Column labels: Enriched at time point: time points at which a protein was significantly enriched are marked with Y. AGI: Arabidopsis gene identifier. Subcellular localization: as described for fluorescent protein fusions in literature unless marked with * (localization inferred from functional annotation): N, nucleus; (N), nucleus under heat or other stress; C, cytosol; EX, extracellular; PM, plasma membrane; ES, endosomes; MA, membrane (associated); CP, chloroplast; N/A, localization unknown (no experimental evidence found and localization cannot be clearly inferred from function).
For further information on the candidate proteins and selected references see Supplementary file 2 – Table 4.
Key resources table
| Reagent type (species) or resource | Designation | Source or reference | Identifiers | Additional information |
|---|---|---|---|---|
| Gene (E. coli - modified) | BirA* | Branon et al., 2018; DOI: 10.1038/nbt.4201 | R118G mutant of BirA; promiscuous bacterial biotin ligase | |
| Gene (E. coli - modified) | TurboID; TbID | Branon et al., 2018; DOI: 10.1038/nbt.4201 | more active variant of BirA* | |
| Gene (E. coli - modified) | miniTurbo; mTb | Branon et al., 2018; DOI: 10.1038/nbt.4201 | smaller and more active variant of BirA* | |
| Gene (Arabidopsis thaliana) | FAMA | NA | TAIR:AT3G24140 | transcription factor involved in stomatal development |
| Gene (Arabidopsis thaliana) | SPCH | NA | TAIR:AT5G53210 | transcription factor involved in stomatal development |
| Gene (Arabidopsis thaliana) | MUTE | NA | TAIR:AT3G06120 | transcription factor involved in stomatal development |
| Gene (Arabidopsis thaliana) | SEU | NA | TAIR:AT1G43850 | component of transcriptional co-repressor complex |
| Gene (Arabidopsis thaliana) | LUH | NA | TAIR:AT2G32700 | component of transcriptional co-repressor complex |
| Gene (Arabidopsis thaliana) | BZR1 | NA | TAIR:AT1G75080 | transcription factor involved in brassinosteroid signaling |
| Gene (Arabidopsis thaliana) | BIM1 | NA | TAIR:AT5G08130 | transcription factor involved in brassinosteroid signaling |
| Gene (Arabidopsis thaliana) | ICE1 | NA | TAIR:AT3G26744 | transcription factor involved in stomatal development and cold adaptation |
| Strain, strain background (E. coli) | TOP10 | other | chemically competent E. coli, can be obtained from Invitrogen | |
| Strain, strain background (Saccharomyces cerevisiae) | AH109 | Clontech | ||
| Strain, strain background (Agrobacterium thumefaciens) | GV3101 | other | electrocompetent A. thumefaciens | |
| Strain, strain background (Nicotiana benthamiana) | NB-1 | NA | standard lab strain | |
| Strain, strain background (Arabidopsis thaliana) | Columbia-0; Col-0 | ABRC | ABRC:CS28166 | can be obtained from ABRC |
| Genetic reagent (Arabidopsis thaliana) | fama-1 | Ohashi-Ito and Bergmann, 2006; DOI: 10.1105/tpc.106.046136 | ABRC:SALK_100073 | |
| Genetic reagent (Arabidopsis thaliana) | UBQ10pro::BirA*-YFPNLS | This paper | in Col-0 wild-type background; see Materials and methods for line generation | |
| Genetic reagent (Arabidopsis thaliana) | UBQ10pro::TbID-YFPNLS | This paper | in Col-0 wild-type background; see Materials and methods for line generation | |
| Genetic reagent (Arabidopsis thaliana) | UBQ10pro::mTb-YFPNLS | This paper | in Col-0 wild-type background; see Materials and methods for line generation | |
| Genetic reagent (Arabidopsis thaliana) | UBQ10pro::BirA*-NESYFP | This paper | in Col-0 wild-type background; see Materials and methods for line generation | |
| Genetic reagent (Arabidopsis thaliana) | UBQ10pro::TbID-NESYFP | This paper | in Col-0 wild-type background; see Materials and methods for line generation | |
| Genetic reagent (Arabidopsis thaliana) | UBQ10pro::mTb-NESYFP | This paper | in Col-0 wild-type background; see Materials and methods for line generation | |
| Genetic reagent (Arabidopsis thaliana) | FAMApro::FAMA-TbID-mVenus | This paper | in fama-1 - /- background; see Materials and methods for line generation | |
| Genetic reagent (Arabidopsis thaliana) | FAMApro::TbID-YFPNLS | This paper | in Col-0 wild-type background; see Materials and methods for line generation | |
| Genetic reagent (Arabidopsis thaliana) | FAMApro::FAMA-CFP | Weimer et al., 2018; DOI: 10.1242/dev.160671 | ||
| Genetic reagent (Arabidopsis thaliana) | SPCHpro::GFPNLS | Adrian et al. (2015); DOI: 10.1016/j.devcel.2015.01.025 | ||
| Genetic reagent (Arabidopsis thaliana) | MUTEpro::GFPNLS | Adrian et al. (2015); DOI: 10.1016/j.devcel.2015.01.025 | ||
| Antibody | Streptavidin-HRP | Thermo Fisher Scientific | Thermo Fisher Scientific:S911 | 0.2 µg/ml; 5% BSA in TBS-T |
| Antibody | Rat monoclonal anti-GFP antibody | Chromotek | Chromotek:3H9 | 1:2000; 1–5% skim milk in TBS-T |
| Antibody | Anti-HA High Affinity from rat IgG1 | Roche | Roche:11867423001 | 1:1000; 3–5% skim milk in TBS-T |
| Antibody | Myc-Tag (71D10) Rabbit mAb | Cell Signaling | Cell Signaling:2278S | 1:1000; 5% BSA in TBS-T |
| Antibody | AffiniPure Donkey Anti-Rat IgG-HRP | Jackson Immuno Research Laboratories | Jackson Immuno Research Laboratories:712-035-153 | 1:10000; 1–5% skim milk in TBS-T |
| Antibody | Rabbit Anti-Rat IgG-HRP | Sigma | Sigma:A5795 | 1:10000; 1–5% skim milk in TBS-T |
| Antibody | Goat anti-Rabbit IgG (H and L), HRP conjugated | Agrisera | Agrisera:AS09 602 | 1:20000; 3–5% skim milk in TBS-T |
| Recombinant DNA reagent | R4pGWB601 (plasmid) | Nakamura et al., 2010; DOI: 10.1271/bbb.100184 | RIKEN BRC:pdi00133 | obtained from the Nakagawa lab (http://shimane-u.org/nakagawa/gbv.htm) |
| Recombinant DNA reagent | R4pGWB613 (plasmid) | Nakamura et al., 2010; DOI: 10.1271/bbb.100184 | RIKEN BRC:pdi00099 | obtained from the Nakagawa lab (http://shimane-u.org/nakagawa/gbv.htm) |
| Recombinant DNA reagent | R4pGWB616 (plasmid) | Nakamura et al., 2010; DOI: 10.1271/bbb.100184 | RIKEN BRC:pdi00102 | obtained from the Nakagawa lab (http://shimane-u.org/nakagawa/gbv.htm) |
| Recombinant DNA reagent | pB7m34GW,0 (plasmid | Karimi et al., 2005; DOI: 10.1016/j.tplants.2005.01.008 | ||
| Recombinant DNA reagent | pK7m34GW,0 (plasmid) | Karimi et al., 2005; DOI: 10.1016/j.tplants.2005.01.008 | ||
| Recombinant DNA reagent | pENTR5'/TOPO (plasmid) | Invitrogen | Gateway entry vector for promoters | |
| Recombinant DNA reagent | pENTR/D-TOPO (plasmid | Invitrogen | Gaterway entry vector for tags/genes | |
| Recombinant DNA reagent | pDONR-P2R-P3 (plasmid) | Invitrogen | Gateway entry vector for tags/genes | |
| Recombinant DNA reagent | pGADT7-GW (plasmid) | Lu et al., 2010; DOI: 10.1111/j.1365-313X.2009.04048.x | Addgene:61702 | Gateway compatible Y2H prey vector (Gal4 activation domain) |
| Recombinant DNA reagent | pXDGATcy86 (plasmid) | Ding et al., 2007;DOI: 10.1385/1-59259-966-4:85 | Gateway compatible Y2H bait vector (Gal4 DNA-binding domain) | |
| Recombinant DNA reagent | V5-hBirA(R118G)-NES_pCDNA3 (plasmid) | Branon et al., 2018; DOI: 10.1038/nbt.4201 | obtained from Ting lab | |
| Recombinant DNA reagent | V5-hBirA-Turbo-NES_pCDNA3 (plasmid) | Branon et al., 2018; DOI: 10.1038/nbt.4201 | Addgene:107169 | obtained from Ting lab |
| Recombinant DNA reagent | V5-hBirA-miniTurbo-NES_pCDNA3 (plasmid) | Branon et al., 2018; DOI: 10.1038/nbt.4201 | Addgene:107170 | obtained from Ting lab |
| Recombinant DNA reagent | R4pGWB601_UBQ10p_BirA(R118G)-NES-YFP (plasmid) | This paper | Addgene:127363 | UBQ10 promoter (2 kb), BirA* (cDNA) with nuclear export signal, YFP in Gateway vector R4pGWB601; see Materials and methods for cloning and Addgene for vector map |
| Recombinant DNA reagent | R4pGWB601_UBQ10p_BirA(R118G)-YFP-NLS (plasmid) | This paper | Addgene:127365 | UBQ10 promoter (2 kb), BirA* (cDNA), YFP with nuclear import signal in Gateway vector R4pGWB601; see Materials and methods for cloning and Addgene for vector map |
| Recombinant DNA reagent | R4pGWB601_UBQ10p_Turbo-NES-YFP (plasmid) | This paper | Addgene:127366 | UBQ10 promoter (2 kb), TurboID (cDNA) with nuclear export signal, YFP in Gateway vector R4pGWB601; see Materials and methods for cloning and Addgene for vector map |
| Recombinant DNA reagent | R4pGWB601_UBQ10p_Turbo-YFP-NLS (plasmid) | This paper | Addgene:127368 | UBQ10 promoter (2 kbA), TurboID (cDNA), YFP with nuclear import signal in Gateway vector R4pGWB601; see Materials and methods for cloning and Addgene for vector map |
| Recombinant DNA reagent | R4pGWB601_UBQ10p_miniTurbo-NES-YFP (plasmid) | This paper | Addgene:127369 | UBQ10 promoter (2 kb), miniTurbo (cDNA) with nuclear export signal, YFP in Gateway vector R4pGWB601; see Materials and methods for cloning and Addgene for vector map |
| Recombinant DNA reagent | R4pGWB601_UBQ10p_miniTurbo-YFP-NLS (plasmid) | This paper | Addgene:127370 | UBQ10 promoter (2 kb), miniTurbo (cDNA), YFP with nuclear import signal in Gateway vector R4pGWB601; see Materials and methods for cloning and Addgene for vector map |
| Recombinant DNA reagent | pB7m34GW,0_FAMAp_gFAMA-Turbo-Venus (plasmid) | This paper | FAMA promoter (2.4 kb), FAMA (genomic DNA), TurboID, Venus in Gateway vector pB7m34GW,0; see Materials and methods for cloning | |
| Recombinant DNA reagent | R4pGWB601_FAMAp_Turbo-YFP-NLS (plasmid) | This paper | FAMA promoter (2.4 kb), TurboID, YFP with nuclear import signal in Gateway vector R4pGWB601; see Materials and methods for cloning | |
| Recombinant DNA reagent | pK7m34GW,0_UBQ10p_cFAMA-TbID-Venus (plasmid) | This paper | UBQ10 promoter (2 kb), FAMA (cDNA), TurboID, Venus in Gateway vector pB7m34GW,0; see Materials and methods for cloning | |
| Recombinant DNA reagent | R4pGWB613_UBQ10p_ICE1-3xHA (plasmid) | This paper | UBQ10 promoter (2 kb), ICE1 (cDNA) in Gateway vector R4pGWB613; see Materials and methods for cloning | |
| Recombinant DNA reagent | R4pGWB613_UBQ10p_MUTE-3xHA (plasmid) | This paper | UBQ10 promoter (2 kb), MUTE (cDNA) in Gateway vector R4pGWB616; see Materials and methods for cloning | |
| Recombinant DNA reagent | R4pGWB313_UBQ10p_SEU-4xmyc (plasmid) | This paper | UBQ10 promoter (2 kb), SEU (cDNA) in Gateway vector R4pGWB616; see Materials and methods for cloning | |
| Recombinant DNA reagent | R4pGWB613_UBQ10p_LUH-3xHA (plasmid) | This paper | UBQ10 promoter (2 kb), LUH (cDNA) in Gateway vector R4pGWB613; see Materials and methods for cloning | |
| Recombinant DNA reagent | pXDGATcy86-FAMA (plasmid) | This paper | FAMA (cDNA) in Gateway compatible Y2H bait vector pXDGATcy86; see Materials and methods for cloning | |
| Recombinant DNA reagent | pGADT7-GW-ICE1 (plasmid) | This paper | ICE1 (cDNA) in Gateway compatible Y2H prey vector pGADT7-GW; see Materials and methods for cloning | |
| Recombinant DNA reagent | pGADT7-GW-MUTE (plasmid) | This paper | MUTE (cDNA) in Gateway compatible Y2H prey vector pGADT7-GW; see Materials and methods for cloning | |
| Recombinant DNA reagent | pGADT7-GW-SEU (plasmid) | This paper | SEU (cDNA) in Gateway compatible Y2H prey vector pGADT7-GW; see Materials and methods for cloning | |
| Recombinant DNA reagent | pGADT7-GW-LUH (plasmid) | This paper | LUH (cDNA) in Gateway compatible Y2H prey vector pGADT7-GW; see Materials and methods for cloning | |
| Recombinant DNA reagent | pGADT7-GW-BZR1 (plasmid) | This paper | BZR1 (cDNA) in Gateway compatible Y2H prey vector pGADT7-GW; see Materials and methods for cloning | |
| Recombinant DNA reagent | pGADT7-GW-BIM1 (plasmid) | This paper | BIM1 (cDNA) in Gateway compatible Y2H prey vector pGADT7-GW; see Materials and methods for cloning | |
| Recombinant DNA reagent | Additional plasmids | for list of Gateway compatible vectors to generate N- and C-terminal fusions with TbID or mTb ('PL toolbox') see table in Materials and methods section | ||
| Sequence-based reagent | Primers | see primer table in Materials and methods | ||
| Peptide, recombinant protein | Biotin powder | Sigma | Sigma:B4639 | |
| Commercial assay or kit | BioRad protein assay | BioRad | BioRad:5000006 | |
| Commercial assay or kit | Novex Colloidal blue staining kit | Invitrogen | Invitrogen: LC6025 | |
| Chemical compound, drug | Dynabeads MyOne Streptavidin C1 | Invitrogen | Thermo Fisher:65002 | |
| Chemical compound, drug | Dynabeads MyOne Streptavidin T1 | Invitrogen | Thermo Fisher:65601 | |
| Chemical compound, drug | GFP-Trap_MA beads | ChromotTek | ChromoTek:gtma-20 | |
| Software, algorithm | MaxQuant | Tyanova et al., 2016a; DOI: 10.1038/nprot.2016.136 | version 1.6.2.6 | |
| Software, algorithm | Perseus | Tyanova et al., 2016b; DOI: 10.1038/nmeth.3901 | version 1.6.2.3 | |
| Software, algorithm | Normalyzer | Chawade et al., 2014; DOI: 10.1021/pr401264n | version 1.1.1.1 (web interface: http://normalyzer.immunoprot.lth.se/) | |
| Software, algorithm | R studio | RStudio Team, 2016 | ||
| Software, algorithm | SUBA4 | Hooper et al., 2017; DOI: 10.1093/nar/gkw1041 | web interface: http://suba.live/ | |
| Software, algorithm | AgriGO v2 | Tian et al., 2017; DOI: 10.1093/nar/gkx382 | web interface: http://systemsbiology.cau.edu.cn/agriGOv2/ | |
| Software, algorithm | REViGO | Supek et al., 2011; DOI: 10.1371/journal.pone.0021800 | web interface:http://revigo.irb.hr/ | |
| Other | PD-10 Sesalting Column | GE-Healthcare | Fisher Scientific:45-000-148 |
Additional files
-
Supplementary file 1
Non-cropped immunoblots.
- https://cdn.elifesciences.org/articles/47864/elife-47864-supp1-v3.pdf
-
Supplementary file 2
XLS file containing the following additional protein lists for the ‘FAMA interactome’ experiment (Figure 5 and supplements).
Table 1, ‘identified proteins’: Proteins identified in the ‘FAMA interactome’ experiment; Table 2, ‘FAMA-TbID enriched’: Proteins significantly enriched in FAMA-TbID vs. WT and FAMAnucTbID samples and in FAMAnucTbID vs. WT; Table 3, ‘enrichment over time’: Proteins significantly enriched in WT, FAMA-TbID, and FAMAnucTbID after biotin treatment compared to the no-biotin control; Table 4, ‘FAMA complex candidates’: FAMA interaction candidates from Figure 5 and Table 1; Table 5, ‘FAMA AP-MS’: Proteins significantly enriched in AP-MS experiments with FAMA-CFP
- https://cdn.elifesciences.org/articles/47864/elife-47864-supp2-v3.xlsx
-
Supplementary file 3
XLS file containing the following additional protein lists for the ‘nuclear proteome’ experiment (Figure 6 and supplements).
Table 1, ‘identified proteins’: Proteins identified in the 'nuclear proteome' experiment; Table 2, ‘enriched with UBQnucTbID’: Proteins significantly enriched in UBQnucTbID vs. WT samples; Table 3, ‘enriched with FAMAnucTbID’: Proteins significantly enriched in FAMAnucTbID vs. WT and FAMAnucTbID vs. UBQnucTbID samples; Table 4, ‘published nuclear proteomes’: Proteins found in proteomics studies of purified nuclei or sub-nuclear compartments by mass spectrometry or in localization studies with fluorescent protein fusions; Table 5, ‘localization prediction’: Protein localization data used for pie charts in Figure 6; Table 6, ‘published GC proteome’: Proteins found in published guard cell proteomics experiments; Table 7, ‘GO term enrichment’: Enriched GO terms of nuclear proteins in Figure 6 and supplements; Table 8, ‘nuclear compartments’: Selected marker proteins and protein classes for different nuclear compartments and domains identified in the UBQnucTbID and FAMAnucTbID dataset
- https://cdn.elifesciences.org/articles/47864/elife-47864-supp3-v3.xlsx
-
Transparent reporting form
- https://cdn.elifesciences.org/articles/47864/elife-47864-transrepform-v3.docx
Download links
A two-part list of links to download the article, or parts of the article, in various formats.
Downloads (link to download the article as PDF)
Open citations (links to open the citations from this article in various online reference manager services)
Cite this article (links to download the citations from this article in formats compatible with various reference manager tools)
Proximity labeling of protein complexes and cell-type-specific organellar proteomes in Arabidopsis enabled by TurboID
eLife 8:e47864.
https://doi.org/10.7554/eLife.47864


