A two-step mechanism for the inactivation of microtubule organizing center function at the centrosome
- Stanford University, United States
Figures
Figure 1 with 2 supplements
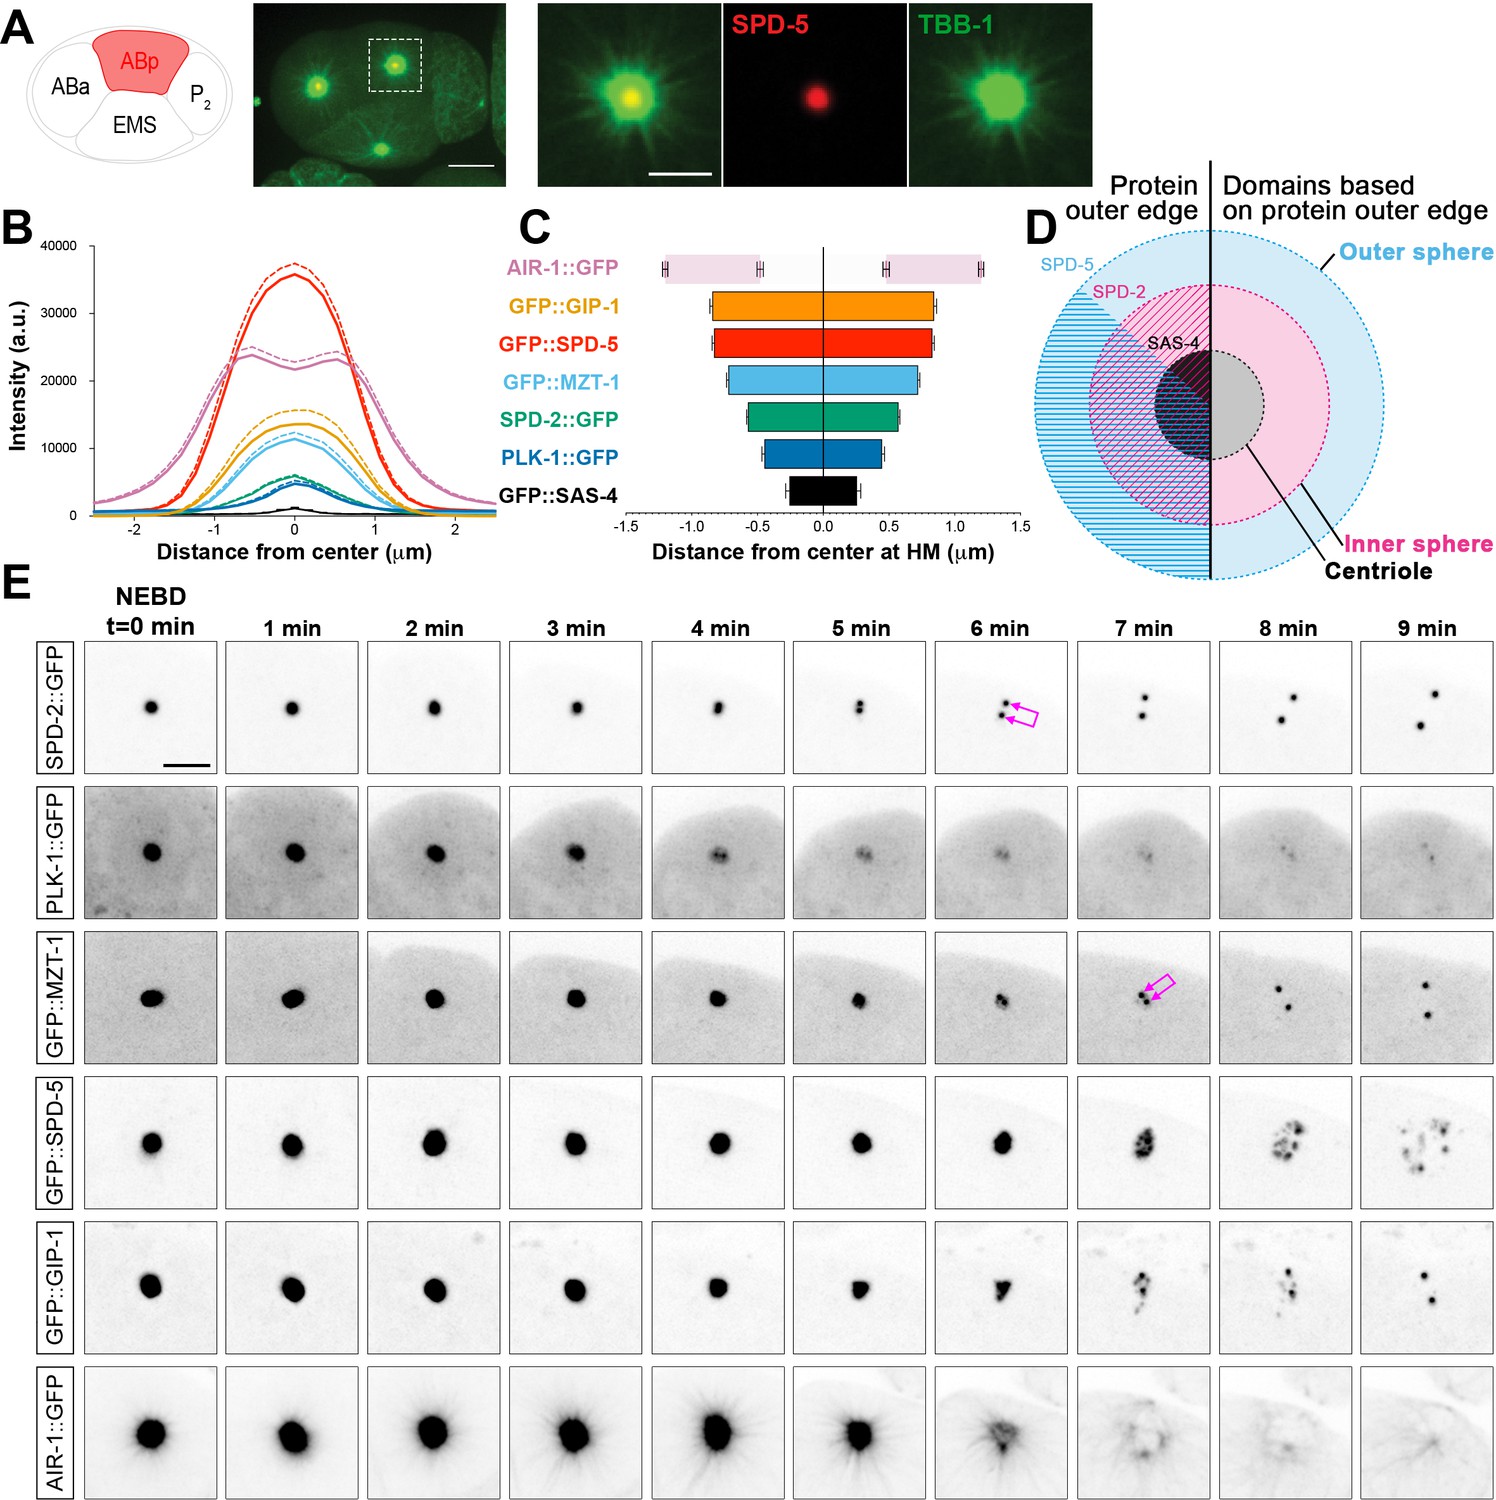
C. elegans PCM is organized into layered spheres that disassemble using different behaviors, see also Figure 1—figure supplement 1, Figure 1—figure supplement 2, Videos 1–4.
(A) Left: Cartoon representing the C. elegans 4-cell stage embryo with ABp in red. Right: 7.5 µm z-projection from a live pie-1p::GFP::TBB-1/β-tubulin (green); tagRFP::SPD-5 (red) expressing embryo showing cell division in ABa and ABp. Note that these cells have a synchronized cell division and start dividing earlier than EMS or P2. Insets: Enlargement of ABp centrosome showing microtubules (green) organized around the centrosome (SPD-5, red). Scale bar, 5 µm. (B) Average pixel intensity profile across the ABp centrosome at NEBD: GFP::GIP-1 (orange, n = 18), GFP::SPD-5 (red, n = 18), AIR-1::GFP (magenta, n = 19), GFP::MZT-1 (light blue, n = 21), SPD-2::GFP (green, n = 21), PLK-1::GFP (blue, n = 15), GFP::SAS-4 (black, n = 19). Bold line represents the mean, dotted lines represent standard error of the mean (s.e.m.). (C) Average distance from center at half maximum (HM) pixel intensity for each protein in B: SAS-4: −0.25–0.25 ± 0.06 µm, n = 19; PLK-1: −0.45–0.45 ± 0.02 µm, n = 15; SPD-2: −0.57–0.57 ± 0.01 µm, n = 21; MZT-1: −0.72–0.72 ± 0.01 µm, n = 21; SPD-5: −0.83–0.83 ± 0.01 µm, n = 18; GIP-1: −0.84–0.84 ± 0.02 µm, n = 18; AIR-1 inner bars are the internal edge of the toroid: −0.48–0.48 ± 0.02 µm, n = 19; AIR-1 outer bars are the external edge of the toroid: −1.20–1.20 ± 0.02 µm, n = 19. (D) Cartoon representing the organization of the centrosome based on the boundary of SAS-4 (black, ‘centriole’), SPD-2 (cyan, ‘inner sphere’), and SPD-5 (magenta, ‘outer sphere’. (E) Time-lapse analysis of the disassembly of each protein analyzed in B, C and D starting at NEBD (t = 0 min) and imaged every minute for 9 min. Image LUTs have been scaled to their respective 7 min timepoint in order to demonstrate the packets observed during disassembly. Note that in some images, the two centrioles and the corresponding newly forming centrosomes become apparent (joined magenta double arrows) following removal of that protein from the PCM. Scale bar, 10 µm.
Figure 1—figure supplement 1
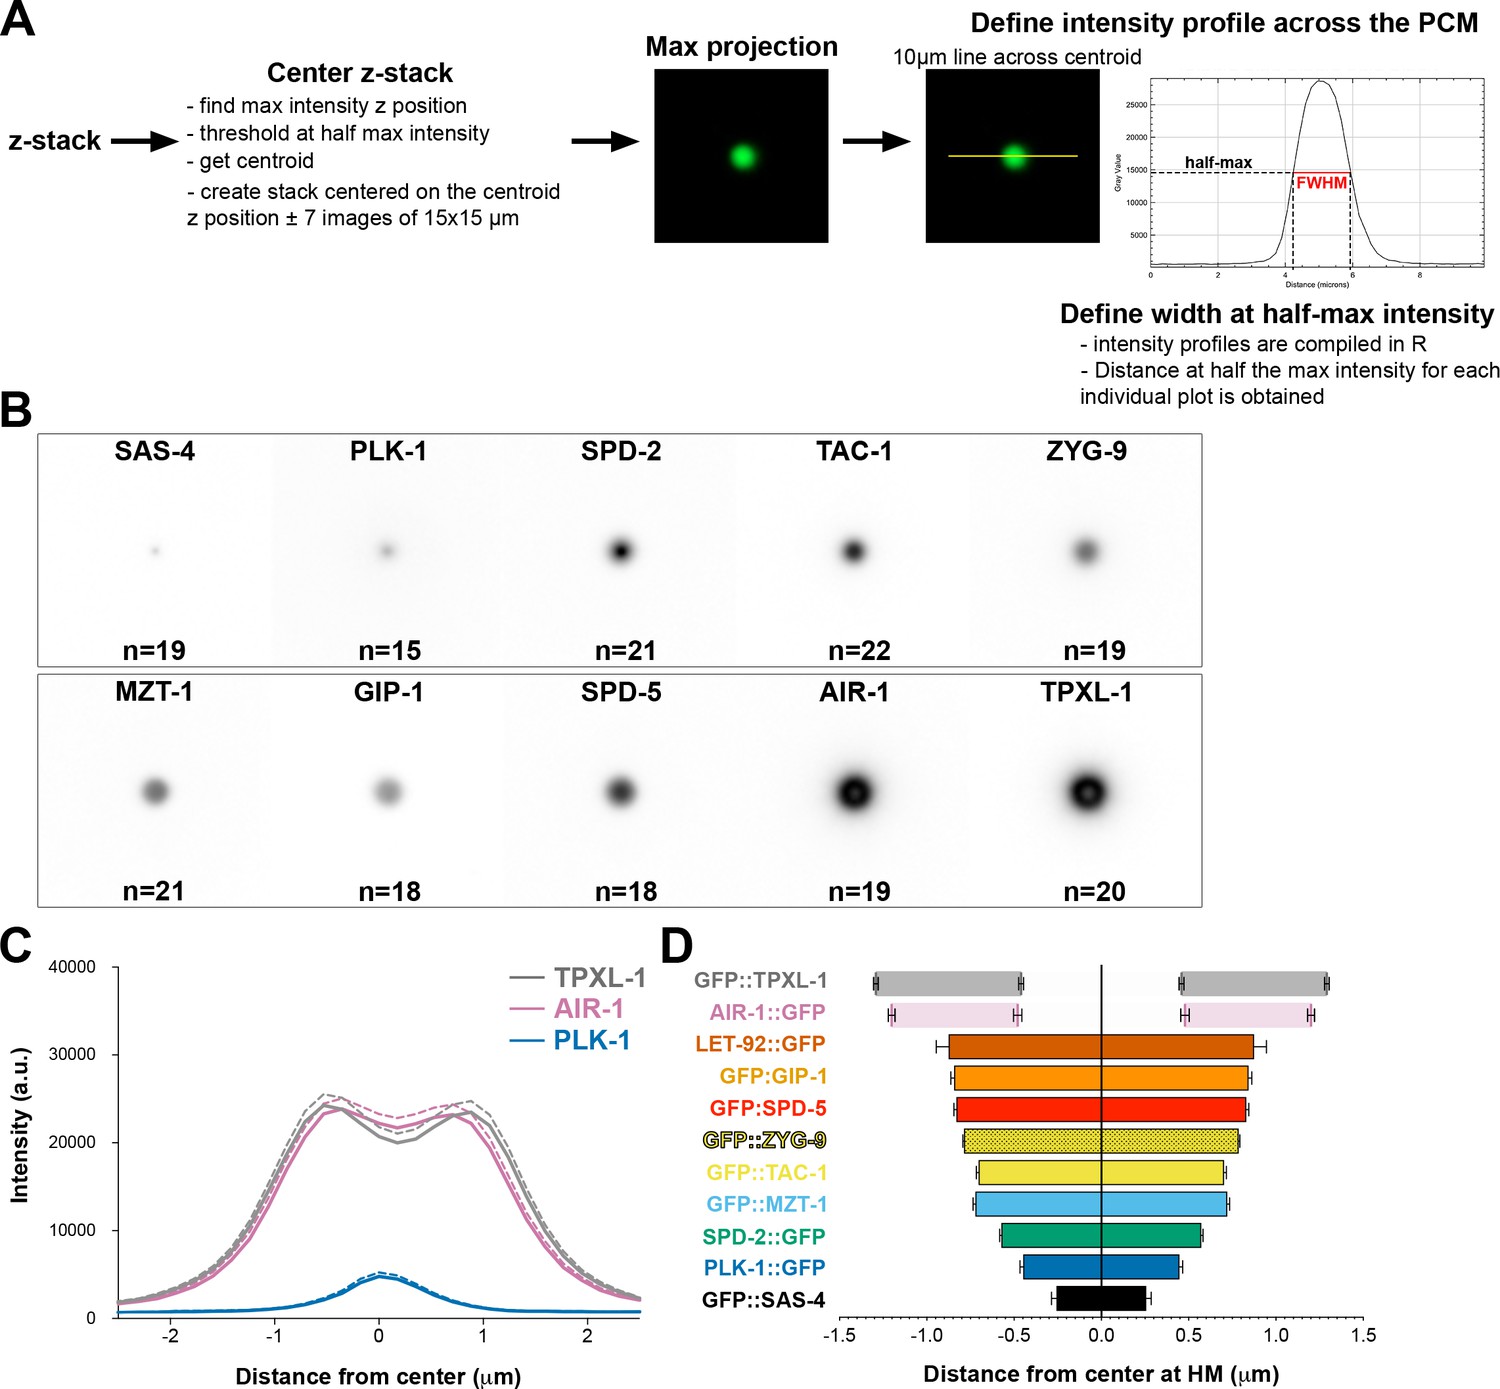
Methods for quantifying PCM width.
(A) The width of each PCM protein was determined using the same image analysis pipeline. Image stacks of about 30 images separated by 0.5 µm z-steps (15 µm total) were acquired at NEBD using the same imaging parameters. Stacks were then cropped to include only the ABp cell and centered around the ABp centrosome closest to the coverslip. We found the max intensity ABp centrosome slice and created a new 30 µm wide substack centered around this slice ± 7 slices (15 slices, 7 µm total). The max intensity slice was then used to find the centroid of the centrosomal structure. This slice was thresholded using the half max intensity and the centroid value was obtained using the Analyze Particle tool (ImageJ). Using the coordinates of the centroid (X,Y) and the max intensity (Z), we created a 15 µm wide substack centered on those coordinates ± 7 slices. The intensity profile was obtained by drawing a 10 µm long line centered on the centroid. Profiles for each embryo were compiled and for each of them the full width at half maximum (FWHM) intensity was determined by measuring the distance at the half max intensity. Measured FWHM for each endogenous protein presented in this study: SAS-4: 0.51 ± 0.06 µm, n = 19; PLK-1: 0.90 ± 0.04 µm, n = 15; SPD-2: 1.15 ± 0.02 µm, n = 21; MZT-1: 1.44 ± 0.03 µm, n = 21; TAC-1: 1.41 ± 0.02, n = 22; ZYG-9: 1.57 ± 0.01, n = 19; SPD-5: 1.66 ± 0.03 µm, n = 18; GIP-1: 1.69 ± 0.04 µm, n = 18; LET-92: 1.75 ± 0.14 µm, n = 18; AIR-1: 2.40 ± 0.04 µm, n = 19; TPXL-1: 2.58 ± 0. 03 µm, n = 20. (B) Mean projection of all max projections used in the study for measuring protein width. Image LUTs have been scaled the same for all images to be representative of the mean level of individual proteins at the centrosome. (C) Average pixel intensity profile across the ABp centrosome at NEBD: AIR-1::GFP (pink, n = 19), GFP::TPXL-1 (grey, n = 19) and PLK-1::GFP (blue, n = 15). Bold line represents the mean, dotted lines represent standard error of the mean (s.e.m.). (D) Average distance from center at half maximum (HM) intensity for each endogenous protein presented in this study. SAS-4: −0.25–0.25 ± 0.06 µm, n = 19; PLK-1: −0.45–0.45 ± 0.02 µm, n = 15; SPD-2: −0.57–0.57 ± 0.01 µm, n = 21; MZT-1: −0.72–0.72 ± 0.01 µm, n = 21; TAC-1: −0.70–0.70 ± 0.01 µm, n = 22; ZYG-9: −0.787–0.787 ± 0.006 µm, n = 19; SPD-5: −0.83–0.83 ± 0.01 µm, n = 18; GIP-1: −0.84–0.84 ± 0.02 µm, n = 18; LET-92: −0.88–0.88 ± 0.07 µm, n = 18; AIR-1 inner bars are the internal edge of the toroid: −0.48–0.48 ± 0.02 µm, n = 19; AIR-1 outer bars are the external edge of the toroid: −1.20–1.20 ± 0.02 µm, n = 19; TPXL-1 inner bars are the internal edge of the toroid: −0.46–0.46 ± 0.01 µm, n = 20; TPXL-1 outer bars are the external edge of the toroid: −1.29–1.29 ± 0.01 µm, n = 20.
Figure 1—figure supplement 2
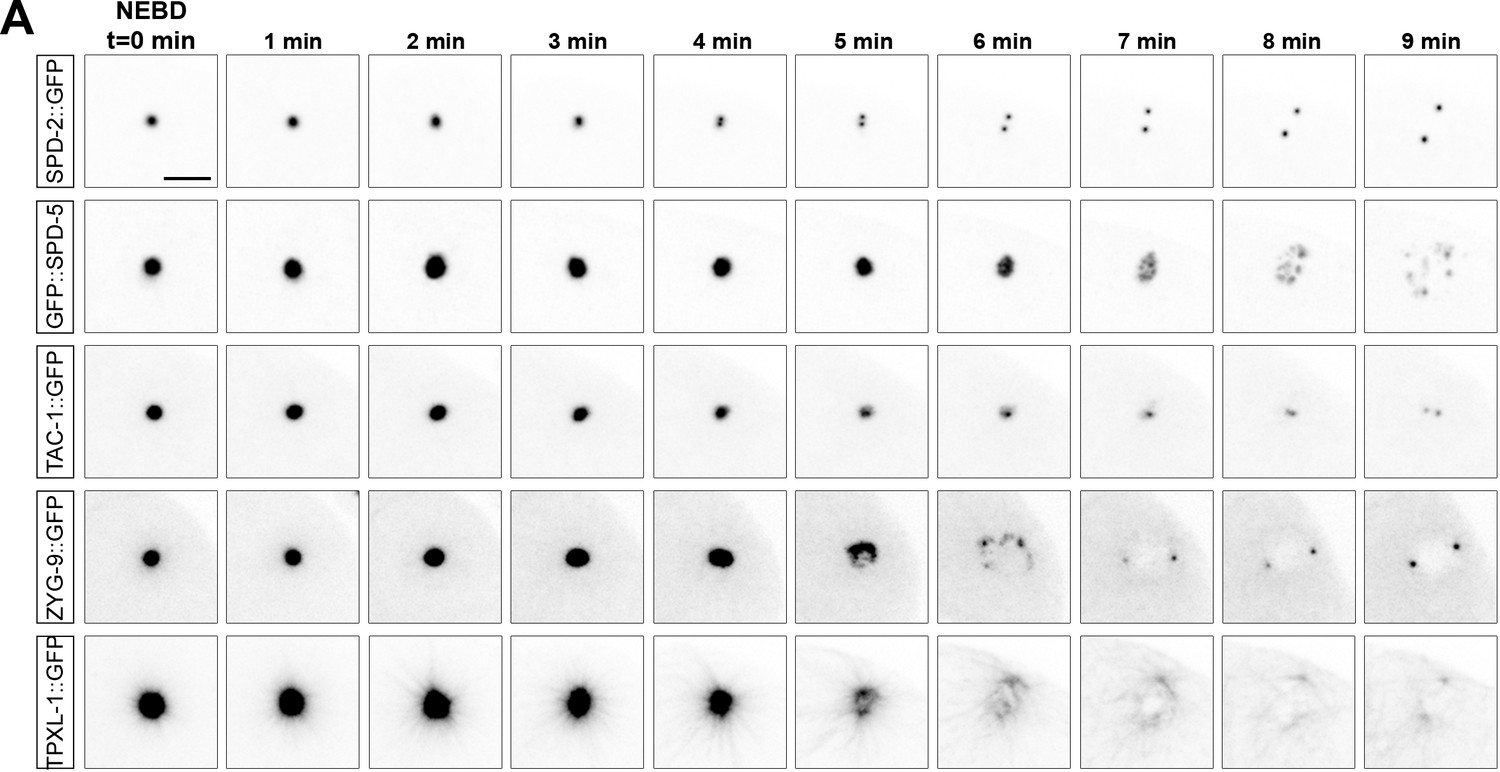
Time-lapse analysis of TAC-1, ZYG-9 and TPXL-1 during disassembly compared to SPD-2 and SPD-5.
(A) Time-lapse analysis of the disassembly of SPD-2 (first row), SPD-5 (second row), TAC-1 (third row), ZYG-9 (fourth row) and TPXL-1 (fifth row) starting at NEBD (t = 0 min) and imaged every minute for 9 min. Scale bar, 10 µm.
Figure 2
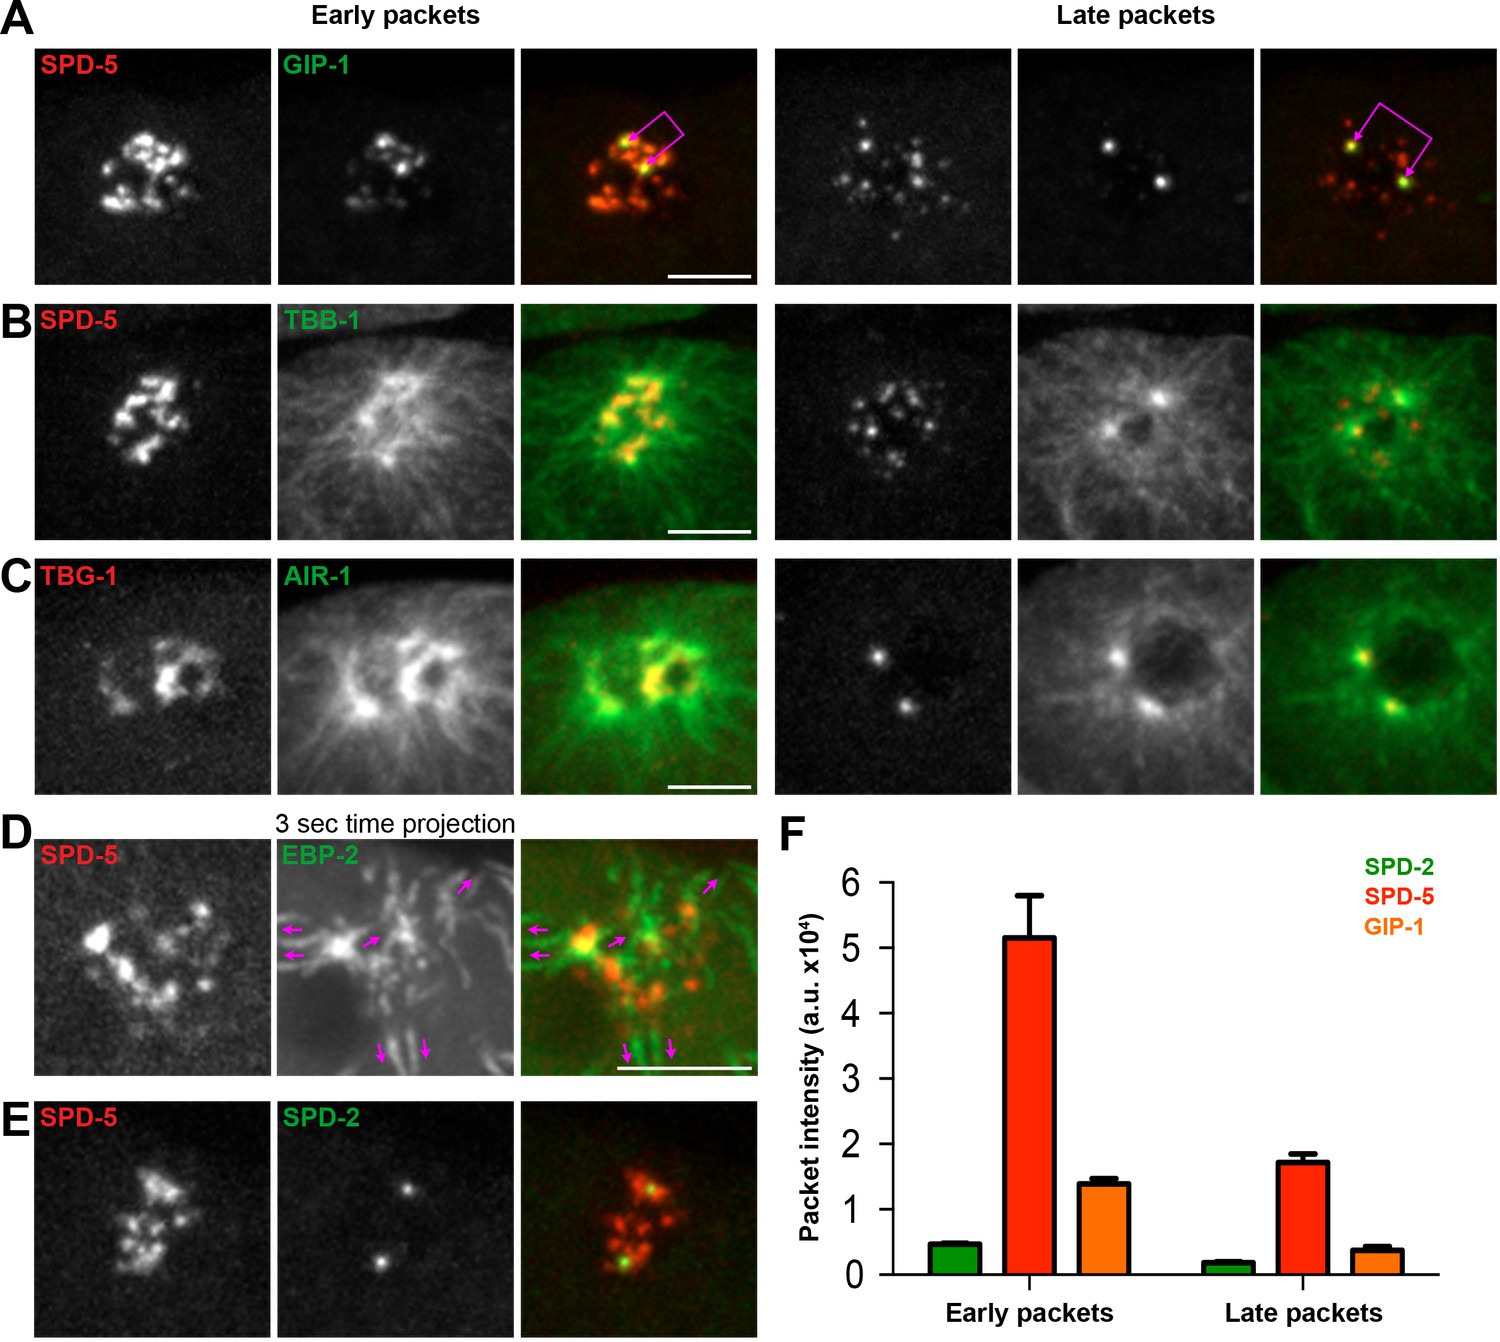
The PCM fragments into SPD-5 and GIP-1 containing packets that localize dynamic microtubules.
(A–C) Analysis of colocalization of SPD-5 packets (red) with GIP-1 (A, green), or microtubules (B, TBA-1/α-tubulin, green), and TBG-1 (red) with AIR-1(C, green) in early packets (left panels) or late packets (right panels). (C) Three second time projection of EBP-2 (green) showing that packets (SPD-5, red) associate with dynamic microtubules. Magenta arrows represent the direction of EBP-2 movement. Scale bar, 10 µm. (D) Colocalization of SPD-5 packets (red) with SPD-2 (green). Note that SPD-2 does not localize to the packets. (E) Average pixel intensity of SPD-2 (green, n = 8), SPD-5 (red, n = 11), and GIP-1 (orange, n = 8) in early and late packets. ‘a.u.’=arbitrary units. Graph represent mean ± s.e.m. Underlying centrioles and corresponding newly forming centrosomes are indicated by magenta joined double arrows.
Figure 3 with 1 supplement

Dissolution of SPD-2 and MZT-1 precedes rupture and packet formation, see also Figure 3—figure supplement 1 and Video 5.
(A–C) Comparison of tagRFP::SPD-5 (red) to SPD-2::GFP (A, green), GFP::MZT-1 (B, green), or GFP::GIP-1 (C, green) disassembly. ‘Dissolution’ (light grey arrow) begins as SPD-2 (t = 2 min. post-NEBD) and then MZT (t = 3 min post-NEBD) are removed from the centrosome. ‘Rupture’ (medium grey arrow) is indicated by holes appearing in the matrix of SPD-5 and GIP-1 surrounding the centrioles, followed by the appearance of individual ‘packets’ (white arrowheads) of SPD-5 and GIP-1. Scale bar, 10 µm. (D–E) Average pixel intensity (D) and volume (E) at the centrosome of PCM proteins during disassembly starting at NEBD (t = 0 min): tagRFP::SPD-5 (red, n = 11), GFP::GIP-1 (orange, n = 9), GFP::MZT-1 (blue, n = 10), SPD-2::GFP (green, n = 8). ‘a.u.’=arbitrary units. Graph lines indicate mean ± s.e.m.
Figure 3—figure supplement 1
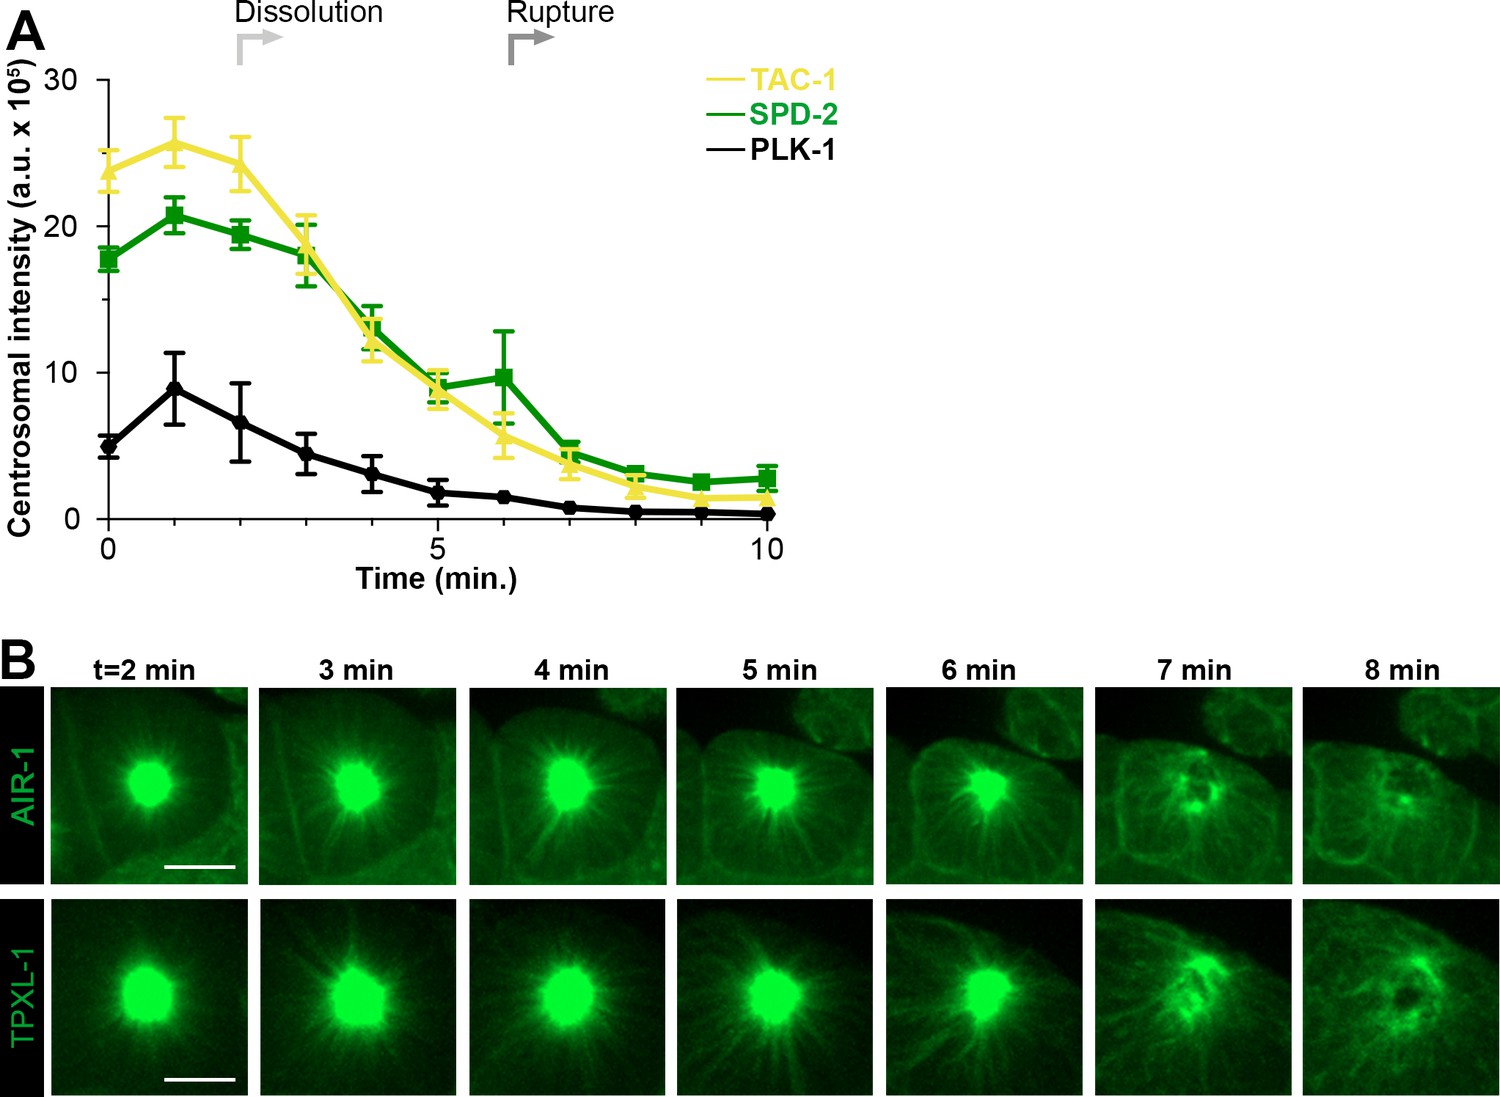
Dynamics of PLK-1, TAC-1, AIR-1 and TPXL-1 during disassembly.
(A) Average pixel intensity at the centrosome of PCM proteins during disassembly starting at NEBD (t = 0 min): SPD-2::GFP (green, n = 11), GFP::TAC-1 (yellow, n = 7) and PLK-1::GFP (black, n = 7). ‘a.u.’=arbitrary units. Graph lines indicate mean ± s.e.m. (B) Time-lapse analysis of the disassembly of AIR-1 and TPXL-1 starting at NEBD (t = 0 min) and imaged every minute for 8 min. Image LUTs were scaled to the last timepoint (8 min) to highlight the spread of each protein onto microtubules. Scale bar, 10 µm.
Figure 4 with 2 supplements

Cortical forces rupture the PCM into packets, see also Figure 4—figure supplement 1 and Figure 4—figure supplement 2.
(A) Time-lapse analysis starting at NEBD (t = 0 min) of the disassembly of endogenous tagRFP::SPD-5 (red) and SPD-2::GFP (green) treated with lacZ(RNAi) (control, top panels, grey (A–E)), gpr-1/2(RNAi) (middle panels, blue (A–E)), or csnk-1(RNAi) (bottom panels, purple (A–E)). Scale bar, 10 µm. (B–C) Average volume at the centrosome of SPD-5 (B) or SPD-2 (C) during disassembly starting at NEBD (t = 0 min). (D) Average onset time for centriole separation starting at NEBD (t = 0 min). Stage 1: Centrioles are apparent as a single focus and then double foci of GFP::SAS-4. Stage 2: Centrioles appear >1 µm apart. control, Stage 1: 5.00 ± 0.218 min; control, stage 2: 6.429 ± 0.202 min, n = 8; gpr-1/2(RNAi), Stage 1: 9.091 ± 0.977 min, gpr-1/2(RNAi), Stage 2: 12.100 ± 0.706 min, n = 11; csnk-1(RNAi), Stage 1: 4.714 ± 0.286 min, csnk-1(RNAi), Stage 2: 5.714 ± 0.421 min, n = 7. (E) Average intensity of SPD-2 or SPD-5 remaining at the centrosome before regrowth in the next cell cycle. SPD-2(control): 1281 ± 139, SPD-5(control): 1337 ± 47, n = 8; SPD-2(gpr-1/2(RNAi)): 1610 ± 166, SPD-5(gpr-1/2(RNAi)): 3173 ± 369, n = 11; SPD-2(csnk-1(RNAi)): 1467 ± 122, SPD-5(csnk-1(RNAi)): 1172 ± 110, n = 7. Asterisks indicate comparison between indicated perturbation and control: *p-value<0.01, ** p-value<0.001, *** p-value<0.0001. ‘a.u.’=arbitrary units. Graphs indicate mean ± s.e.m.
Figure 4—figure supplement 1
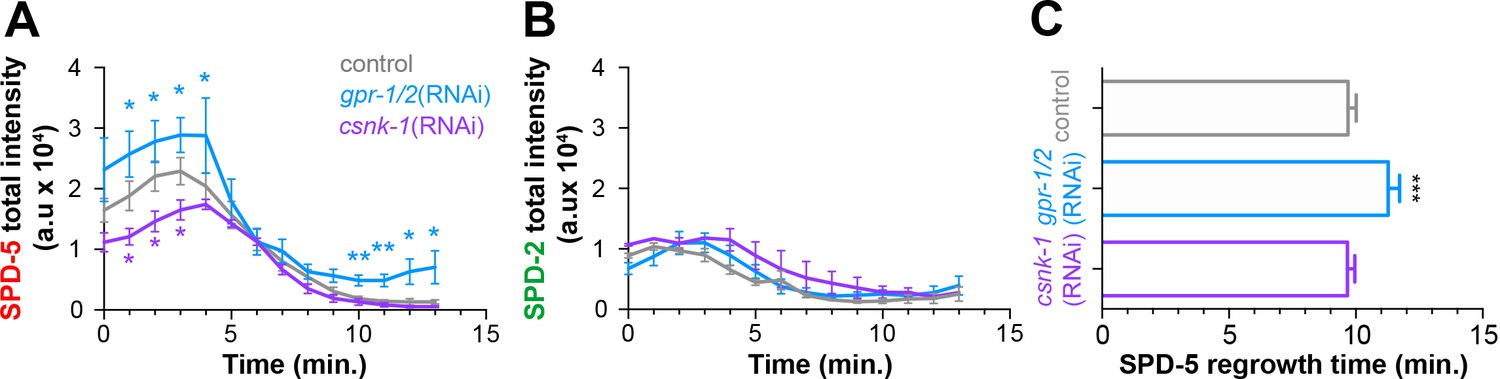
Cortical forces regulate SPD-5, but not SPD-2, intensity and regrowth in the next cell cycle.
Total SPD-5 (A) or SPD-2 (B) intensity at the centrosome during disassembly starting at NEBD (t = 0 min) in embryos treated with lacZ(RNAi) (control, grey), gpr-1/2(RNAi) (blue), or csnk-1(RNAi) (purple). *p-value, gpr-1/2(RNAi) or csnk-1(RNAi) vs. control <0.05. ** p-value, gpr-1/2(RNAi) or csnk-1(RNAi) vs. control <0.01. (C) Average time after NEBD before regrowth of SPD-5 at the centrosome in the next cell cycle. Control: 9.69 ± 0.33, n = 8; gpr-1/2(RNAi): 11.27 ± 0.45, n = 11; csnk-1(RNAi): 9.67 ± 0.29, n = 7. ***p-value, control or csnk-1(RNAi) vs. gpr-1/2(RNAi),<0.0001. ‘a.u.’=arbitrary units. Error bars indicate standard deviation of the mean.
Figure 4—figure supplement 2
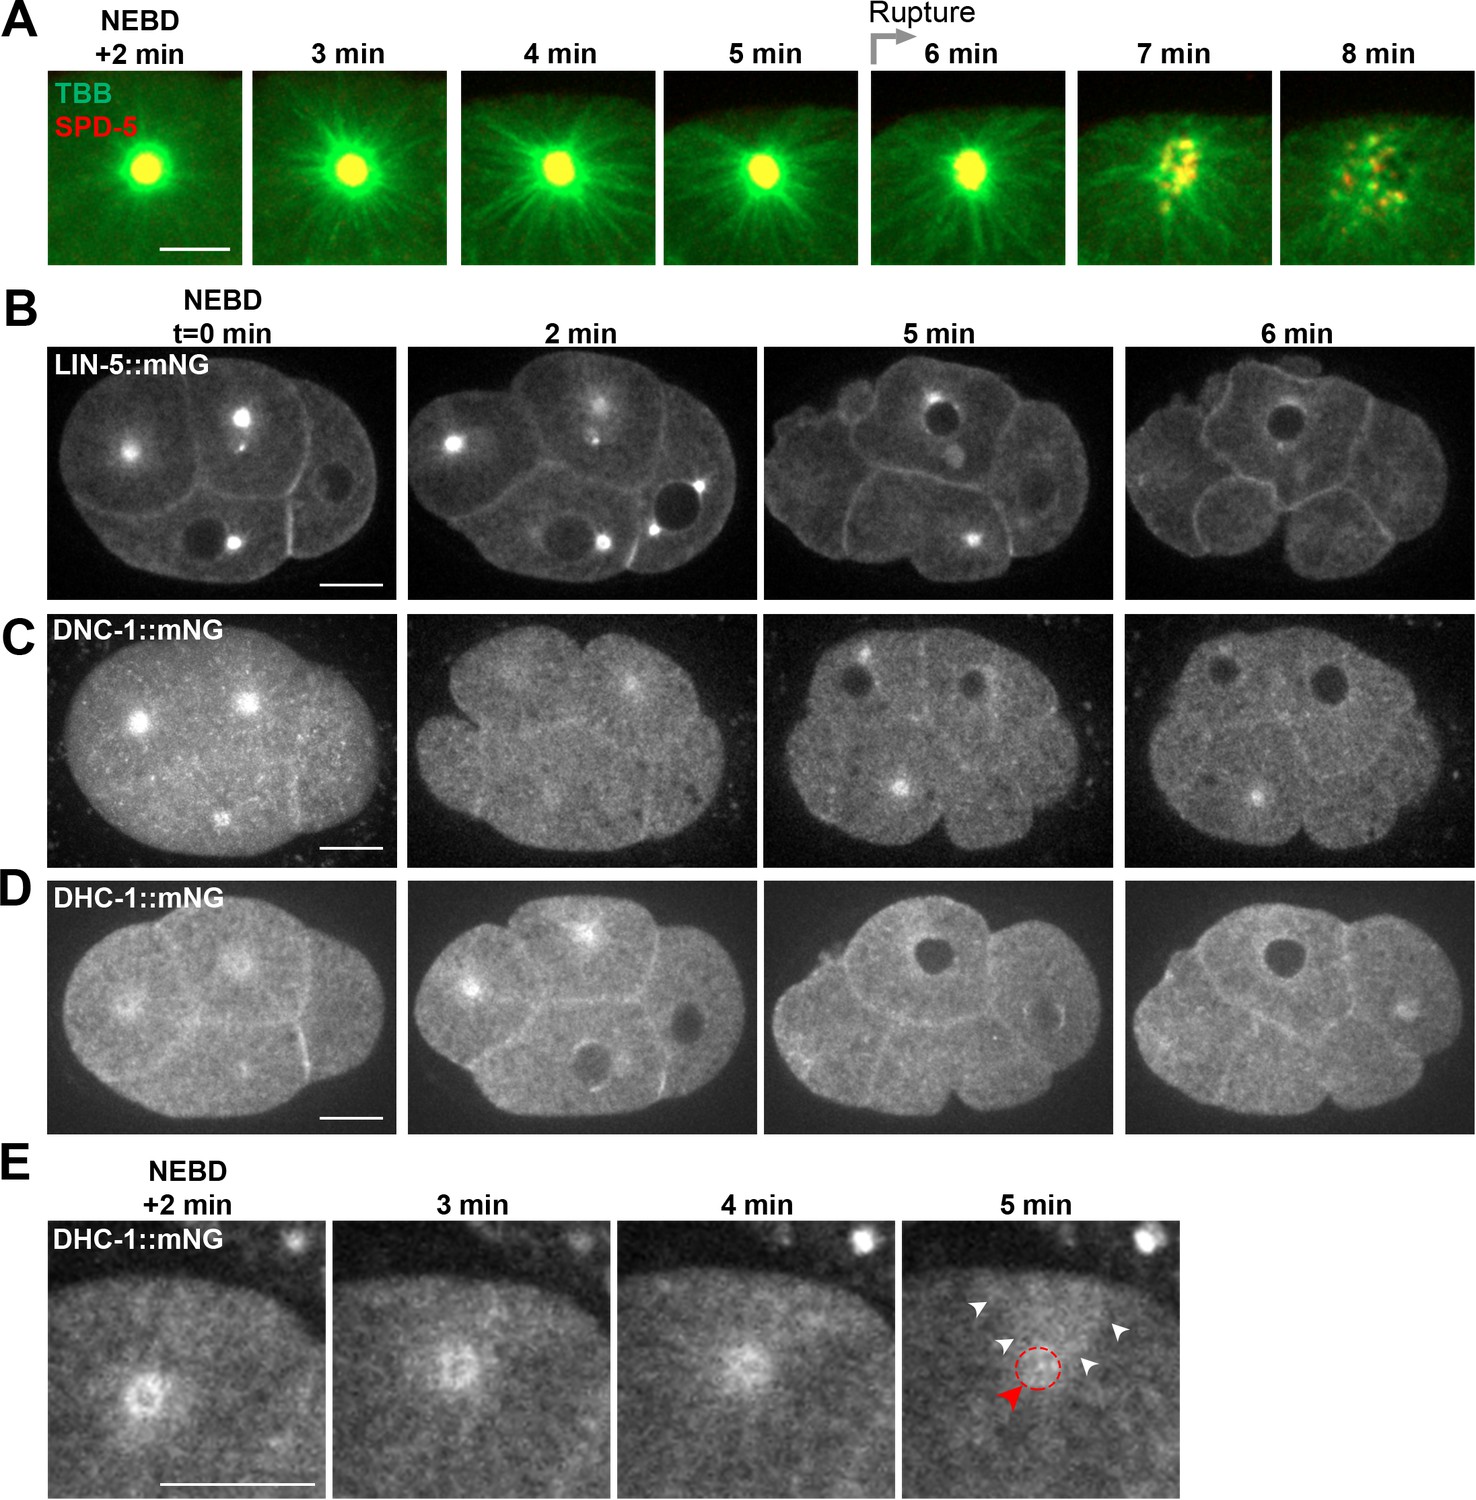
Localization of astral microtubules and cortical force generating proteins during PCM disassembly.
Time lapse analysis from embryos expressing pie-1::TBB-2/ß-tubulin::GFP and endogenous tagRFP::SPD-5 (A), LIN-5::mNG (B), DNC-1::mNG (C), or DHC-1::mNG (D, E). Times relative to nuclear envelope breakdown (NEBD) as indicated. (A) and (E) show magnifications of the ABp centrosome and (B–E) show single plane images. (E) Movement of DHC-1 (white arrowheads) from the centrosome (red arrow and dotted circle) toward the dorsal membrane is apparent. Scale bars, 10 µm.
Figure 5
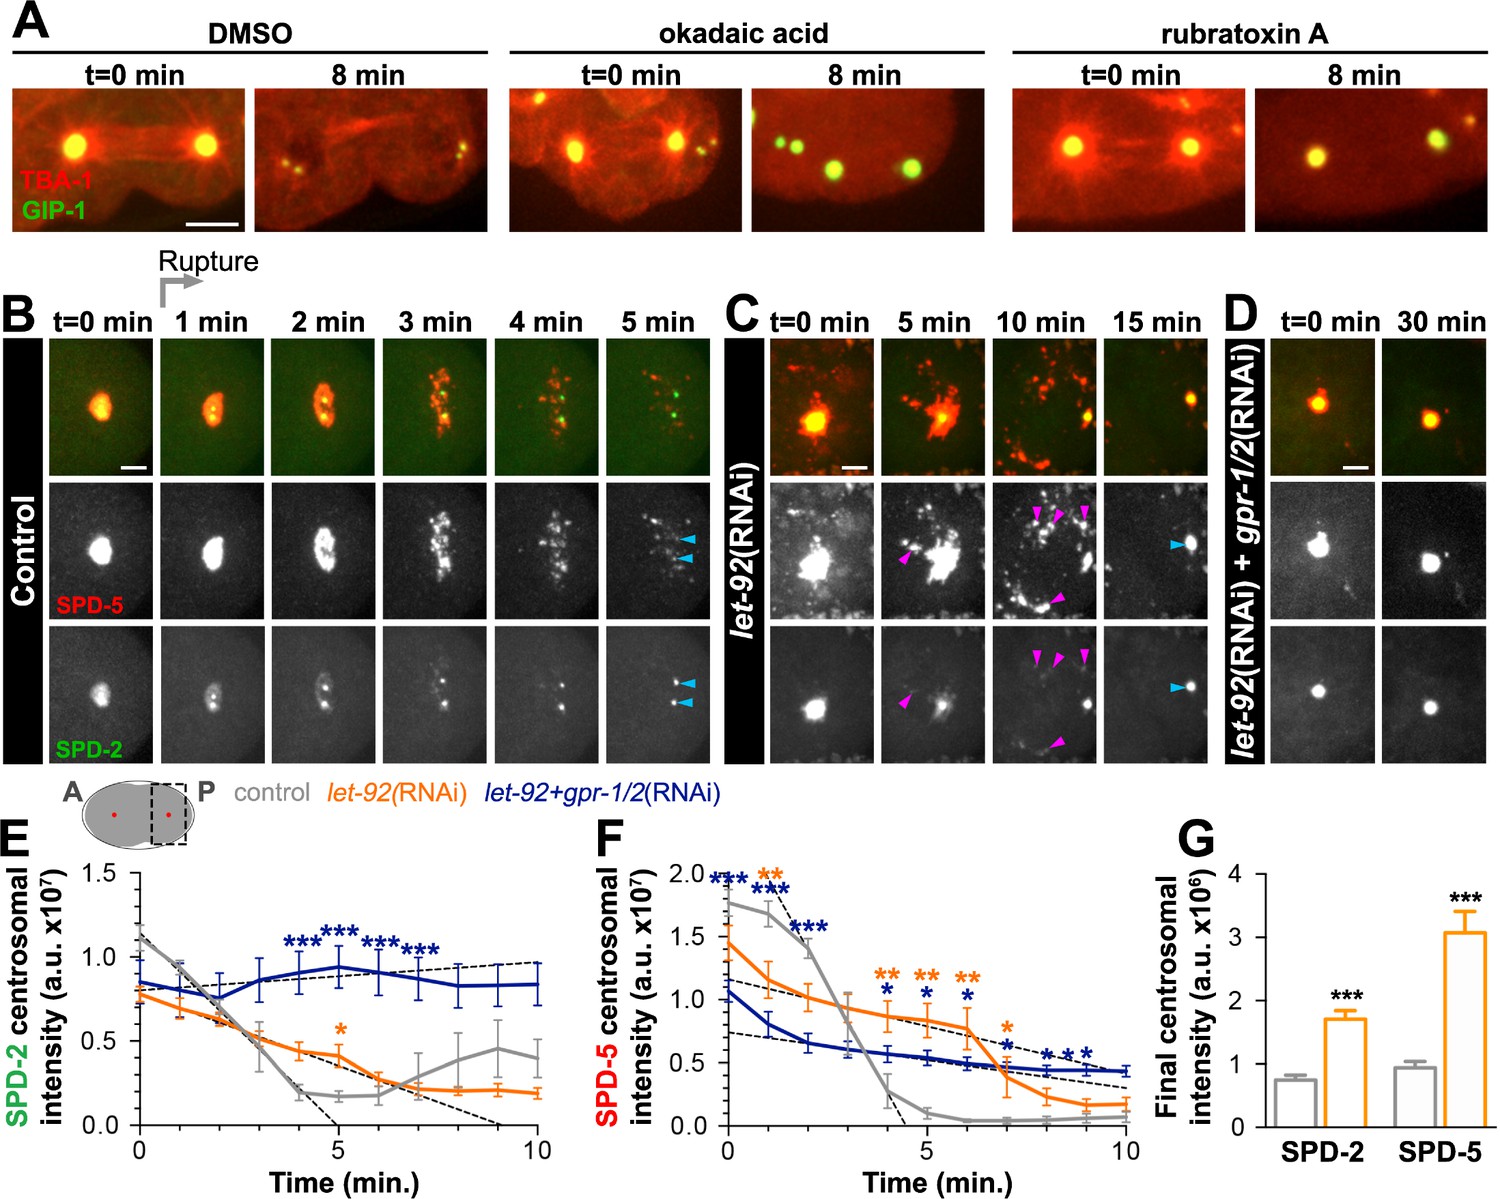
PP2A phosphatases regulate PCM disassembly.
(A) Time-lapse analysis of embryos expressing pie-1p::mCherry::TBA-1/α-tubulin (red) and endogenous GFP::GIP-1 (green) and treated at anaphase (t = 0 min) with DMSO (left panels), 30 µM okadaic acid (middle panels), or 60 µM rubratoxin A (right panels). Scale bar, 10 µm. (B–D) Time-lapse analysis of the disassembly of endogenous tagRFP::SPD-5 (red); SPD-2::GFP (green) starting from cytokinetic furrow ingression (t = 0 min) in the one cell embryo as represented on the cartoon below. Timing of rupture (light gray arrow) at this stage is indicated. Images show posterior (P) embryonic region (black dotted box in cartoon) containing the posterior centrosome (red dot in cartoon). Embryos are treated with lacZ(RNAi) (control, (B), let-92(RNAi) (C), or let-92(RNAi) +gpr-1/2(RNAi) (D). Note the appearance of SPD-2 in packets (C, magenta arrowheads) following let-92 RNAi treatment. Scale bars, 10 µm. (E–F) SPD-2 (E) or SPD-5 (F) intensity at the centrosome during disassembly starting from cytokinetic furrow ingression (t = 0 min) in embryos treated with lacZ(RNAi) (control, grey, n = 8), let-92(RNAi) (orange, n = 8), or let-92 +gpr-1/2(RNAi) (navy, n = 8). SPD-2 disassembly slope (E, 0 to 4 min, black dotted lines): control (slope = −2.31e+6, r2 = 0.97), let-92(RNAi) (slope = −8.60e+5, r2 = 0.94) and let-92 +gpr-1/2(RNAi) (slope = 1.67e+5, r2 = 0.86). SPD-5 disassembly slope (F, 2 to 4 min, black dotted lines): control (slope = −5.65e+6, r2 = 0.95), let-92(RNAi) (slope = −7.46e+5, r2 = 0.92) and let-92 +gpr-1/2(RNAi) (slope = −4.40e+5, r2 = 0.91). Slopes are significantly different from each other (t-test, p-value<0.0001). (G) Average centrosomal pixel intensity at the end of disassembly in control (t = 5’, grey, n = 15) and in let-92(RNAi) treated embryos (t = 15’, orange, n = 13). Note that we accounted for centriole duplication defects following let-92 depletion by comparing the average intensity of each individual centriole/centrosome in control embryos (see two SPD-2 foci representing two individual centrioles/centrosomes, light blue arrowheads at t = 5’ in Figure 5B) to intensity of the single centrosome in let-92 depleted embryos (single SPD-2 focus, light blue arrowhead at t = 15’ in Figure 5C; see Material and methods). Asterisks indicate comparison between indicated perturbation and control: *p-value<0.01, ** p-value<0.001, *** p-value<0.0001. ‘a.u.’=arbitrary units. Graphs indicate mean ± s.e.m.
Figure 6 with 1 supplement
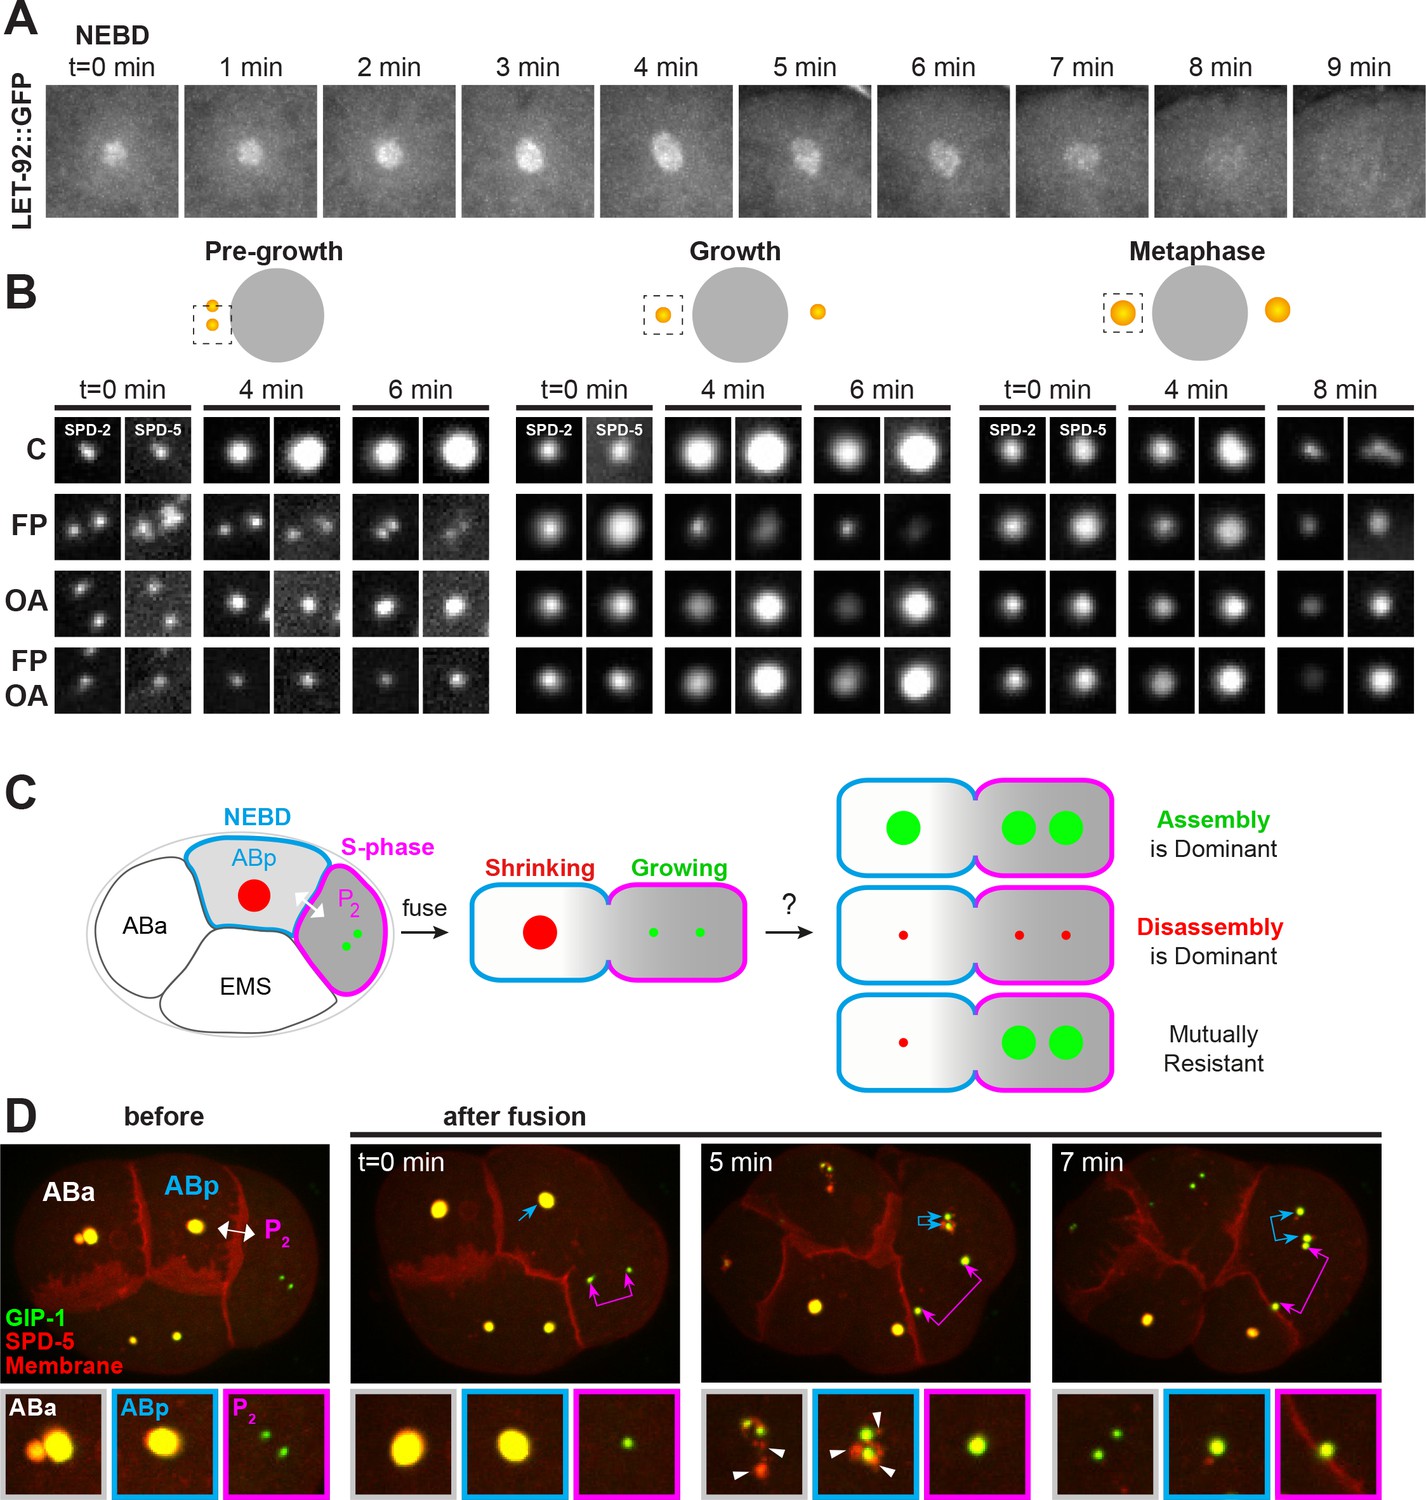
Kinases and phosphatases shape the PCM throughout mitosis, see also Figure 6—figure supplement 1.
(A) Time-lapse analysis of the disassembly of endogenous LET-92 starting at NEBD (t = 0 min) and imaged every minute for 9 min. (B) Time-lapse analysis of embryos expressing endogenous tagRFP-T::SPD-5 (red) and SPD-2::GFP (green) and treated at pre-growth (t = 0 min, left panels), growth (t = 0 min, middle panels) or metaphase (t = 0 min, right panels) with DMSO (‘C’, first row), 200 µM flavopiridol (‘FP’, second row), 30 µM okadaic acid (‘OA’, third row), or flavopiridol and okadaic acid (‘FP, OA’, fourth row). (C) Cartoon showing possible outcomes from the cell fusion experiment of a post-NEBD mitotic embryonic cell (ABp, blue) with decreasing levels of kinases (grey) and a S-phase embryonic cell, (P2, magenta) with high levels of kinases. Assembling (green) or disassembling (red) centrosomes are depicted. (D) Time-lapse analysis of the ABp – P2 fusion experiment in embryos expressing endogenous tagRFP-T::SPD-5 (red) and GFP::GIP-1 (green) and overexpressing PLC∂::mCherry (red). Fusion site is marked by the double-headed white arrow. Top images show the entire embryo and bottom images show a magnification of the control Aba centrosome (white), the disassembling ABp centrosome (blue), and the assembling P2 centrosome (magenta). Packets are marked with white arrowheads.
Figure 6—figure supplement 1
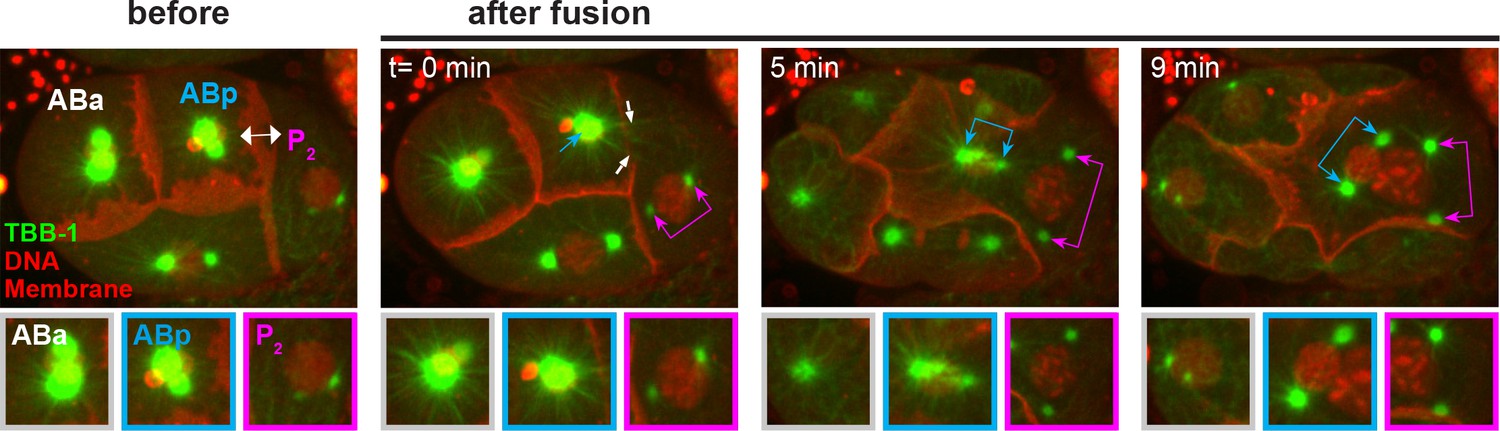
Microtubule behavior following cell fusion.
(A) Time-lapse analysis of an ABp – P2 fusion experiment in embryos expressing pie-1::TBB-2/ß-tubulin::GFP (green), histone::mCherry (red) and PLC∂::mCherry (red). Fusion site is marked by the double-sided white arrow. Top images show the entire embryo and bottom images shows a magnification of the control ABa centrosome (white), the disassembling ABp centrosome (blue) and the assembling P2 centrosome (magenta). White arrows indicate a subset of the ABp microtubules invading into P2.
Figure 7
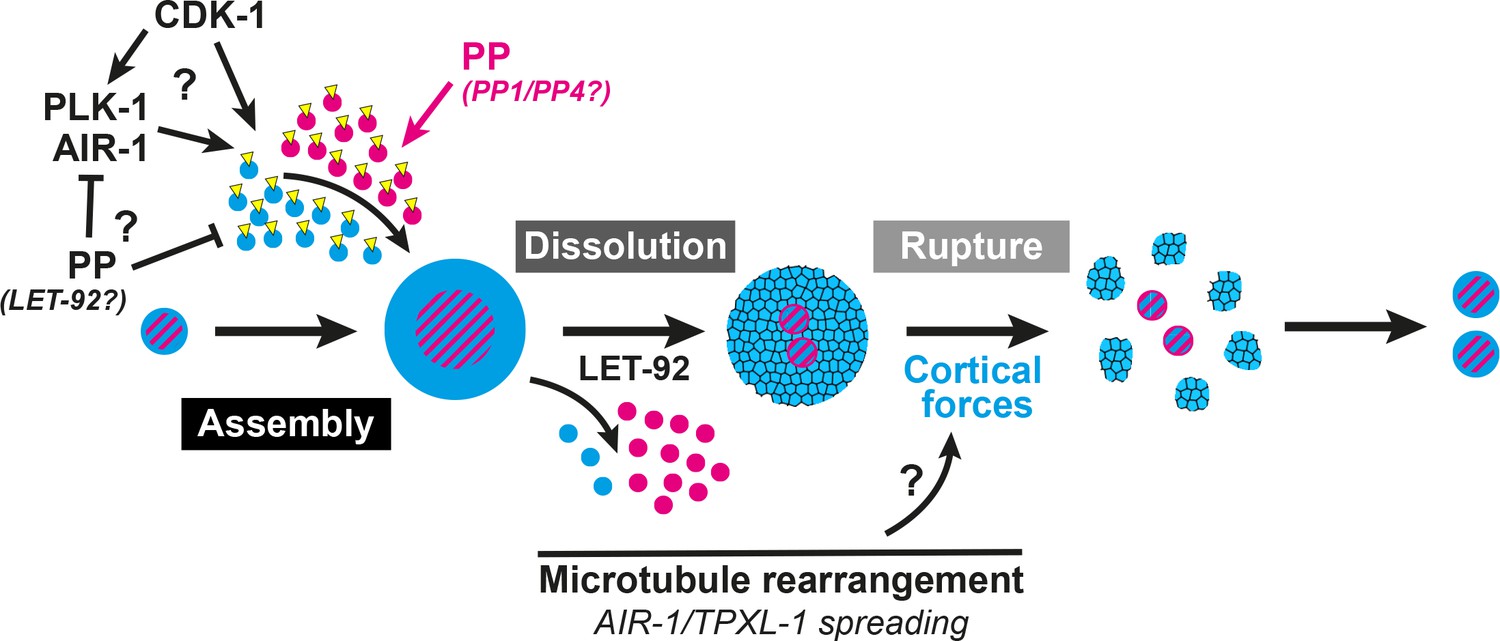
A two-step model of PCM disassembly.
The centrosome is assembled through the activity of mitotic kinases that phosphorylate PCM proteins to be incorporated into an inner (magenta) and outer (blue) sphere. Phosphatases oppose this process, hypothetically by inactivating kinases and/or directly dephosphorylating PCM proteins thereby promoting their disassembly. As kinase activity is naturally attenuated in the cell cycle, phosphatase/LET-92 activity dominates, resulting in PCM dissolution. Microtubules lengthen and more readily contact the cortex with TPXL-1/AIR-1 spreading along those microtubules. This rearrangement could be a key aspect in the regulation of cortical forces that ultimately rupture an aging outer sphere of PCM proteins (blue and black lattice) into packets.
Videos
Video 1
Centrosome disassembly in the ABp cell in a 4-cell embryo expressing endogenous SPD-2::GFP.
Scale bar, 5 µm.
Video 2
Centrosome disassembly in the ABp cell in a 4-cell embryo expressing endogenous GFP::MZT-1.
Scale bar, 5 µm.
Video 3
Centrosome disassembly in the ABp cell in a 4-cell embryo expressing endogenous GFP::SPD-5.
Yellow arrowhead and ‘c’ mark the centrioles. White arrowhead and ‘p’ mark the packets. Scale bar, 5 µm.
Video 4
Centrosome disassembly in the ABp cell in a 4-cell embryo expressing endogenous GFP::GIP-1.
Yellow arrowhead and ‘c’ mark the centrioles. White arrowhead and ‘p’ mark the packets. Scale bars, 5 µm.
Video 5
Centrosome disassembly in the ABp cell in a 4-cell embryo expressing endogenous tagRFP-T::SPD-5; GFP::GIP-1.
Yellow arrowhead and ‘c’ mark the centrioles. White arrowhead and ‘p’ mark the packets. Scale bars, 5 µm.
Additional files
-
Transparent reporting form
- https://doi.org/10.7554/eLife.47867.021
Download links
A two-part list of links to download the article, or parts of the article, in various formats.
Downloads (link to download the article as PDF)
Open citations (links to open the citations from this article in various online reference manager services)
Cite this article (links to download the citations from this article in formats compatible with various reference manager tools)
A two-step mechanism for the inactivation of microtubule organizing center function at the centrosome
eLife 8:e47867.
https://doi.org/10.7554/eLife.47867


