Epimutations are associated with CHROMOMETHYLASE 3-induced de novo DNA methylation
- University of Georgia, United States
- Technical University of Munich, Germany
Figures
Figure 1 with 5 supplements
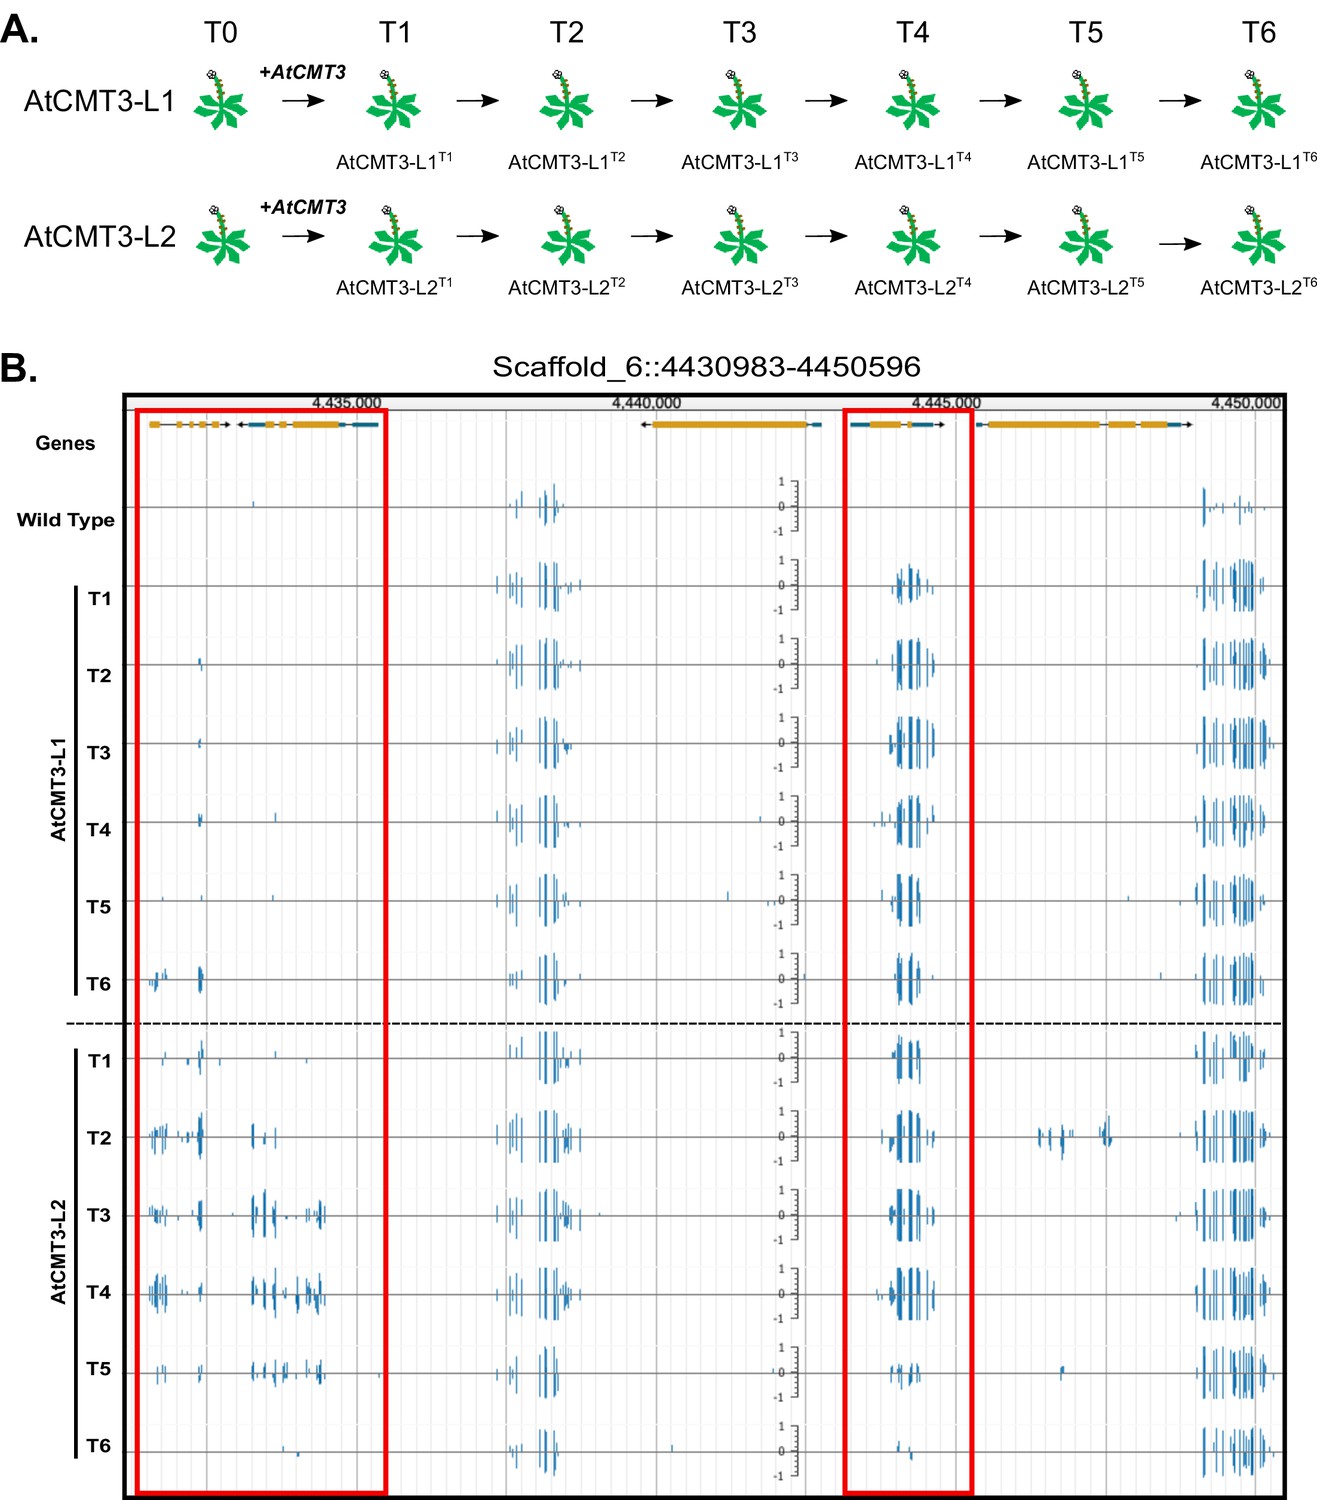
Expression of AtCMT3 in E.salsugineum results in increased CHG methylation.
(A) Schematic of the experiment. Two E. salsugineum lines derived from transformations with genomic A. thaliana CMT3 were propagated by single seed decent for six generations (T1–T6). The two lines are referred to as AtCMT3-L1 and AtCMT3-L2, followed by the generation (T1–T6). For additional lines analyzed in this study see Figure 1—figure supplement 1 and Supplementary file 1. (B) Genome browser view of CHG methylation levels derived from whole genome bisulfite sequencing. The image illustrates the gains in CHG methylation that occur in regions that are methylated in wild type, as well as over gene bodies with no pre-existing DNA methylation (boxed in red). Scales on tracks designate the weighted percent methylation, with 1 = 100% on the top strand and −1 = 100% on the bottom strand. Only CHG methylation is shown. For methylation in all contexts see Figure 1—figure supplement 2.
Figure 1—figure supplement 1
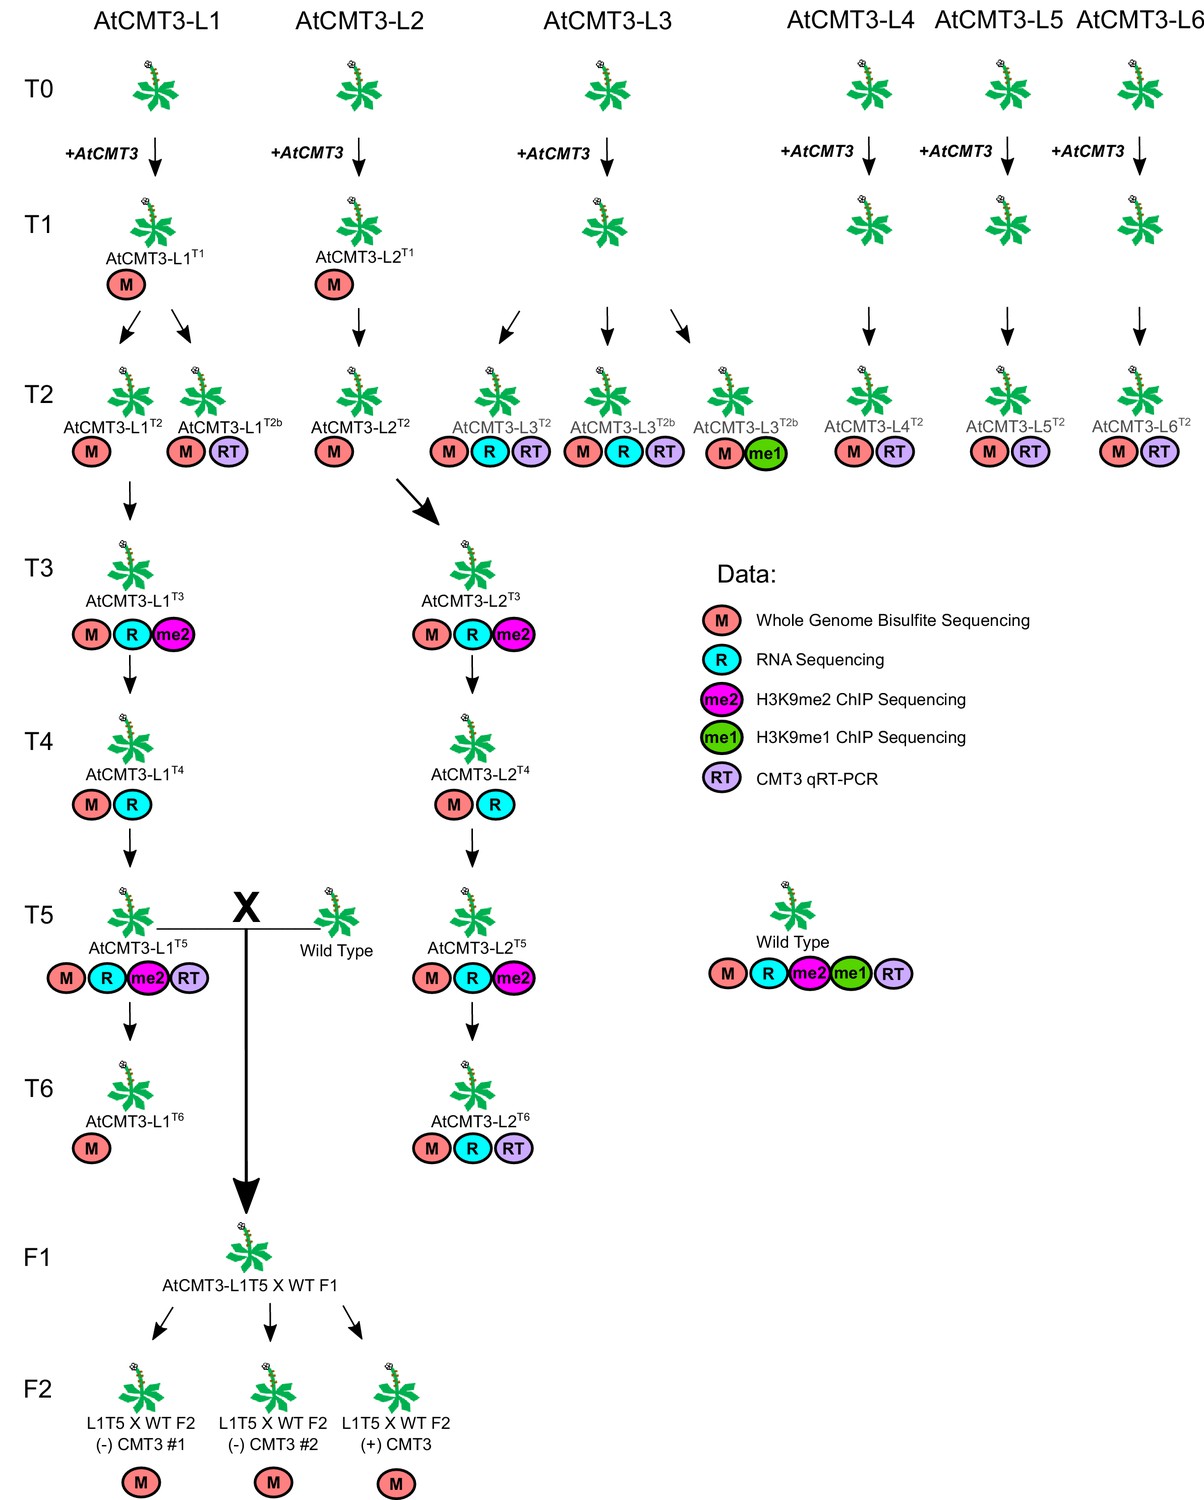
Diagram of all experimental E. salsugineum lines analyzed in this study with associated data collected.
https://doi.org/10.7554/eLife.47891.003
Figure 1—figure supplement 2
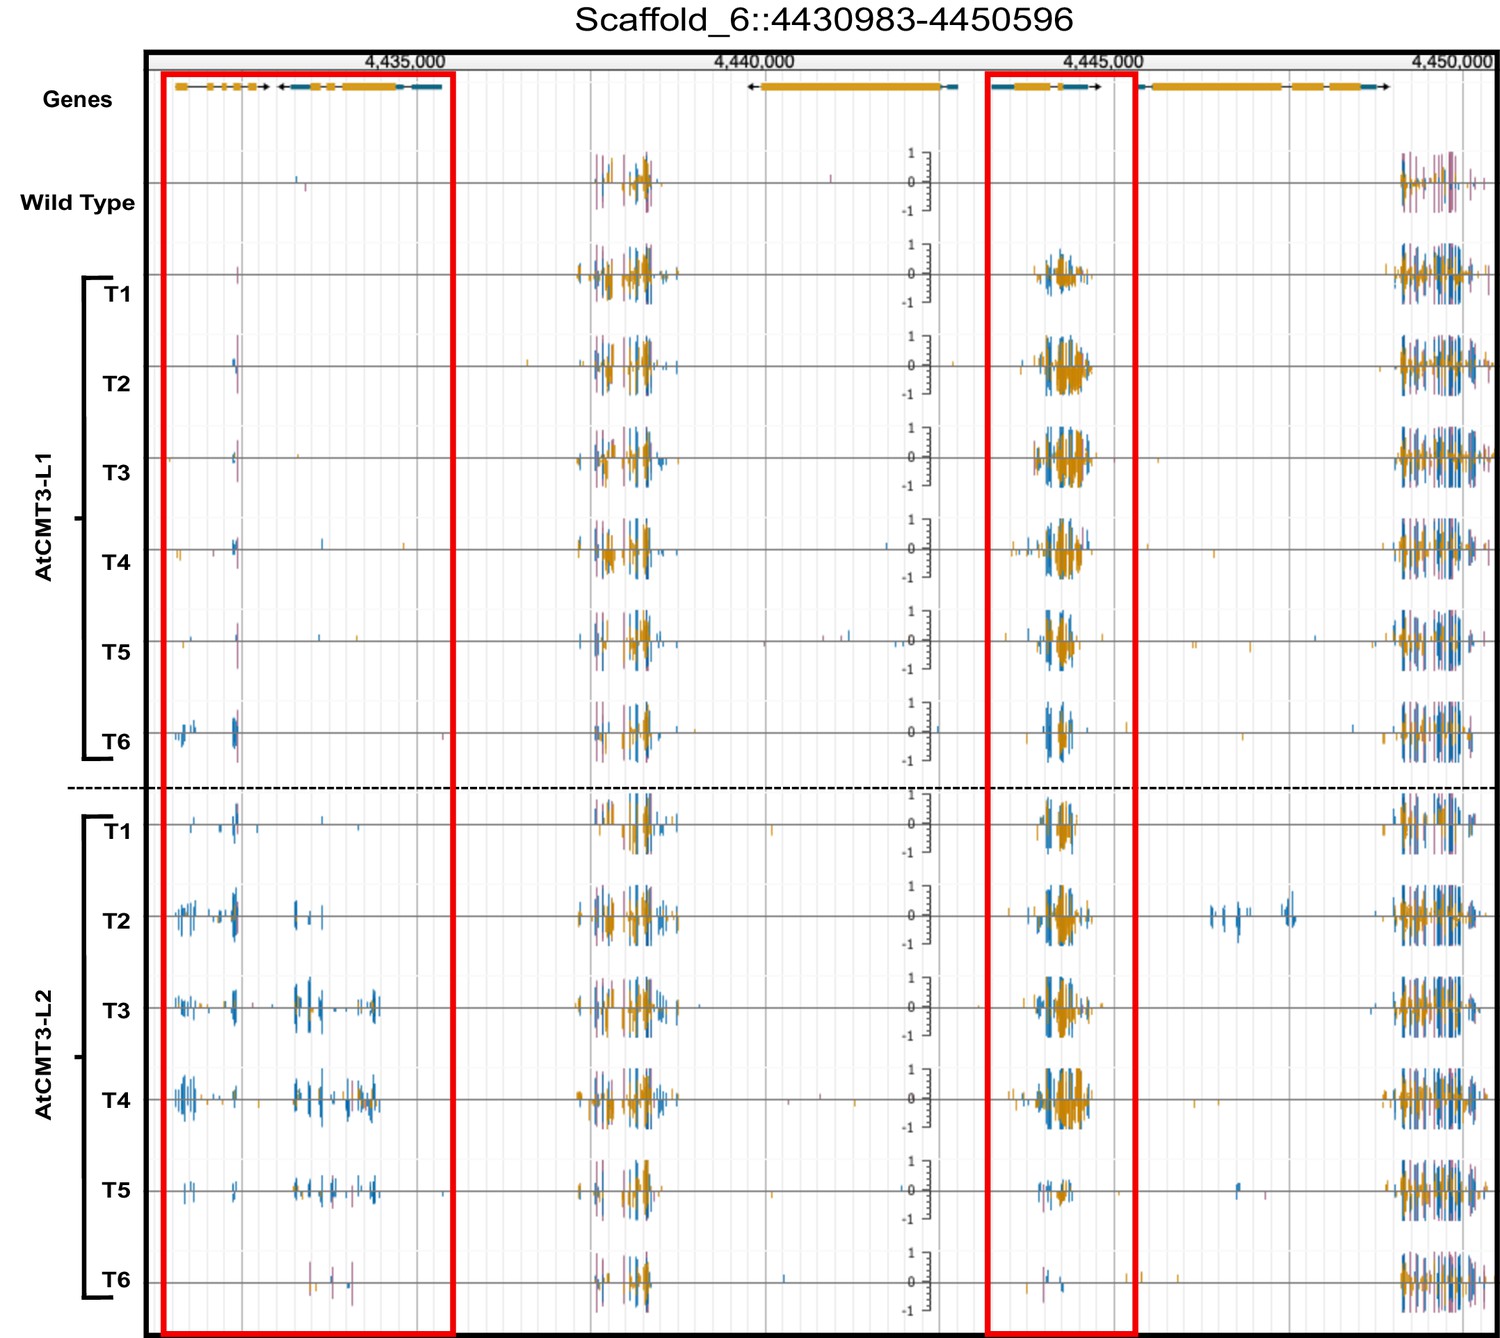
CHG methylation increases in AtCMT3-expressing E. salsugineum lines.
(A) Genome browser view of CHG methylation levels derived from whole genome bisulfite sequencing. The image illustrates the gains in CHG methylation that occur in regions that are methylated in wild type, as well as over gene bodies with no pre-existing DNA methylation (boxed in red). Scales on tracks designate the weighted percent methylation, with 1 = 100% on the top strand and −1 = 100% on the bottom strand. Cytosine methylation is divided into CG (red), CHG (blue), and CHH (yellow) sequence contexts. Corresponds to the region shown in Figure 1B.
Figure 1—figure supplement 3

CG, CHG, and CHH DMRs co-localize.
(A–L) Upset plots showing the number and overlap between hyper DMRs identified for each sequence context, CG, CHG, and CHH, within each generation of each lineage, AtCMT3-L1 and AtCMT3-L2: (A) AtCMT3-L1T1; (B) AtCMT3-L1T2; (C) AtCMT3-L1T3; (D) AtCMT3-L1T4; (E) AtCMT3-L1T5; (F) AtCMT3-L1T6; (G) AtCMT3-L1T1; (H) AtCMT3-L2T2; (I) AtCMT3-L2T3; (J) AtCMT3-L2T4; (K) AtCMT3-L2T5; (L) AtCMT3-L2T6.
Figure 1—figure supplement 4
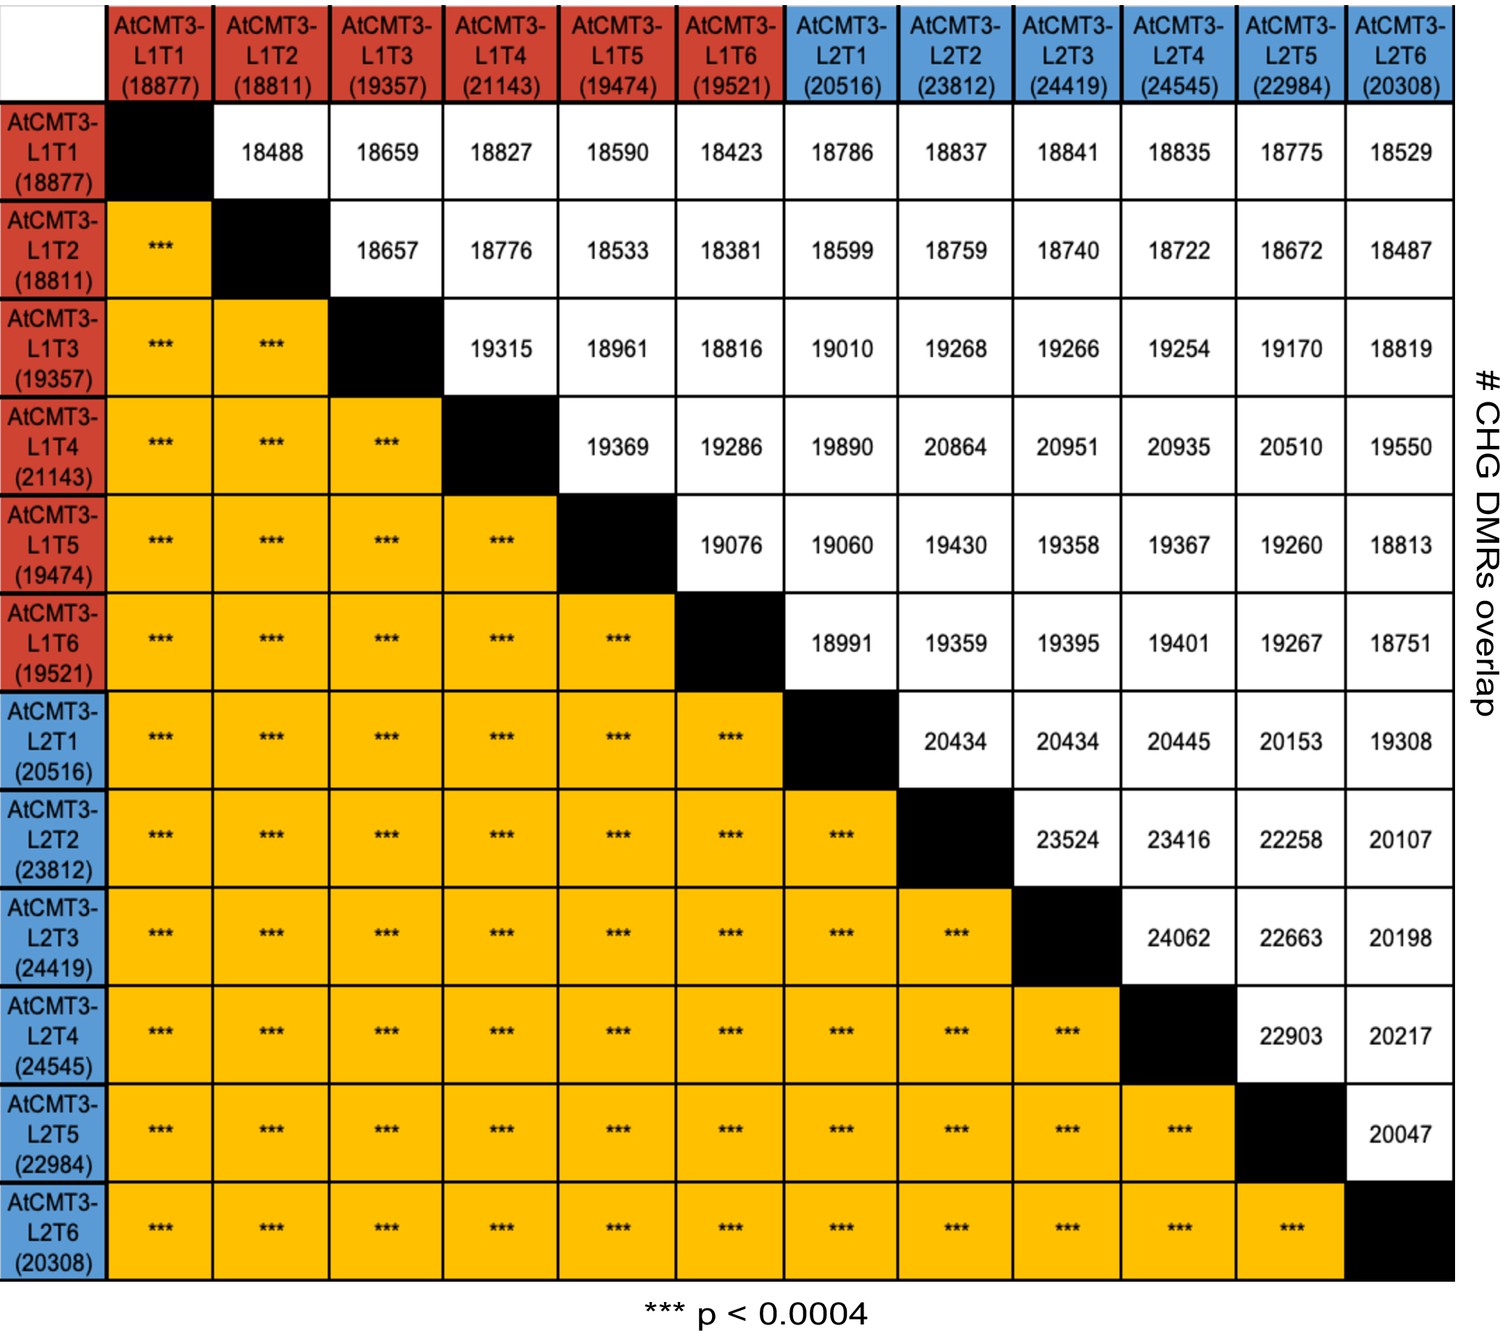
AtCMT3 expression results in gains in CHG methylation over similar regions between lineages and across generations.
Matrix showing the number and overlap between hyper-CHG DMRs identified in each individual in AtCMT3-L1 and AtCMT3-L2. The top half of the matrix shows the number of overlapping DMRs and the bottom half shows the p-value calculated based on fisher’s exact test (***p significant <0.0004, Bonferroni correction). See also Figure 2A and Supplementary file 3.
Figure 1—figure supplement 5

Genome wide percent CHG methylation is correlated with AtCMT3 transgene expression levels.
AtCMT3 expression was determined by RNA-seq (first panel) or qRT-PCR (second panel). For qRT-PCR AtCMT3 expression was normalized to TUB4 expression (Thhalv10003210m). See also Supplementary file 4.
Figure 2 with 2 supplements
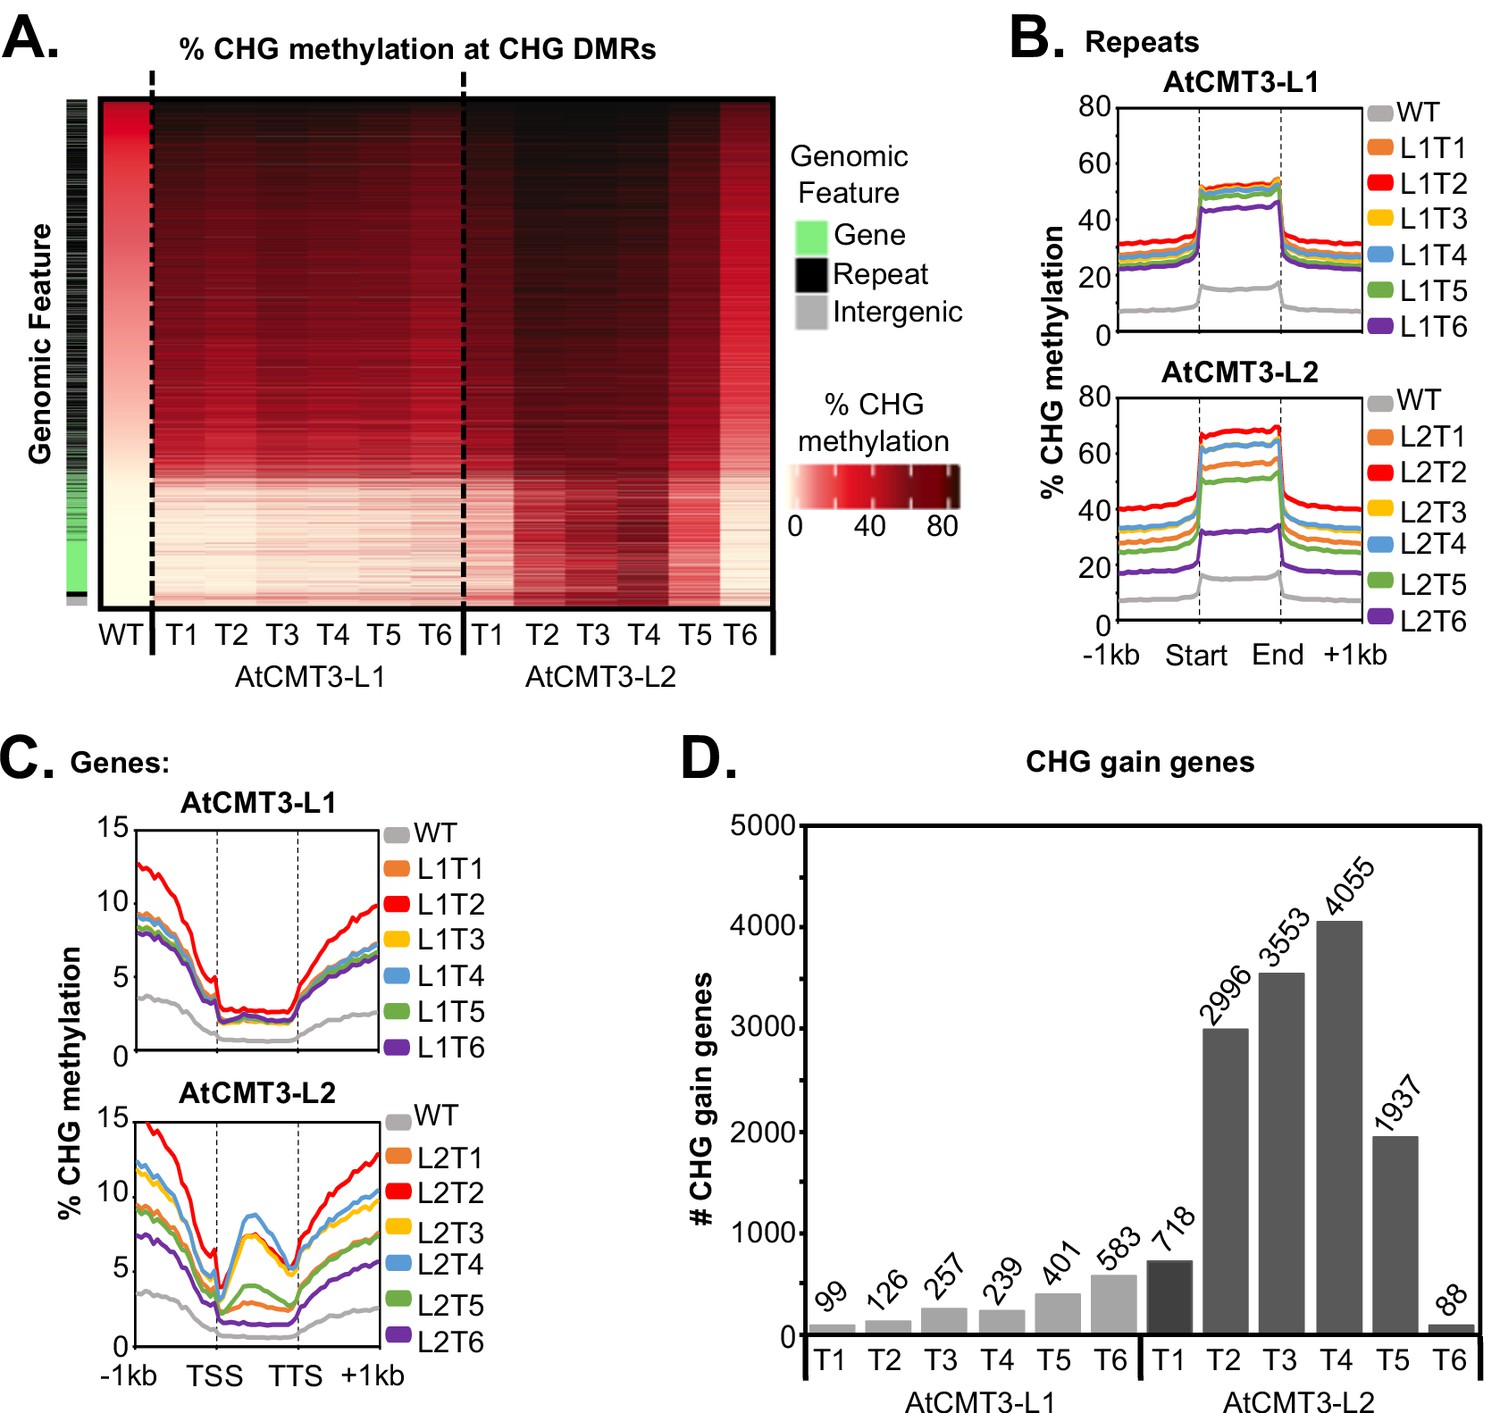
AtCMT3 expression results in CHG methylation over repeats and a subset of gene bodies.
(A) Heatmap of % CHG methylation over hyper-CHG differentially methylated regions (DMRs) defined by comparing all AtCMT3-L1 and L2 generations (T1–T6) to wild type. DMRs are ranked by % CHG methylation levels in wild type plants showing that the majority of gains in CHG methylation occurred over regions with pre-existing CHG methylation classified as repeats or intergenic regions. A subset of regions with no pre-existing CHG methylation, mainly classified as genes, also showed gains in CHG methylation, especially in AtCMT3-L2 individuals. See also Supplementary file 2 and Supplementary file 3. (B) Metaplot summarizing % CHG methylation over repetitive sequences for each Line. (C) Metaplot summarizing % CHG methylation over gene bodies for each Line. (D) The number of genes gaining a minimum of 5% CHG methylation (CHG-gain genes) in each lineage. See Supplementary file 5 for lists of CHG-gain genes.
Figure 2—figure supplement 1

AtCMT3 expression results in gains in CHG methylation over similar genes between lineages and across generations.
Matrix showing the number and overlap between genes gaining a minimum of 5% CHG methylation identified in each individual in AtCMT3-L1 and AtCMT3-L2. The top half of the matrix shows the number of overlapping genes and the bottom half shows the p-value calculated based on a hypergeometric test (***p significant <0.0004, Bonferroni correction). See also Figure 2D and Supplementary file 5.
Figure 2—figure supplement 2

The number of genes gaining a minimum of 5% CHG methylation (CHG-gain genes) is correlated with AtCMT3 transgene expression levels.
AtCMT3 expression was determined by RNA-seq (first panel) or qRT-PCR (second panel). For qRT-PCR AtCMT3 expression was normalized to TUB4 expression (Thhalv10003210m). See also Figure 2D and Supplementary file 4.
Figure 3 with 2 supplements

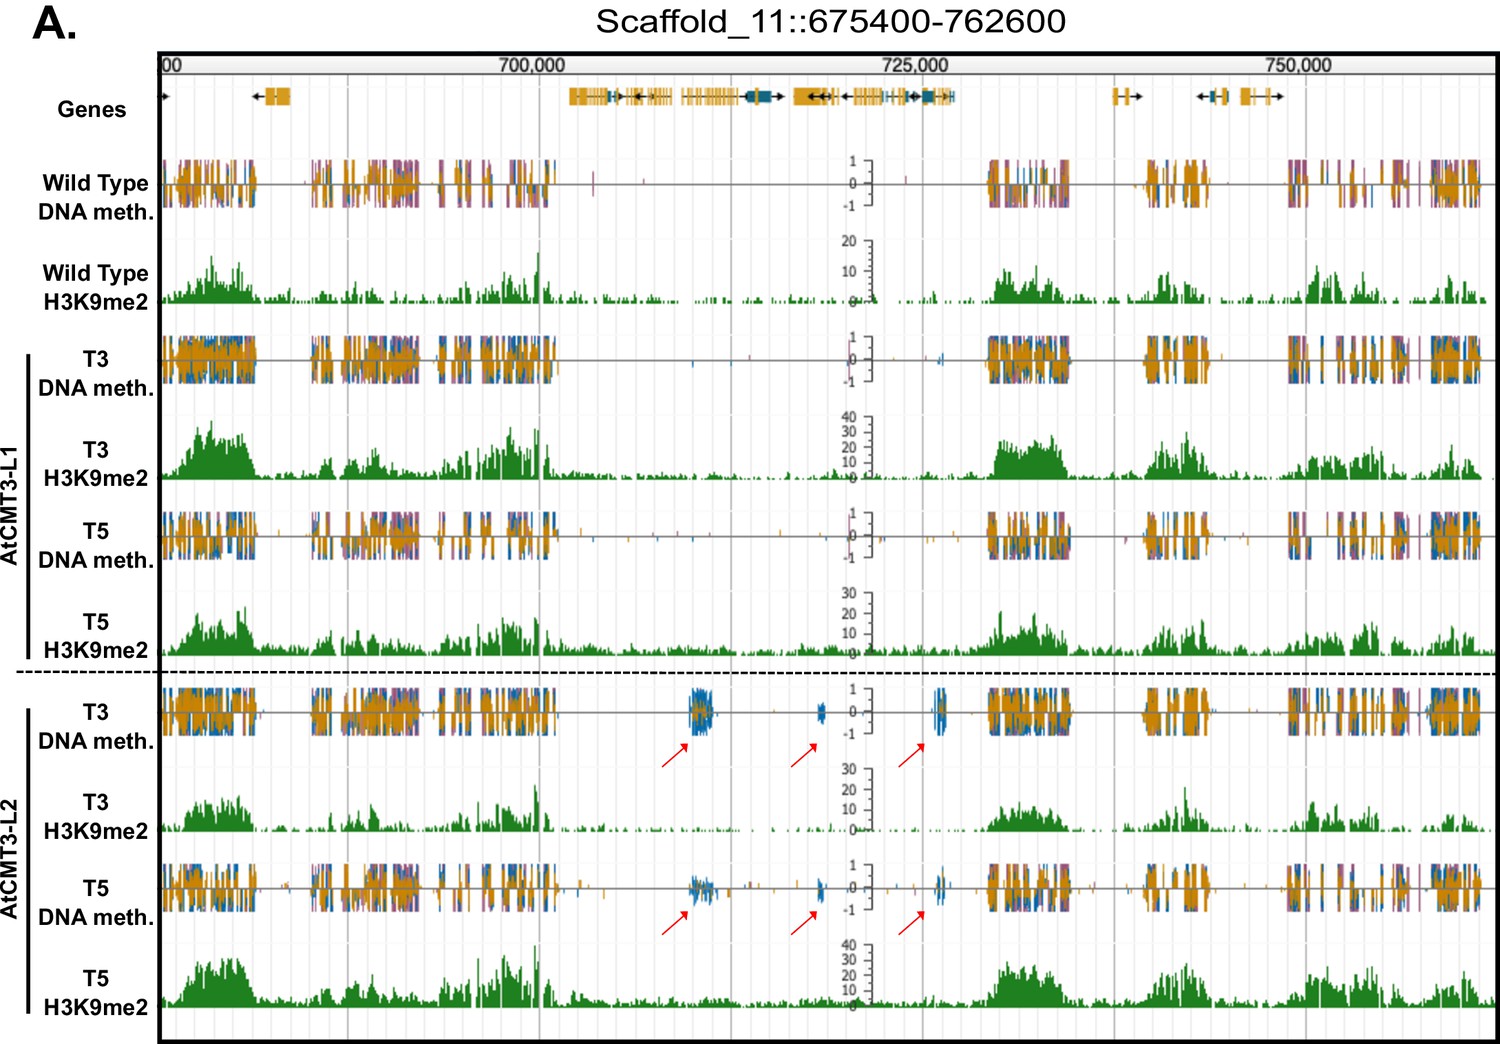
Gains in CHG methylation do not alter H3K9me2 levels or distribution.
(A) Genome browser view of CHG methylation levels and H3K9me2 ChIP sequencing levels in the T3 and T5 generations of the AtCMT3-L1 and L2 lineages. Arrows indicate gains of CHG methylation over gene bodies in the AtCMT3-L2 generations that do not show H3K9me2 enrichment. Scales on methylation tracks designate the weighted percent methylation, with 1 = 100% on the top strand and −1 = 100% on the bottom strand. Scales on the H3K9me2 tracks indicate the number of mapped reads and are not adjusted for library size (See C-F for comparison of normalized reads). DNA methylation is only shown in the CHG context. For DNA methylation in all contexts see Figure 3—figure supplement 1. (B) Metaplot of % CHG methylation over H3K9me2 ChIP peaks identified in wild type plants. (C–F) Metaplot of H3K9me2 ChIP-sequencing enrichment over H3K9me2 ChIP peaks defined in wild type plants and over CHG-gain genes in AtCMT3-L1T3 (C), AtCMT3-L1T5 (D), AtCMT3-L2T3 (E), and AtCMT3-L2T5 (F). Reads were normalized to library size. See Supplementary file 5 for lists of CHG-gain genes in each lineage.
Figure 3—figure supplement 1
Gains in CHG methylation do not alter H3K9me2 levels or distribution.
(A) Genome browser view of CHG methylation levels and H3K9me2 ChIP sequencing levels in the T3 and T5 generations of the AtCMT3-L1 and AtCMT3-L2 lineages. Arrows indicate gene bodies that gain CHG methylation in the AtCMT3-L2 generations but do not show H3K9me2 enrichment. Scales on methylation tracks designate the weighted percent methylation, with 1 = 100% on the top strand and −1 = 100% on the bottom strand. Scales on the H3K9me2 tracks indicate the number of mapped reads and are not normalized. Cytosine methylation is divided into CG (red), CHG (blue), and CHH (yellow) sequence contexts. Corresponds to the region shown in Figure 3A.
Figure 3—figure supplement 2
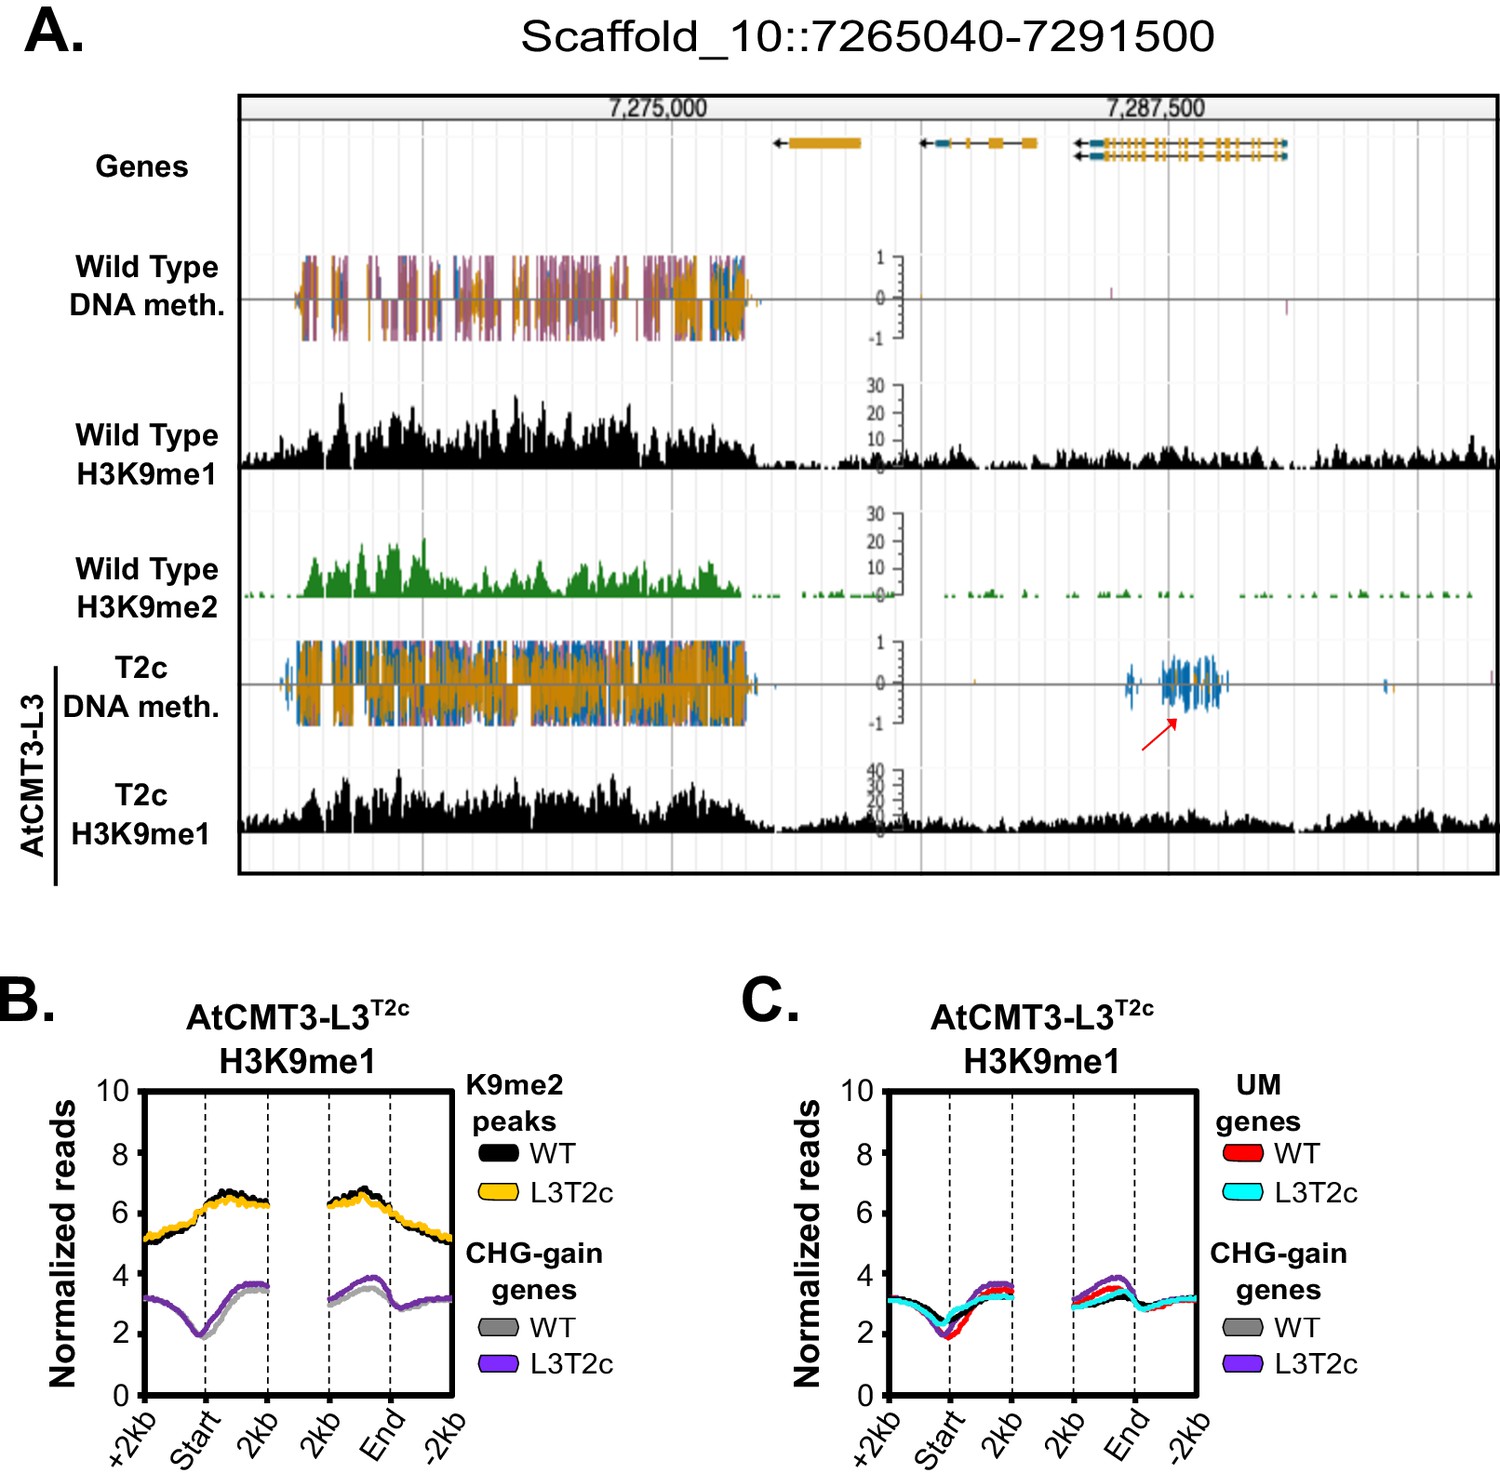
Gains in CHG methylation do not alter H3K9me1 levels or distribution.
(A) Genome browser view of CHG methylation levels and H3K9me1 ChIP sequencing levels in the T2c generation of the AtCMT3-L3 lineage. In wild type and AtCMT3-L3T2c, H3K9me1 can be found enriched in regions also enriched for H3K9me2. The arrow indicates a gene body that gains CHG methylation in AtCMT3-L3 but does not show H3K9me1 enrichment. Scales on methylation tracks designate the weighted percent methylation, with 1 = 100% on the top strand and −1 = 100% on the bottom strand. Scales on the H3K9me1 tracks indicate the number of mapped reads and are not normalized. Cytosine methylation is divided into CG (red), CHG (blue), and CHH (yellow) sequence contexts. (B) Metaplot of H3K9me1 ChIP-sequencing enrichment over H3K9me2 ChIP peaks defined in wild type plants and over CHG-gain genes in AtCMT3-L3T2c. (C) Metaplot of H3K9me1 ChIP-sequencing enrichment comparing enrichment over CHG-gain genes in AtCMT3-L3T2c to genes that do not gain CHG methylation (UM genes).
Figure 4 with 1 supplement
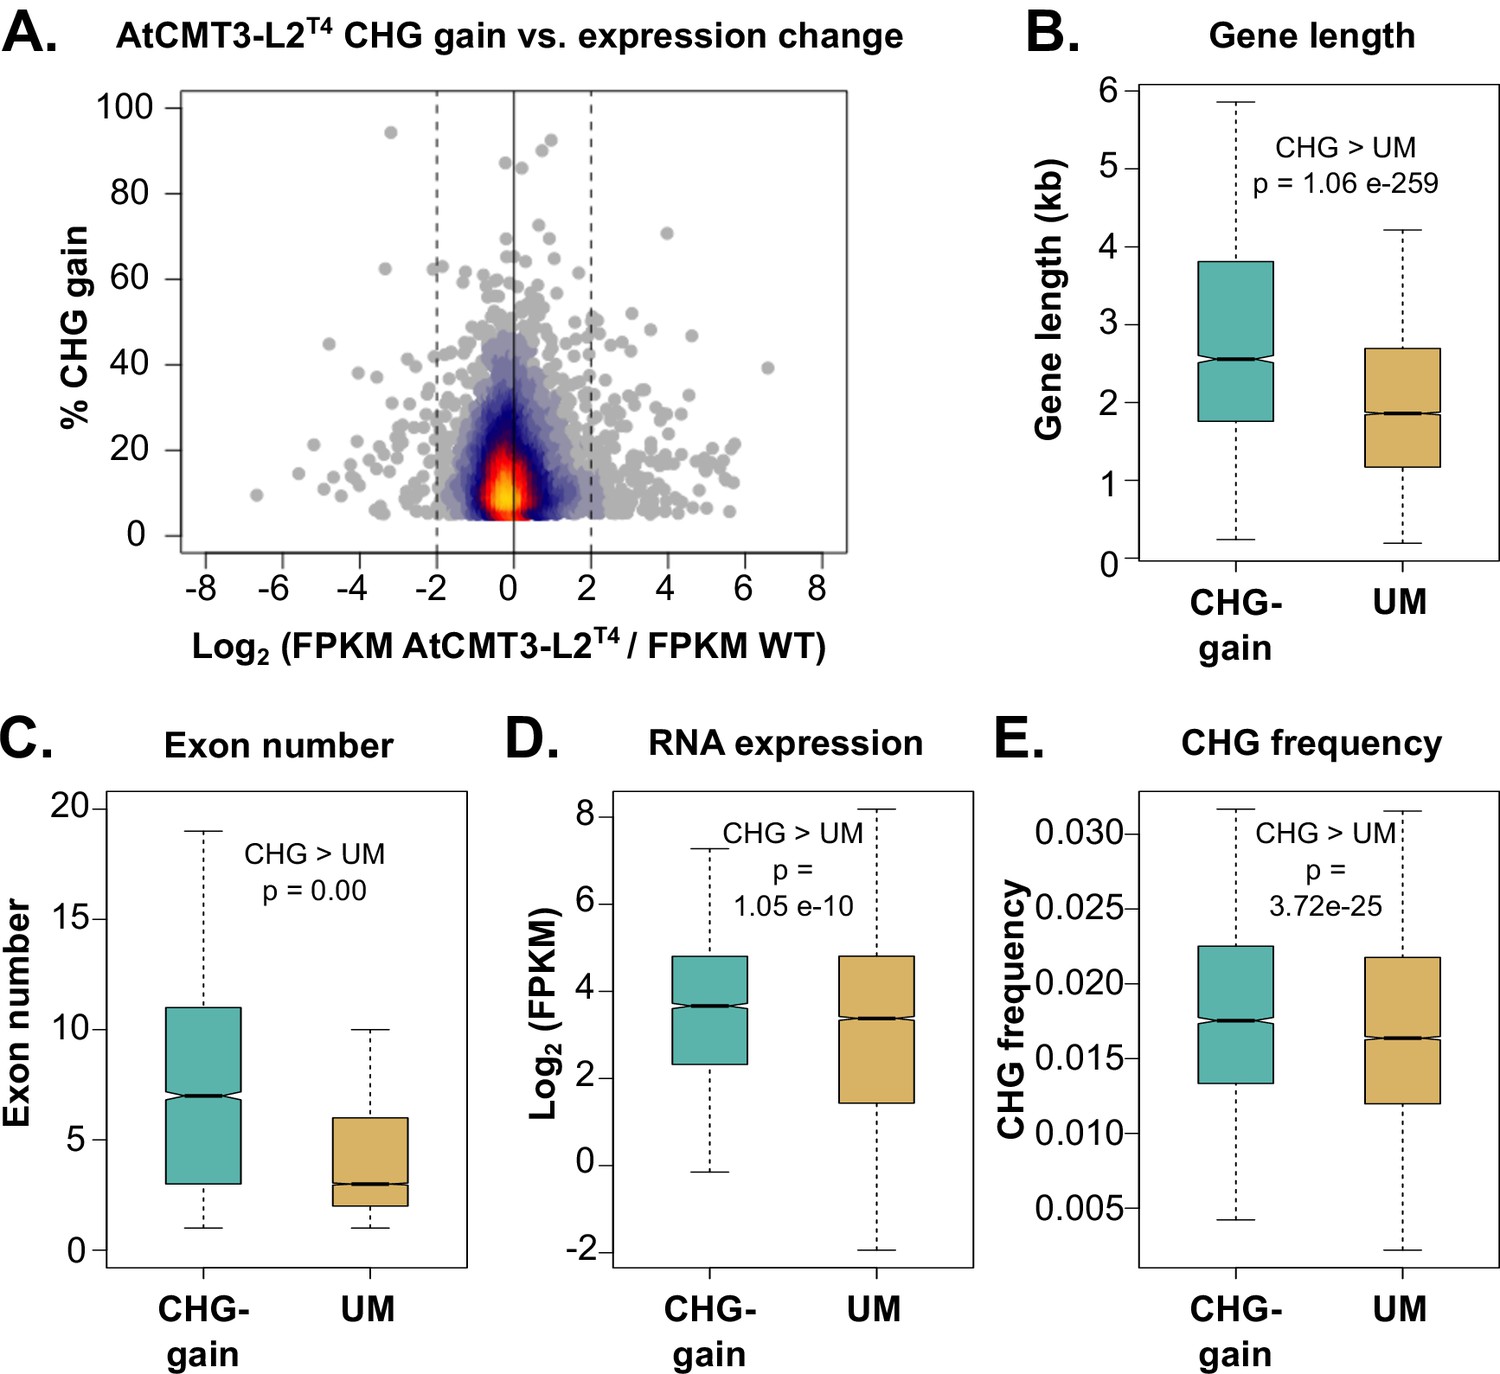
Genes that gain CHG methylation have A. thaliana gbM gene characteristics.
(A) Relationship between levels of CHG methylation gain and log2 fold change (FC) in expression for CHG-gain genes in AtCMT3-L2T4 relative to wild type. Genes with zero FPKM values were removed from the analysis. See Figure 4—figure supplement 1 for additional individuals analyzed. (B–E) Comparison of the (B) distribution of gene lengths, (C) number of exons, (D) expression levels, and (E) frequency of CHG sites between CHG-gain genes and unmethylated genes (UM). P-values were calculated using a Wilcoxon rank-sum test. Boxes indicate the first and third quartiles, with the center line indicating the median and notches the 95% confidence interval of the median. Whiskers show 1.0 times the interquartile range and outliers beyond this range were excluded for visualization purposes, but included in all calculations.
Figure 4—figure supplement 1
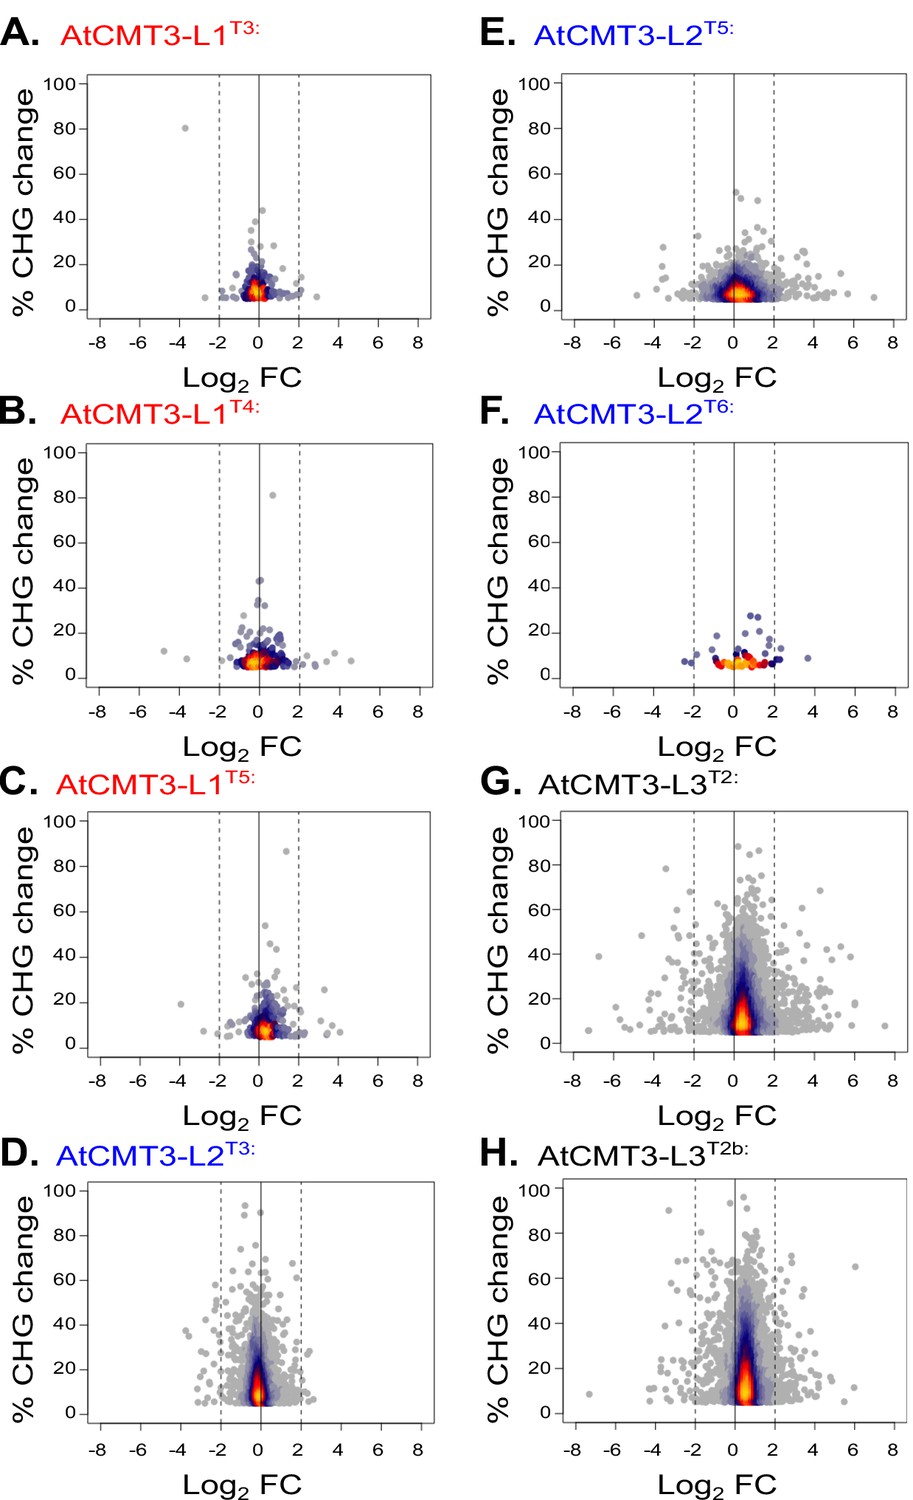
Changes in expression are not related to CHG methylation levels.
Relationship between fold change in expression relative to wild type and CHG methylation levels for genes identified as gaining a minimum of 5% CHG methylation in each respective line. Lines analyzed include those with both RNA sequencing and whole genome bisulfite sequencing data: (A) AtCMT3-L1T3; (B) AtCMT3-L1T4; (C) AtCMT3-L1T5; (D) AtCMT3-L2T3; (E) AtCMT3-L2T5; (F) AtCMT3-L2T6; (G) AtCMT3-L3T2; (H) AtCMT3-L3T2b. Genes with zero FPKM values were removed from the analysis.
Figure 5 with 2 supplements
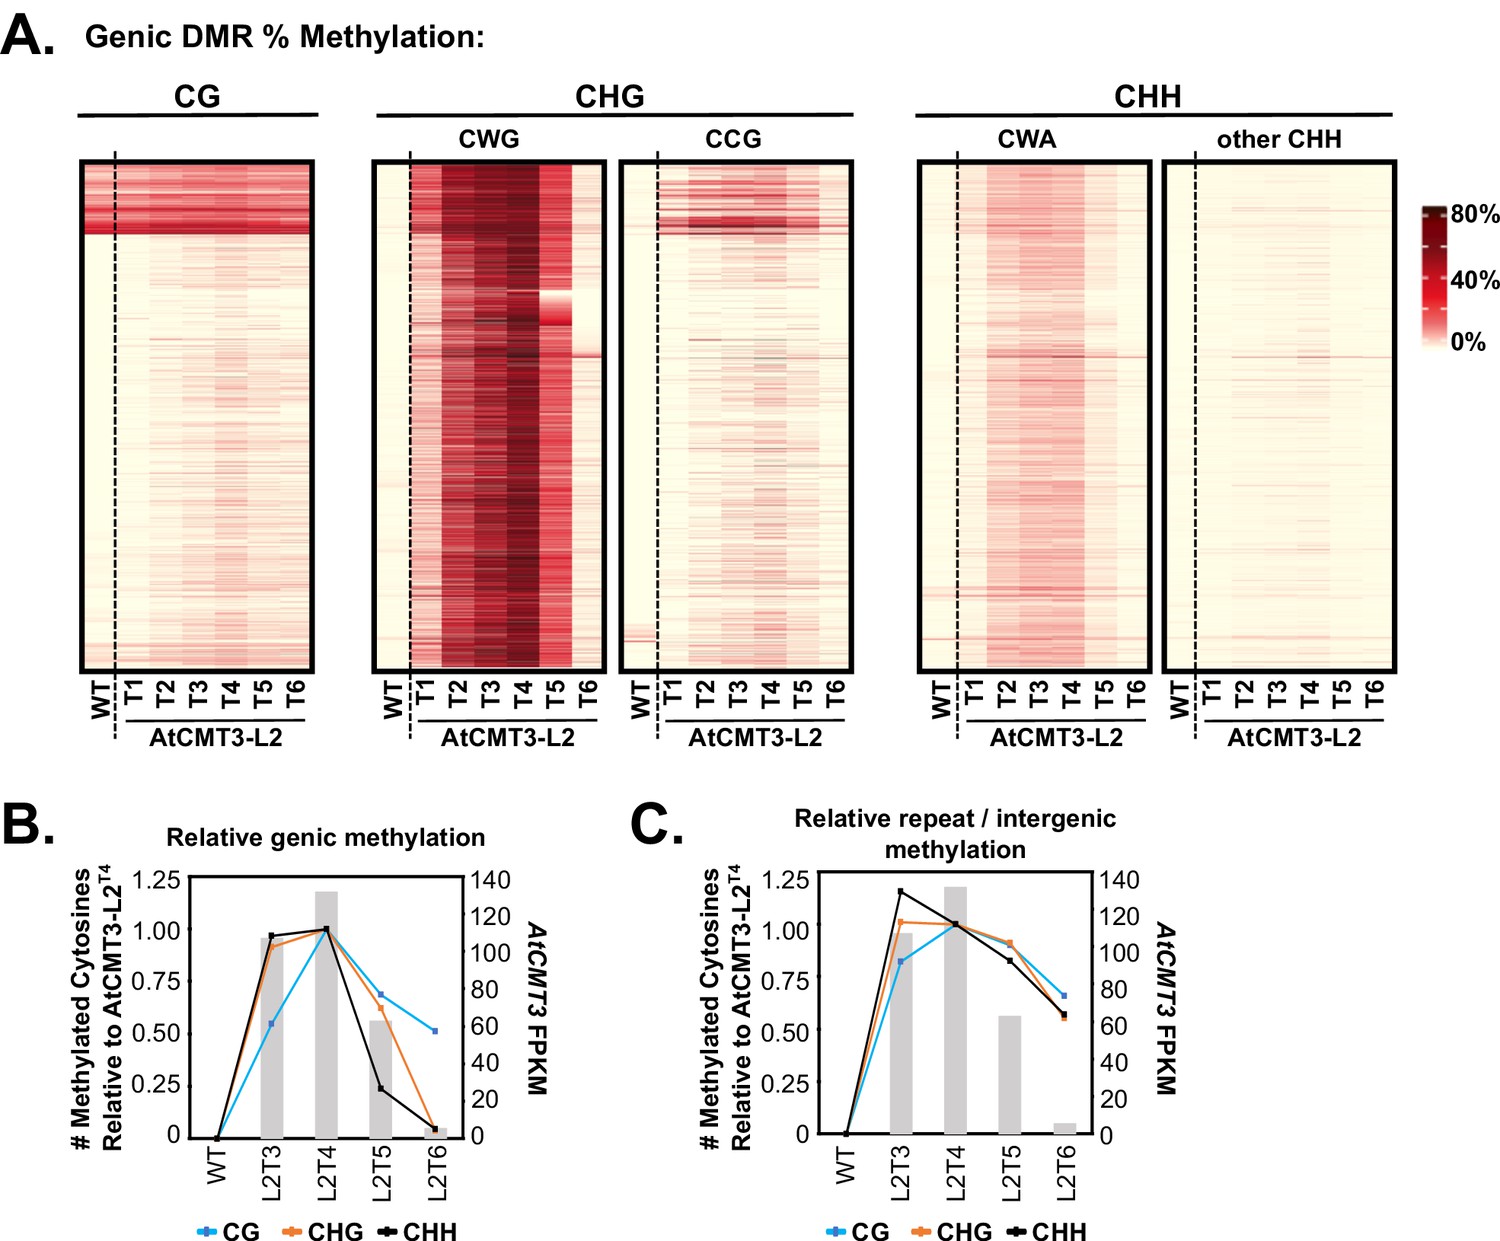
CHG methylation over gene bodies is associated with gains in non-CHG methylation.
(A) Heatmap of % methylation levels across CHG DMRs overlapping the CHG-gain genes in AtCMT3-L2T4 divided into selected trinucleotide contexts. See Figure 5—figure supplement 1A for further parsing of the data into all 16 possible trinucleotide contexts. (B) Assessment of the relationship of genic cytosine methylation to AtCMT3 expression across AtCMT3-L2 generations. Line plots show the number of methylated cytosines in each context relative to AtCMT3-L2T4 across CHG DMRs overlapping CHG-gain genes identified in AtCMT3-L2T4. Bar plots show the expression of the AtCMT3 transgene. For further parsing of the CHG and CHH contexts into CWG vs. CCG and CWA vs. other CHH, see Figure 5—figure supplement 1B–C. (C) Assessment of the relationship of repeat and intergenic cytosine methylation to AtCMT3 expression across AtCMT3-L2 generations. Line plots show the number of methylated cytosines relative to AtCMT3-L2T4 across hyper CHG DMRs identified in AtCMT3-L2T4 that overlap repeats or intergenic regions. Bar plots show the expression of the AtCMT3 transgene.
Figure 5—figure supplement 1
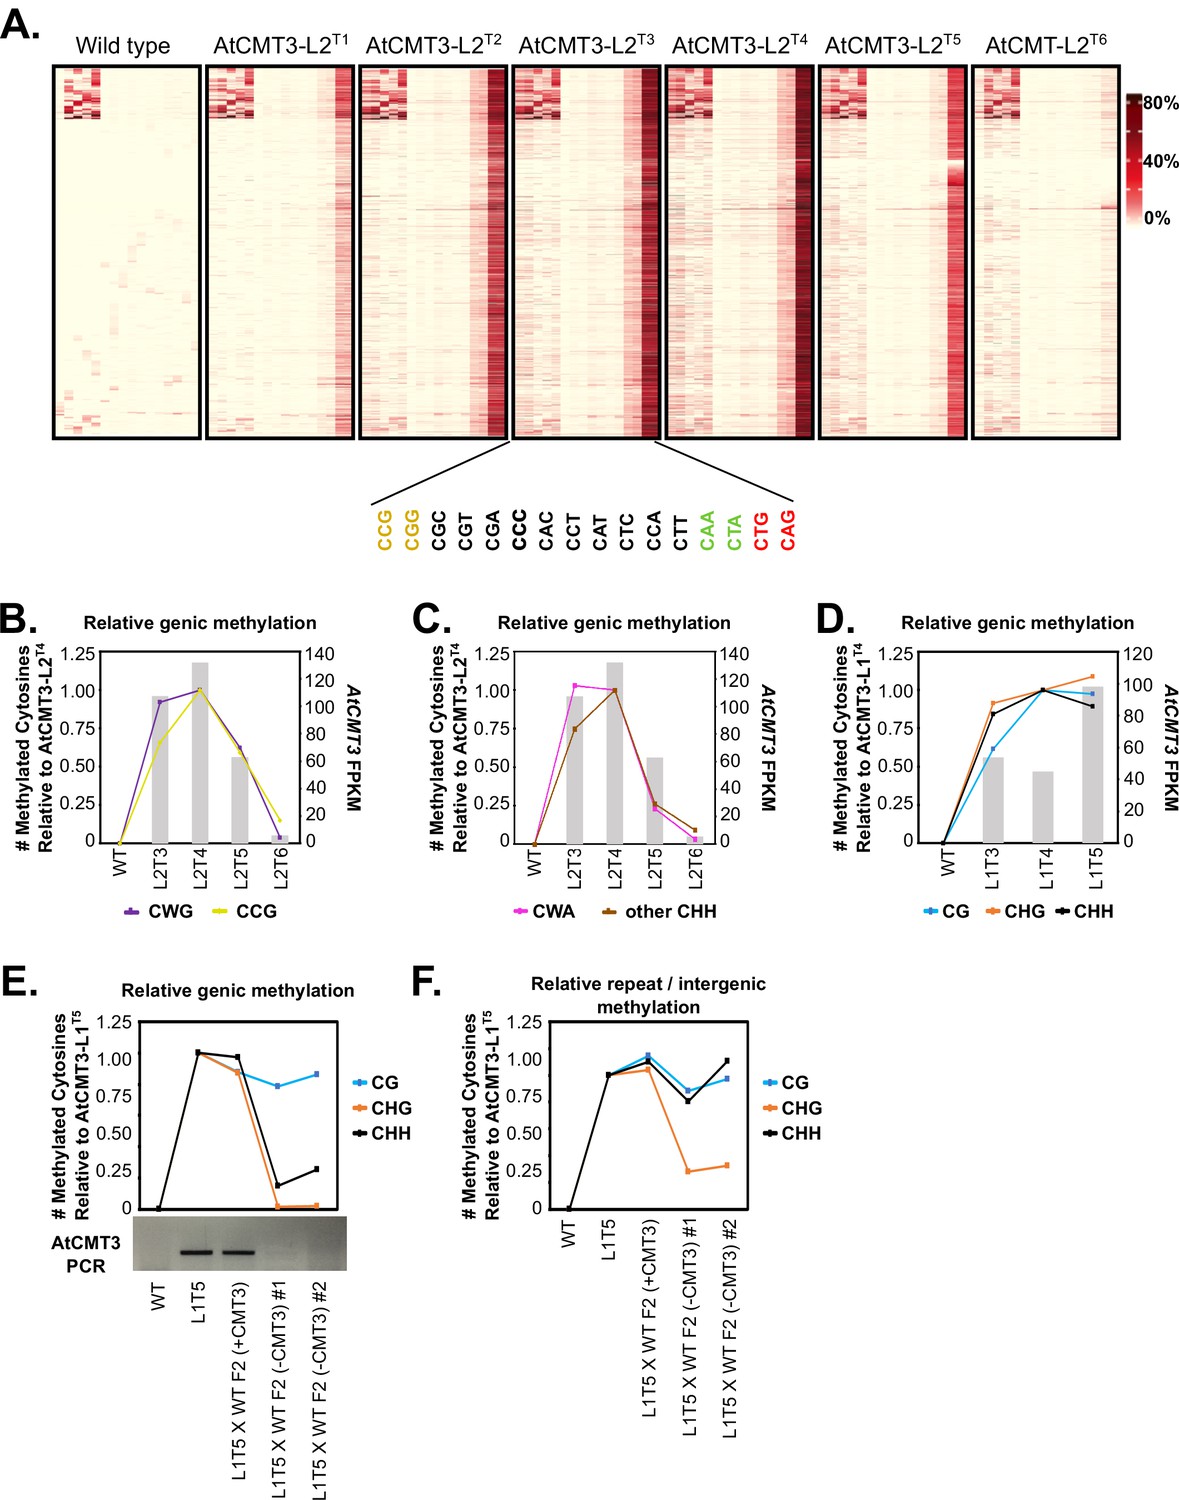
CHG methylation over gene bodies is associated with gains in non-CHG methylation.
(A) Heatmap of % methylation levels across CHG hyper-DMRs overlapping the CHG-gain genes in AtCMT3-L2T4 divided into all 16 possible trinucleotide contexts. (B–C) Assessment of the relationship of genic cytosine methylation to AtCMT3 expression across AtCMT3-L2 generations. Line plots show the number of methylated cytosines in (B) CWG vs. CCG contexts and (C) CWA vs. other CHH contexts relative to AtCMT3-L2T4 across CHG DMRs overlapping CHG-gain genes defined in AtCMT3-L2T4. Bar plots show the expression of the AtCMT3 transgene. See also Figure 5A–B. (D) Assessment of the relationship of genic cytosine methylation to AtCMT3 expression across AtCMT3-L1 generations. Line plots show the number of methylated cytosines in each context relative to AtCMT3-L1T4 across CHG DMRs overlapping CHG-gain genes identified in AtCMT3-L1T4. Bar plots show the expression of the AtCMT3 transgene. (E–F) Assessment of the number of methylated cytosines relative to AtCMT3-L1T5 across hyper CHG DMRs identified in AtCMT3-L1T5 that overlap CHG-gain genes identified in AtCMT3-L1T5 (E) or repeats or intergenic regions (F). AtCMT3-L1T5 was crossed to wild type (non-transgenic) and three F2 progeny were assessed: one progeny that retained the transgene (L1T5XWT F2 (+CMT3)) and two where the transgene segregated out (L1T5XWT F2 (-CMT3) #1 and #2). The gel image below the line plot is the result of PCR conducted on genomic DNA from each line with primers to detect the AtCMT3 transgene.
Figure 5—figure supplement 2

AtCMT3-induced genic CG methylation is maintained at higher levels than background following loss of AtCMT3 expression.
(A) Comparison of the % methylation of CG sites that were not found to be methylated in the non-transgenic wild type (Shandong ecotype) parent of AtCMT3 transgenic lines. Shown is the % CG methylation calculated in each lineage across hyper CHG DMRs identified in AtCMT3-L2T4 that overlap CHG-gain genes identified in AtCMT3-L2T4 (black bars; same regions assessed in Figure 5B) compared to the average % CG methylation of an equal amount of sequence space extracted from five randomly chosen sets of unmethylated genes that did not gain CHG methylation in AtCMT3-L2T4. The number of genes chosen in each set was equal to the number of AtCMT3-L2T4 CHG gain genes. Note that AtCMT3-L2T5 and T6 exhibited silencing of the AtCMT3 transgene, yet still maintained CG methylation levels higher than that detected on unmethylated genes. Methylation over the same regions was also assessed in additional, non-transgenic E. salsugineum accession (Yukon) to demonstrate that the levels of CG methylation over CHG gain genes in transgenic lines were unlikely to have occurred independently of AtCMT3. (B) Comparison of the % methylation of CG sites that were not found to be methylated in the non-transgenic wild type (Shandong ecotype) parent of AtCMT3 transgenic lines. Shown is the % CG methylation calculated in each lineage across hyper CHG DMRs identified in AtCMT3-L1T5 that overlap CHG-gain genes identified in AtCMT3-L1T5 (black bars; same regions assessed in Figure 5—figure supplement 1E) compared to the average % CG methylation of an equal amount of sequence space extracted from five randomly chosen sets of unmethylated genes that did not gain CHG methylation in AtCMT3-L1T5. The number of genes chosen in each set was equal to the number of AtCMT3-L1T5 CHG gain genes. AtCMT3-L1T5 was crossed to wild type (non-transgenic) and three F2 progeny were assessed: one progeny that retained the transgene (L1T5XWT F2 (+CMT3)) and two where the transgene segregated out (L1T5XWT F2 (-CMT3) #1 and #2). Note that the F2 progeny where the transgene segregated out still maintained CG methylation levels higher than that detected on unmethylated genes. As in (A), methylation over the same regions was also assessed in additional, non-transgenic E. salsugineum accession (Yukon) to demonstrate that the levels of CG methylation over CHG gain genes in transgenic lines were unlikely to have occurred independently of AtCMT3. Error bars are ± one standard deviation of the mean.
Figure 6
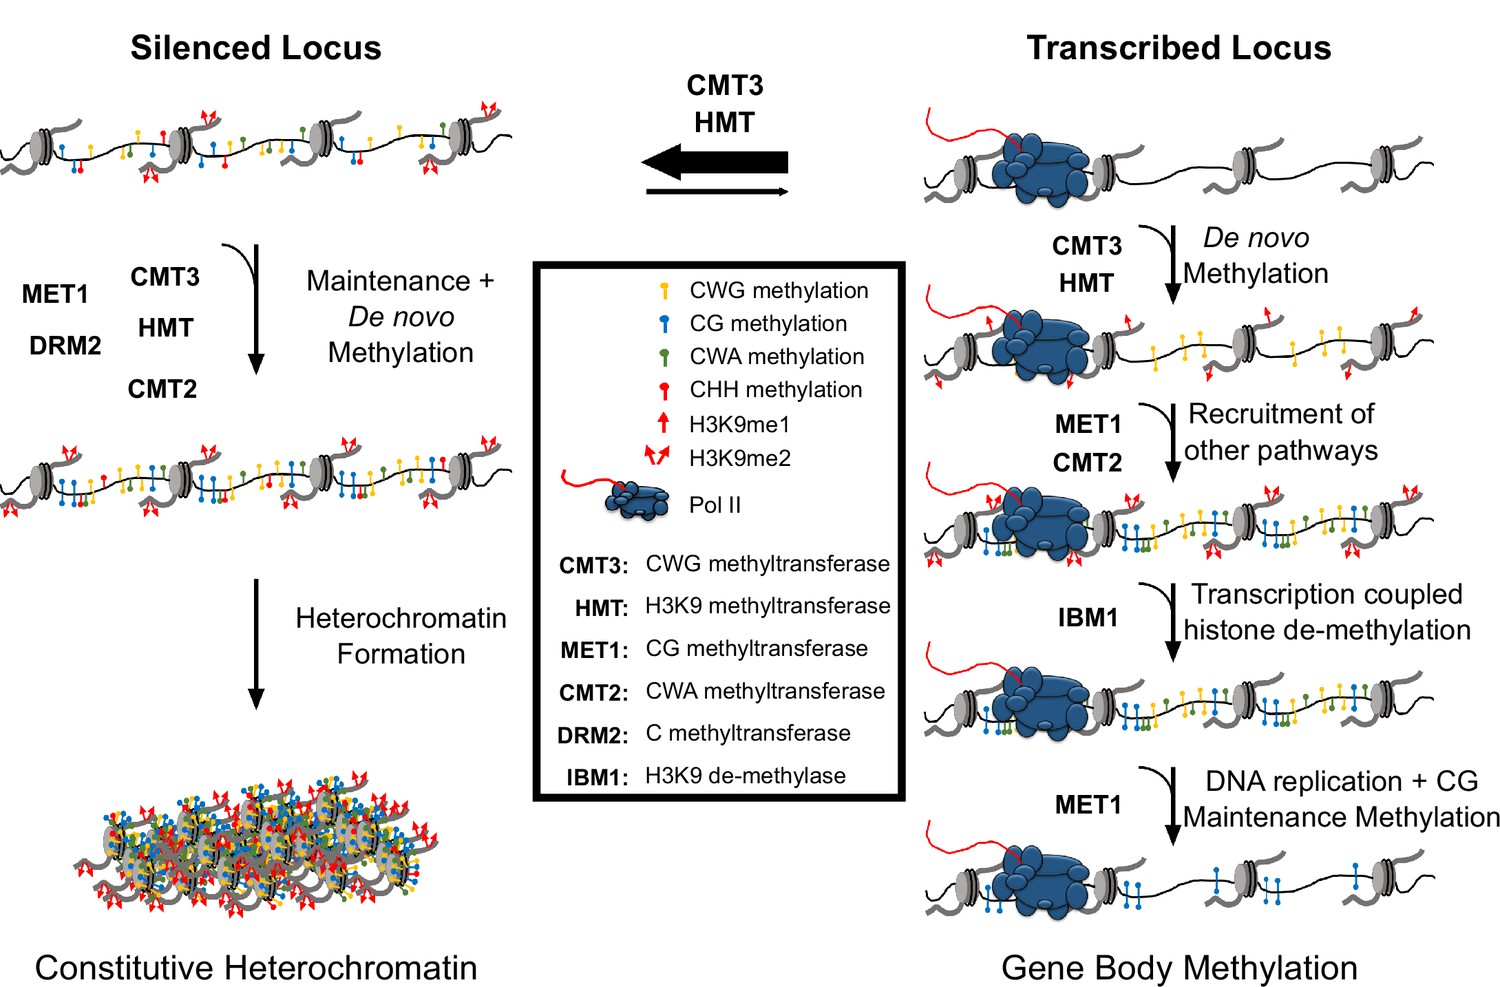
Hypothetical model for CMT3 establishment of gbM.
The activity of CMT3 and histone methyltransferases (HMTs) maintains CWG methylation and H3K9me2, respectively, and is most readily detected at silenced loci. At silenced loci, methylation by CMT3 and HMTs is reinforced by other methyltransferase pathways, including MET1 (CG methylation), CMT2 (CWA methylation), and DRM2 (methylation in all contexts), which maintain constitutive heterochromatin. In contrast to silenced loci, CMT3 and HMTs can only transiently establish de novo CWG methylation and H3K9me at transcribed loci characterized by gbM. This process may be initiated by incorporation of H3K9me1 nucleosomes, which are bound exclusively by CMT3 and not CMT2 and normally removed by the H3K9 de-methylase IBM1 in a transcription coupled mechanism. However, on rare occasions CMT3 may bind H3K9me1 located in genes and de novo methylate CWG cytosines. De novo methylation of CMT3 is not a favored activity of the enzyme, so this happens only very rarely or when CMT3 is expressed at high levels. This temporally stabilizes H3K9me due to the self-reinforcing feedback loop between histone and DNA methyltransferases. Transient stabilization of H3K9me promotes H3K9me2 that can then recruit additional methyltransferases including MET1 and CMT2 to methylate CG and CWA cytosines, respectively. Heterochromatin formation is inhibited, however, through eventual removal of H3K9me by IBM1. Loss of H3K9me and/or loss of available CMT3 results in the failure of maintenance of DNA methylation in all contexts except CG following DNA replication. CG methylation is maintained due to the preferential targeting of the CG maintenance methyltransferase, MET1, to hemi-methylated cytosines following replication.
Tables
Key resources table
| Reagent type (species) or resource | Designation | Source or reference | Identifiers | Additional information |
|---|---|---|---|---|
| Strain, strain background (Agrobacterium tumefaciens) | C58C1 | other | Dr. Robert Schmitz (University of Georgia) | |
| Strain, strain background (Eutrema salsugineum) | Shandong | https://www.arabidopsis.org | CS22504 | |
| Strain, strain background (E. salsugineum) | Shandong AtCMT3 lineages | This paper | Dr. Robert Schmitz (University of Georgia) | |
| Strain, strain background (E. salsugineum) | Yukon | https://www.arabidopsis.org | CS22664 | |
| Antibody | anti-H3K9me2 | Cell Signaling Technology | Cat# 9753 s; RRID: AB_659848 | Polyclonal, 5 μg |
| Antibody | anti-H3K9me1 | Abcam | Cat# 8896; RRID: AB_732929 | Polyclonal, 5 μg |
| Recombinant DNA reagent | pEarleyGate 302 pAtCMT3::gAtCMT3 | PMID: 23021223 | ||
| Peptide, recombinant protein | T4 DNA Ligase | NEB | Cat# M0202 | |
| Peptide, recombinant protein | Klenow Fragment | NEB | Cat# M0210 | |
| Peptide, recombinant protein | Phusion DNA Polymerase | NEB | Cat# M0530 | |
| Peptide, recombinant protein | SuperScript III Reverse Transcriptase | Invitrogen | Cat# 18080044 | |
| Commercial assay or kit | Qiagen DNeasy Plant Mini Kit | Qiagen | Cat# 69106 | |
| Commercial assay or kit | EZ DNA-methylation Gold Kit | Zymogen | Cat# D5006 | |
| Commercial assay or kit | AMPure beads | Beckman Coulter | Cat# A63880 | |
| Commercial assay or kit | NEXTFLEX Bisulfite Sequencing Library Prep Kit | Bioo Scientific | Cat# NOVA-5119–01 | |
| Commercial assay or kit | KAPA HiFi Uracil+ | Roche | Cat #07959079001 | |
| Commercial assay or kit | Direct-Zol RNA Mini-prep plus | Zymogen | Cat# R2071 | |
| Commercial assay or kit | Illumina TruSeq mRNA Stranded Library Kit | Illumina | Cat# 20020594 | |
| Commercial assay or kit | Protein A Dynabeads | Invitrogen | Cat# 10001D | |
| Commercial assay or kit | LightCycler 480 SYBR green master mix | Roche | Cat# 04707516001 | |
| Chemical compound, drug | Silwet L-77 | Phyto Technology Laboratories | Cat#:S7777 | |
| Chemical compound, drug | Pierce Protease Inhibitors | ThermoFisher | Cat# A32963 | |
| Chemical compound, drug | NEBNext dA-Tailing Reaction Buffer | NEB | Cat# B6059 | |
| Chemical compound, drug | proteinase K | ThermoFisher | Cat# 26160 | |
| Software, algorithm | methylpy | PMID: 26030523 | https://github.com/yupenghe/methylpy | |
| Software, algorithm | cutadapt v1.9.dev1 | DOI: https://doi.org/10.14806/ej.17.1.200 | RRID:SCR_011841 | https://cutadapt.readthedocs.io/en/stable/ |
| Software, algorithm | bowtie 2.2.4 | PMID: 22388286 | RRID:SCR_005476 | http://bowtie-bio.sourceforge.net/bowtie2/index.shtml |
| Software, algorithm | Intervene v.0.6.1 | PMID: 28569135 | https://intervene.readthedocs.io/en/latest/ | |
| Software, algorithm | Bedtools v2.27.1 | PMID: 20110278 | RRID:SCR_006646 | https://bedtools.readthedocs.io/en/latest/ |
| Software, algorithm | HISAT2 v2.0.5 | PMID: 25751142 | RRID:SCR_015530 | https://ccb.jhu.edu/software/hisat2/index.shtml |
| Software, algorithm | StringTie v1.3.3b | PMID: 25690850 | RRID:SCR_016323 | https://ccb.jhu.edu/software/stringtie/#pub |
| Software, algorithm | HOMER 4.10 | PMID: 20513432 | RRID:SCR_010881 | http://homer.ucsd.edu/homer/ |
| Software, algorithm | Trimmomatic v0.33 | PMID: 24695404 | RRID:SCR_011848 | http://www.usadellab.org/cms/?page=trimmomatic |
| Software, algorithm | Bowtie v1.1.1 | PMID: 19261174 | RRID:SCR_005476 | http://bowtie-bio.sourceforge.net/index.shtml |
| Software, algorithm | SAMtools v1.2 and v0.1.19 | PMID: 19505943 | RRID:SCR_00210 | http://samtools.sourceforge.net |
| Software, algorithm | R v3.44 | other | RRID:SCR_001905 | https://www.r-project.org |
Additional files
-
Supplementary file 1
Sequencing statistics for all next generation sequencing data analyzed in this study.
- https://doi.org/10.7554/eLife.47891.020
-
Supplementary file 2
Differentially methylated regions identified by methylpy.
- https://doi.org/10.7554/eLife.47891.021
-
Supplementary file 3
Called hyper- and hypo-DMRs in each lineage.
- https://doi.org/10.7554/eLife.47891.022
-
Supplementary file 4
FPKM values for all genes determined by RNA-seq.
- https://doi.org/10.7554/eLife.47891.023
-
Supplementary file 5
Lists of genes that gained a minimum of 5% CHG methylation in each line.
- https://doi.org/10.7554/eLife.47891.024
-
Supplementary file 6
Genes with greater than (+/-) two log2 fold change in expression identified in each line.
- https://doi.org/10.7554/eLife.47891.025
-
Supplementary file 7
P-values for Fisher's Exact tests of enrichment of CHG-gain genes in up- or down-regulated genes.
- https://doi.org/10.7554/eLife.47891.026
-
Supplementary file 8
Gene Ontology analysis for biologic processes enriched in up- or down-regulated genes.
- https://doi.org/10.7554/eLife.47891.027
-
Supplementary file 9
List of CHG-gain genes with closest A. thaliana ortholog and A. thaliana gbM status.
- https://doi.org/10.7554/eLife.47891.028
-
Supplementary file 10
List of E. salsugineum IBM1-like genes and expression status.
- https://doi.org/10.7554/eLife.47891.029
-
Transparent reporting form
- https://doi.org/10.7554/eLife.47891.030
Download links
A two-part list of links to download the article, or parts of the article, in various formats.
Downloads (link to download the article as PDF)
Open citations (links to open the citations from this article in various online reference manager services)
Cite this article (links to download the citations from this article in formats compatible with various reference manager tools)
Epimutations are associated with CHROMOMETHYLASE 3-induced de novo DNA methylation
eLife 8:e47891.
https://doi.org/10.7554/eLife.47891


