C. elegans neurons have functional dendritic spines
- Vanderbilt University, United States
- University of Toronto, Canada
Figures
Figure 1 with 2 supplements
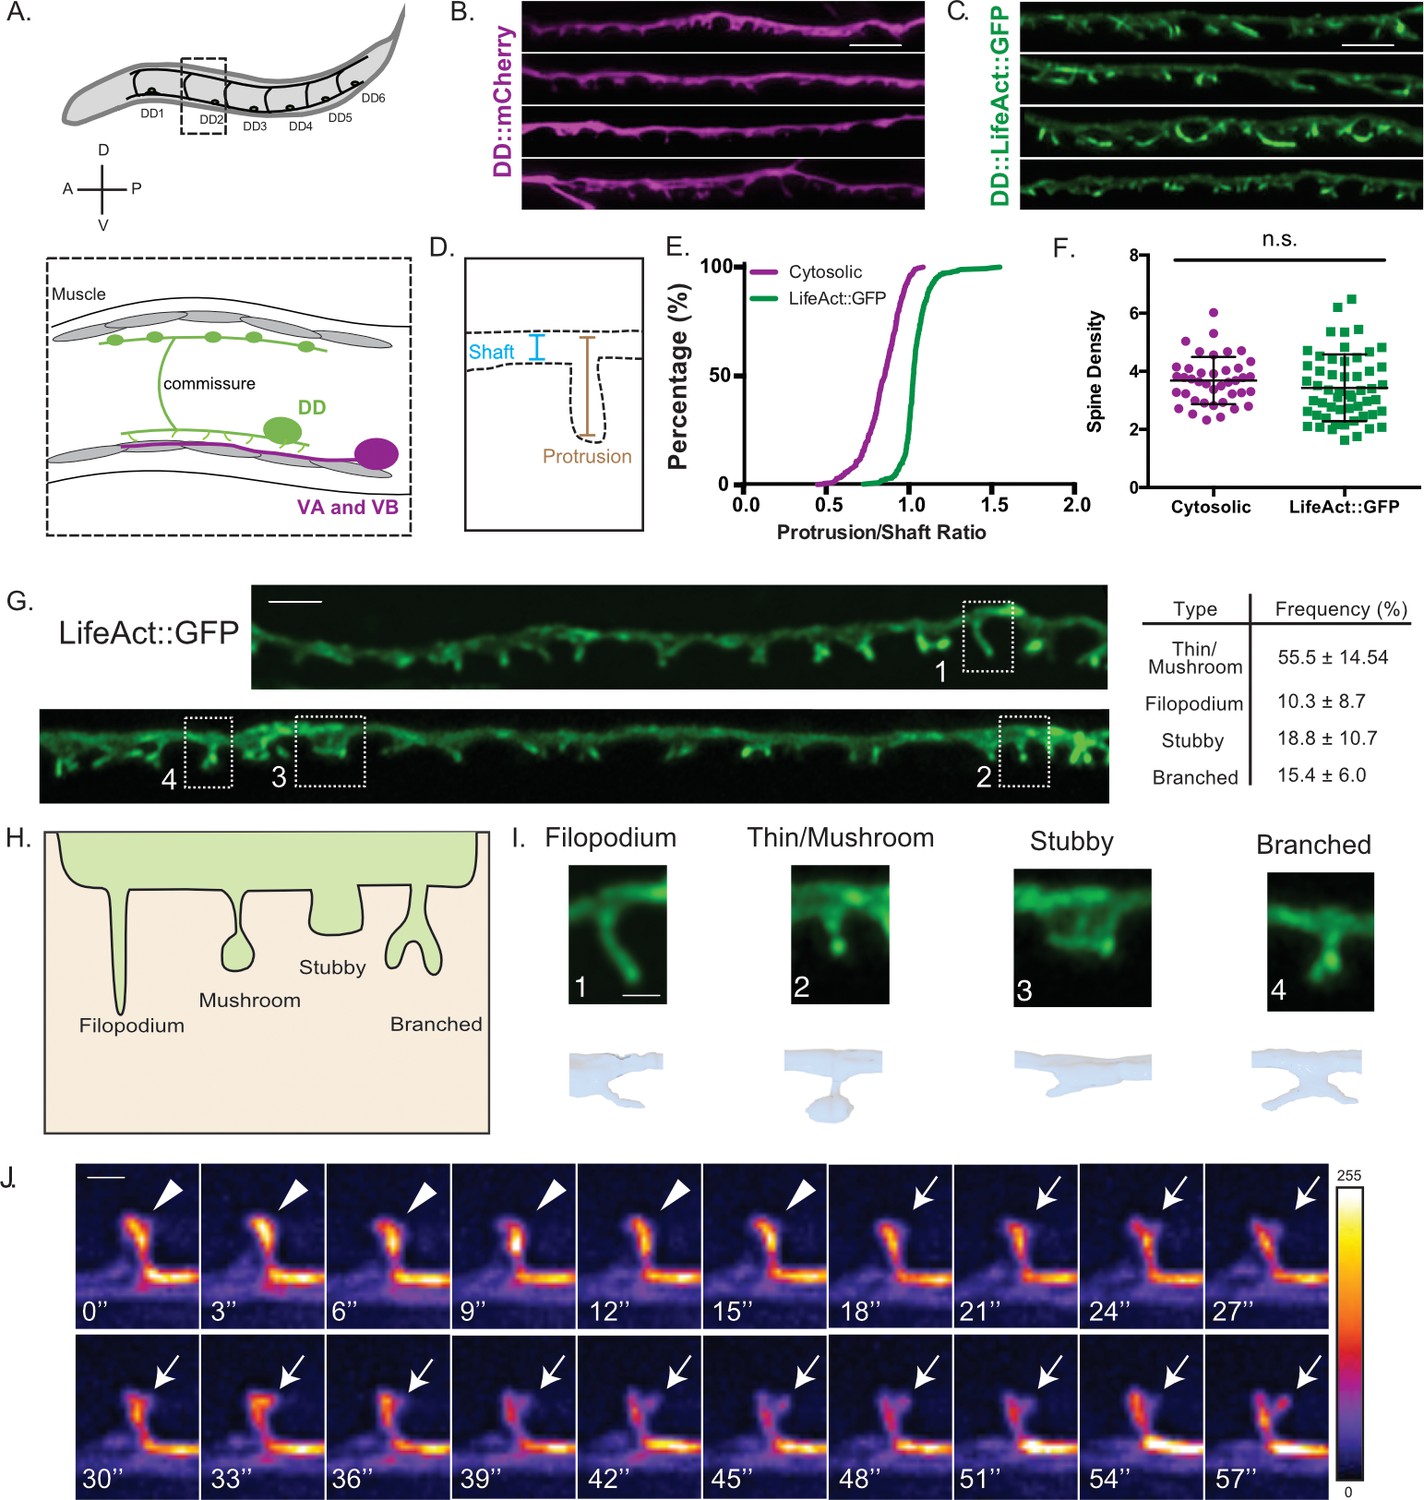
DD GABAergic neurons display dendritic spines.
(A) Six DD motor neurons are located in the C. elegans ventral nerve cord. In the adult, DD presynaptic boutons (oblong ovals) innervate dorsal muscles (gray cells) and DD postsynaptic termini (spines) receive cholinergic input from VA and VB motor neurons on the ventral side (magenta). (B–F) Airyscan imaging resolves ventrally projecting spines from DD neurons labeled with (B) cytosolic mCherry or (C) LifeAct::GFP. (D) Intensity of spine over shaft ratio reveals that (E) LifeAct::GFP preferentially accumulates at the spine whereas cytosolic mCherry is evenly distributed between the spine and shaft (KS test, p<0.0001, n > 286 spines). (F) Spine density of young adults revealed by mCherry (3.68 ± 0.8 spines/10 µm) or LifeAct::GFP (3.43 ± 1.2 spines/10 µm) is not significantly different (t test, p=0.0855, n > 16 worms). Measurements are mean ± SD. Scale bars = 2 µm. (G–I) LifeAct::GFP reveals 1. Thin/Mushroom (55.5 ± 14.5%), 2. Filopodial (10.3 ± 8.70%), 3. Stubby (18.8 ± 10.4%), 4. Branched spines (15.4 ± 6.0%) in adult DD motor neurons. Measurements are mean ± SD, n = 16 worms, 357 spines. For scatterplot, see Figure 1—figure supplement 1. (Scale bar = 1 µm). (H) Schematic of spine shapes. (I) Images of each type of spine identified by (top) Airyscan imaging (Scale bar = 500 nm) of LifeAct::GFP or (bottom) 3D-reconstruction of DD1 from serial electron micrographs of a high-pressure frozen young adult. See also Figure 1—figure supplement 1B. (J) Dendritic spines are dynamic. Snapshots of in vivo spine remodeling from a thin/mushroom (arrowhead) to branched morphology (arrow). Images (LifeAct::GFP) are shown with a rainbow LUT. Higher intensity is represented by warm colors and dimmer intensity by cold colors. L4 stage larva. See also Figure 1—figure supplement 1C-H. Scale bar = 500 nm.
-
Figure 1—source data 1
Individual measurements of spines/shaft intensity ratios labeled with cytosolic mCherry or LifeAct::GFP.
- https://doi.org/10.7554/eLife.47918.006
-
Figure 1—source data 2
Figure 1_Density_by markers.
- https://doi.org/10.7554/eLife.47918.007
Figure 1—figure supplement 1
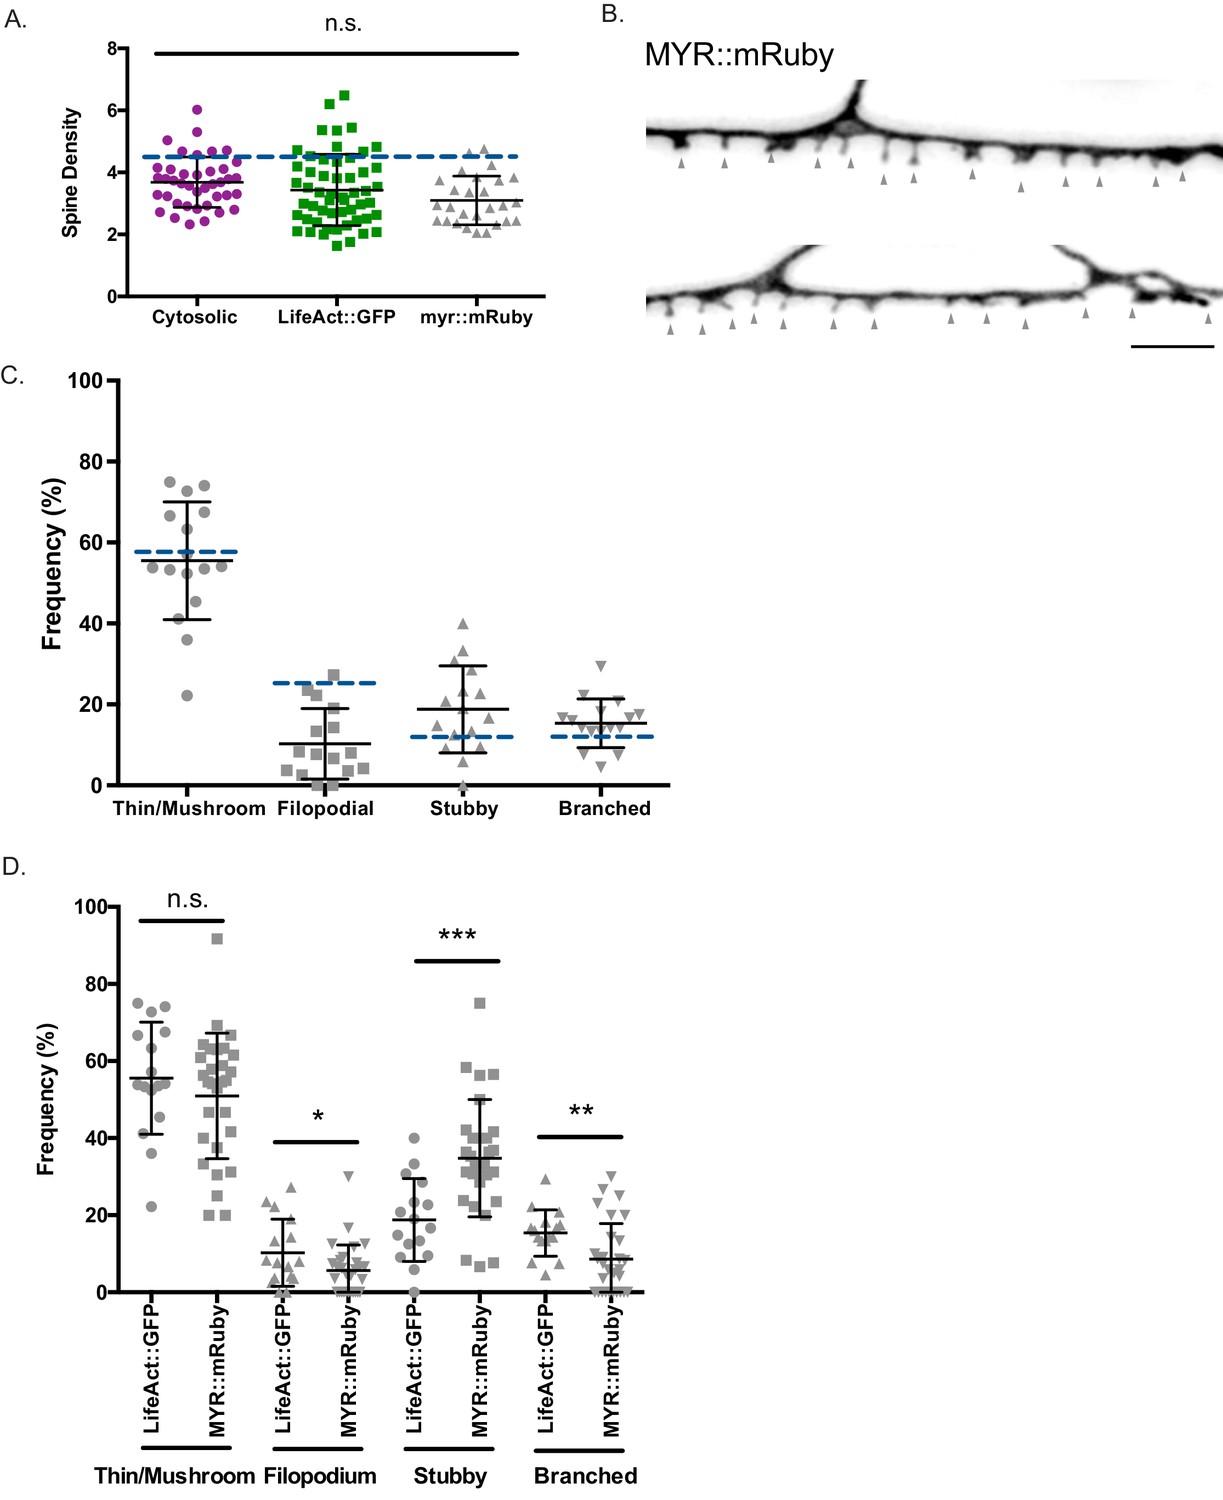
Dendritic spines adopt distinct morphologies.
(A) Spine densities determined from young adult DD neurons labeled with mCherry (3.68 ± 0.8 spines/10 µm), LifeAct::GFP (3.43 ± 1.2spines/10 µm) and MYR::mRuby (3.09 ± 0.8 spines/10 µm) are not significantly different and are comparable to spine density determined by 3D EM reconstruction of DD1 (4.2 spines/10 µm) (dashed blue line). One-way ANOVA between mCherry, LifeAct::GFP and MYR::mRuby (p>0.05), n > 16. Data for mCherry and LifeAct::GFP also appears in Figure 1F. (B) Example of DD spines labeled with membrane bound marker, myristolated mRuby (MYR::mRuby). (C) Frequency of spines by type labeled with LifeAct::GFP: Thin/Mushroom (55.5 ± 14.5%), Filopodial (10.3 ± 8.70%), Stubby (18.8 ± 10.7%), Branched (15.4 ± 6.01%). Dashed blue lines denote frequency for each spine type from EM reconstruction of DD1: Thin/Mushroom (58.3%), Filopodial (25%), Branched (8.3%) and Stubby (8.3%). (D) Frequency of spines by type, labeled with MYR::mRuby: Thin/Mushroom (52.2 ± 16.5%), Filopodial (5.68 ± 7.0%), Stubby (33.1 ± 14.8%), Branched (9.02 ± 9.6%). Unpaired T-test shows that frequency of Filopodial (p=0.0339); Stubby (p=0.0009) and Branched (p=0.011) classes labeled with MYR::mRuby is differs from frequency of spine types detected with with LifeAct::GFP labeling. Data for LifeAct::GFP labeled spines also shown in Figure 1—figure supplement 1C.
-
Figure 1—figure supplement 1—source data 1
Figure 5_Spine_Density_by_genotype.
- https://doi.org/10.7554/eLife.47918.004
Figure 1—figure supplement 2
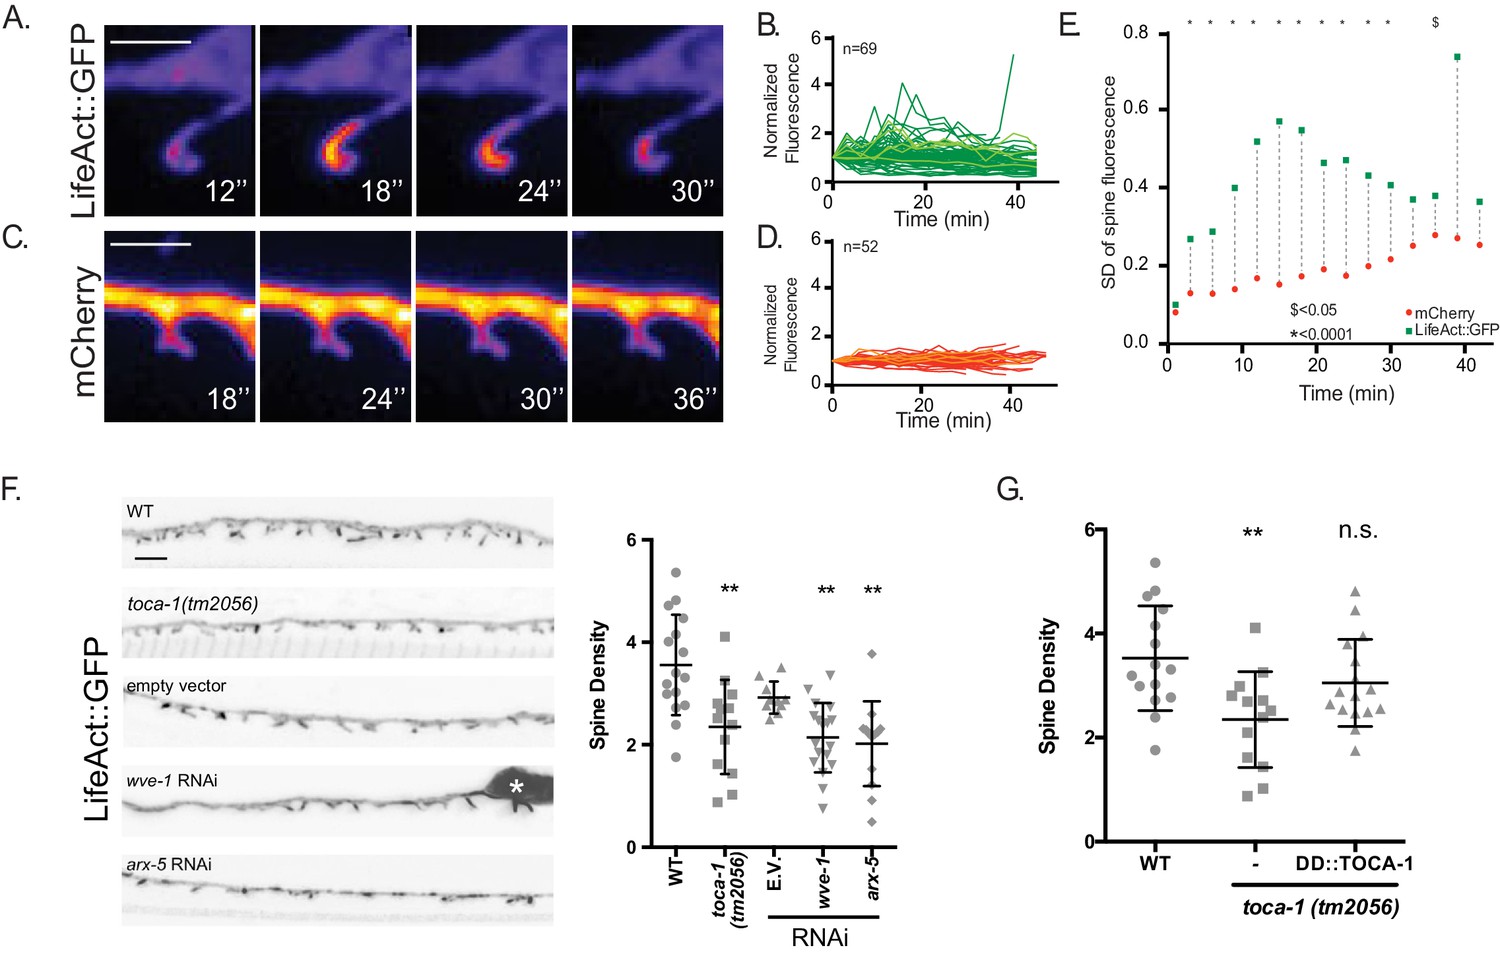
Dendritic spines display a dynamic actin cytoskeleton.
(A–E) Live-imaging of (A,B) LifeAct::GFP and (C,D) mCherry-labeled DD spines of L4 stage larvae reveals dynamic LifeAct::GFP vs stable cytosolic mCherry signals. (B,D) Normalized traces of LifeAct::GFP and mCherry fluorescence from live imaging. Different shades of green and red lines are used to allow visualization of individual traces. (E) Comparison of standard deviations of all traces for each timepoint reveals significantly different variance between LifeAct::GFP vs cytosolic mCherry markers (F-test, * is p<0.0001 from T3 to T30 and $ is p<0.05 at T39, n > 51 traces). Scale bar = 500 nm. (F) Regulators of actin polymerization define spine density. (Left) Representative images (young adults) of DD spines for WT (wild type), toca-1 (tm2056), empty vector (RNAi control), wave/wve-1(component of WRC) RNAi and p21/arx-5 (component of Arp2/3 complex) RNAi. (Right) WT young adults show 3.53 ± 1.0 spines/10 µm vs toca-1 (tm2056) with 2.77 ± 1.1 spines/10 µm (t test, *** is p<0.001). Spine density is reduced with RNAi of wave/wve-1 (2.24 ± 0.7 spines/10 µm) or p21/arx-5 RNAi (2.20 ± 0.7 spines/10 µm) versus Empty Vector (E.V.) control (2.9 ± 0.4 spines/10 µm). One-way ANOVA with Dunnett’s multiple comparison test, ** is p<0.01, n > 9 worms. Measurements are Mean ± SD. Scale bar is 1 µm. (G) TOCA-1 functions cell-autonomously in DD neurons. wild-type young adults show 3.53 ± 1.0 spines/10 µm vs 2.35 ± 0.9 spines/10 µm in toca-1(tm2056), which is rescued with TOCA-1a expression in DD neurons (Pflp-13::TOCA-1a::mCherry)=3.05 ± 0.8 spines/10 µm. One-way ANOVA with Dunnett’s multiple comparison test. n.s. = not significant. ** is p<0.01. wild type and toca-1(tm2056) data also appears in Figure 1—figure supplement 2F.
Figure 2

DD spines appose presynaptic cholinergic vesicles.
(A) Postsynaptic ionotropic acetylcholine receptors (iAChRs) are localized in GABAergic motor neurons in apposition to input from cholinergic motor neurons. (B) Cholinergic RAB-3 presynaptic vesicles labeled with mCherry localize in close proximity to DD postsynaptic spines labeled with flp-13::LifeAct::GFP. Young adult stage worms. Scale bar = 1 µm. Asterisk denotes the DD cell body. Arrowheads mark multiple RAB-3::mCherry clusters apposing dendritic spines. (C) Volumetric EM reconstruction of a portion of the DD1 dendrite (25 µm) in the ventral nerve cord (gray) detects contacts with 43 presynaptic termini from axons of the cholinergic (VA1, VA2, VB2) and GABAergic (VD) motor neurons, and other neurons (other). 84.8% (n = 28/33) of VA and VB inputs are adjacent to DD spines. 33.3% (4/12) of spines directly oppose a single presynaptic partner (black arrowhead); the majority of spines (66.7%) appose more than one terminal (clear arrowhead). Scale bar = 2 µm. (D) Frequency of spines contacted by cholinergic presynaptic sites detected by Airyscan imaging (contacted, 84.1 ± 6.4% vs not contacted, 15.8 ± 6.4%, n = 128 spines from seven worms) or by EM (contacted, 100% vs not contacted, 0%, n = 12 spines from one worm). (E) Schematic of DD presynaptic boutons (top) and postsynaptic spines (dashed box) with distal iAChR puncta (green dots) on the ventral side. F1-3. iACh receptor subunit ACR-12::GFP (green) localizes to LifeAct::mCherry-labeled DD spines (magenta). Asterisk marks DD cell body. Arrows in F1denote spines without visible ACR-12::GFP clusters. Scale bars = 1 µm. (G–H) Locations of ACR-12::GFP puncta on DD spines. > 95% of spines have at least one ACR-12::GFP cluster (n = 127 spines from eight young adult worms). Examples of spines from each category. Scale bars = 1 µm. (H) Examples of spines with more than one ACR-12::GFP cluster. White arrowheads point to ACR-12::GFP clusters at DD spines. Scale bar = 200 nm. (I–K) NATF labeling of endogenous iAChR auxiliary protein LEV-10 in DD neurons (I) detects LEV-10 localization to spines with (J) all spines showing NATF LEV-10::GFP puncta (n = 159 spines from seven worms). Scale bars = 500 nm. (K) Example of spines with endogenous LEV-10 clusters. Scale bar = 200 nm.
Figure 3
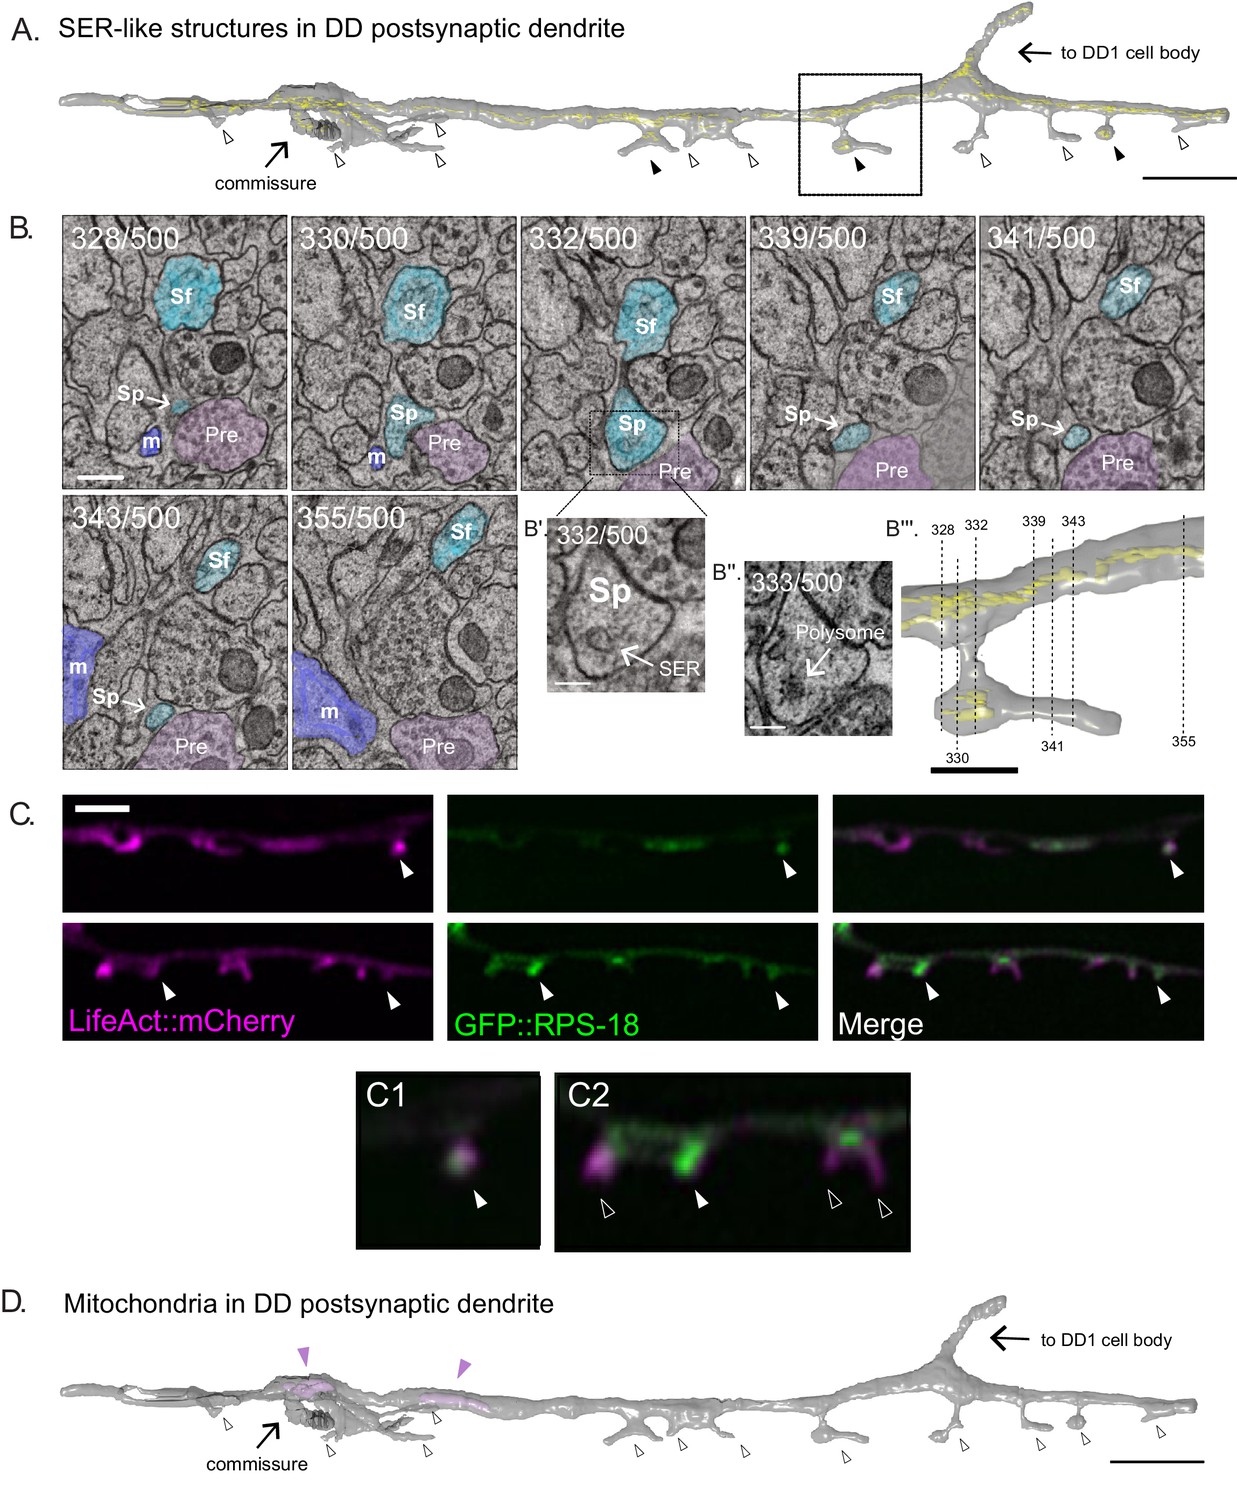
SER-like structures and ribosomes in spines and dendritic shaft.
(A) 3D EM reconstruction of DD1 dendrite reveals Smooth Endoplasmic Reticulum (SER)-like cisternae (yellow) in the dendritic shaft and some spines (black arrowheads). Most spines lack SER-like structures (clear arrowheads). Scale bar = 2 µm. (B) Serial cross-sections (328-355) of the ventral nerve cord show spines (Sp) budding from DD1 (blue) dendritic shaft (Sf). ‘Pre’ labels presynaptic terminals from a cholinergic VA neuron (pink); m, muscle arm (purple). (Scale bar = 200 nm) (B’) Magnified region of section 332. Arrow points to SER-like structure in DD dendritic spine (Scale bar = 100 nm). (B’’) Section 333. Arrow points to polysome-like structure in DD dendritic spine (Scale bar = 100 nm). (B’’’) Volumetric reconstruction of DD1 dendrite (gray) and SER-like structures (yellow). Dashed lines denote location of each section shown in B. Scale bar = 500 nm. (C) Airyscan imaging shows GFP-labeled ribosomal protein, RPS-18 (Noma et al., 2017), localized to DD spines (arrowheads) labeled with LifeAct::mCherry. Scale bar = 2 µm. (D) Volumetric EM reconstruction of a portion of the DD1 (25 µm) dendrite shows mitochondria (purple) in the shaft (arrowheads) but not in spines (clear arrowheads).
Figure 4 with 1 supplement

Coordinated Ca++ transients in dendritic spines.
Series (time in seconds) of live-cell images of cytosolic (A) mCherry and (B) GCaMP6s in DD postsynaptic spines reveals (C) dynamic GCaMP6s vs stable mCherry signals, n = 11 movies, 31 spines. (D) GCaMP6s transients occur in neighboring spines more frequently (>50%) than predicted by a random distribution (KS test, p<0.0001). Scale bars = 500 nm. (E–H) VA motor neuron activation is correlated with Ca++ transients in DD1 spines. GCaMP6s fluorescence imaged (at 0.5 s intervals) with periodic optogenetic activation (at 2.5 s intervals) of ceChrimson, detects Ca++ transients with (E) ATR (n = 14) but not with carrier (F) (EtOH) (n = 12). Circles at the top right corner of each panel correspond to red light on (red) for ceChrimson activation vs off (black). Scale bars = 500 nm. (G) GCaMP6s fluorescence throughout the 15 s recording period plotted for ATR (green) (n = 14) vs carrier (EtOH) (black) (n = 12). (H) Plot of the standard deviation (SD) of GCaMP6s signal at each time-point shows that fluctuations in the ATR-treated samples (green boxes) are significantly greater than in EtOH controls (black circles), F-test, *=p < 0.0001. Additionally, SDs are significantly different between timepoints before and after light activation (T6 vs T7 and T11 vs. T12). F-test, ^=p < 0.05. ND = not determined. Purple bars denote interval with red-light illumination (e.g., ceChrimson activation). (I–K) Ca++ propagation to neighboring spines depends on intracellular Ca++ stores. (I) Graphical representation of the experimental paradigm: 561 nm laser excitation at a single spine (excitation area, pink) with subsequent GCaMP6s changes recorded from three different regions of interest at: (1) the excited spine, (2) an adjacent spine and (3) a distant spine. (J) In the wild type, significant Ca++ changes are detected at the excited spine (p=0.0182), adjacent spine (p=0.0319) and distant spine (p=0.0402), n = 15 videos. (K) In ryanodine-treated worms, significant Ca++ changes are not detected at the excited spine (p>0.999), at an adjacent spine (p=0.924) or at a distant spine (p=0.552), n = 16 videos.
-
Figure 4—source data 1
Figure 1_TipShaft Ratio.
- https://doi.org/10.7554/eLife.47918.017
-
Figure 4—source data 2
Figure 4_DirectedCa_All traces.
- https://doi.org/10.7554/eLife.47918.018
Figure 4—figure supplement 1
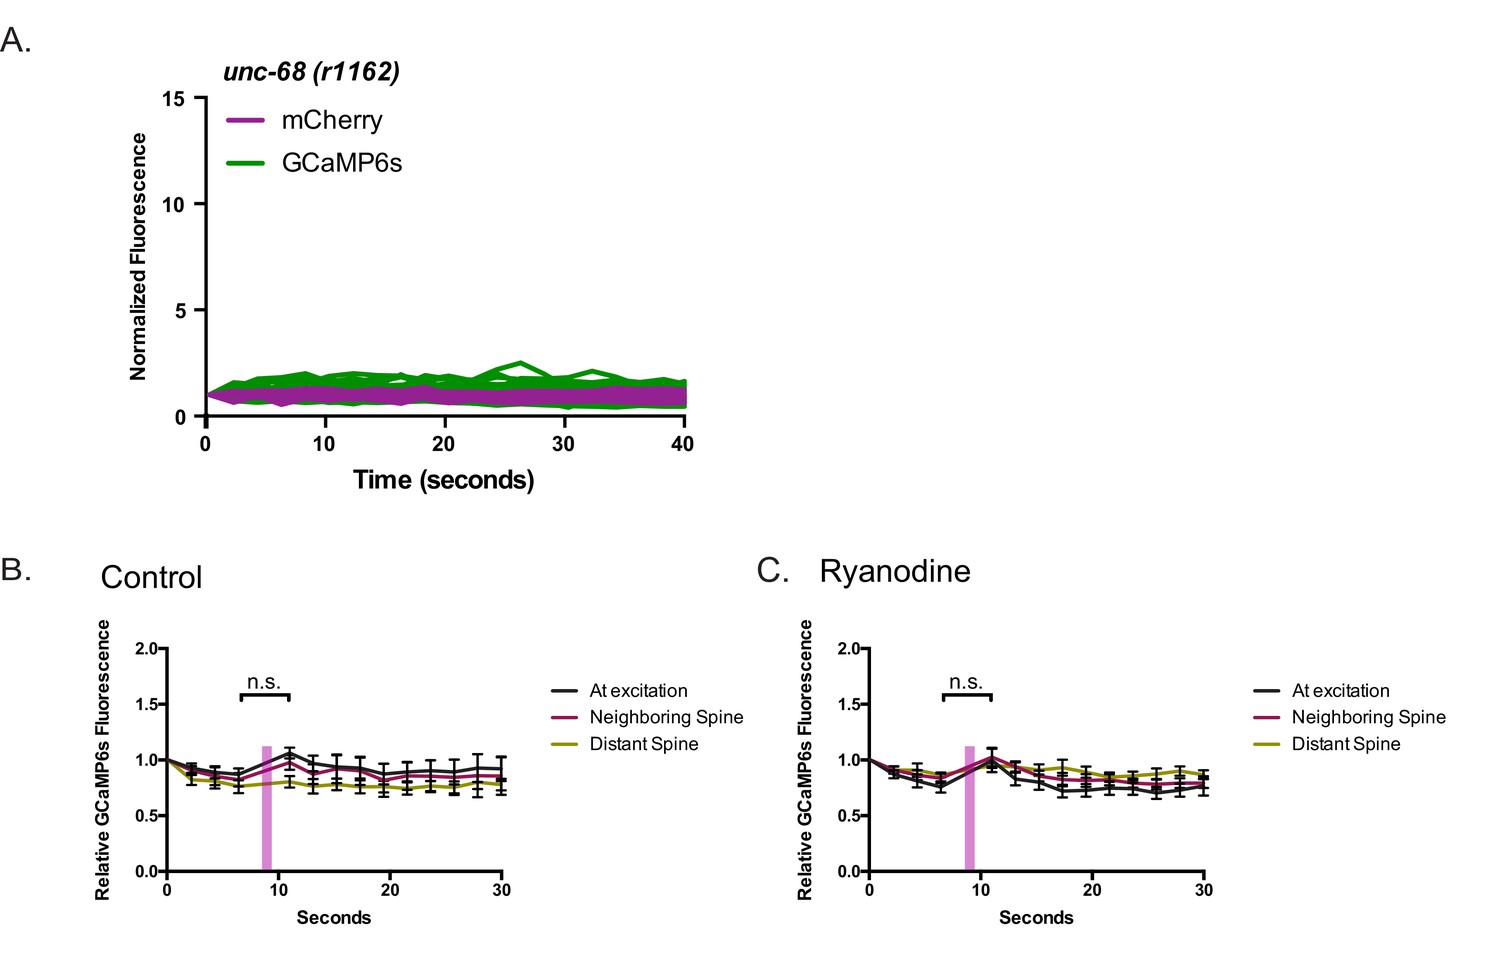
Dendritic Ca++ transients depend on intracellular Ca++ stores.
(A) Intrinsic GCaMP6s transients are dramatically reduced in unc-68(r1142) mutants. Neither (B) Control (EtOH only) or (C) ryanodine-treated (ryanodine + EtOH) worms show significant Ca++ changes after 561 nm local excitation (n > 6 videos).
Figure 5 with 2 supplements
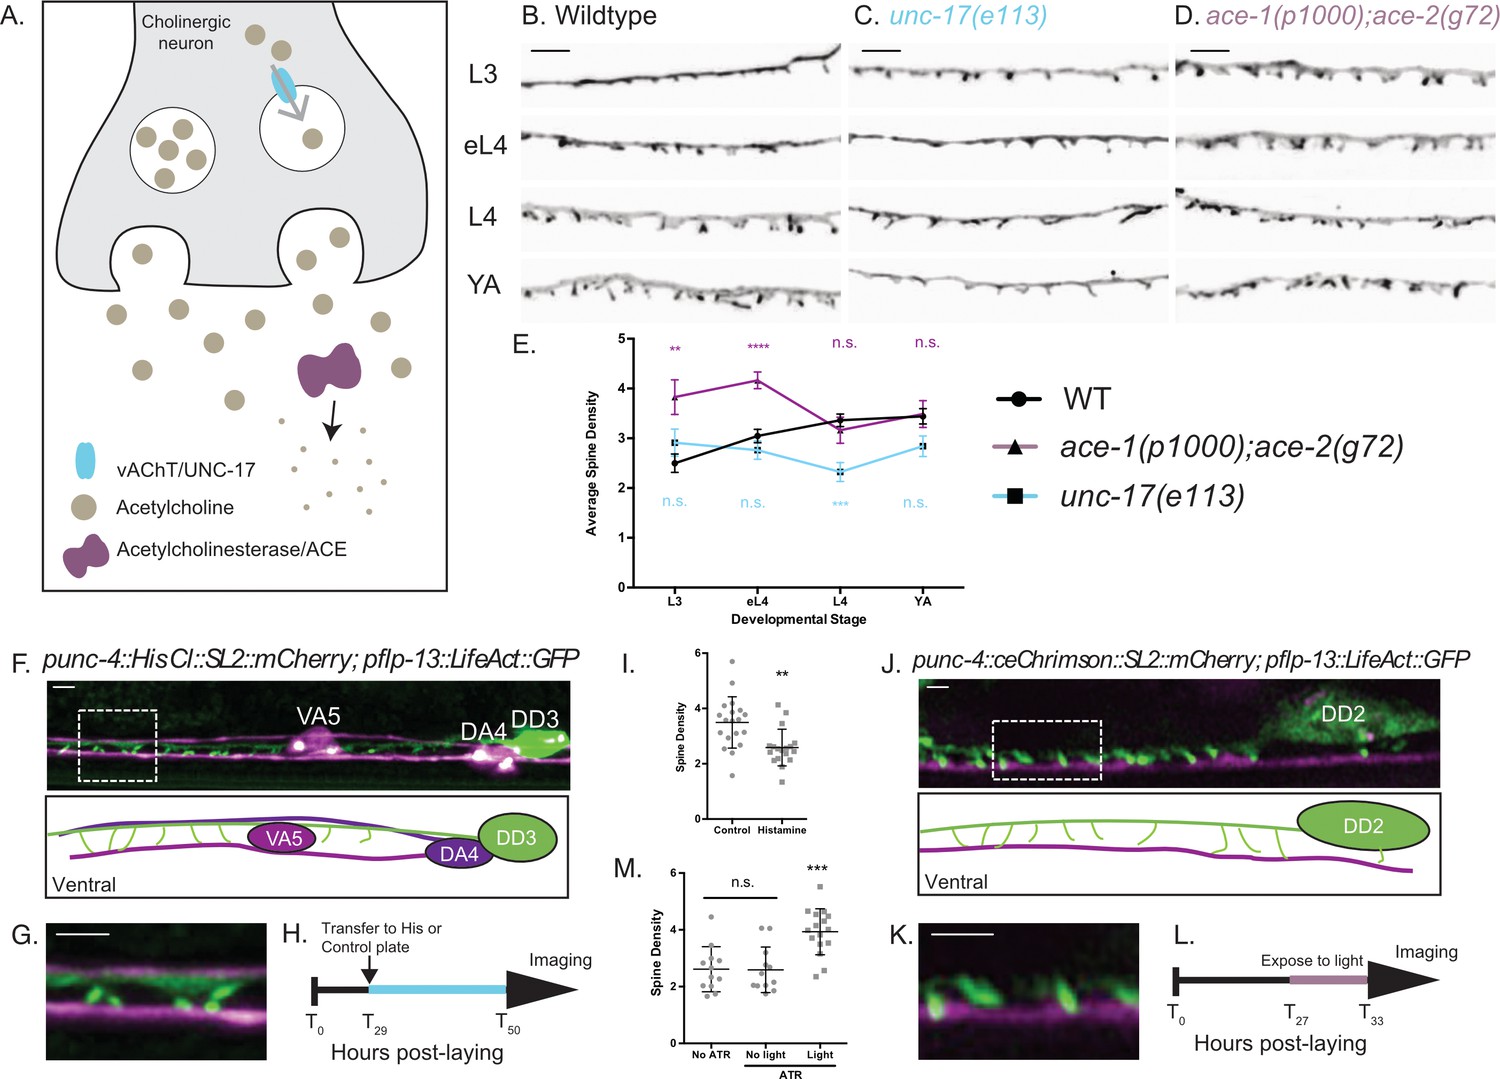
Cholinergic activity regulates spine density during development.
(A) Synaptic vesicles are loaded with acetylcholine (ACh) by the vesicular acetylcholine transporter (vAChT/UNC-17). Acetylcholinesterase enzymes (ACE) degrade synaptic ACh. (B–E) Spine density increases throughout development in the wild type (WT) but not in unc-17(e113) mutants whereas spine density is precociously elevated in ace-1(p1000);ace-2(g72) mutants. Representative images of (B) WT, (C) unc-17 (e113) and (D) ace-1(p100); ace-2(g72). Scale bars = 2 µm. See Figure 5—figure supplement 1 for scatter plots for (E). (F–I) Reduced ACh signaling in cholinergic motor neurons decreases postsynaptic spine density. (F) Expression of Histamine-gated Chloride channels and mCherry in cholinergic (VA and DA) motor neurons (punc4::HisCl::SL2::mCherry) (Pokala et al., 2014) vs DD motor neurons labeled with LifeAct::GFP shows (G) DD spines (green) extending to the ventral process of the VA5 motor neuron (magenta). Note dorsal placement of DA4 axon. (H) Synchronized L2 larvae were transferred to either histamine or control plates at T29 (hours post-laying) for growth up to the L4 stage (~T50), See Materials and methods. (I) DD spine density at the L4 stage is reduced by growth on histamine (2.58 ± 0.6) vs control (3.49 ± 0.9). T-test, **=p < 0.01, n > 17. Scale bars = 1 µm. (J–M) Temporal activation of A-class cholinergic motor neurons increases spine density. (J) Cholinergic motor neurons (e.g., VA4) express ceChrimson (Schild and Glauser, 2015) and mCherry (punc4::ceChrimson::SL2::mCherry). LifeAct::GFP marks DD2. (K) DD spines (green) extend ventrally toward VA process (magenta). (L) Synchronized L2 stage larvae (T27, hours post-laying) were transferred to ATR or control plates (see Materials and methods) for 6 hr (until T33,~L3 stage) and exposed to red-light pulses vs control group grown in the dark. (M) Exposure to red-light for 6 hr elevates spine density at the L3 stage (3.9 ± 0.8) vs control (2.59 ± 0.8). T-test, *** is p<0.001, n > 10. Scale bars = 1 µm.
-
Figure 5—source data 1
Figure 4_Intrinsic Ca.
- https://doi.org/10.7554/eLife.47918.026
Figure 5—figure supplement 1
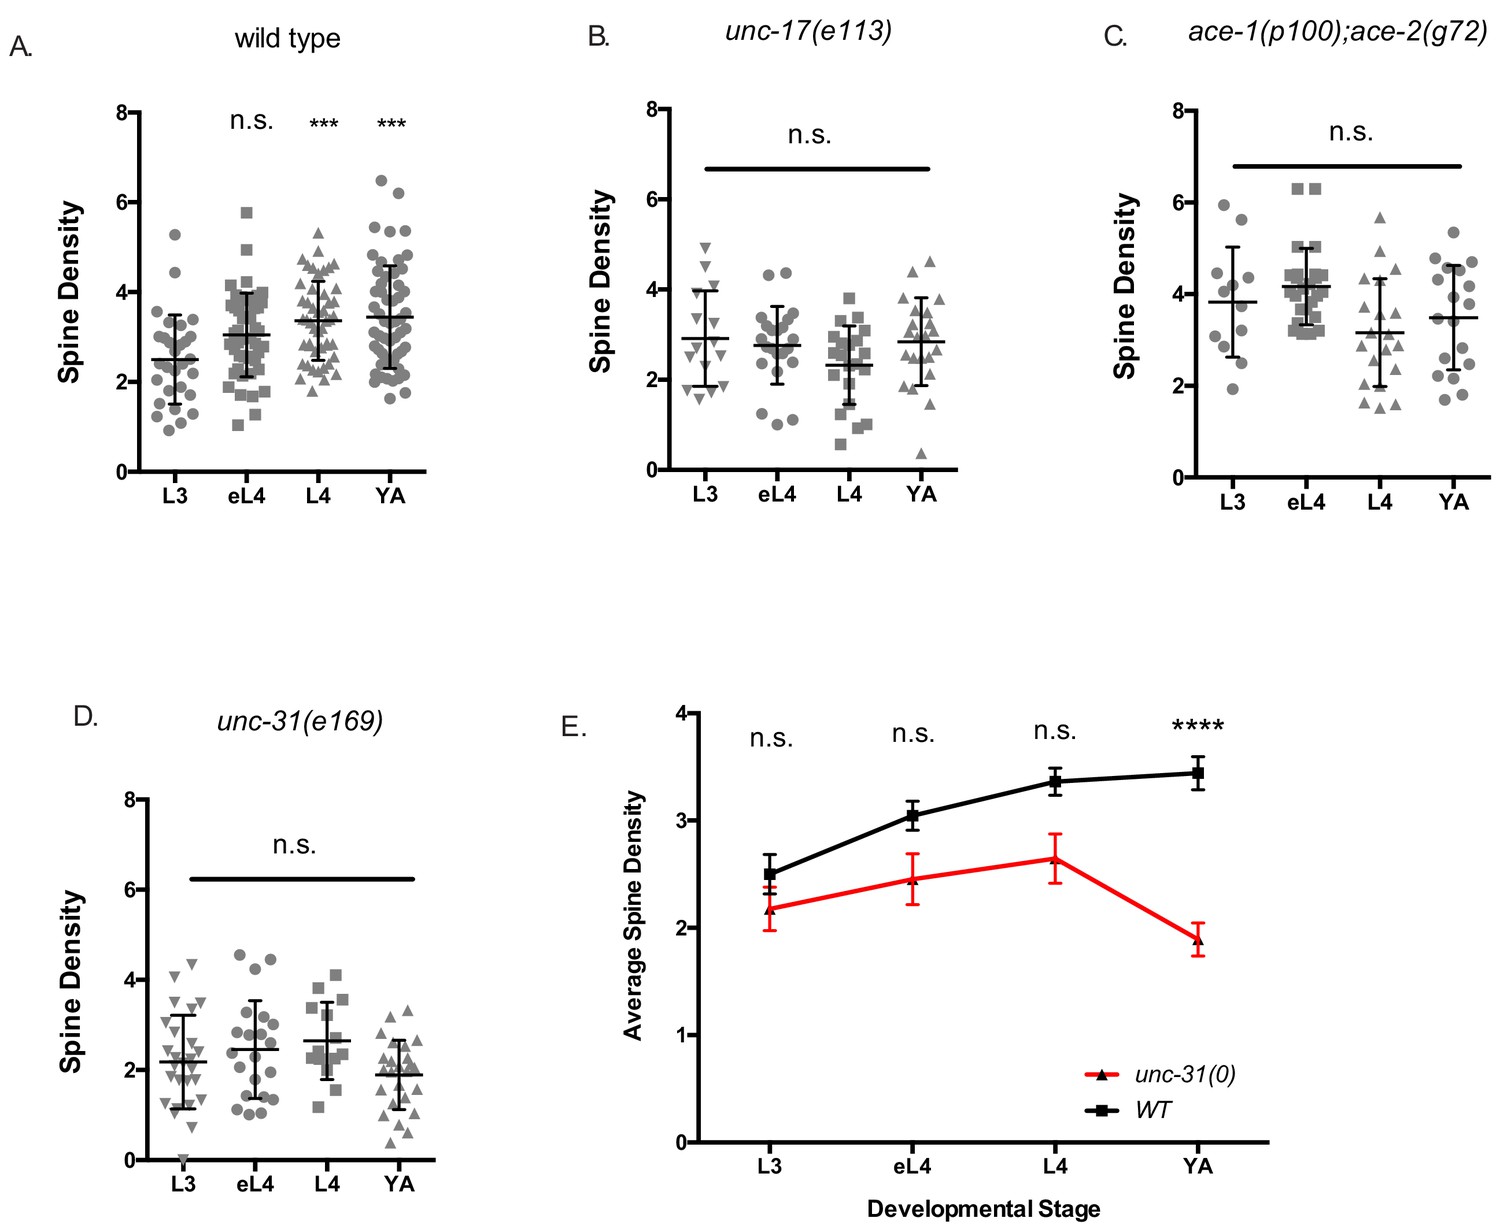
Synaptic activity regulates postsynaptic DD spine density.
(A) Spine density (spines/10 µm) increases throughout development in the wild type (WT). L3 (2.5 ± 0.9), (early L4) eL4 (3.1 ± 0.9), L4 (3.4 ± 0.9) and (Young Adult) YA (3.4 ± 1.1). One-way ANOVA of all groups vs L3 shows that spine densities at L4 and YA stages are different from L3. *** is p<0.001. Data for YA are the same as in Figure 1F and S1A for wild-type LifeAct::GFP. (B) Spine density (spines/10 um) does not increase during development with reduced cholinergic signaling in unc-17(e113). L3 (2.91 ± 1.0), eL4 (2.76 ± 0.9), L4 (2.32 ± 0.87) and YA (2.84 ± 0.9). One-way ANOVA of all groups against L3 stage shows no statistically significant difference during development. (C) Spine density (spines/10 µm) is elevated throughout development in acetylcholinesterase deficient ace-1(p100);ace-2(g72) mutant animals. L3 (3.83 ± 1.2), eL4 (4.17 ± 0.8), L4 (3.16 ± 1.2) and YA (3.49 ± 1.1). One-way ANOVA of all groups against L3 stage shows no statistically significant difference during development. (D) Spine density (spines/10 µm) does not increase during development in unc-31(e169) mutants with impaired dense core vesicle release L3 (2.18 ± 1.0), eL4 (2.45 ± 1.1), L4 (2.65 ± 0.9) and YA (1.89 ± 0.8). One-way ANOVA of all groups against L3 stage shows no statistically significant difference during development. (E) Spine density (spines/10 µm) does not increase during development in unc-31(e169) and shows lower spine density than wild type (WT) at the Young Adult (YA) stage. T-test at each timepoint between genotypes, **** is p<0.0001. Measurements are mean ± SD.
Figure 5—figure supplement 2
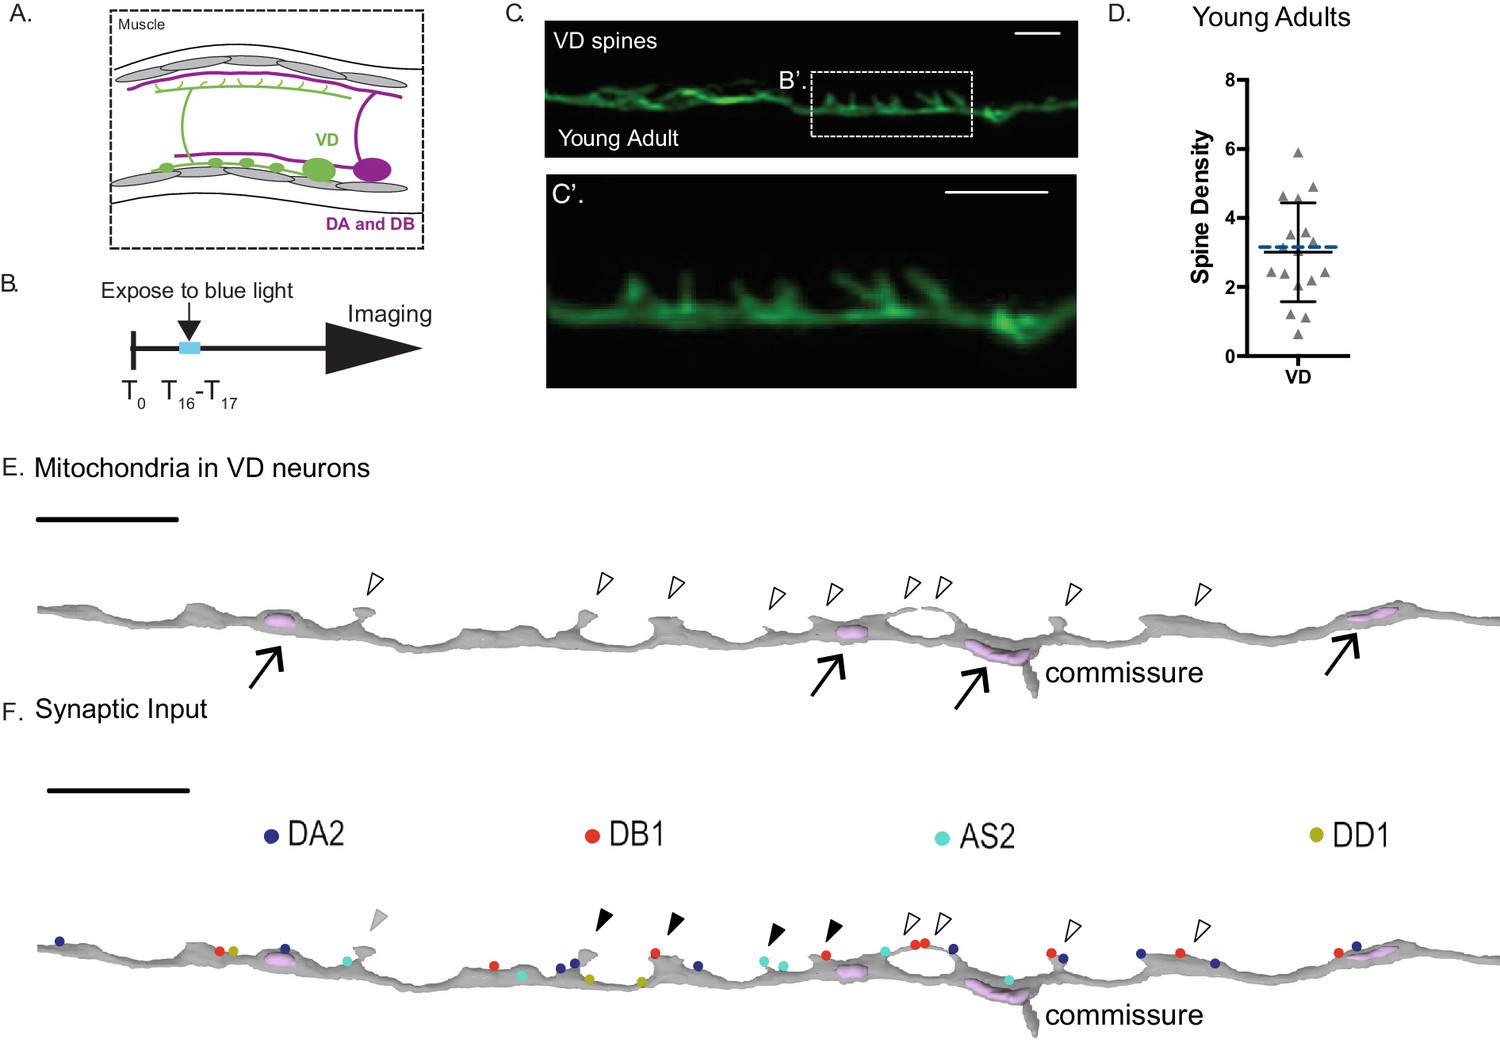
Ventral D-GABAergic motor neurons have dendritic spines.
(A) VD motor neurons (green) are located in the ventral nerve cord. In the adult, VD presynaptic boutons (oblong ovals) innervate ventral muscles (gray cells) and VD postsynaptic termini (spines) receive cholinergic input from DA and DB motor neurons (magenta) on the dorsal side. (B–D) GABAergic VD neurons show dendritic spines. GABA neurons were labeled with LifeAct::GFP (Punc-25::LifeAct::GFP) and DD neurons expressed miniSOG (Pflp-13::miniSOG::SL2::BFP). (B) Synchronized L1 larvae were exposed to blue light for 45 min during T16-T17 (hours after egg laying) to ablate DD neurons and maintained at 20°C until the adult stage. (C) Airyscan imaging of the dorsal cord in young adults (T60) (hours after egg laying) shows spine-like protrusions on VD neurons. (C’) Inset from (C). Scale bars = 1 µm. (D) VD spine density (3.01 ± 1.43 spines/10 µm), n = 17. Dashed blue line represents spine density detected in VD2 with 3D EM (3.33 spines/10 µm). (E) 3D EM reconstruction shows mitochondria in the shaft of VD dendrites (arrows) but not in VD spines (clear arrowheads). (F) Volumetric EM reconstruction of a portion of the VD2 dendrite (27 µm) in the dorsal nerve cord (gray) detects contacts with 36 presynaptic termini from axons of the cholinergic (DA, DB or AS) and GABAergic (DD) motor neurons. 50.0% (n = 11/22) of DA and DB inputs are adjacent to VD spines. 44.4% (4/9) of spines directly oppose a single presynaptic partner (black arrowhead) or more than one terminal (clear arrowhead). One VD spines does not appose any presynaptic density (gray arrowhead). Scale bar = 2 µm.
Videos
Video 1
In vivo spine dynamics.
A thin spine extends a lateral projection to form a branched spine. Snapshots are displayed in Figure 1J. Pseudo-colored with Rainbow Dark LUT.
Video 2
LifeAct::GFP dynamics.
LifeAct::GFP fluorescence at DD spines (white arrows) fluctuates between bright and dark signals. Asterisk labels DD cell body and yellow arrow labels transient protrusion and commissures. Scale bar = 5 µm. Pseudo-colored with Rainbow Dark LUT.
Video 3
Cytosolic mCherry dynamics.
Cytosolic mCherry at DD spines (white arrows) shows modest changes in fluorescence over time. Yellow arrows label transient protrusions and commissures. Scale bar = 5 µm. Pseudo-colored with Rainbow Dark LUT.
Video 4
DD1 dendritic spine receives input from cholinergic neurons.
3D EM reconstruction shows that a single DD spine (gray) contacts presynaptic terminals of VA (blue) and VB (pink) neuron. Muscle arms labeled in green.
Video 5
3D EM reconstruction of DD1 dendrite.
DD1 dendrite (gray) has dendritic spines that contain ER (yellow) but no mitochondria (pink).
Video 6
Intrinsic Ca++ waves in DD spines.
GCaMP6s (green, center panel) detects spontaneous Ca++ transients in the DD1 dendritic shaft and spines (arrows). Note the relatively constant cytosolic mCherry signal (magenta, left panel) GCaMP6s and mCherry signals are merged in the right panel. Scale bar = 2 µm. Pseudo-colored with Rainbow Dark LUT.
Video 7
Cholinergic activation triggers Ca++ transients in DD spines.
Three examples of GCaMP6s changes recorded with activation of cholinergic neurons every 2.5 s (pink circle) on ATR-grown worms. Scale bar = 2 µm. Pseudo-colored with Rainbow Dark LUT. Arrows denote spines.
Video 8
Cholinergic activation does not trigger large changes in cytosolic Ca++ in DD spines in the absence of ATR.
Three examples of GCaMP6s changes recorded after activation of cholinergic neurons every 2.5 s (pink circle) in control worms grown in the absence of ATR. Scale bar = 2 µm. Pseudo-colored with Rainbow Dark LUT. Arrows denote spines. Asterisk (left panel) marks DD neuron soma.
Video 9
Local cholinergic activation triggers Ca++ transients in neighboring spines.
Top: Activation of cholinergic neurons at a single spine (white arrow) triggers Ca++ changes at adjacent (red arrow) and distant spines (yellow). ceChrimson::SL2::3xNLS::GFP labels DA and VA nuclei in green (black asterisks). The DD1 cell soma is labeled. Scale bar = 5 µm. Bottom: Traces of local Ca++ changes at excited (red), adjacent (white) and distant (yellow) spines over time. Vertical yellow bar denotes the 561 nm excitation window. Note that GCaMP6s signals during the period of 561 nm excitation are interpolated from signals measured immediately before and after excitation.
Additional files
-
Transparent reporting form
- https://doi.org/10.7554/eLife.47918.027
Download links
A two-part list of links to download the article, or parts of the article, in various formats.
Downloads (link to download the article as PDF)
Open citations (links to open the citations from this article in various online reference manager services)
Cite this article (links to download the citations from this article in formats compatible with various reference manager tools)
C. elegans neurons have functional dendritic spines
eLife 8:e47918.
https://doi.org/10.7554/eLife.47918


