A microfluidic device for inferring metabolic landscapes in yeast monolayer colonies
- UMR 7057 CNRS and Université de Paris, France
- U1001 INSERM, France
- Université de Paris, France
- ETH Zürich, Switzerland
- Eawag, Switzerland
Figures
Figure 1 with 2 supplements
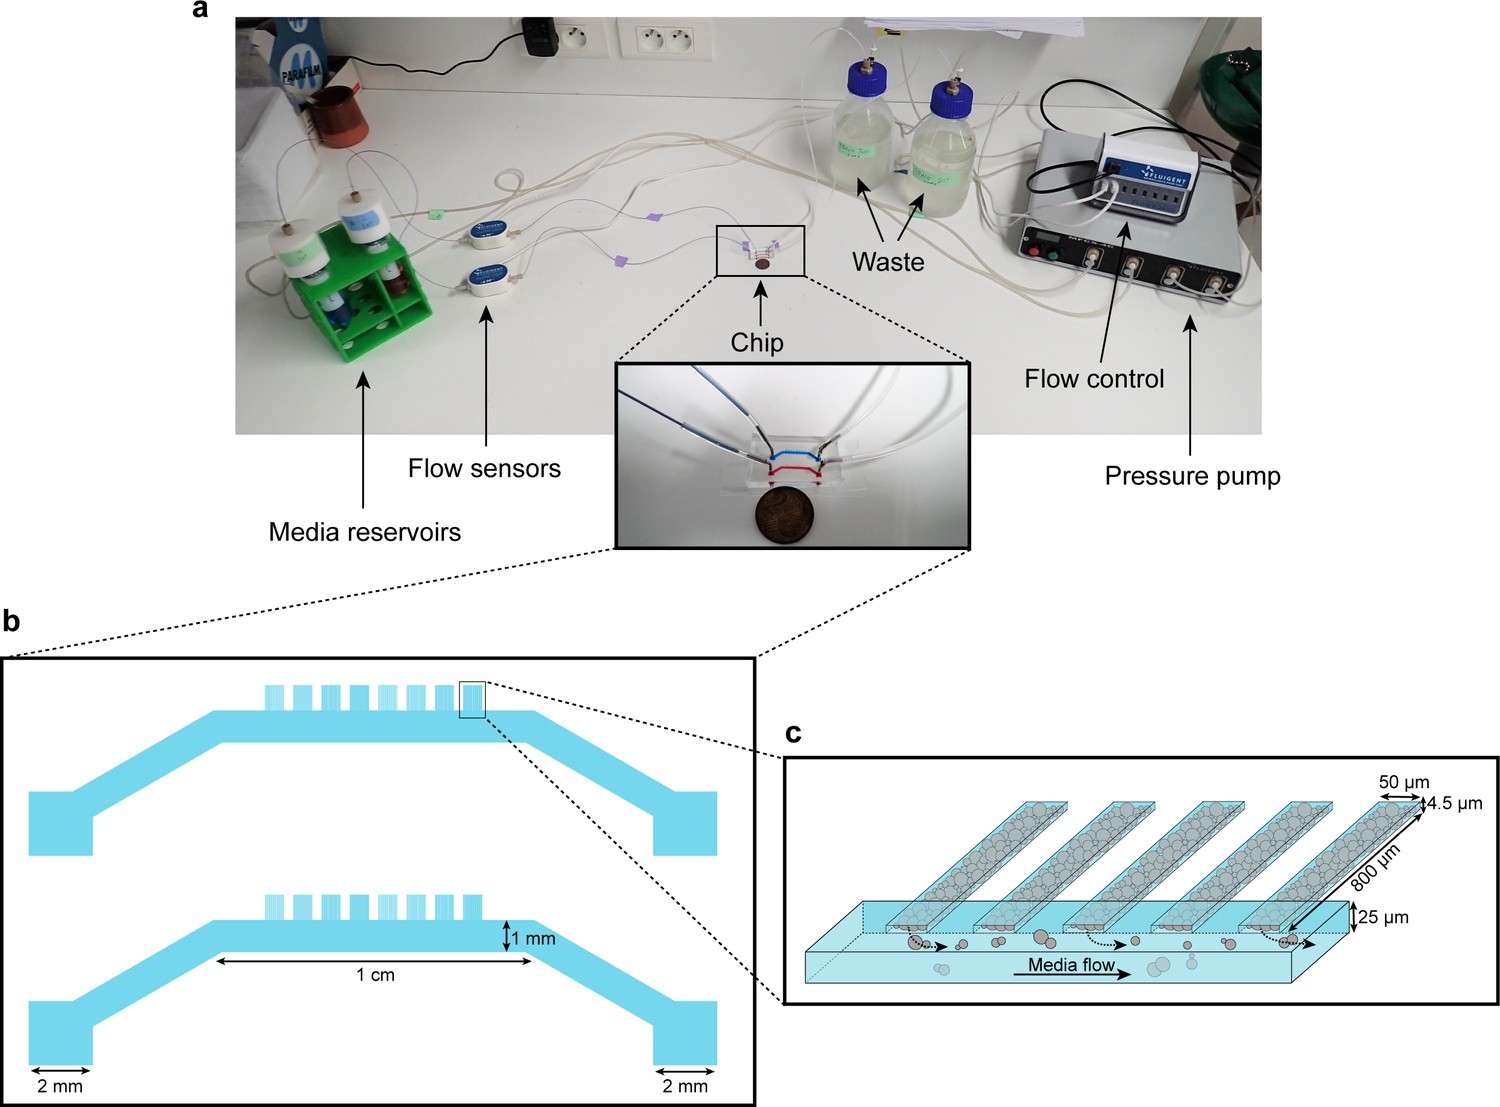
Microfluidic device setup and design.
(a) Media reservoirs are pressurized with the help of Fluigent MFCS pressure pump resulting in flow through the flow sensors, into the chip and then to waste. Flow sensors and pressure pump are connected to the flow-rate control module, which maintains a constant flow through the system. Nutrient supply and media conditions can be changed in real time. (b) Each single ‘yeast machine’ has two sets of cell chambers of various widths (5 µm, 10 µm, 25 µm and 50 µm). The Cell chambers are connected perpendicularly to a large flow channel (1 mm wide, 25 µm high). This design facilitates adaptation for different model systems (e.g. bacteria, yeast, mammalian cells) and high-throughput depending on the of predefined flexible length, width and height flexible adapted dimensions. (c) A close-up sketch of a set of cell chambers used in our experiments. They are 800 µm long, 50 µm wide, and 4.5 µm high. A single cell chamber fits a monolayer of up to 2500 yeast cells. The whole setup is mounted on a microscope for time-lapse fluorescent imaging.
Figure 1—figure supplement 1
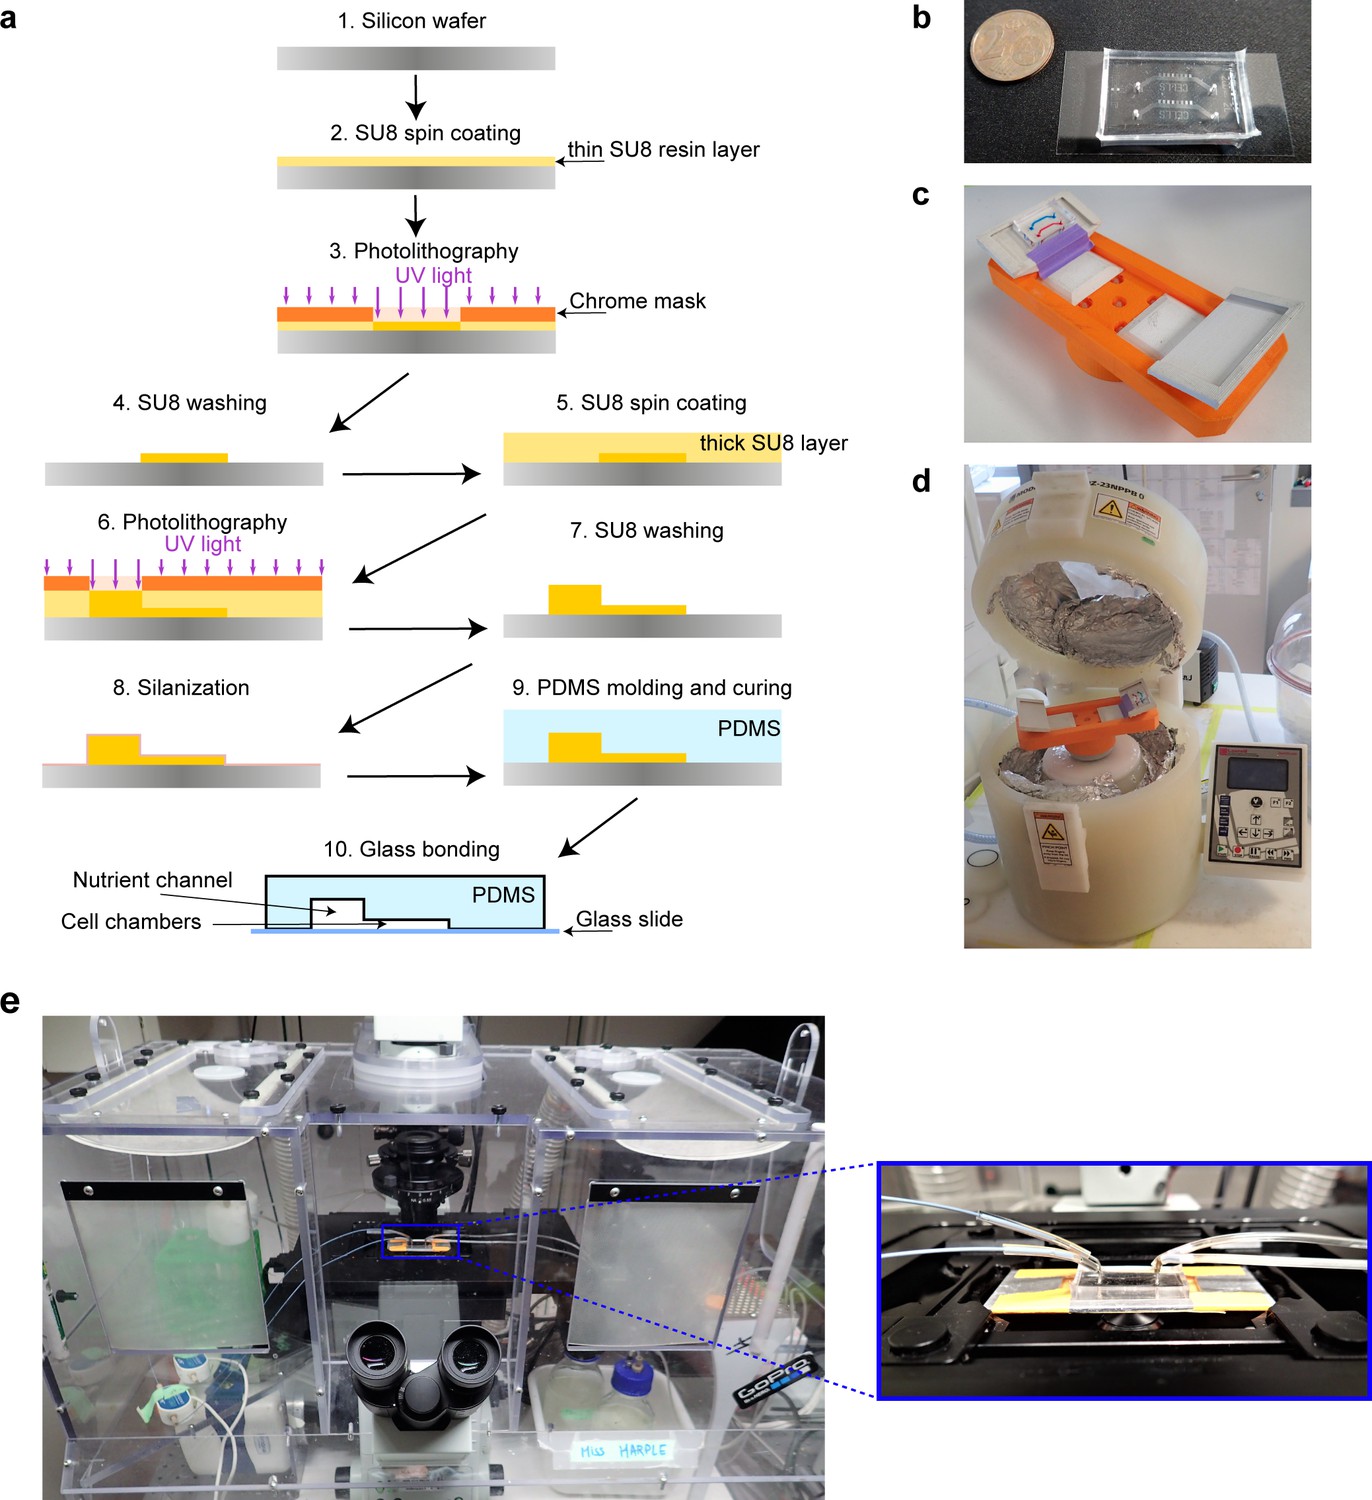
Experimental Details.
(a) Microfluidic device fabrication. Epoxy-based resin is spread on a silicon wafer and illuminated with the UV light through a custom designed chrome mask. Soluble part of the resin is washed off and a new cycle of resin deposition can be made depending on the number of layers of the microfluidic device. The master wafer is silanized and used as a re-usable negative mold to produce microfluidic chips. Polydimethylsiloxane (PDMS) is then poured on the master wafer and cured until it is polymerized. The PDMS chip is bonded with a glass coverslip by plasma bonding. The final microfluidic chip is used to grow cells and deliver nutrients. The thinner parts are the cell chambers, and the thicker part is the main nutrient channel. (b) Microfluidic chip bonded to a cover slip. Each chip has two independent ‘yeast machines’. (c) 3D printed chip holder for centrifugation with the chip mounted on it (channels are colored with different dyes for better visualization). (d) Spin coater that is used for centrifugation of cells into the cell chamber. (e) Microfluidic chip mounted on a microscope.
Figure 1—figure supplement 2

Detailed cell chamber view.
Cell chambers of the ‘yeast machine’ at high magnification in different starting glucose concentrations. Cells are vertically constrained to facilitate single-cell imaging and time-lapse fluorescence microscopy.
Figure 2 with 2 supplements
Expansion and dynamics of extended cellular monolayers.
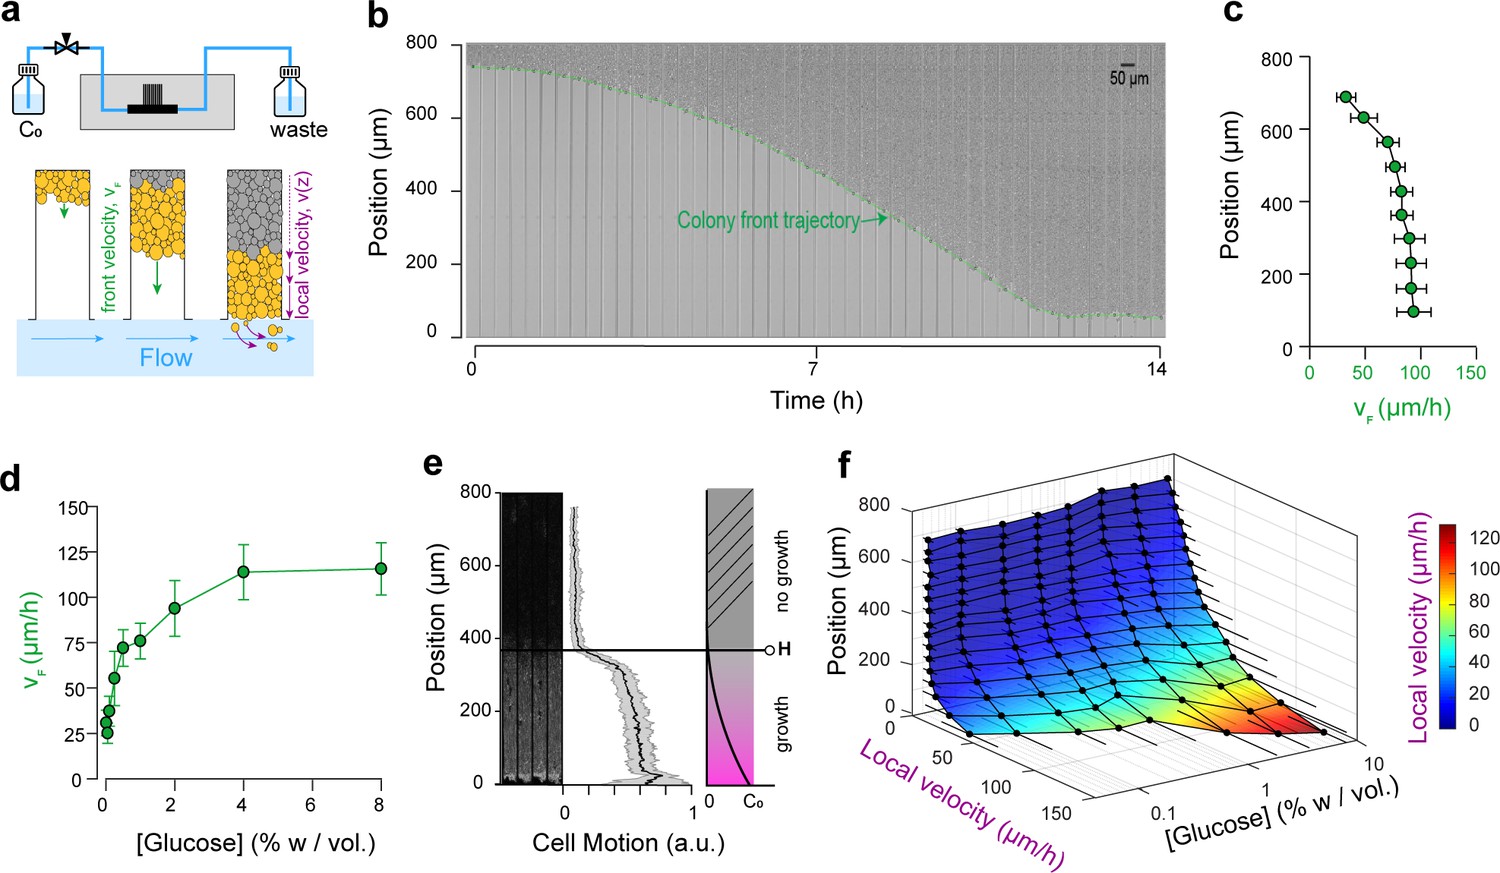
(a) The microfluidic device is perfused with nutrients using a pressure-driven system (see Figure 1). Yeast monolayers extend within the long chambers: front velocity (VF) and local velocity (Vz) are determined by cellular growth and division. (b) Example of a time-lapse collage of yeast monolayer expansion along an 800 µm-long chamber (2% w/vol. glucose, 5 × amino acid concentration). Front velocity increases and reaches a plateau (indicated by flattening of the slope of the green curve). When the front approaches close to the open end of the chamber (i.e., 0 µm), the over-spilling cells are constantly washed away by the nutrient flow within the main channel. ( c) Front velocity reaches a maximum when the position of the front becomes close to the open end of the chamber indicating that after expanding by a typical distance (~400 µm here for 2% w/vol. glucose), the maximal number of cells that receive glucose and can participate in expansion has been reached. 340 velocity data points binned into 10 equally spaced position points were extracted from n = 12 colony front trajectories (2% w/vol. glucose). The error bars denote standard deviations of each bin (~15–30 velocity data points). (d) Front velocity as function of external glucose concentration. Data comes from the bin closest to the open end of the chamber as measured in Figure 2c for each glucose concentration (n > 5). Error bars denote standard deviations. (e) Local cellular motion can be assessed by computing the standard deviation of pixel intensities across a stack of time-lapse images. Here, white areas indicate variations in movement across the time-lapse for cells below 400 µm, while the cells above do not move. Averaging over several channels (n = 9), we obtained an indicator of cell motion and thus an estimate of the glucose penetration distance, H (~400 µm for 2% glucose). (f) Local velocity decreases for cells deeper within the chamber. Local velocity also increases with external glucose concentration. Velocity Data, that were binned into 16 equally spaced position, comes from the analysis of >100 cell trajectories. Error bars denote standard deviations.
Figure 2—figure supplement 1
Comparison of front velocity and local velocity under low and high amino acid concentrations.
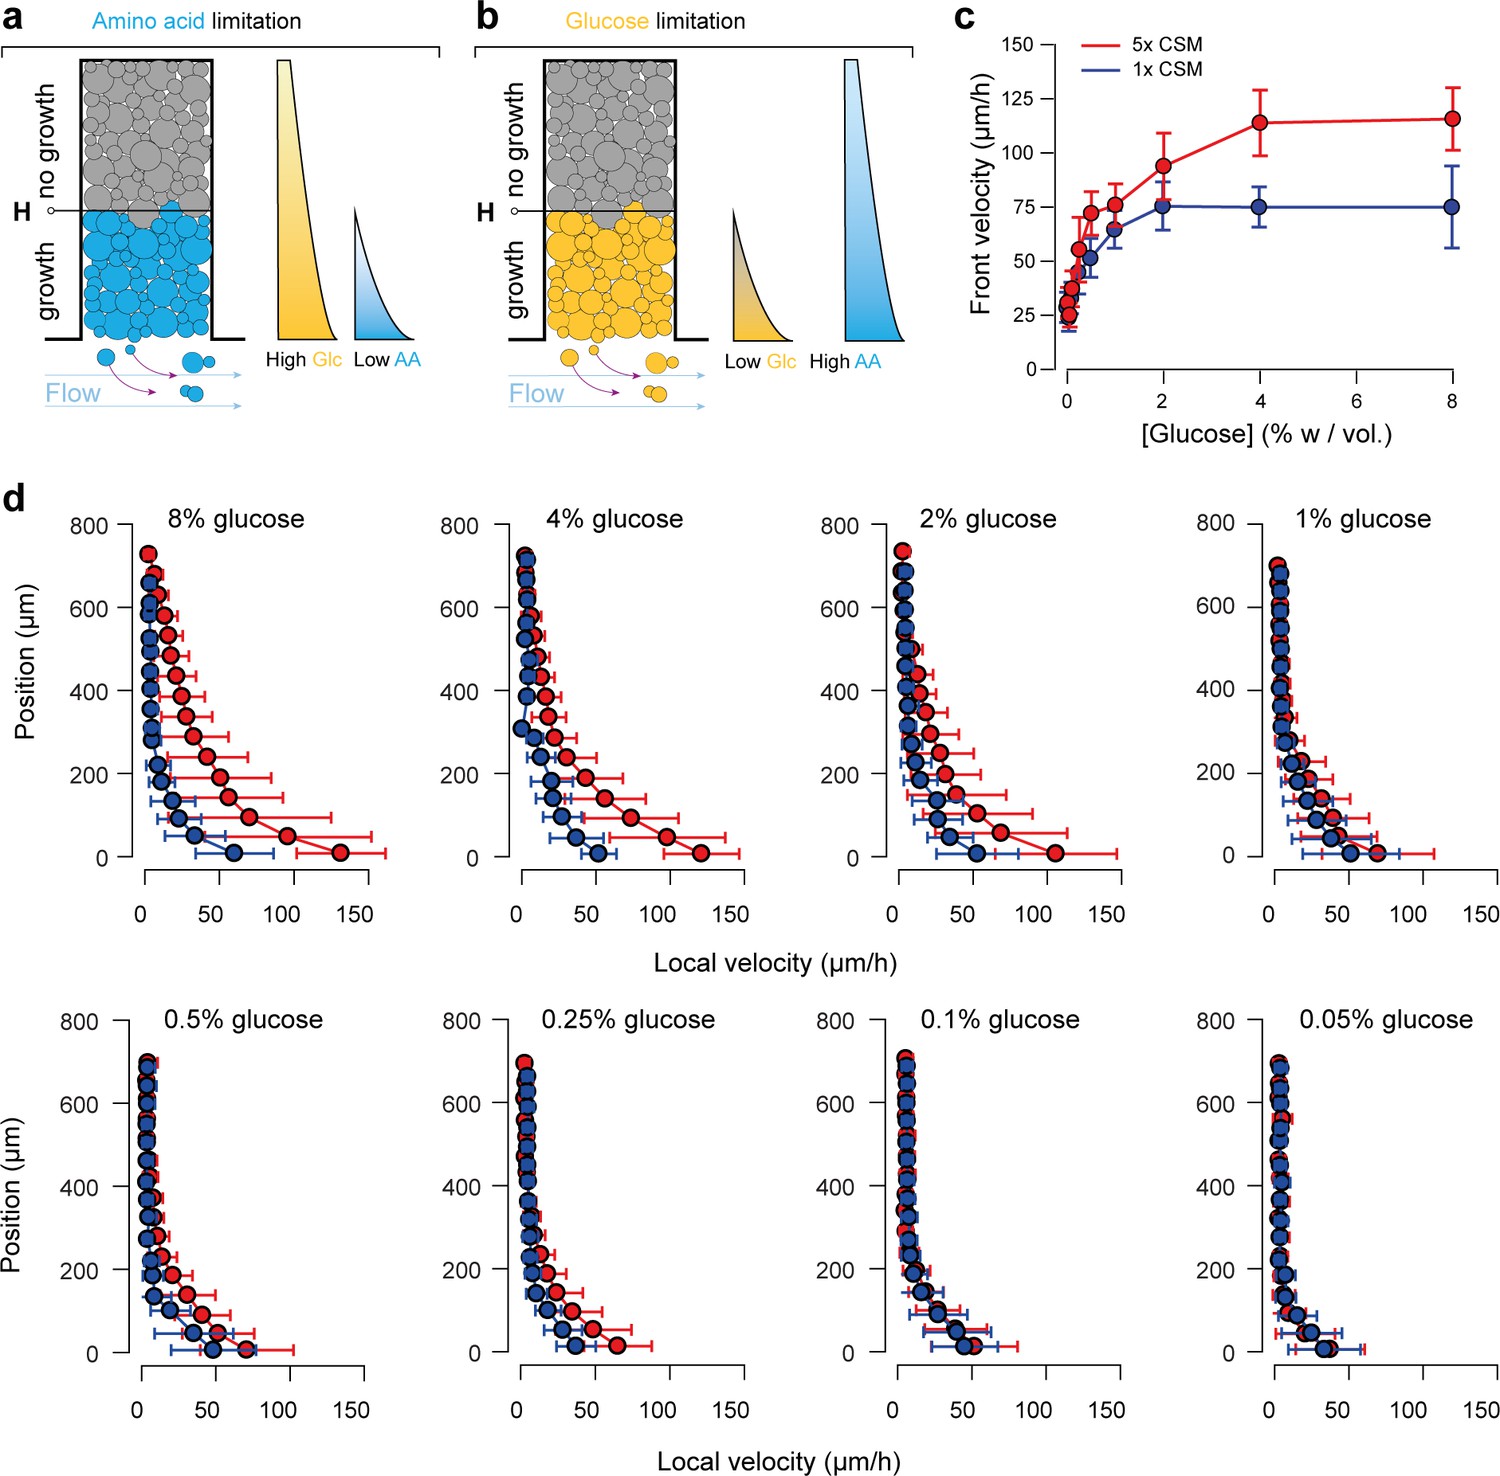
(a-b) If not present in excess, amino acids can also limit growth of cells. Indeed, cells generate spatial gradients for all nutrients and metabolites in their microenvironment. The tradeoff between diffusion of a molecule and its uptake rate defines the properties of the gradient, thus gradients are expected to vary from one nutrient to another. In this setting, glucose and amino acids are important nutrients that can limit growth if present at too low concentrations. Glucose is required as a carbon source and the media must be supplemented with amino acids as the strain is an auxotroph. To determine the importance of amino acid concentration, we reduced the amino acid concentration to the standard concentration of SC media (called 1 × CSM in the main text). (c) The front velocity was lower at high glucose and low amino acid concentrations than in the case with high glucose and high amino acid concentrations. There was no significant difference up to about 1% w/vol (55.5 mM) glucose. Above that glucose concentration, front velocities increased with the glucose concentration at a high amino acid concentration (5 × CSM), whereas front velocity levels off at a low amino acid concentration (1 × CSM). Data comes from the bin closest to position 0 µm as measured in Figure 2c for each glucose concentration. Depending on the glucose concentration, minimum 5 to maximum 12 trajectories were measured (n = 5–12). Represented are means and standard deviations that contain ~15- ~ 30 velocity points each. (d) The same effect was observed for local velocities. There was almost no distinction between local velocities as the source concentration of glucose increased up to about 1% w/vol (55.5 mM), but the difference in local velocities was striking at higher glucose concentrations. Taken together, this means that glucose is the limiting nutrient in both 1 × and 5 × amino acid media, up to a glucose concentration of about 1% w/vol (55.5 mM). For the case of 5 × amino acid concentration, glucose remains the limiting factor for glucose concentrations used in this study. Data comes from >100 trajectories, depending on different glucose concentration. Velocity datapoints were then binned into 16 equally spaced position points. Represented are means and standard deviations of each bin.
Figure 2—figure supplement 2
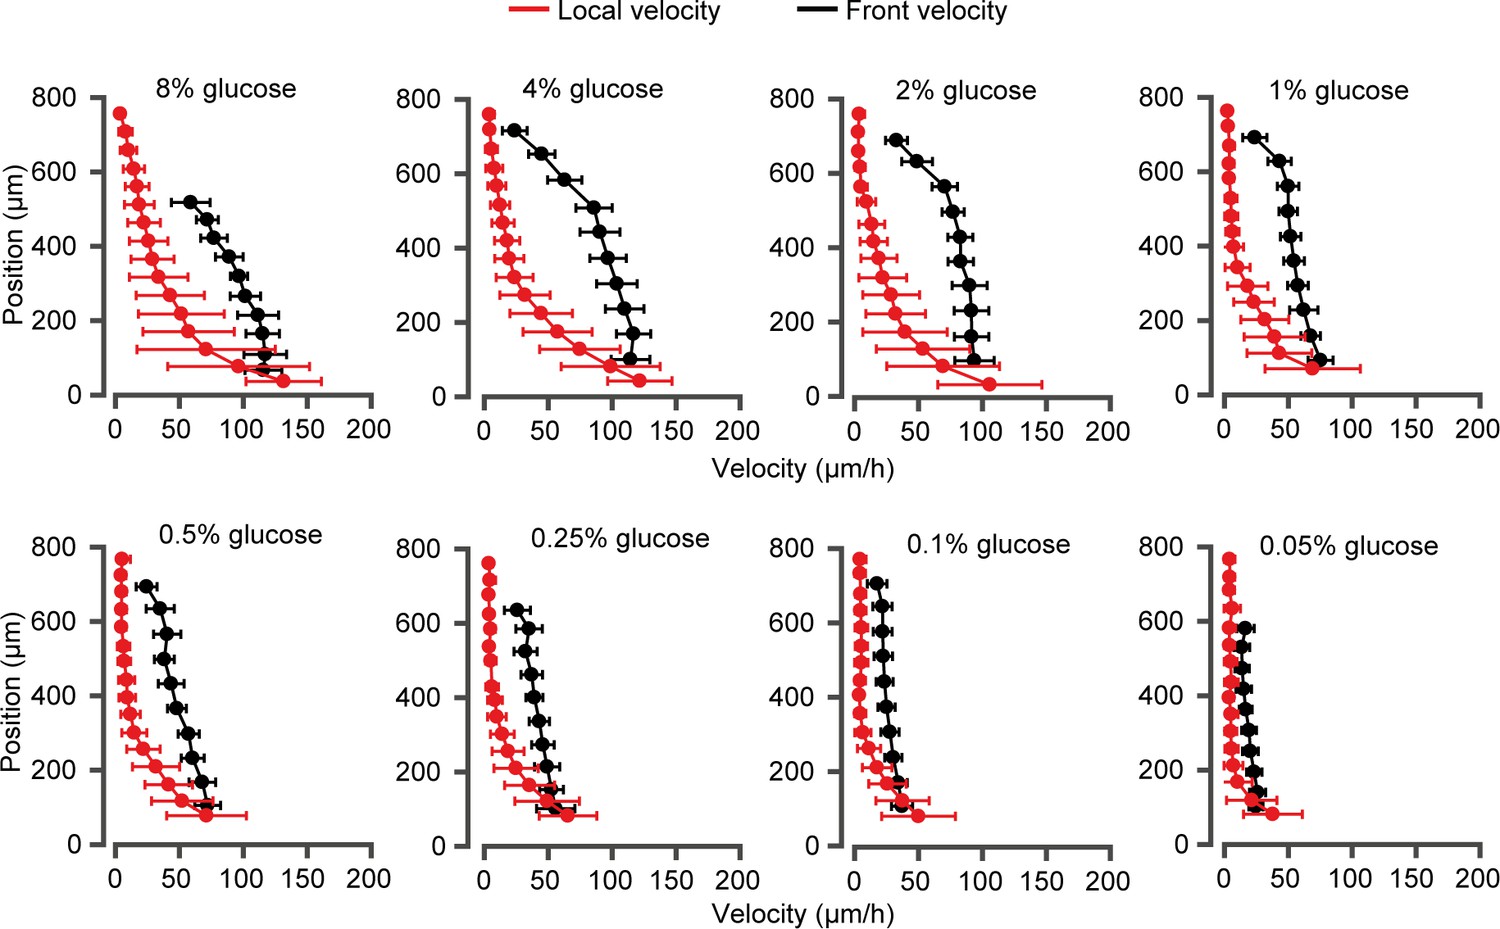
Local velocity and front velocity over a range of external glucose concentrations, C0.
Red data represent the local velocity field as a function of position inside a fully developed monolayer. Error bars are ± standard deviations computed for numerous single-cell trajectories (>100). Black data are the front velocity measured for an expanding yeast monolayer. Maximum front velocities are reported as function of glucose concentration in Figure 2. The maximum velocities for both measurements lie within the error bars.
Figure 3 with 3 supplements
Landscapes of gene expression self-emerge in extended yeast monolayers.
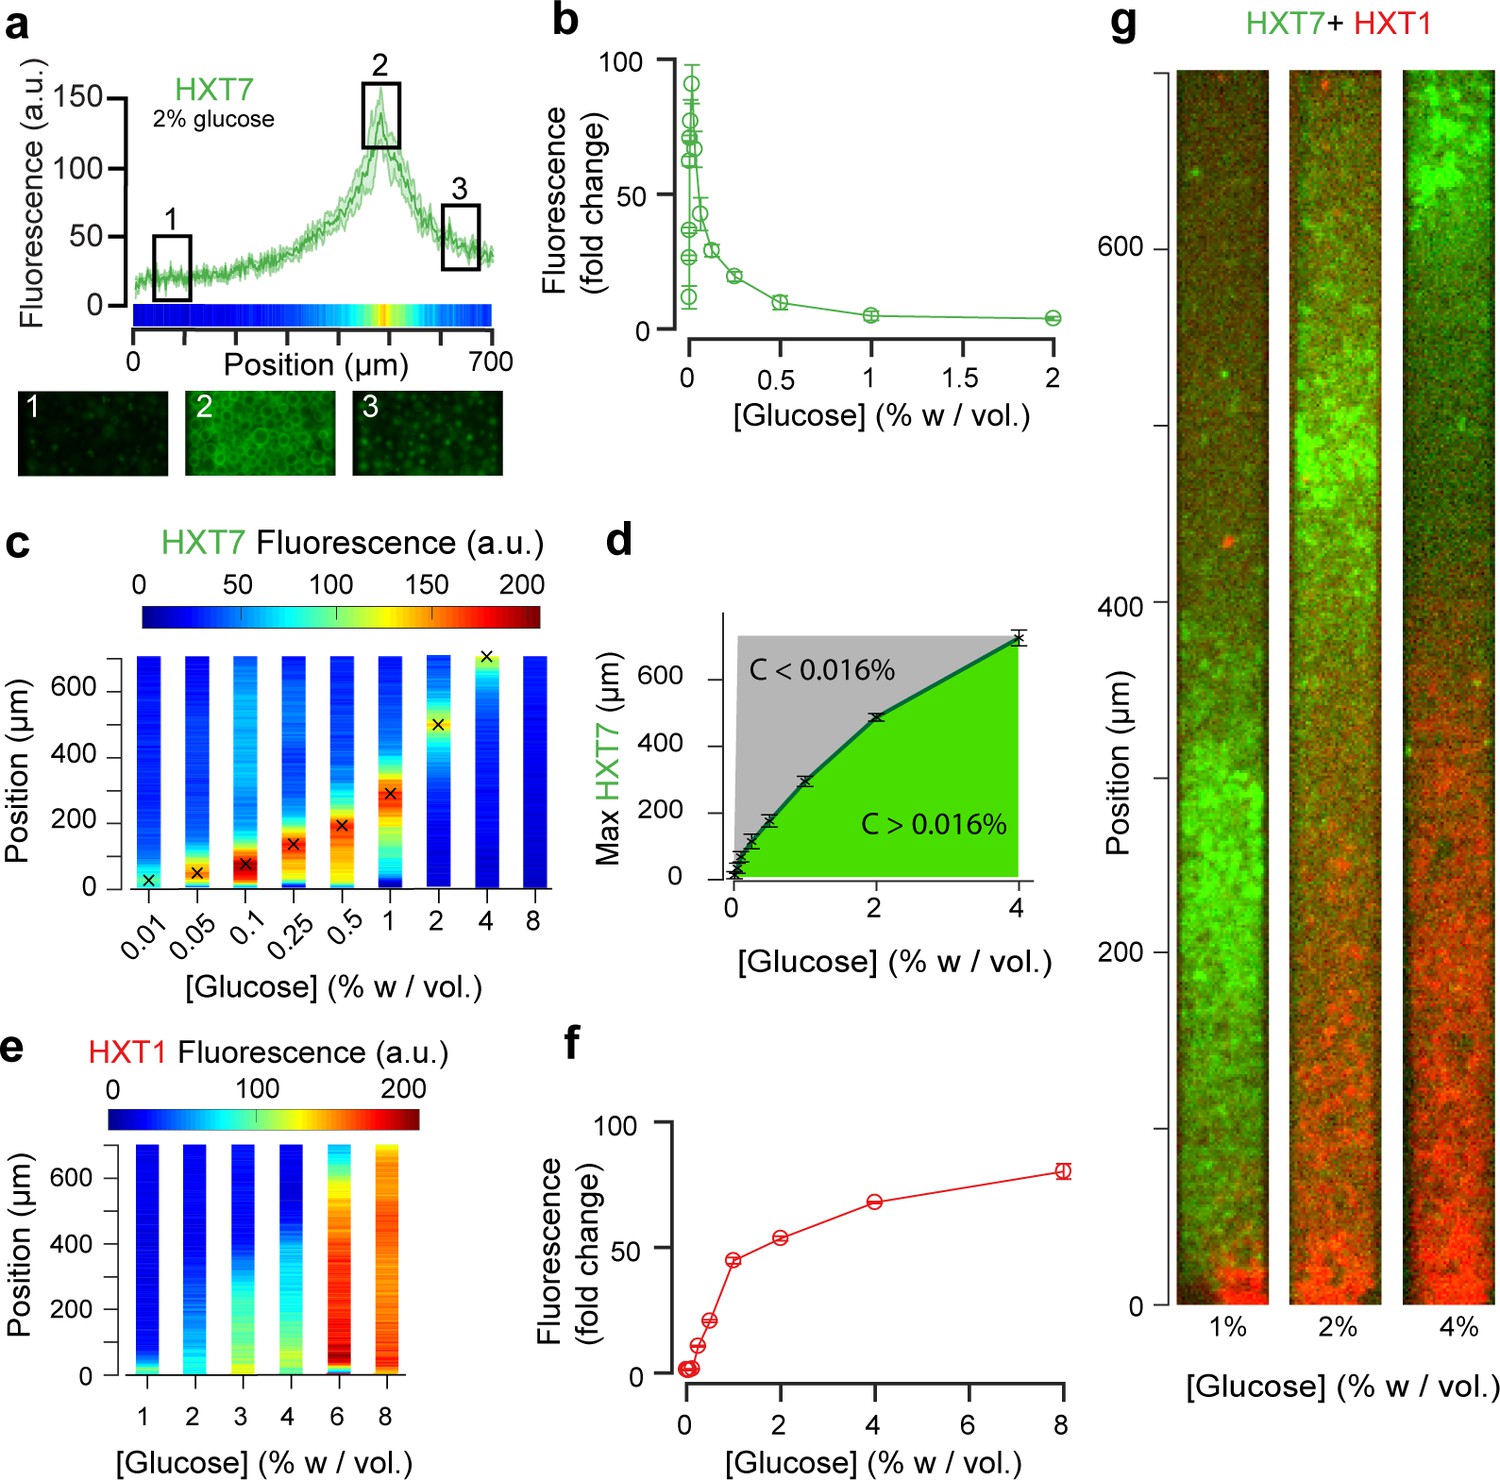
(a) Expression profile of HXT7-GFP along the chamber (average fluorescence levels, n = 9; standard deviation shown as the envelope) for an external concentration of 2% w/vol glucose. Membrane localization of HXT7 was only observed in the cells surrounding the area of peak HXT7 expression, localized at ~500 µm at 2% w/vol. glucose. (b) FACS measurements of HXT7-GFP expression in batch culture (average of three replicates) showing a single intensity peak at C0 = 0.016%. This peak value can be mapped back to the spatial landscape of 3a to infer the glucose concentration in the region of peak HXT7-GFP fluorescence. n = 3–6 per glucose concentration (c) On varying the glucose concentration in the nutrient channel, we observed a transition in peak HXT7-GFP fluorescence within the 2D colony. At a concentration of 4% w/vol and above, the peak was located close to the dead end of the chamber or not visible, indicating sufficient glucose was available throughout the chamber (color code normalized to maximal expression level). Data obtained from n = 8–17 replicates per glucose concentrations (see also Figure 3—figure supplement 2). (d) Compared with 3b, it is possible to roughly define areas of glucose presence in the monolayer for a range of glucose concentrations (n = 8–17, per glucose concentrations, error bars denote ± one standard deviation). (e) Landscape of HXT1-GFP gene expression over a range of glucose concentrations (color code normalized to maximal expression); n = 8–9 per glucose concentrations (Figure 3—figure supplement 3). (f) FACS measurements of HXT1-GFP over a range of glucose concentrations; n = 3 replicates. 3 g. Overlay of HXT1 (red) and HXT7 (green) gene expression landscapes at three external glucose concentrations, showing that the expression landscapes of these transporters were inversely correlated, in agreement with their different glucose-dependent expression patterns (compare 3b and 3 f).
Figure 3—figure supplement 1
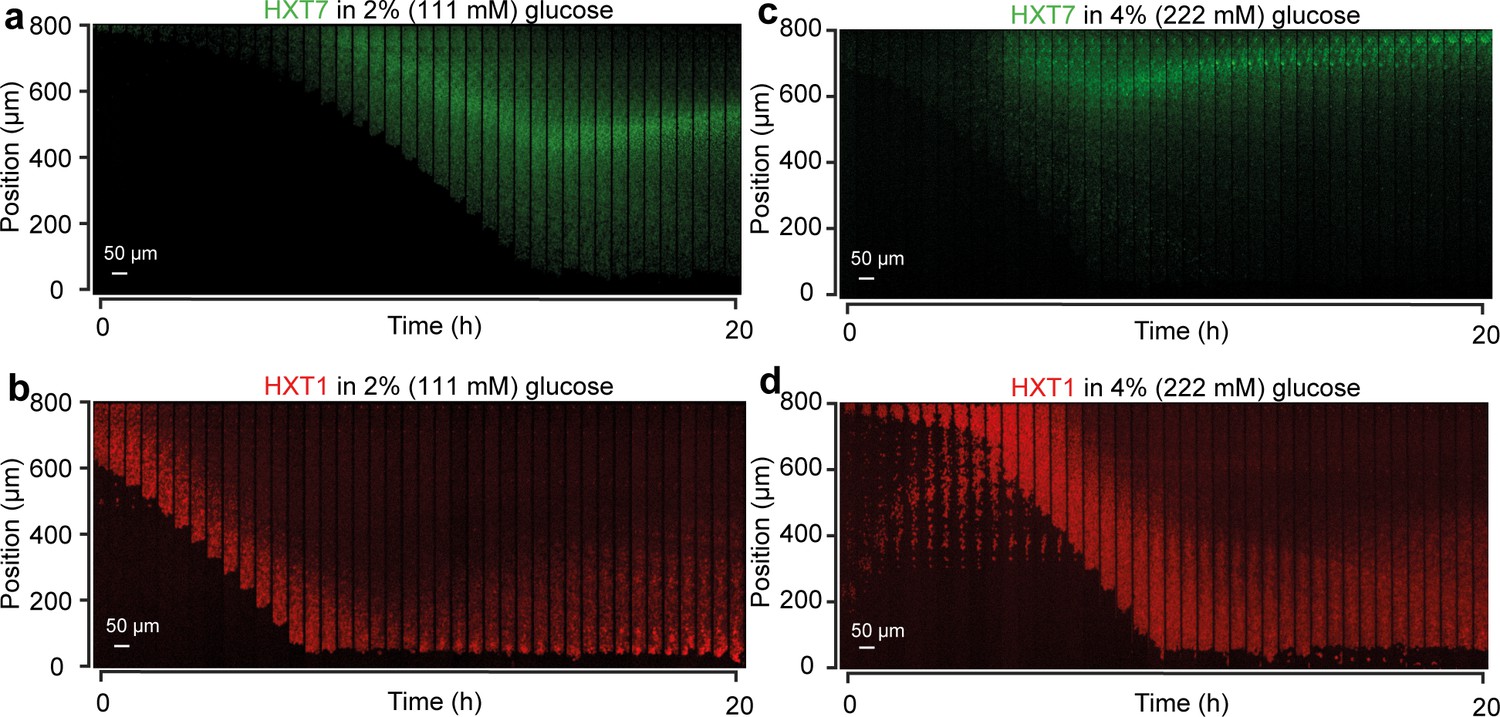
HXT1 and HXT7 landscape dynamics.
(a) Expansion of a monolayer of cells expressing HXT7-GFP with a boundary glucose concentration of 2% w/vol and 5 × CSM. One can observe the appearance of a peak of expression within sufficiently long monolayers. After some transient changes, the peak of expression reached steady-state position. (b) Same experiment but with HXT1-GFP (shown in red here and in the main article). The landscape of HXT1 evolved very slowly over time, probably as the result of slow changes in cellular physiology and aging of the monolayer. All landscape profiles shown in the main article were measured after 10 hr of growth as a fully developed monolayer. (c) HXT7-GFP landscape obtained for a 4% w/vol boundary glucose condition. The peak of expression is very close to the end of the chamber. (d) HXT1-GFP landscape obtained for a 4% w/vol boundary glucose condition. HXT1 landscape has a higher intensity and a deeper penetration than in b.
Figure 3—figure supplement 2
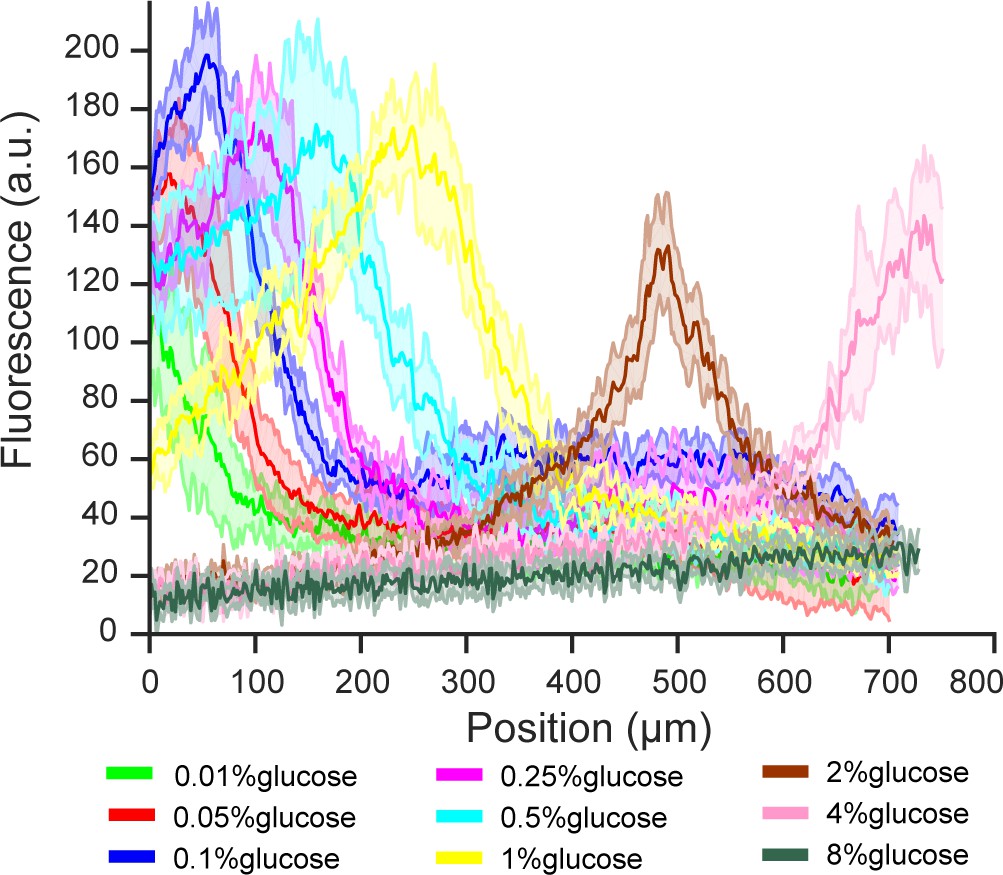
Extended figure of Figure 3c.
Gene expression of glucose transporter HXT7 in different glucose concentrations and high amino acid concentration (5x CSM). Data obtained from n = 8–17 replicates per glucose concentration. Shaded error bars denote ± one standard deviation.
Figure 3—figure supplement 3
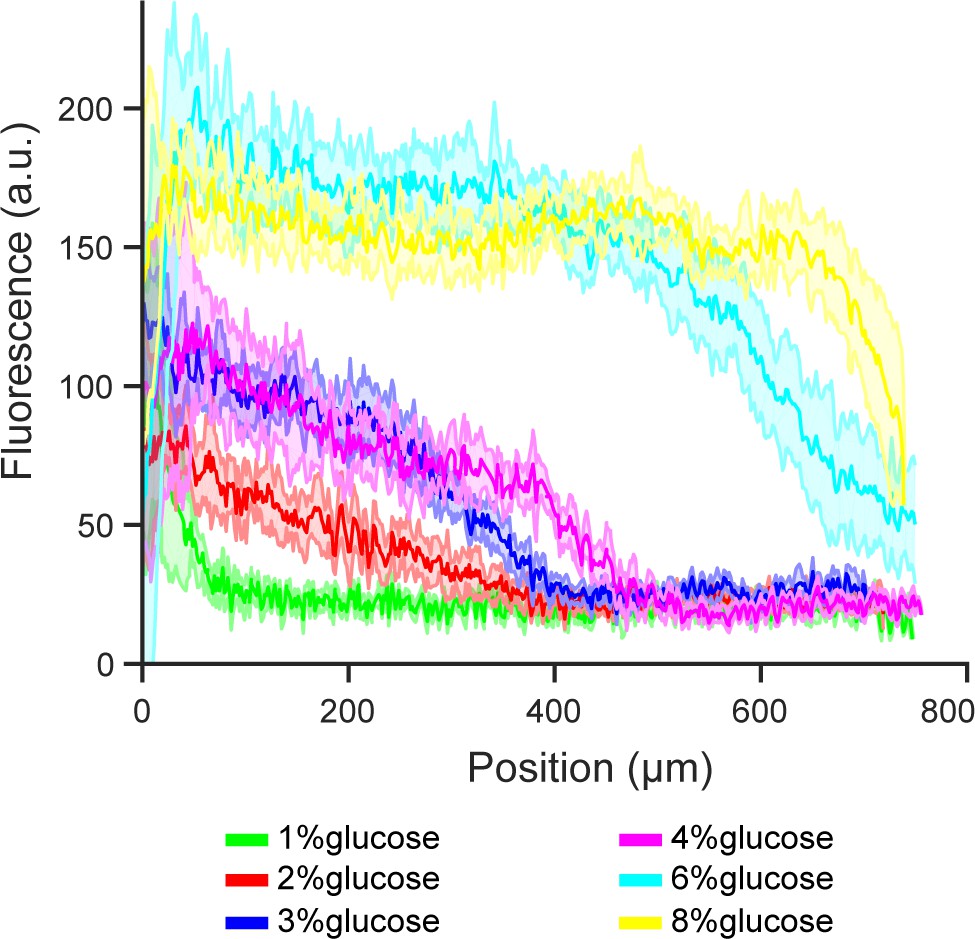
Extended figure of Figure 3e.
Gene expression of glucose transporter HXT1 in different glucose concentrations and high amino acid concentration (5x CSM). Data obtained from n = 8–9 replicates per glucose concentration. Shaded error bars denote ± one standard deviation.
Figure 4
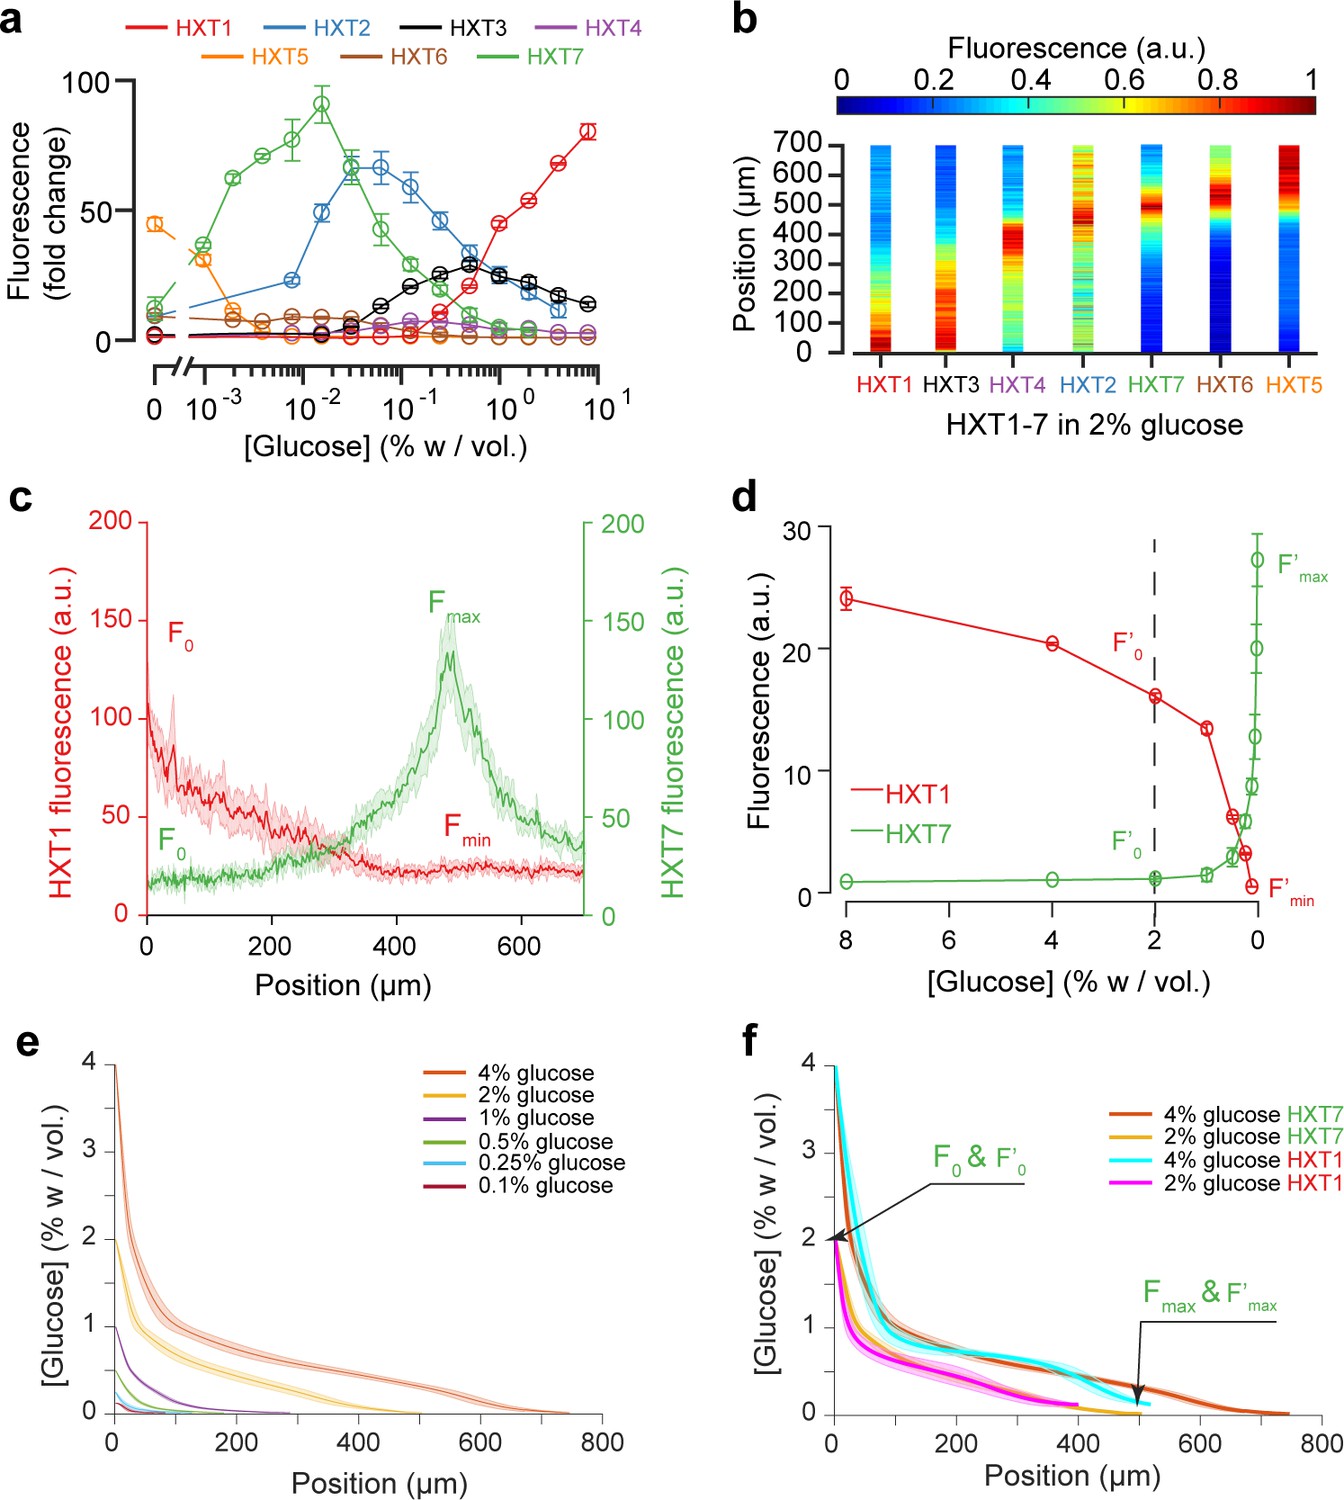
Using the fluorescence landscapes of glucose transporter gene expression to infer glucose concentration gradients.
(a) FACS measurements for HXT1-GFP to HXT7-GFP in batch culture over a range of glucose concentrations. The expression levels of each HXT show a specific dependence on glucose concentration (n = 3–6 replicates per glucose concentration). (b) Landscapes of gene expression for all HXTs-GFP at an external glucose concentration of 2% w/vol. HXTs are ordered by their relative glucose specificity: HXT1 is expressed under high-glucose conditions, while HXT5 is only expressed at very low-glucose conditions. Assuming a progressive spatial decay in the glucose concentration away from the chamber opening, all maps of gene expression are in perfect agreement with the intensity profiles observed in batch culture (n = 8–10 replicates per glucose concentration). (c-d) Method of glucose gradient reconstruction. The fluorescence landscape of HXT7 (resp. HXT1) shows a peak Fmax (resp. a minimum, Fmin) at a given location. The fluorescence intensity at the opening of the chamber, F0, corresponds to the external glucose concentration, C0. Using the FACS measurements of HXT7 (resp. HXT1) as a function of glucose concentration, one can define the concentration of glucose that matches the peak Fmax (respective to the minimum Fmin), and the fluorescence intensity that corresponds to C0. This allows us to linearly map all other fluorescence intensities for a given glucose concentration from the batch culture to the fluorescence intensities inside the colony, allowing the glucose concentration across the entire cellular monolayer to be reconstructed. Data comes from previously mentioned HXT1 and HXT7 microfluidics and flow cytometry measurements. (e-f) Reconstruction of glucose concentration obtained from HXT7 (e, f) and HXT1 (f) fluorescence data and various external glucose concentrations.
Figure 5 with 3 supplements
Other landscapes of genes involved in glucose metabolism.
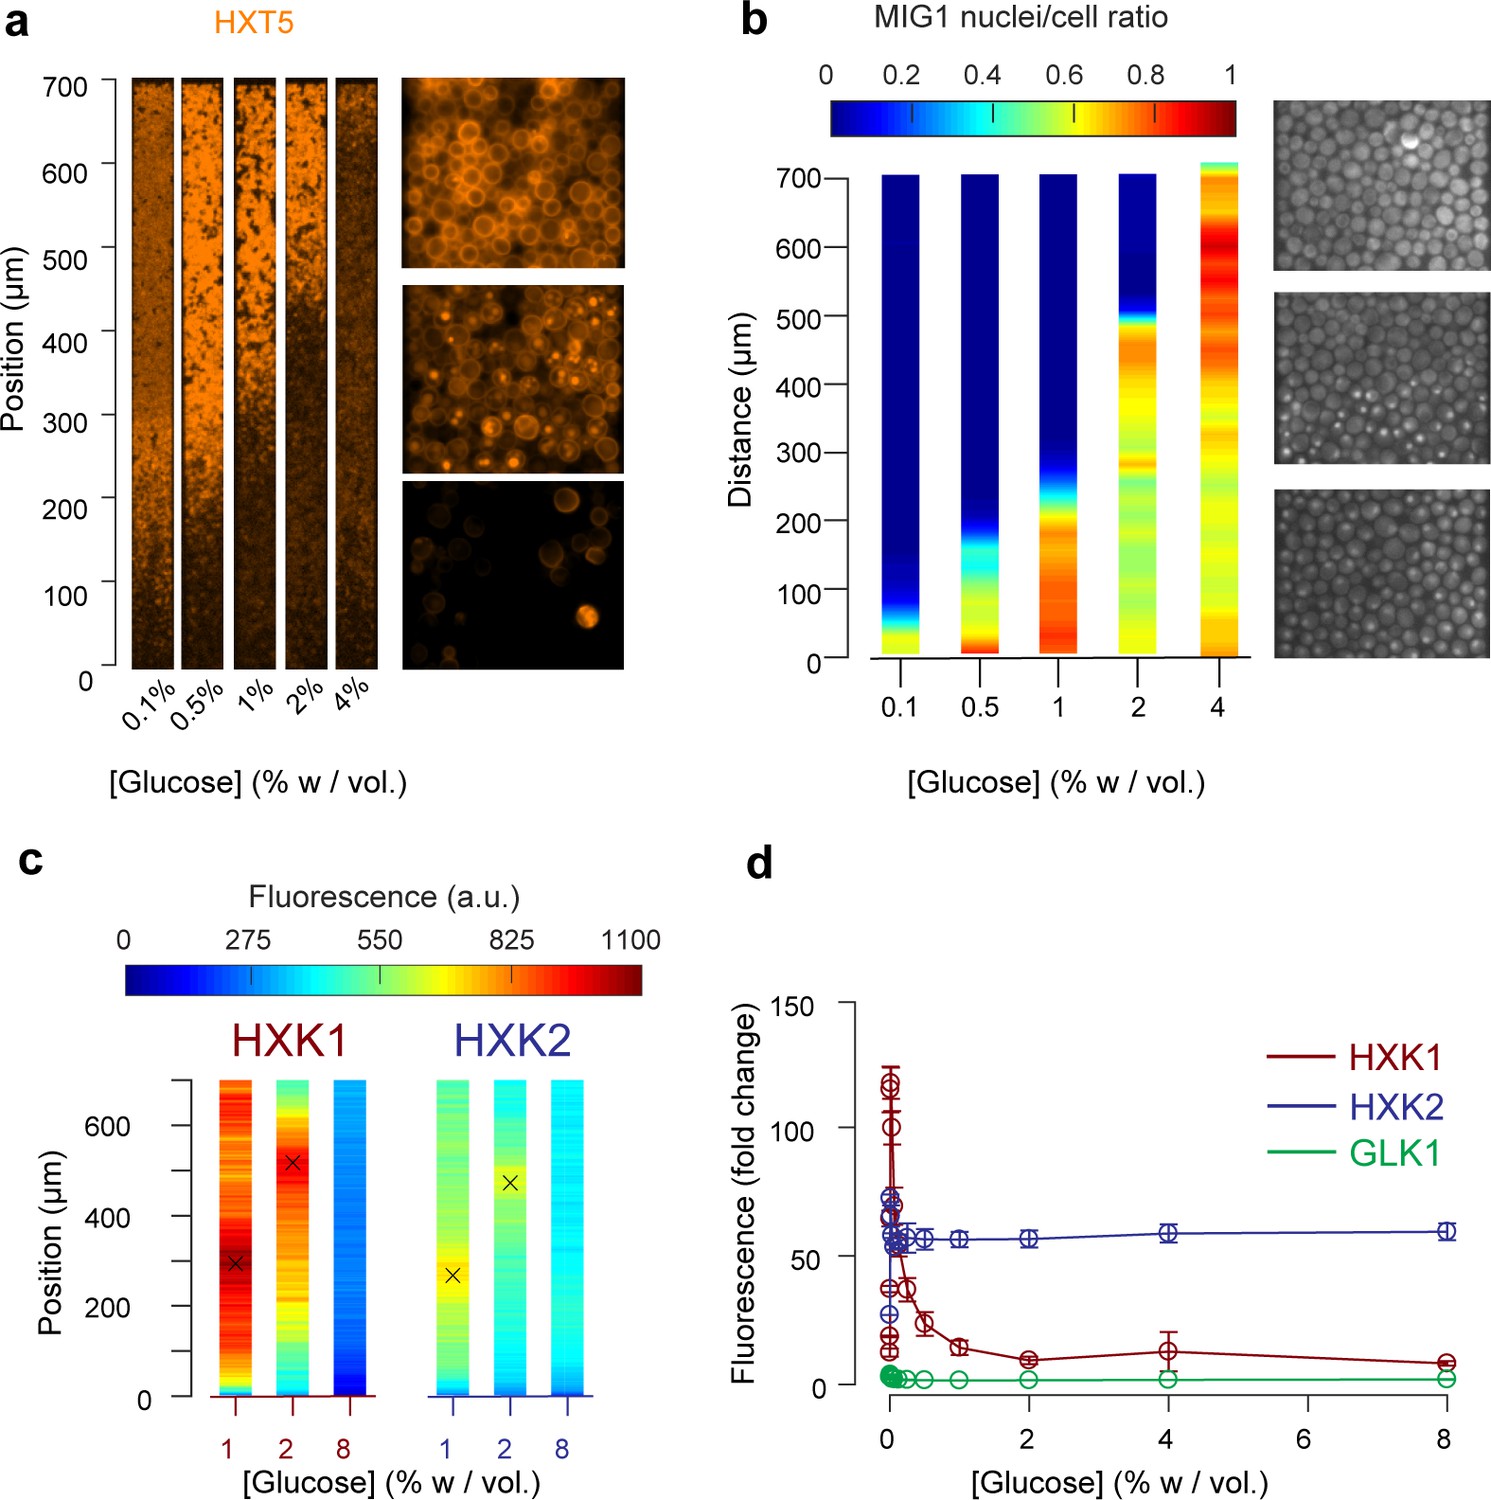
(a) Landscape of HXT5 expression. HXT5 is expressed under very low and no glucose conditions and appears to be a good marker of growth arrest. At C0 = 2% w/vol, HXT5 expression is in good agreement with the observed absence of cellular division (see Figure 2, Figure 5—figure supplement 1). (b) Landscape of MIG1 activity. MIG1 fluorescence was located in the nucleus in the presence of glucose, with a sharp transition in nuclear localization observed (middle picture, at 2% w/vol glucose in the nutrient channel), confirming the existence of a glucose gradient (n = 3 replicates). Total number of cells and cells with nuclear localization of fluorescence were annotated manually and binned into 25 µm bins (see also Figure 5—figure supplement 2). (c) HXK1 and HXK2 are hexokinases involved in glucose metabolism. Their landscape of expression exhibited peaks that indicate a transition from high to very low glucose levels (n = 8–9 replicates per glucose concentration). (d) FACS measurements of HXK1 and HXK2 expression over a range of glucose concentrations (n = 3–6 replicates per glucose concentration).
Figure 5—figure supplement 1
Extended figure of Figure 5a.
Gene expression of glucose transporter HXT5 in different glucose concentrations and high amino acid concentration (5x CSM). Data obtained from n = 9–17 replicates per glucose concentration. Shaded error bars denote ± one standard deviation.
Figure 5—figure supplement 2
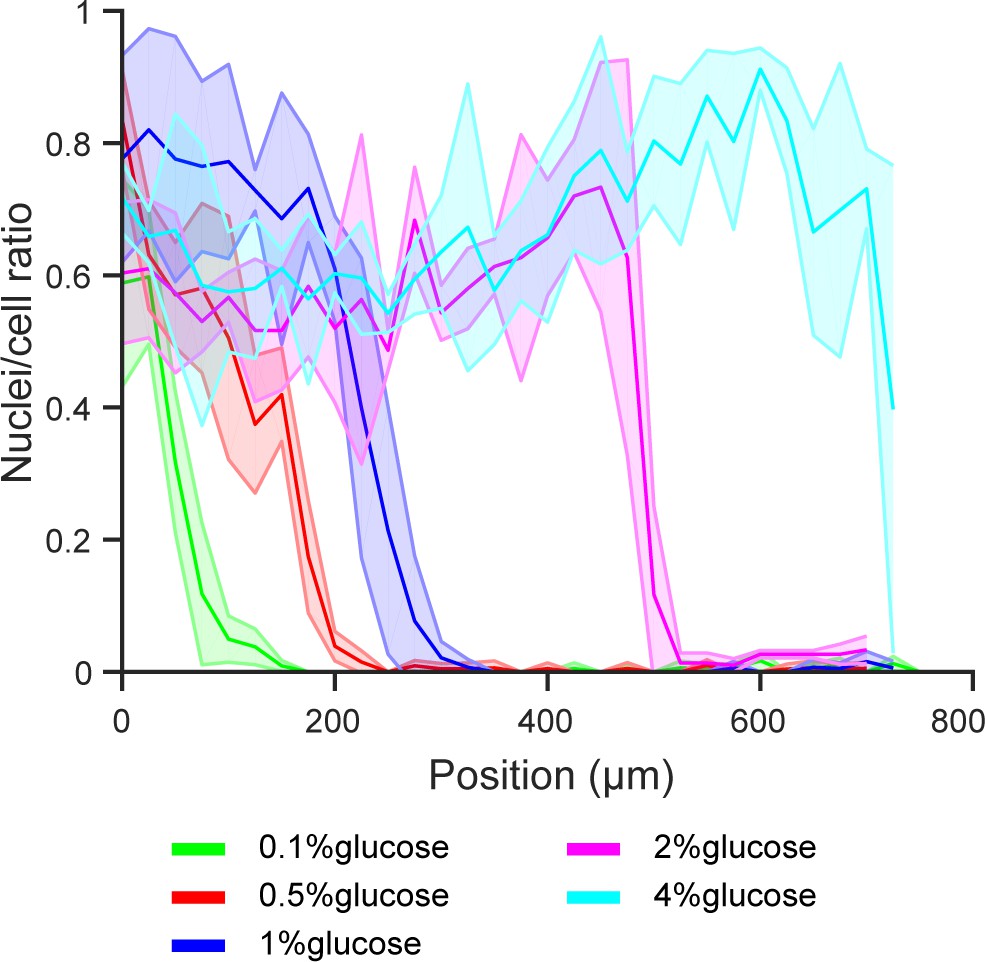
Extended figure of Figure 5b.
Gene expression of transcription factor MIG1 in different glucose concentrations and high amino acid concentration (5x CSM). Data obtained from n = 3 replicates per glucose concentration. Shaded error bars denote ± one standard deviation.
Figure 5—figure supplement 3
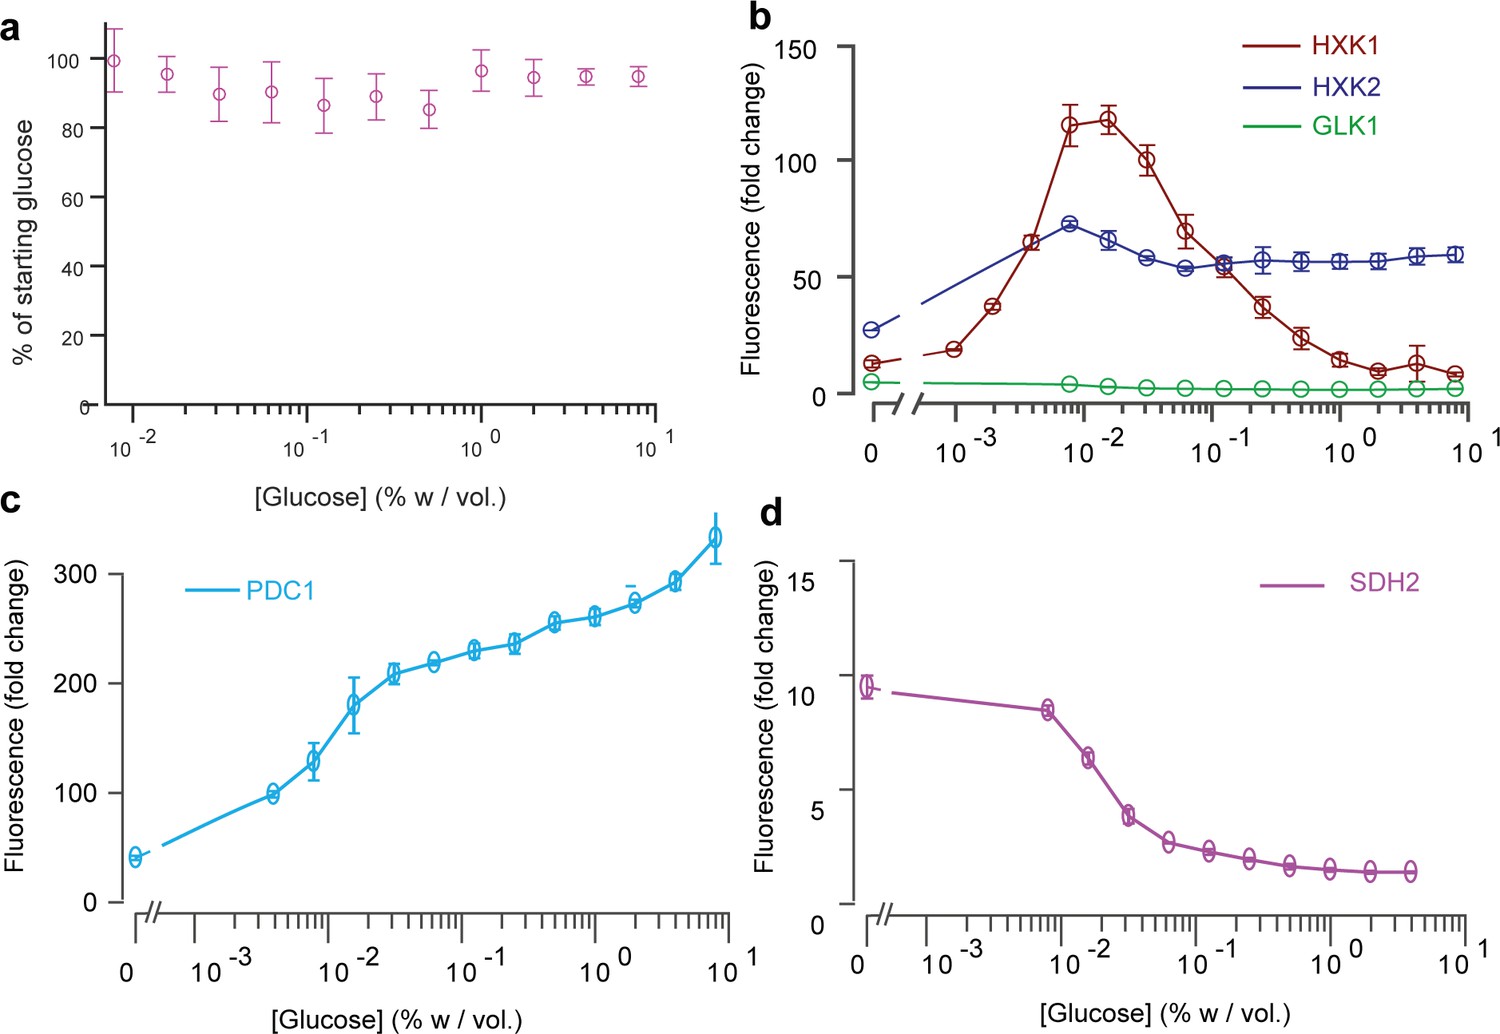
Fluorescence intensity of key glucose metabolism genes measured by FACS over a range of glucose concentrations in batch culture.
(a) We also measured the glucose concentrations of the samples that were assessed by FACS. In all experiments, the glucose concentration was within 90–100% of the initial glucose concentration, indicating the cells did not use large amounts of the glucose supplied. This sets a typical error of about 10% on the inferences of glucose concentrations and gradient reconstruction in our article. Data comes from three replicates (n = 3). (b) Level of expression of HXK1 (red), HXK2 (blue) and GLK1 (green) reported in the main article represented in log-scale. (c) Level of expression of PDC1 reported in the main article represented in log-scale. (d) Level of expression of SDH2 reported in the main article represented in log-scale. Data in S11b, c, d comes from 3 to 6 replicates, depending on the glucose concentration (n = 3–6).
Figure 6 with 1 supplement

Impact of the glucose gradient on yeast physiology and the emergence of a landscape of phenotypes.
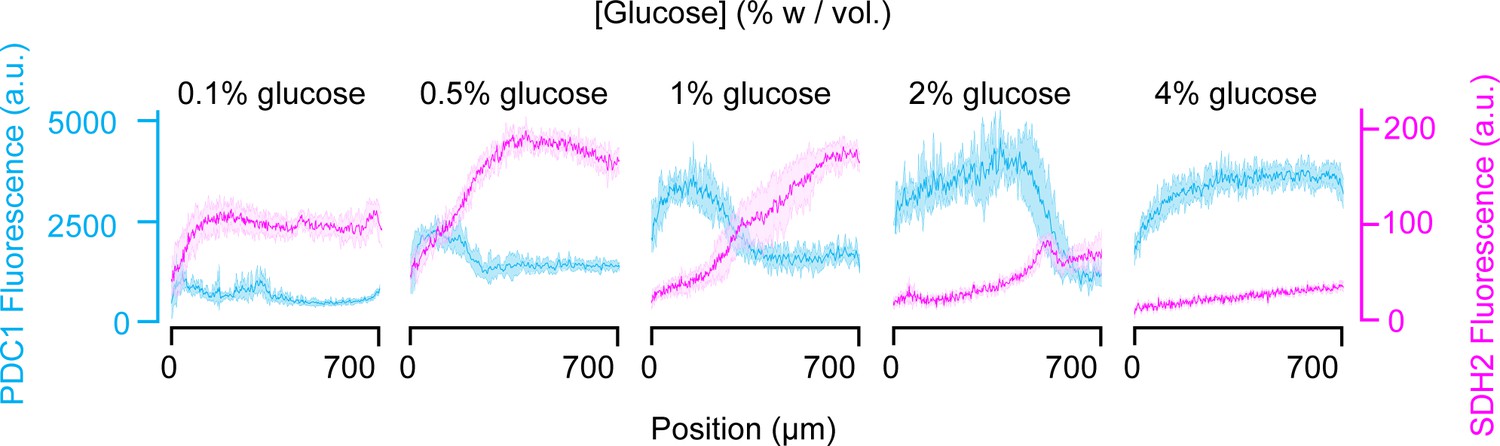
(a) Overlay of the landscapes of gene expression of PDC1 (blue) and SHD2 (pink). PDC1 is known to be expressed when yeast cells ferment, SDH2 is mainly expressed in respiring cells (see also Figure 6—figure supplement 1). (b) FACS measurements of PDC1 expression over a range of glucose concentrations in batch culture (n = 3). (c) FACS measurements of SDH2 expression over a range of glucose concentrations in batch culture. The inverse correlation between PDC1 and SDH2 expression observed in batch culture is in good agreement with the inversely correlated spatial expression patterns within yeast cell monolayers (n = 3).
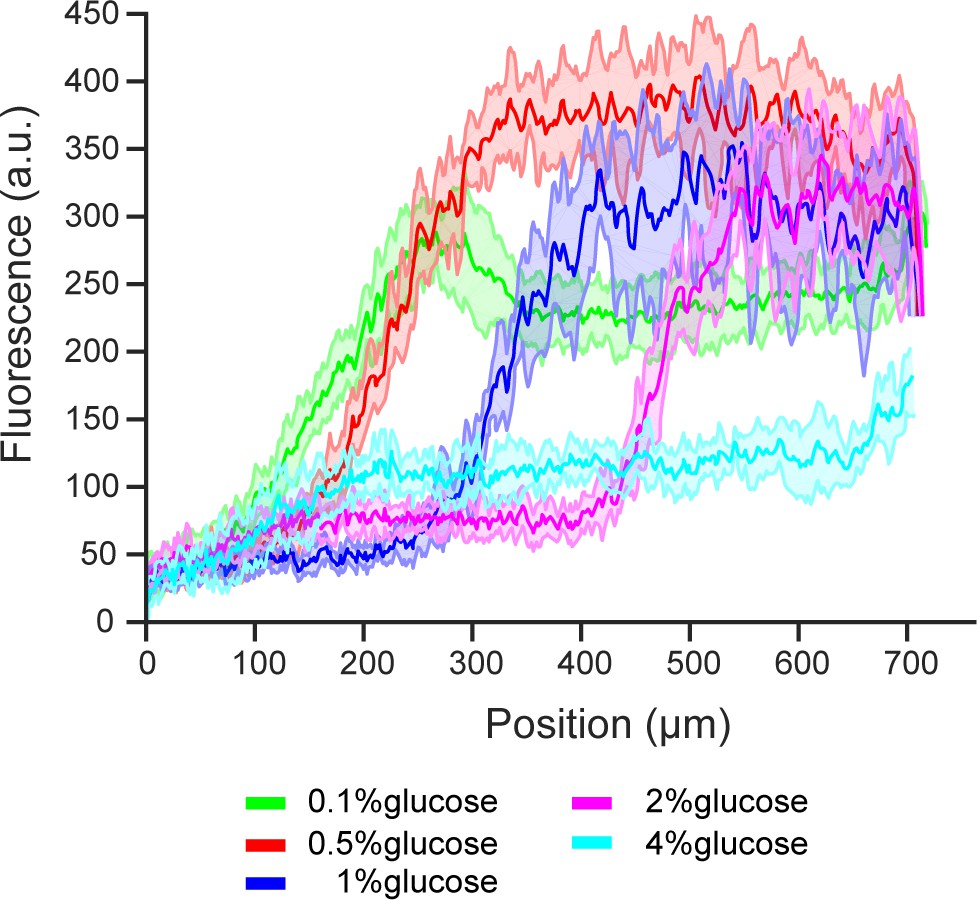
Figure 6—figure supplement 1
Extended figure of Figure 6a.
Gene expression landscape of pyruvate decarboxylase PDC1 (blue) and succinate dehydrogenase SDH2 (pink) in different glucose concentrations and high amino acid concentration (5x CSM). PDC1 is overexpressed during fermentations and SDH2 is overexpressed during respiration. Position 0 µm is the position of the glucose source. In colonies, two subpopulations differentiate. One that has fermentative metabolism where glucose is abundant and the other that has respiratory metabolism where glucose is scarce. Depending on the starting glucose concentrations, one or the other dominates. Data obtained from n = 6–9 replicates per glucose concentration. Shaded error bars denote ± one standard deviation.
Figure 7
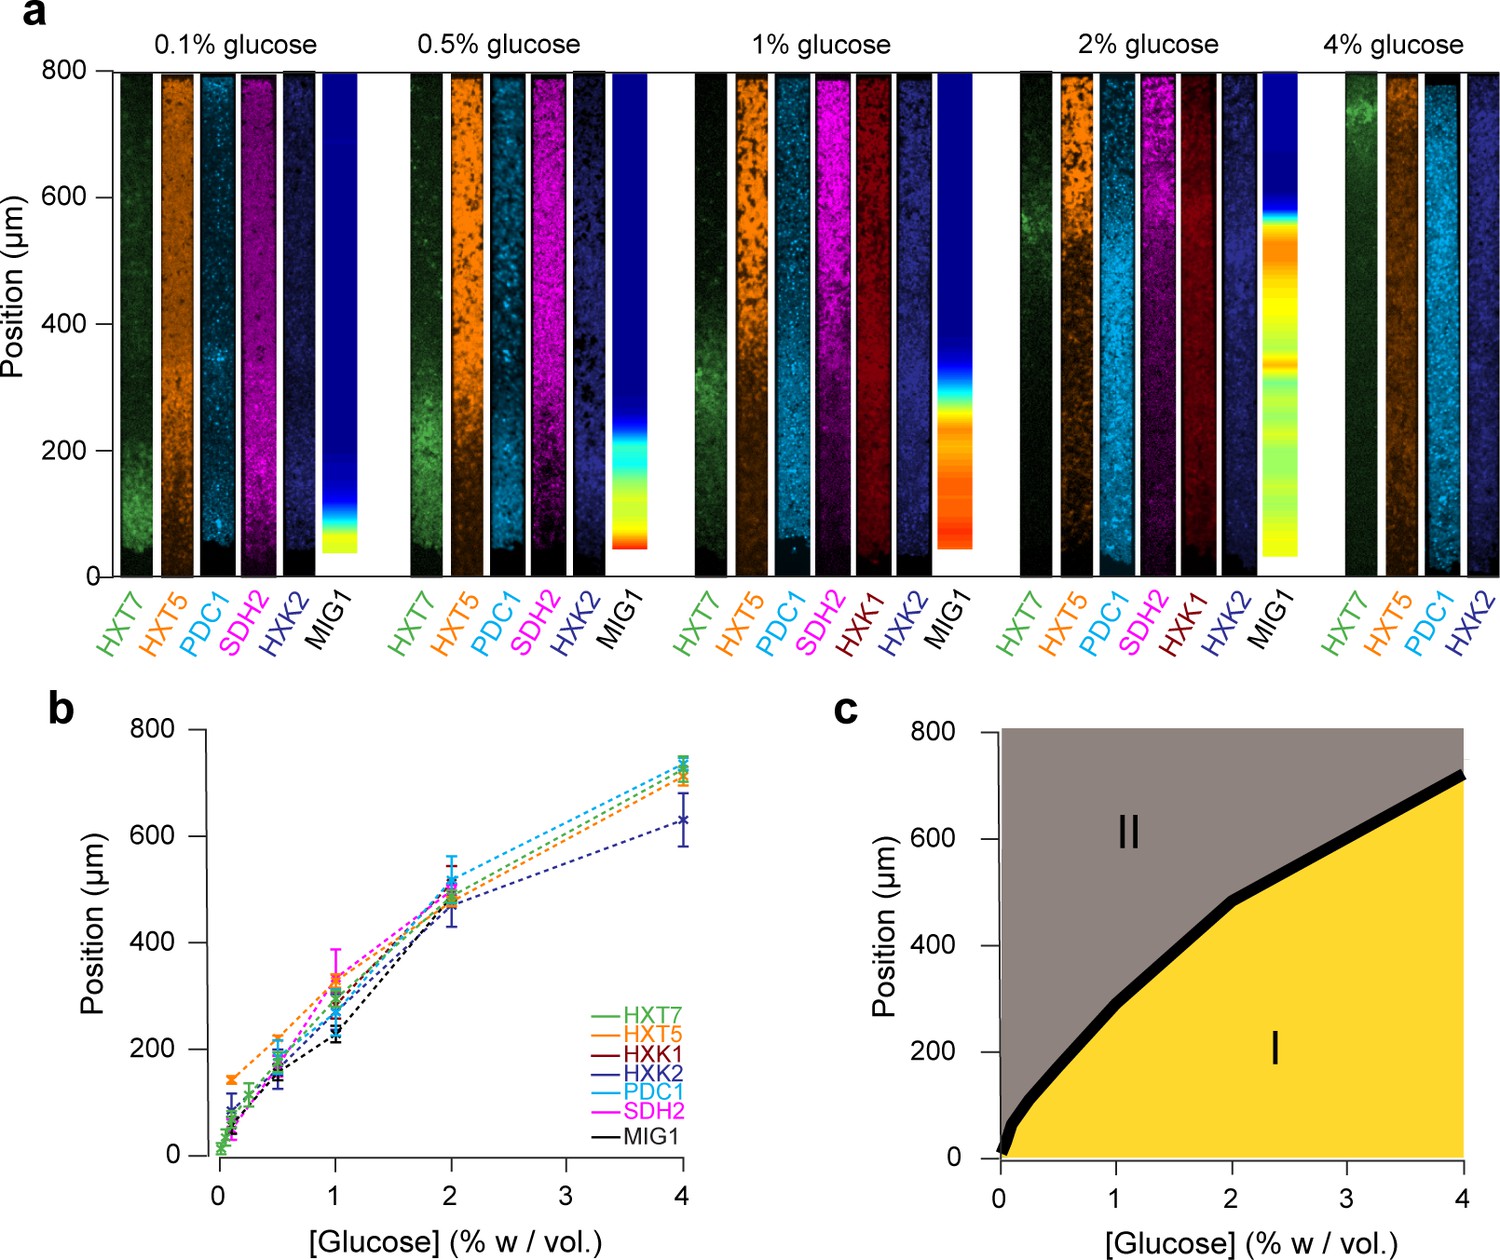
Global view of the emergence of landscapes of gene expression.
(a) The different landscapes of gene expression presented in this study are aligned, regrouped and displayed over a range of glucose concentrations. This simple view sheds light on the macroscopic spatial correlations between these different landscapes, which are both setting and traces of the establishment of glucose gradients. (b) For each gene expression landscape, we identified the fluorescence peak (HXT7, HXK1, HXK2) or the position of the transition between low and high expression (HXT1, HXT5, SDH2, PDC1) or activity of the transcription factor (MIG1). (c) Landscapes of gene expression delimit two regions in which cells are physiologically different. Phase I indicates active growth by fermentation in the presence of glucose; Phase II indicates growth arrest or very limited growth via respiratory metabolism at zero or close to zero glucose concentrations. The transition between the two phases typically takes place relatively sharply, over a hundred micrometers or ~20 cells.
Videos
Video 1
Emergence of metabolic landscapes in yeast monolayer colonies.
https://doi.org/10.7554/eLife.47951.005Additional files
-
Supplementary file 1
List of yeast S. cerevisiae strains used in this study.
- https://doi.org/10.7554/eLife.47951.021
-
Transparent reporting form
- https://doi.org/10.7554/eLife.47951.022
Download links
A two-part list of links to download the article, or parts of the article, in various formats.
Downloads (link to download the article as PDF)
Open citations (links to open the citations from this article in various online reference manager services)
Cite this article (links to download the citations from this article in formats compatible with various reference manager tools)
A microfluidic device for inferring metabolic landscapes in yeast monolayer colonies
eLife 8:e47951.
https://doi.org/10.7554/eLife.47951


