Controlling gene activation by enhancers through a drug-inducible topological insulator
- Department of iPS Cell Research & Epigenetic Medicine, Keio University School of Medicine, Japan
- Department of Physiology, Keio University School of Medicine, Japan
- Apheresis and Dialysis Center, Keio University School of Medicine, Japan
- Division of Tissue Engineering, University of Tokyo Hospital, Japan
- Department of Oral and Maxillofacial Surgery, University of Tokyo Hospital, Japan
- Department of Genomics and Evolutionary Biology, National Institute of Genetics, Japan
Figures
Figure 1 with 2 supplements
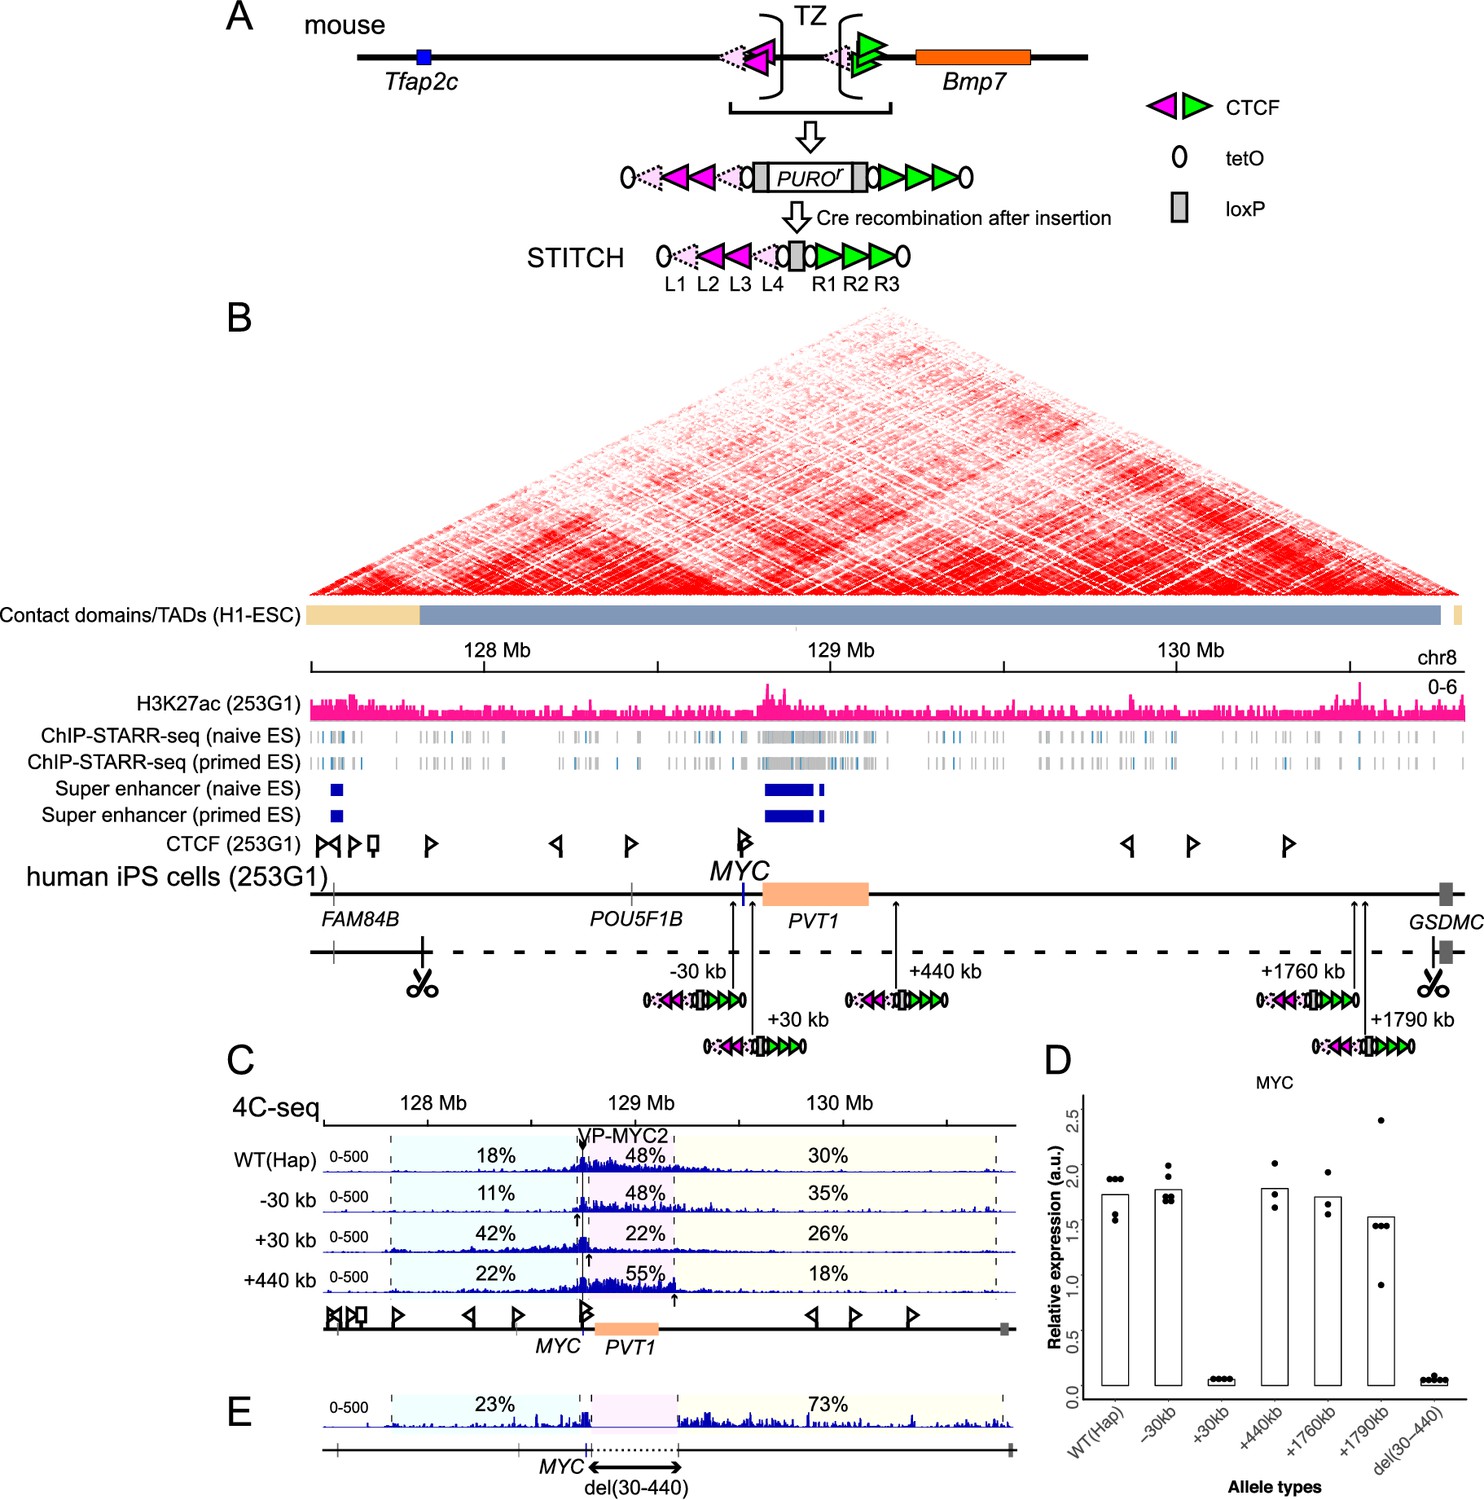
Serial insertion of STITCH around MYC localized the enhancer.
(A) Design of STITCH and scheme of inserting the cassette. After recombination of the two loxP sites (rectangles), the puromycin resistant gene is removed. The orientations of the CTCF binding motifs are represented by the orientations and colors of the triangles. Note that binding of CTCF at L1 and L4 was detected by nChIP neither in the endogenous locus of the mouse genome nor at STITCH in the MYC locus, as represented by the paled color (see Figure 1—figure supplement 1C). The ovals represent tetO. The sequences of these elements are shown in Supplementary file 1B. (B) The H3K27ac profile and the insertion sites of STITCH around MYC in the human iPS cells. The Hi-C map and the contact domains in human ESCs are shown at the top (Dixon et al., 2015). The Hi-C contact map was generated with the 3D Genome Browser (http://3dgenome.org) (Wang et al., 2018). The ChIP-STARR-seq profiles and annotated super-enhancer regions in human naïve and primed ES cells (Barakat et al., 2018) are also depicted. The triangle flags indicate the positions and orientations of the CTCF binding sequences identified in this study. Note that the algorithm that we used could not determine the binding motif of one site represented by a rectangle flag. The 3 Mb region deleted from one of the two alleles to make ‘Hap’ is indicated by the dashed line, flanked by scissors that indicate the target sites of CRISPR/Cas9. The numbers in the insertion names indicate the distance from MYC. (C) The 4C-seq profiles from VP-MYC2 of the wild type (Hap) and STITCH-30kb, +30kb, and +440kb alleles. (D) Relative MYC expression levels normalized with ACTB expression in the different alleles. Each dot represents replicate clones (see Materials and methods for details). The bars represent their means. (E) The 4C-seq profile of del(30-440) from VP-MYC2. The numbers indicate the ratios of sequence reads mapped to given intervals within the locally haploid 3 Mb region around MYC except for the 10 kb region from the viewpoint fragment (C, E).
-
Figure 1—source data 1
4C-seq read counts in the given intervals.
- https://cdn.elifesciences.org/articles/47980/elife-47980-fig1-data1-v1.xlsx
Figure 1—figure supplement 1
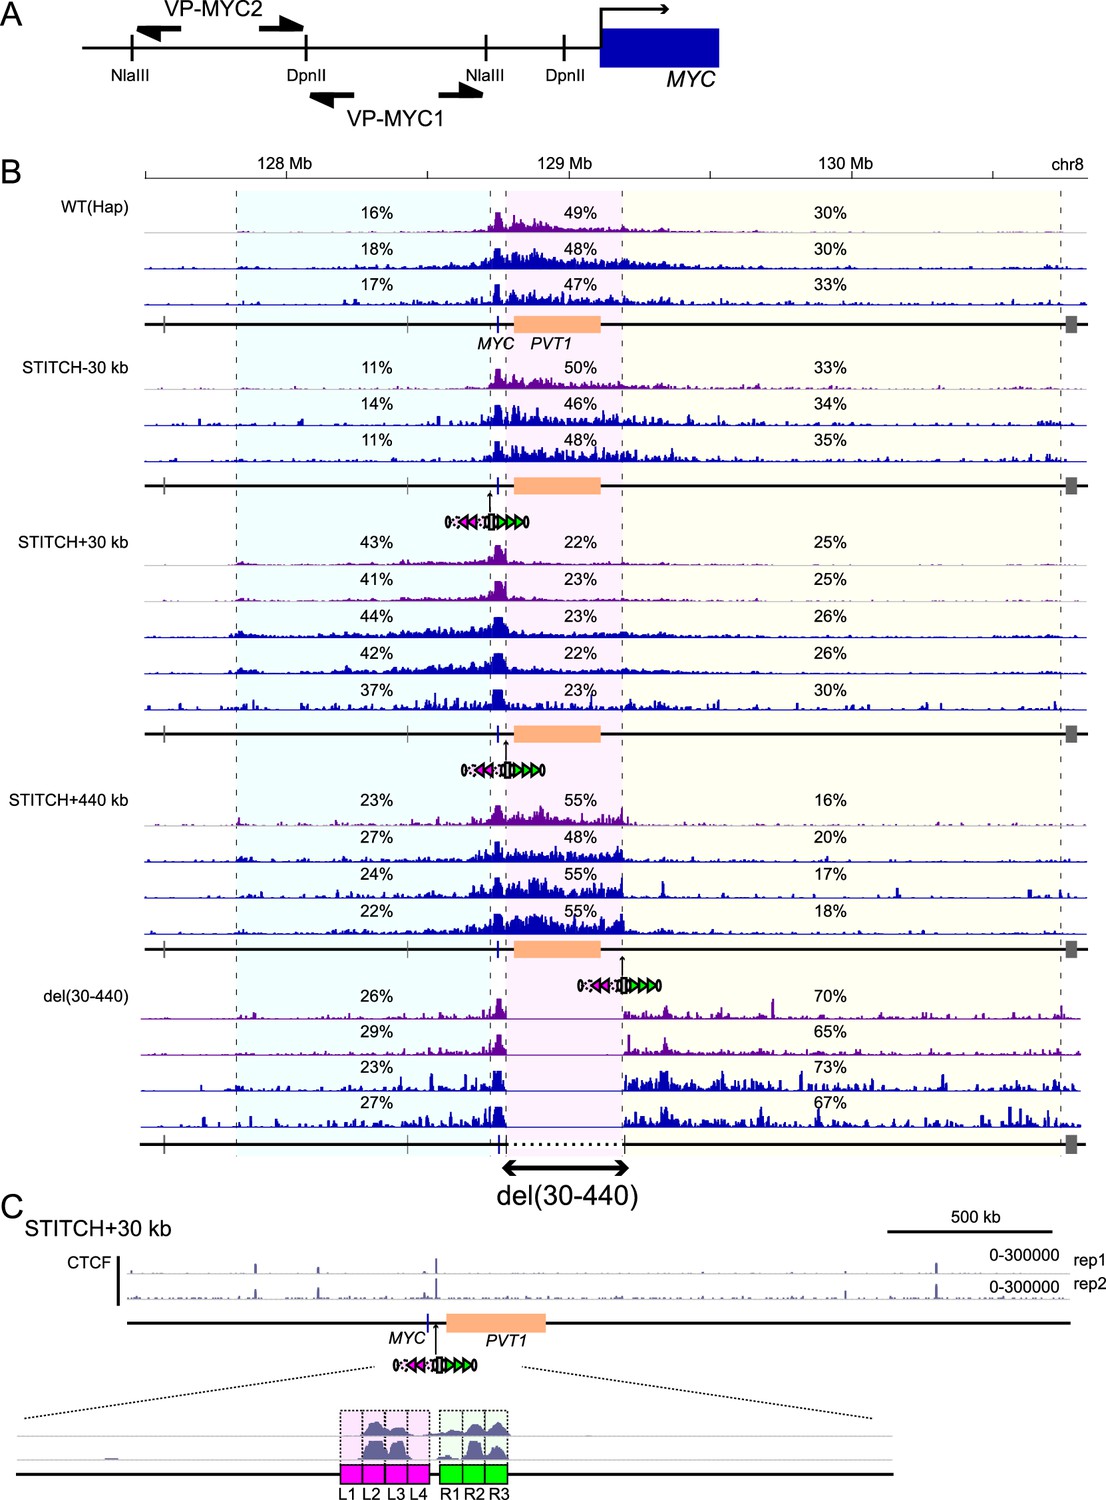
4C-seq profiles of STITCH insertion clones.
(A) Schematic illustration of primer pairs (VP-MYC1 or VP-MYC2) used to amplify the 4C-seq libraries as viewpoints. (B) The 4C-seq profiles from VP-MYC1 (purple) and VP-MYC2 (blue) in different alleles. The numbers indicate the ratios of sequence reads mapped to given intervals within the locally haploid 3 Mb region around MYC except for the 10 kb region from the viewpoint fragment. Different tracks are results of replicate experiments. (C) nChIP-seq tracks for CTCF in the STITCH+30kb allele mapped to a synthetic genomic DNA sequence around MYC with the STITCH insertion. Below is a magnified view around STITCH. The seven CTCF-binding sites from L1 to R3 are marked by colored rectangles.
Figure 1—figure supplement 2
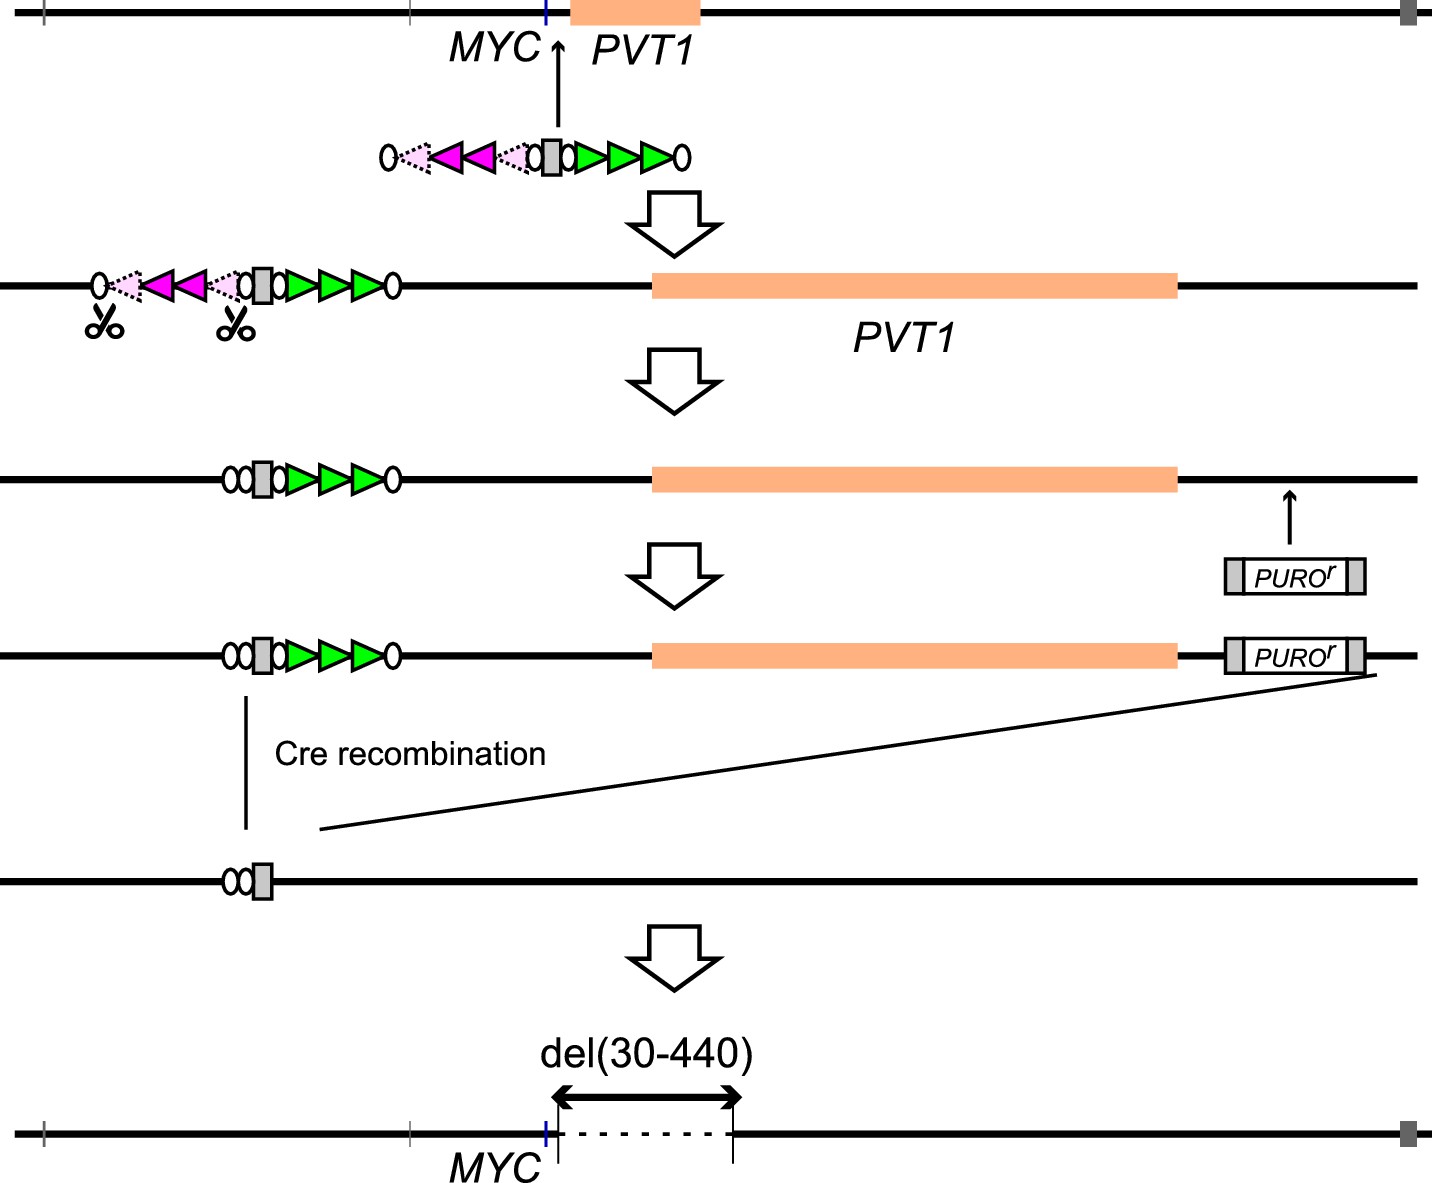
The scheme to delete the +(30-440)kb region.
We first deleted the L1 to L4 of STITCH. Then we inserted loxP sequences together with puromycin resistant gene into the +440 kb position. Then we induced Cre expression to delete the region between the loxP sites.
Figure 2 with 1 supplement
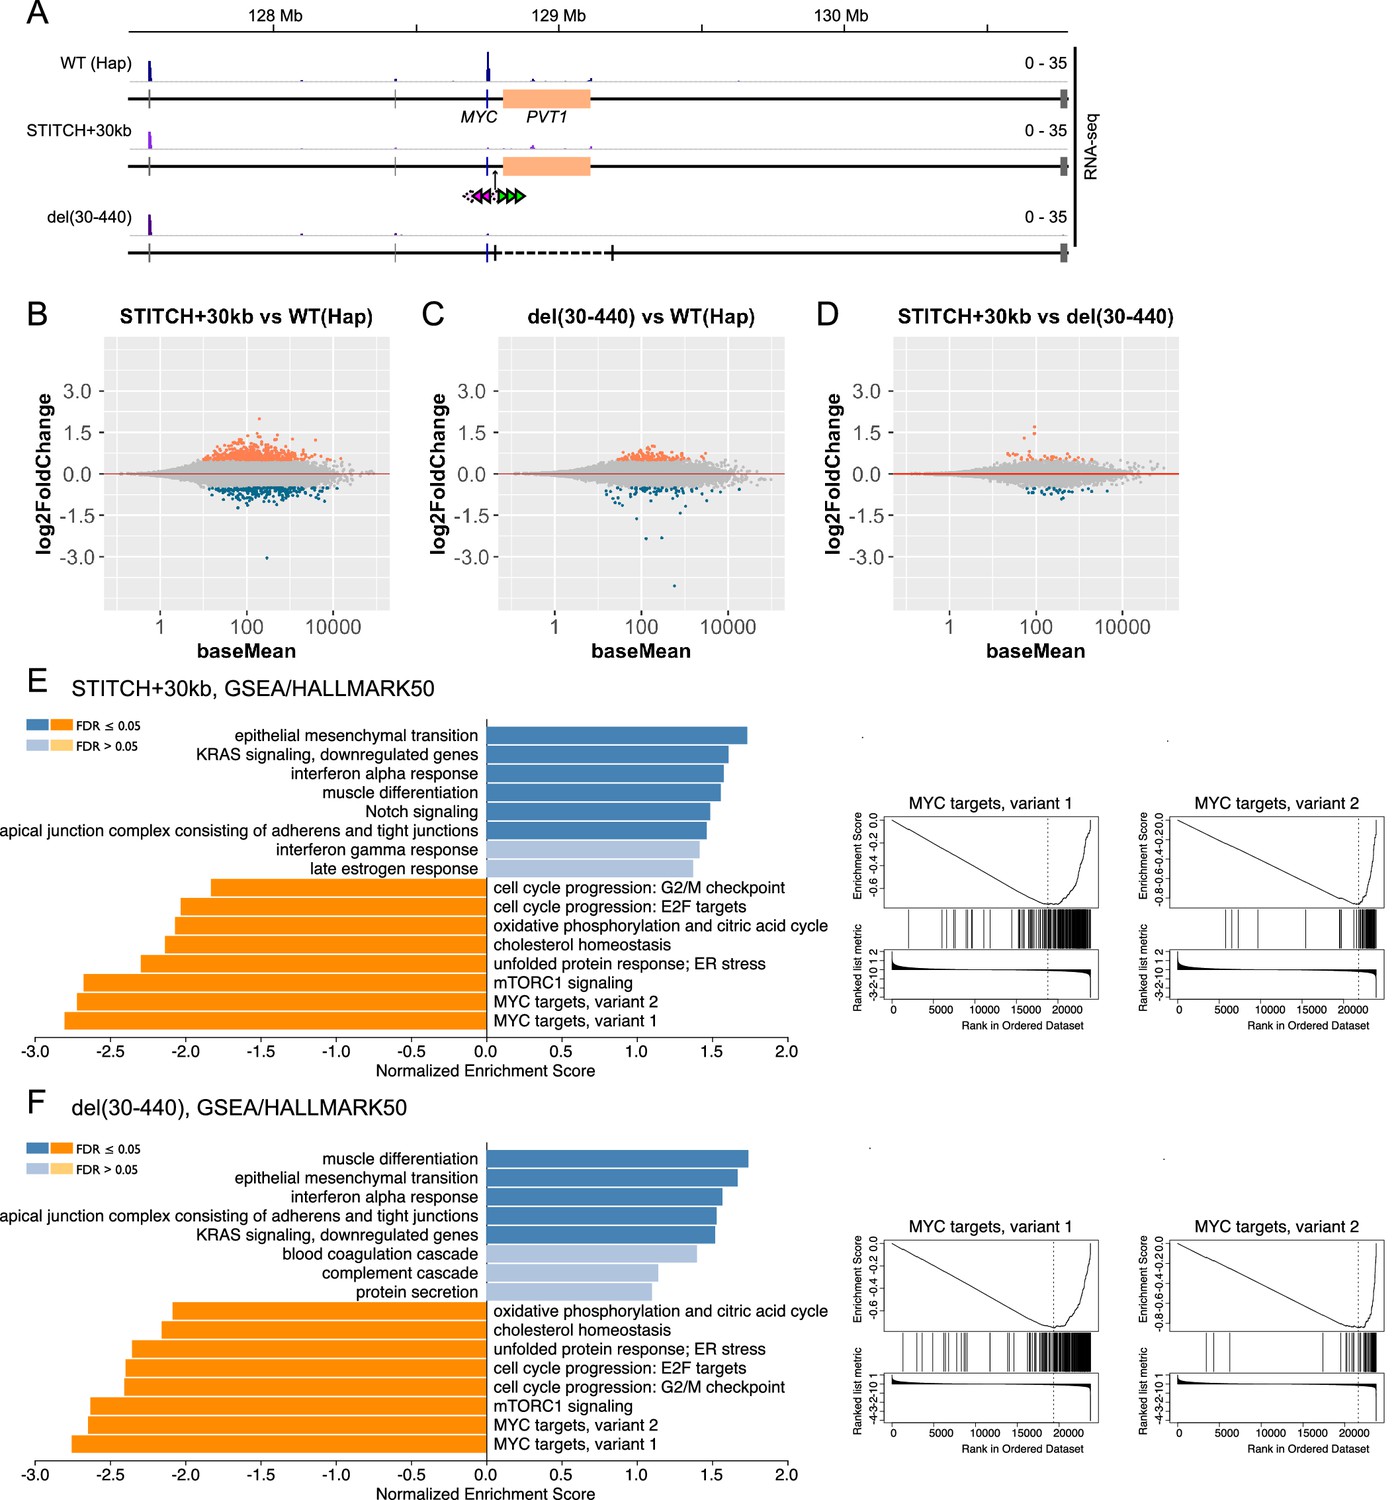
Transcriptome analysis of Hap, STITCH+30kb and del(30-440).
(A) Tracks of RNA-seq from Hap, STITCH+30kb, and del(30-440) around the MYC locus. (B–D) MA-plots of RNA-seq to compare STITCH+30kb vs. Hap (B), del(30-440) vs. Hap (C) and STITCH+30kb vs. del(30-440) (D). Differentially expressed genes (adjusted p-values<0.05, log2 fold changes > 0.5) are marked by colors (orange for up-regulated genes and dark blue for down-regulated ones). (E and F) Enriched categories among HALLMARK50 (Liberzon et al., 2015) by GSEA (Liao et al., 2019) (left) and the enrichment plots against the categories MYC targets variant 1 and 2 (right) in STITCH+30kb (E) and del(30-440) (F).
-
Figure 2—source data 1
RNA-seq read counts and the results of the DESeq2 analyses.
- https://cdn.elifesciences.org/articles/47980/elife-47980-fig2-data1-v1.xlsx
Figure 2—figure supplement 1
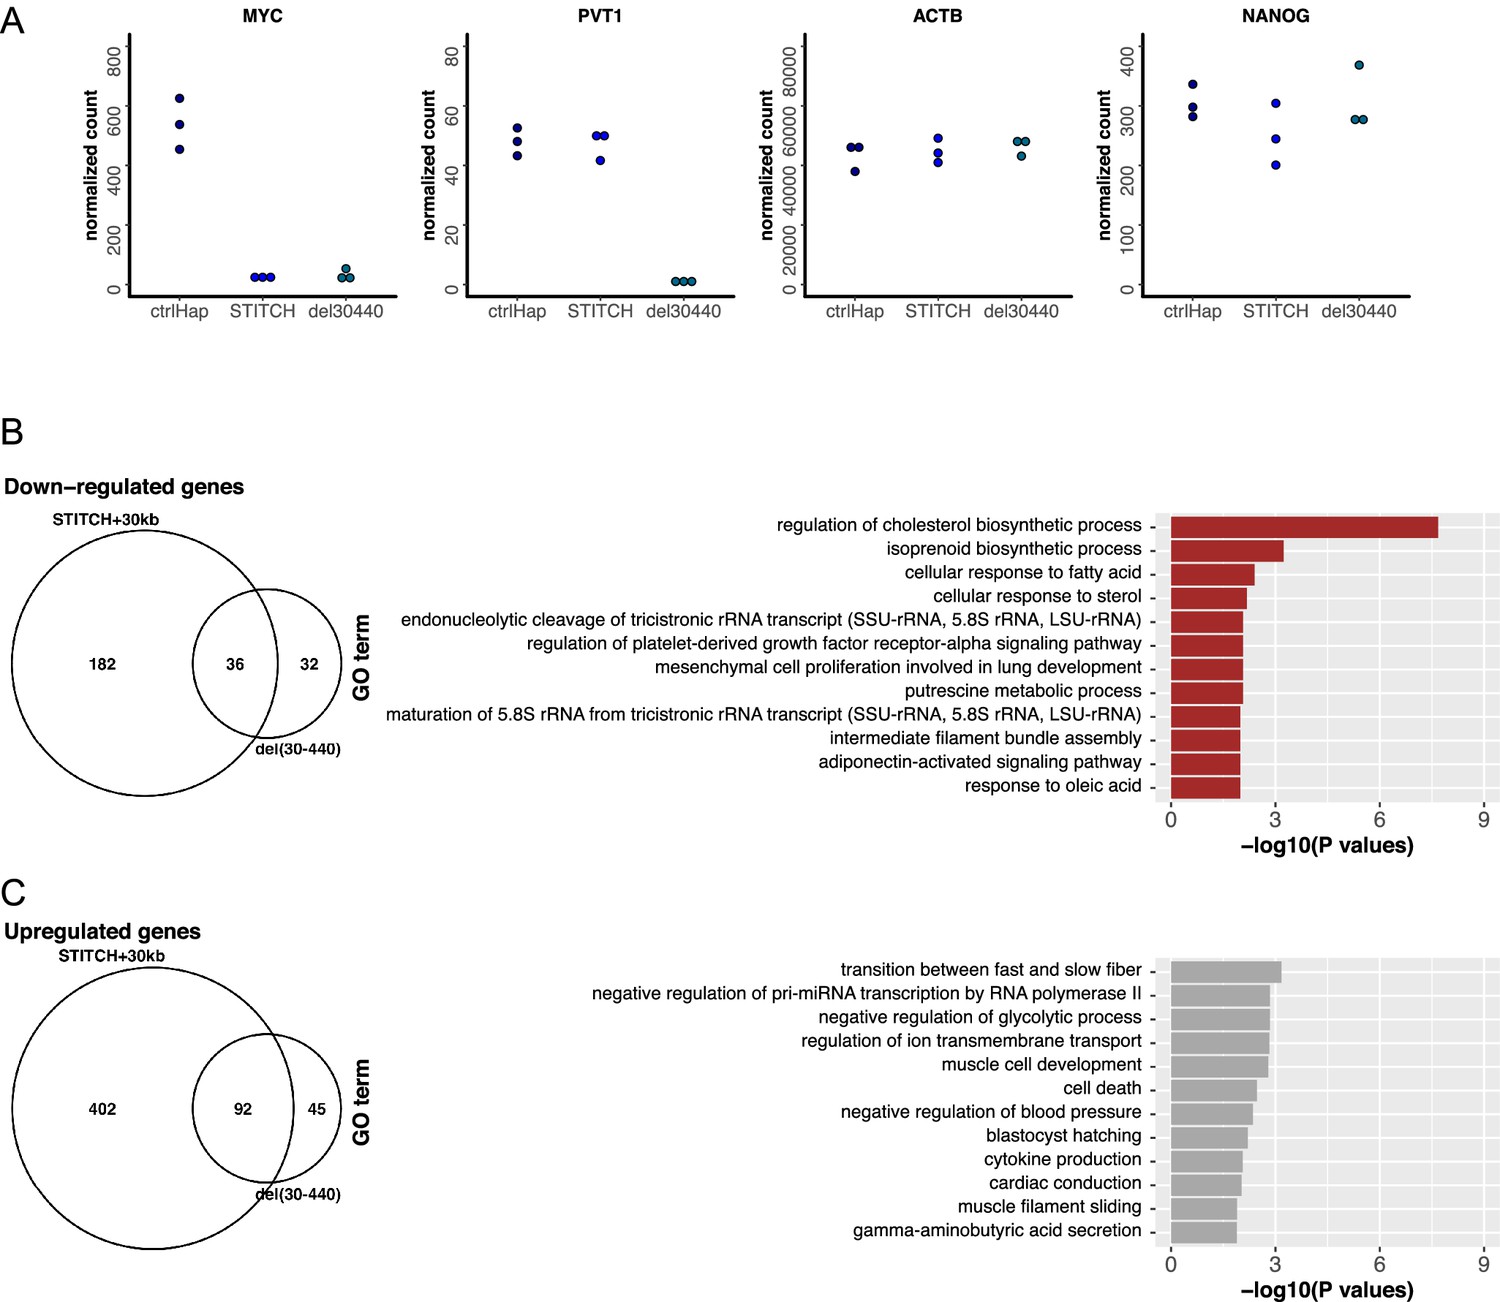
Transcriptome analysis of Hap, STITCH+30kb, and del(30-440).
(A) Comparison of normalized counts in RNA-seq of representative genes (MYC, PVT1, ACTB, NANOG) in Hap, STITCH+30kb, and del(30-440). (B and C) (left) Venn diagrams showing overlaps of differentially down-regulated (B) and up-regulated (C) genes in STITCH+30kb and del(30-440). (right) GO enrichment analysis of the commonly down-regulated (B) and up-regulated (C) genes in STITCH+30kb and del(30-440).
Figure 3 with 4 supplements
MYC expression and 4C-seq profiles in serially mutated STITCH alleles.
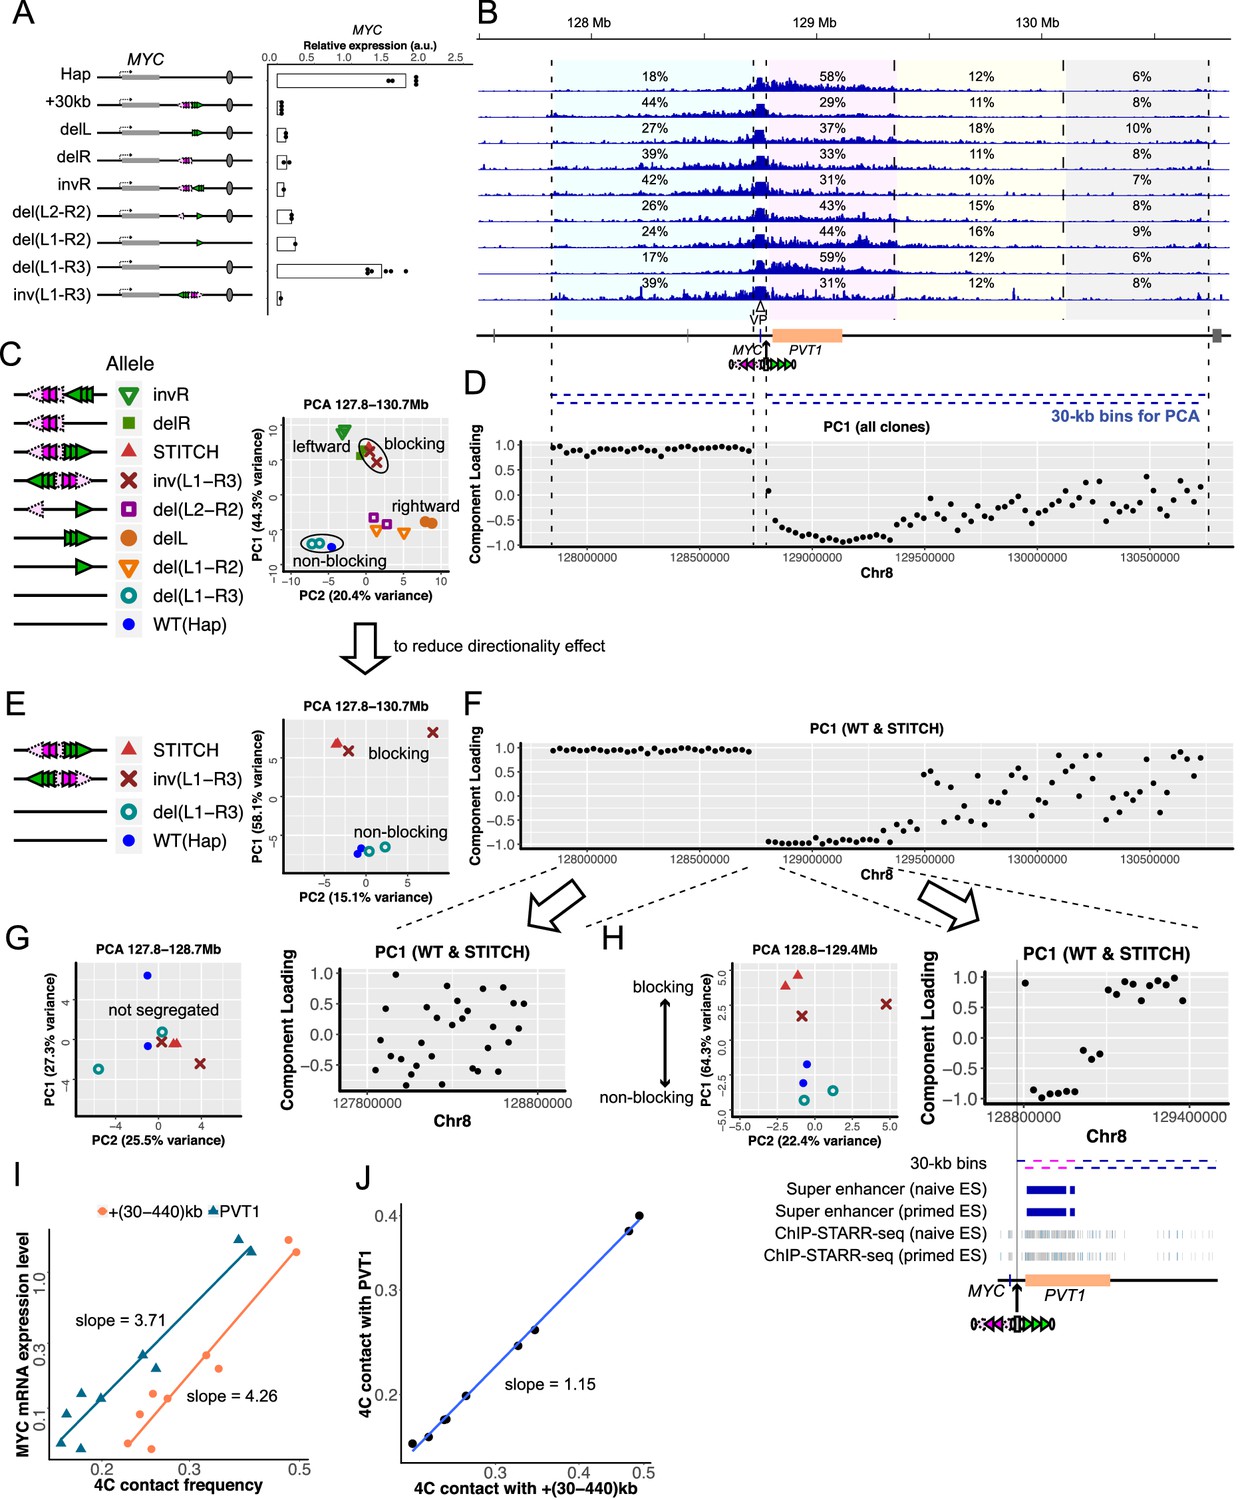
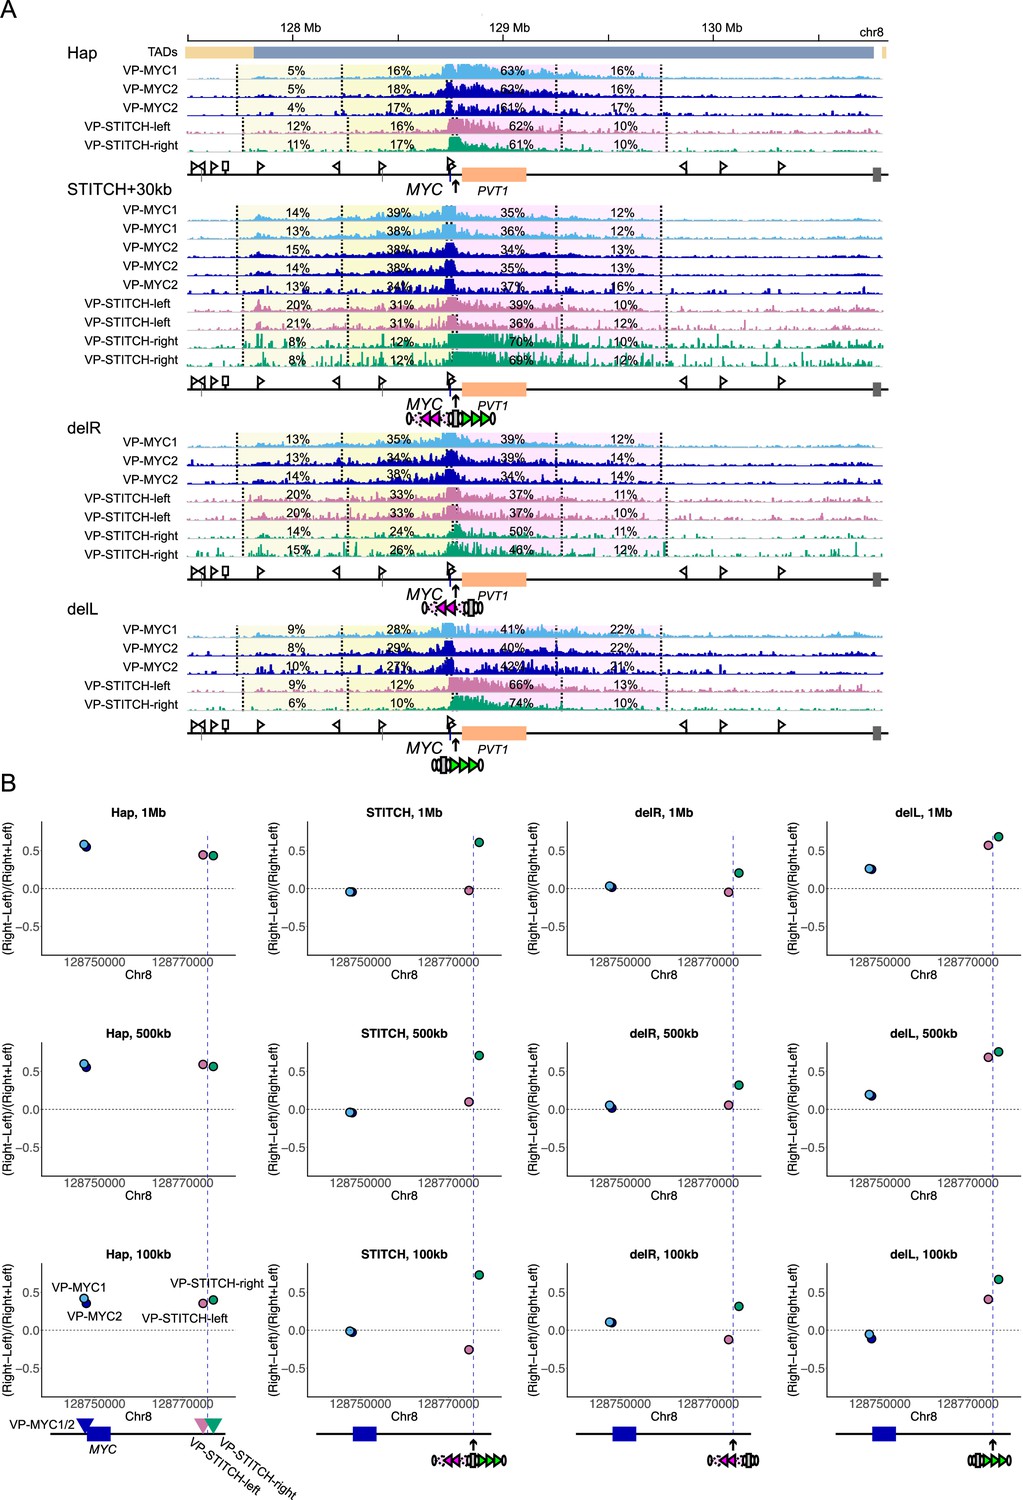
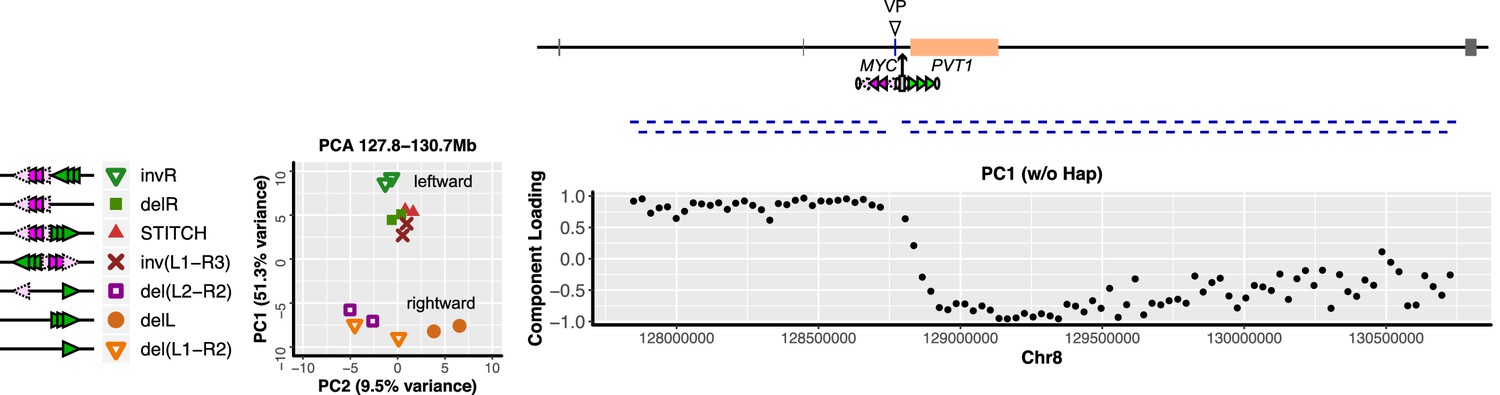
(A) Configurations of CTCF-binding sites of mutated STITCH alleles and a plot showing their MYC expression levels. Each dot represents replicate clones (see Materials and methods for details). Note that the data of Hap and STITCH+30kb are the same as Figure 1D. Bars indicate means of the replicates. (B) 4C-seq profiles from VP-MYC2 in the different alleles. The numbers indicate the ratios of the mapped reads to the indicated regions within the 3 Mb region, except for the 10 kb region from the viewpoint. Below the coordinate map, blue bars indicate bins (each 30 kb) for PCA in (C–H) and Figure 3—figure supplement 4. (C) PCA plot of all the clones using the normalized counts in all the bins of the whole locus. (D) Component loadings of PC1 in the PCA in (C) are plotted along the coordinate for each bin. (E, F) The PCA plot only with the non-blocking alleles, the original STITCH, and inv(L1-R3) using the bins of the whole locus (E), and the corresponding PC1 component loading plots (F). (G, H) The PCA plot with the same subset clones as (E) (left), and the corresponding PC1 component-loading plots (right) using the re-normalized counts in the bins of the left 900 kb region (G) or the right 600 kb region (H). Below the component-loading plot in (H), tracks of the super-enhancers and ChIP-STARR-seq plots reported in Barakat et al. (2018) are depicted along with the 30 kb bins of the right 600 kb region. The six bins with the lowest values of component loadings in (H) are depicted with pink. (I) A log-log plot of the MYC expression levels against the 4C contact frequencies of VP-MYC2 in the +(30-440)kb region (orange) and the PVT1 region (dark blue) for each clone. Note the difference between the two slopes. (J) A log-log plot of the 4C contact frequencies of VP-MYC2 in the PVT1 region against the +(30-440)kb region.
-
Figure 3—source code 1
Source Code File.
The R code for the PCA in Figure 3.
- https://cdn.elifesciences.org/articles/47980/elife-47980-fig3-code1-v1.r
-
Figure 3—source code 2
Source Code File_4CMYCcount.txt.
The file containing the 4C-seq read counts used in Figure 3-Source Code File.
- https://cdn.elifesciences.org/articles/47980/elife-47980-fig3-code2-v1.txt
-
Figure 3—source code 3
Source Code File_4CMYCcolor.txt.
The file used in Figure 3-Source Code File to specify the dot colors in the PCA plots.
- https://cdn.elifesciences.org/articles/47980/elife-47980-fig3-code3-v1.txt
-
Figure 3—source code 4
Source Code File_4CMYCshape.txt.
The file used in Figure 3-Source Code File to specify the dot shapes in the PCA plots.
- https://cdn.elifesciences.org/articles/47980/elife-47980-fig3-code4-v1.txt
-
Figure 3—source data 1
4C-seq read counts in the given intervals.
- https://cdn.elifesciences.org/articles/47980/elife-47980-fig3-data1-v1.xlsx
Figure 3—figure supplement 1
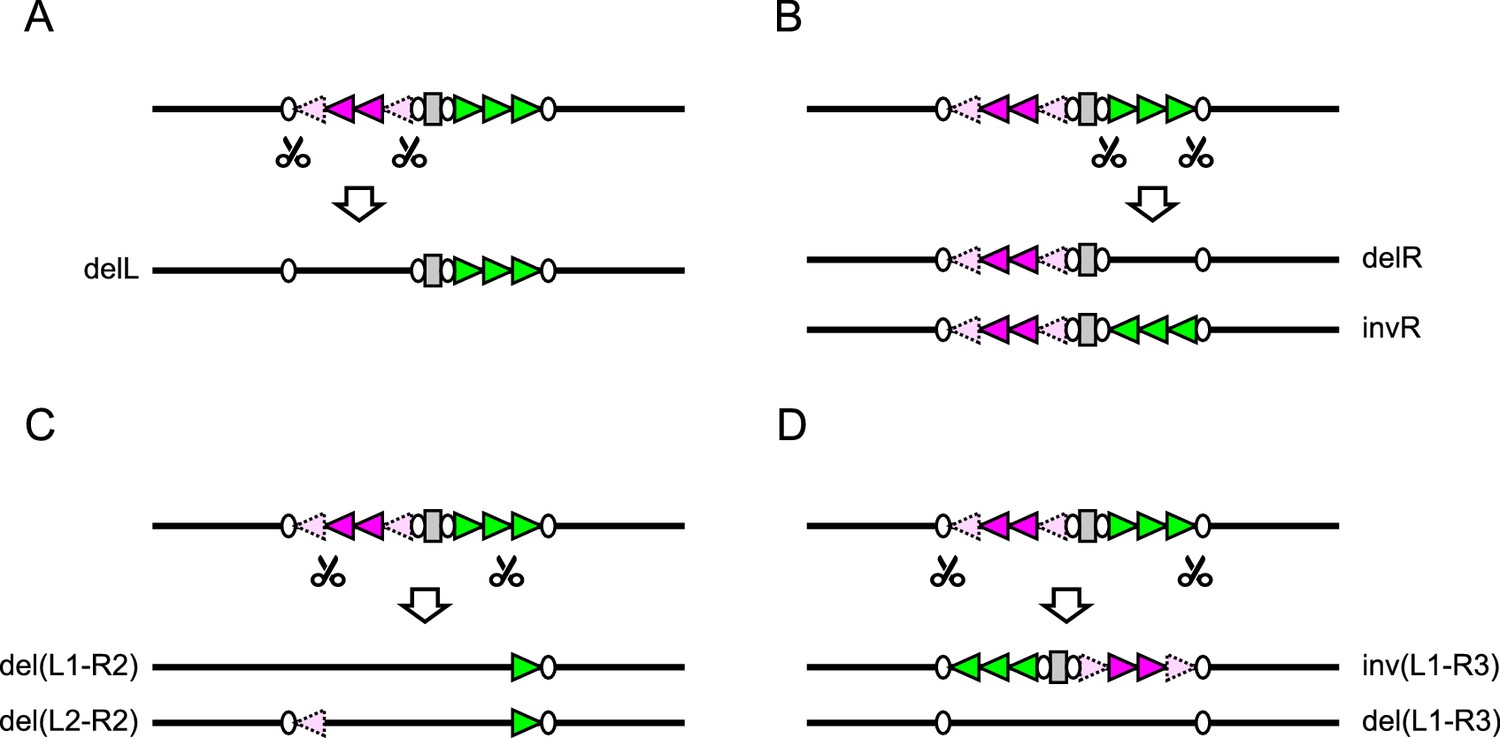
CRISPR editing to make partial deletion and inversion alleles of STITCH.
(A–D) Guide RNAs designed against the two target sites represented by scissors were assembled with the CRISPR/Cas9 and transfected. Then we obtained the resulting clones.
Figure 3—figure supplement 2
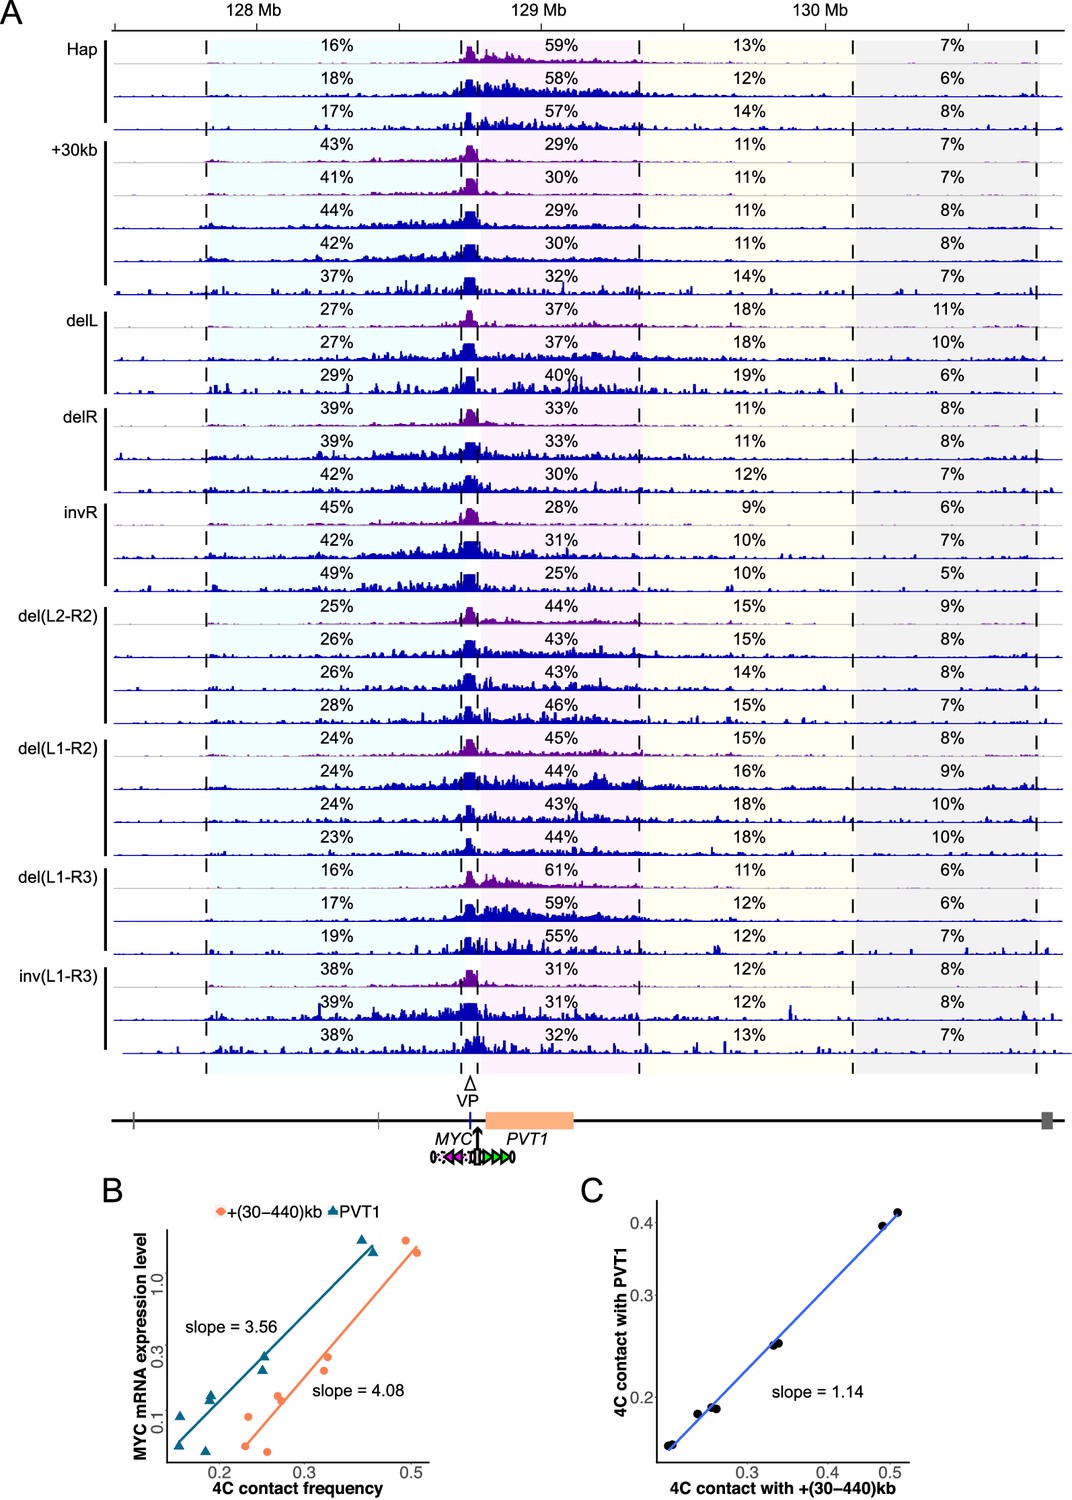
4C-seq profiles of STITCH mutants.
(A) 4C-seq tracks in different alleles of STITCH mutants from VP-MYC1 (purple) and VP-MYC2 (blue). The numbers indicate ratios of mapped reads to given intervals within the locally haploid 3 Mb region except for the 10 kb region from the viewpoint fragment. (B) The log-log plot of the MYC expression levels against the 4C contact frequency of VP-MYC1 with the +(30-440)kb region (orange) and with the PVT1 region (blue). (C) The log-log plot of the 4C contact frequency of VP-MYC1 with the PVT1 region against that with the +(30-440)kb region.
Figure 3—figure supplement 3
The directionality of chromatin folding around STITCH.
(A) The 4C-seq profiles from VP-MYC1, -MYC2, -STITCH-left, and -STITCH-right in Hap, STITCH+30kb. The tracks of the VP-MYC1 and VP-MYC2 are the same as those in Figure 3—figure supplement 2A. The numbers indicate the ratios of sequence reads mapped to given intervals within the 1 Mb distance from the viewpoints. The reads within the 10 kb regions from the viewpoint fragment are not counted. Different tracks are results of replicate experiments. At the top, the contact domains/TADs organization in human ESCs (see Figure 1B; Dixon et al., 2015) is depicted. The CTCF-binding sites called in this study are also indicated by flags, as in Figure 1B. (B) The difference of the reads between the right and the left sides for the indicated distances (1 Mb, 500 kb, or 100 kb), normalized by the sum of the reads on both sides, are plotted for each viewpoint as the directionality scores of chromatin folding.
Figure 3—figure supplement 4
The 4C-seq PCA plot of STITCH+30kb and the mutant clones without the non-blocking alleles (Hap and del(L1-R3)) (left) and the component loadings of PC1 (right) for the whole locus.
Figure 4 with 1 supplement
Epigenetic profile around MYC with and without STITCH.
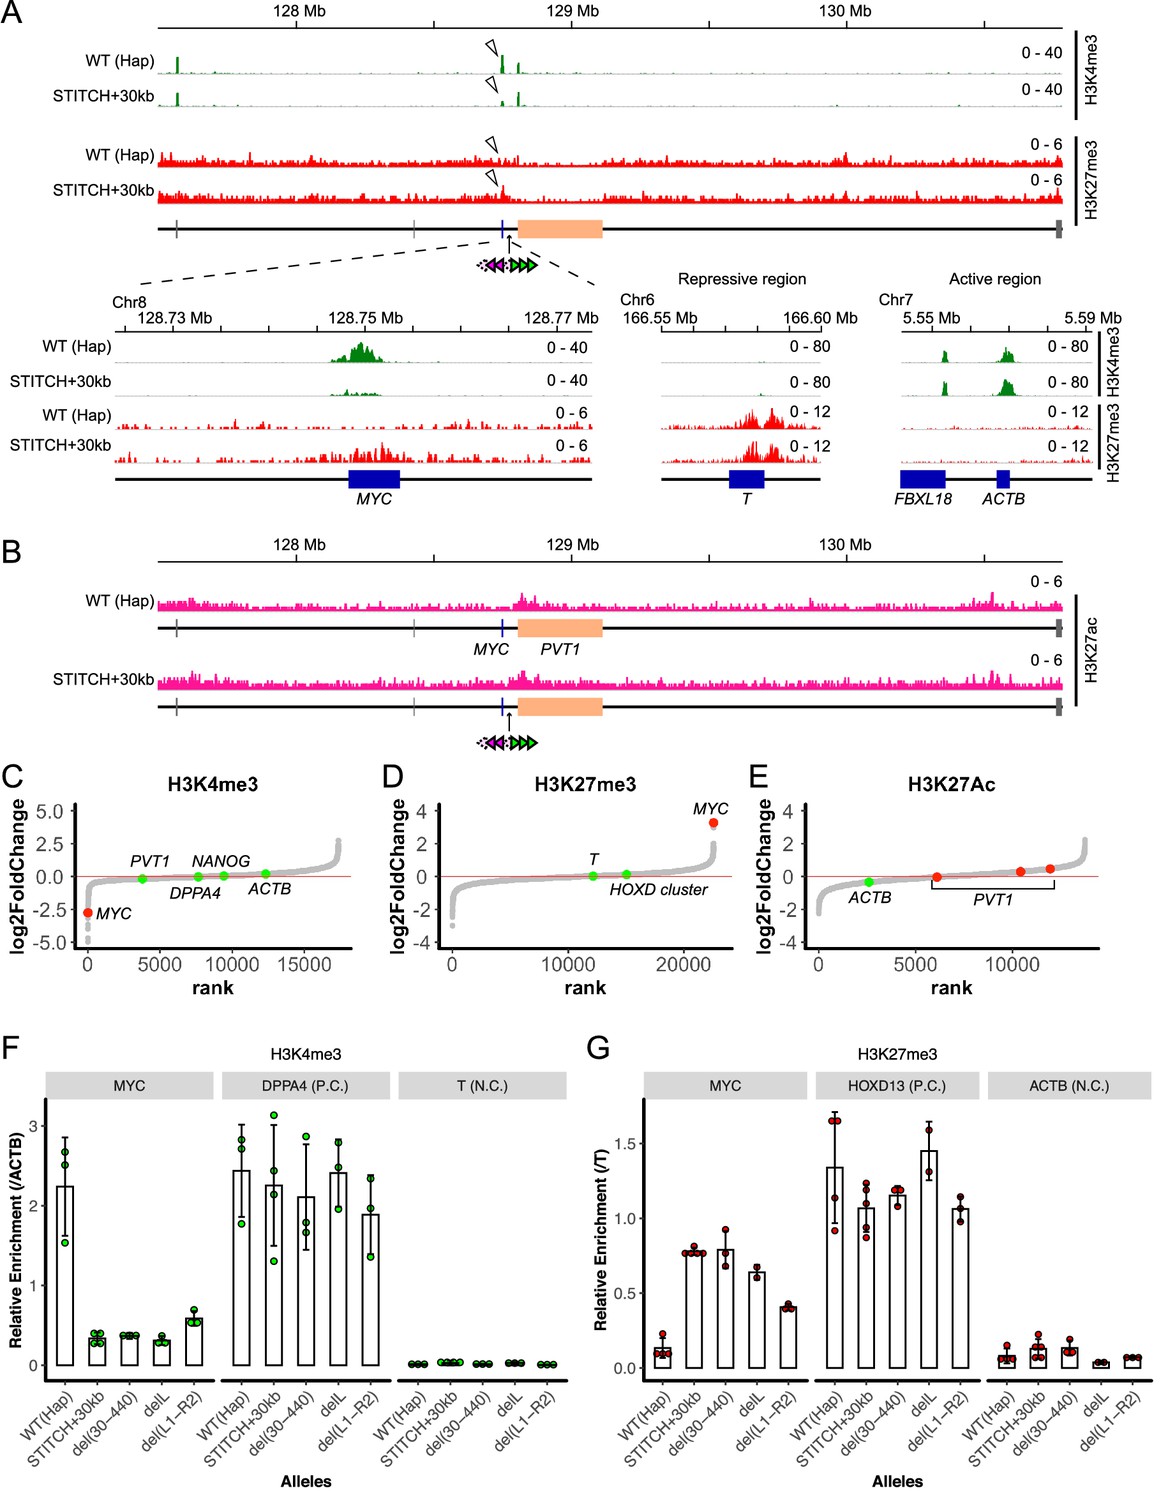
(A) nChIP-seq for H3K4me3 (green) and H3K27me3 (red) in the wild type (Hap) and STITCH+30kb clones. The magnified view around MYC is shown below, together with the typical repressive (T) and the active (ACTB) regions. (B) nChIP-seq for H3K27ac in Hap and STITCH+30kb. (C–E) The peaks of H3K4me3 (C), H3K27me3 (D), and H3K27ac (E) are ordered according to the normalized log2 fold changes in STITCH+30kb. The H3K4me3 and H3K27me3 peaks at MYC are depicted with red, and peaks at other representative genes are depicted with green, in C and D, respectively. Similarly, H3K27ac peaks within the PVT1 genic region are depicted with red in E. (F and G) nChIP-qPCR for H3K4me3 (F) and H3K27me3 (G) in Hap, STITCH+30kb and the indicated mutant alleles of STITCH. The enrichment at MYC was normalized with those at ACTB (F) and T (G). We also quantified the relative enrichment at DPPA4 and T for H3K4me3 (F), and HOXD13 and ACTB for H3K27me3 (G), as positive and negative controls, respectively. The dots represent data from replicate experiments. The bars and the error bars indicate their means and the standard deviations (SD), respectively.
-
Figure 4—source data 1
nChIP-seq read counts in the peaks for H3K4me3, H3K27me3, and H3K27ac.
- https://cdn.elifesciences.org/articles/47980/elife-47980-fig4-data1-v1.xlsx
Figure 4—figure supplement 1
ChIP-seq profiling of Hap and STITCH+30kb alleles.
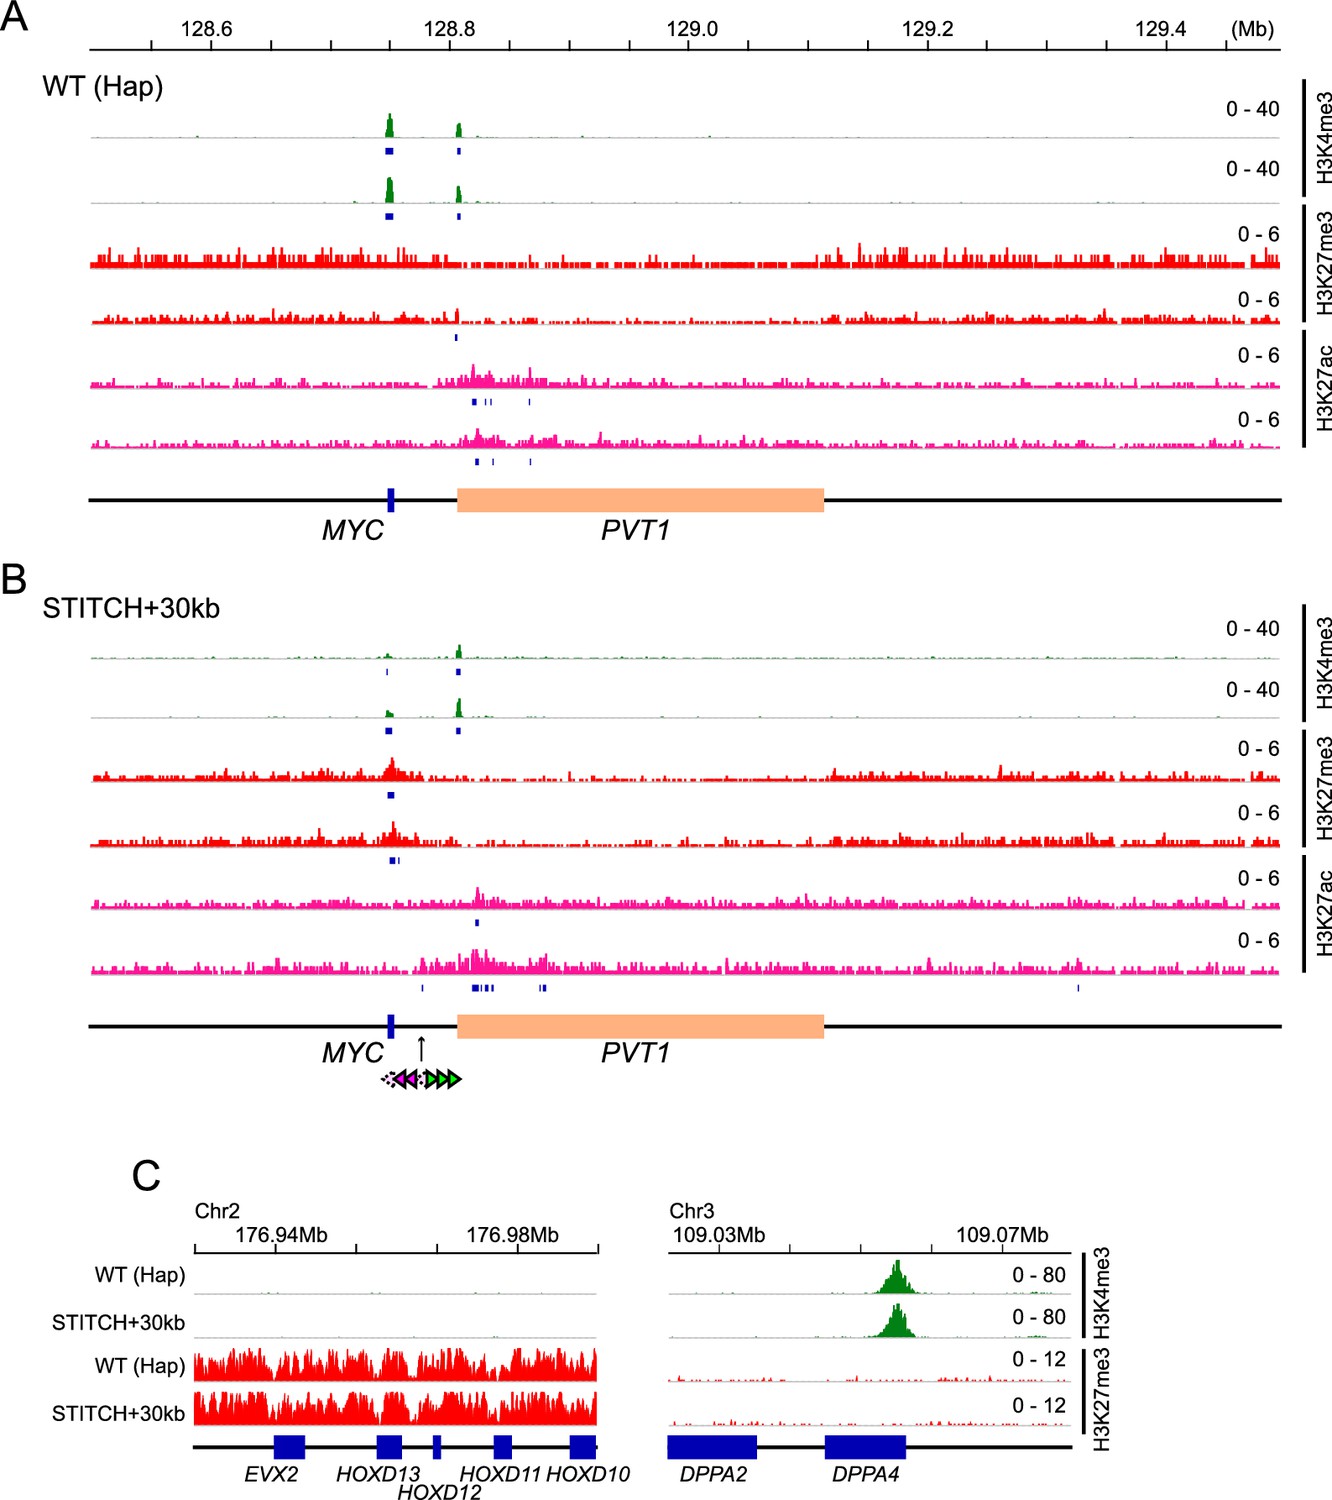
(A, B) The nChIP-seq tracks for H3K4me3 (green), H3K27me3 (red), and H3K27ac (pink) of Hap (A) and STITCH+30kb (B) alleles with replicate experiments. Regions called as peaks are represented by bars below the tracks. (C) The magnified view of the H3K4me3 and H3K27me3 tracks in Hap and STITCH+30kb around the typically repressive (HOXD13) and the active (DPPA4) regions.
Figure 5 with 1 supplement
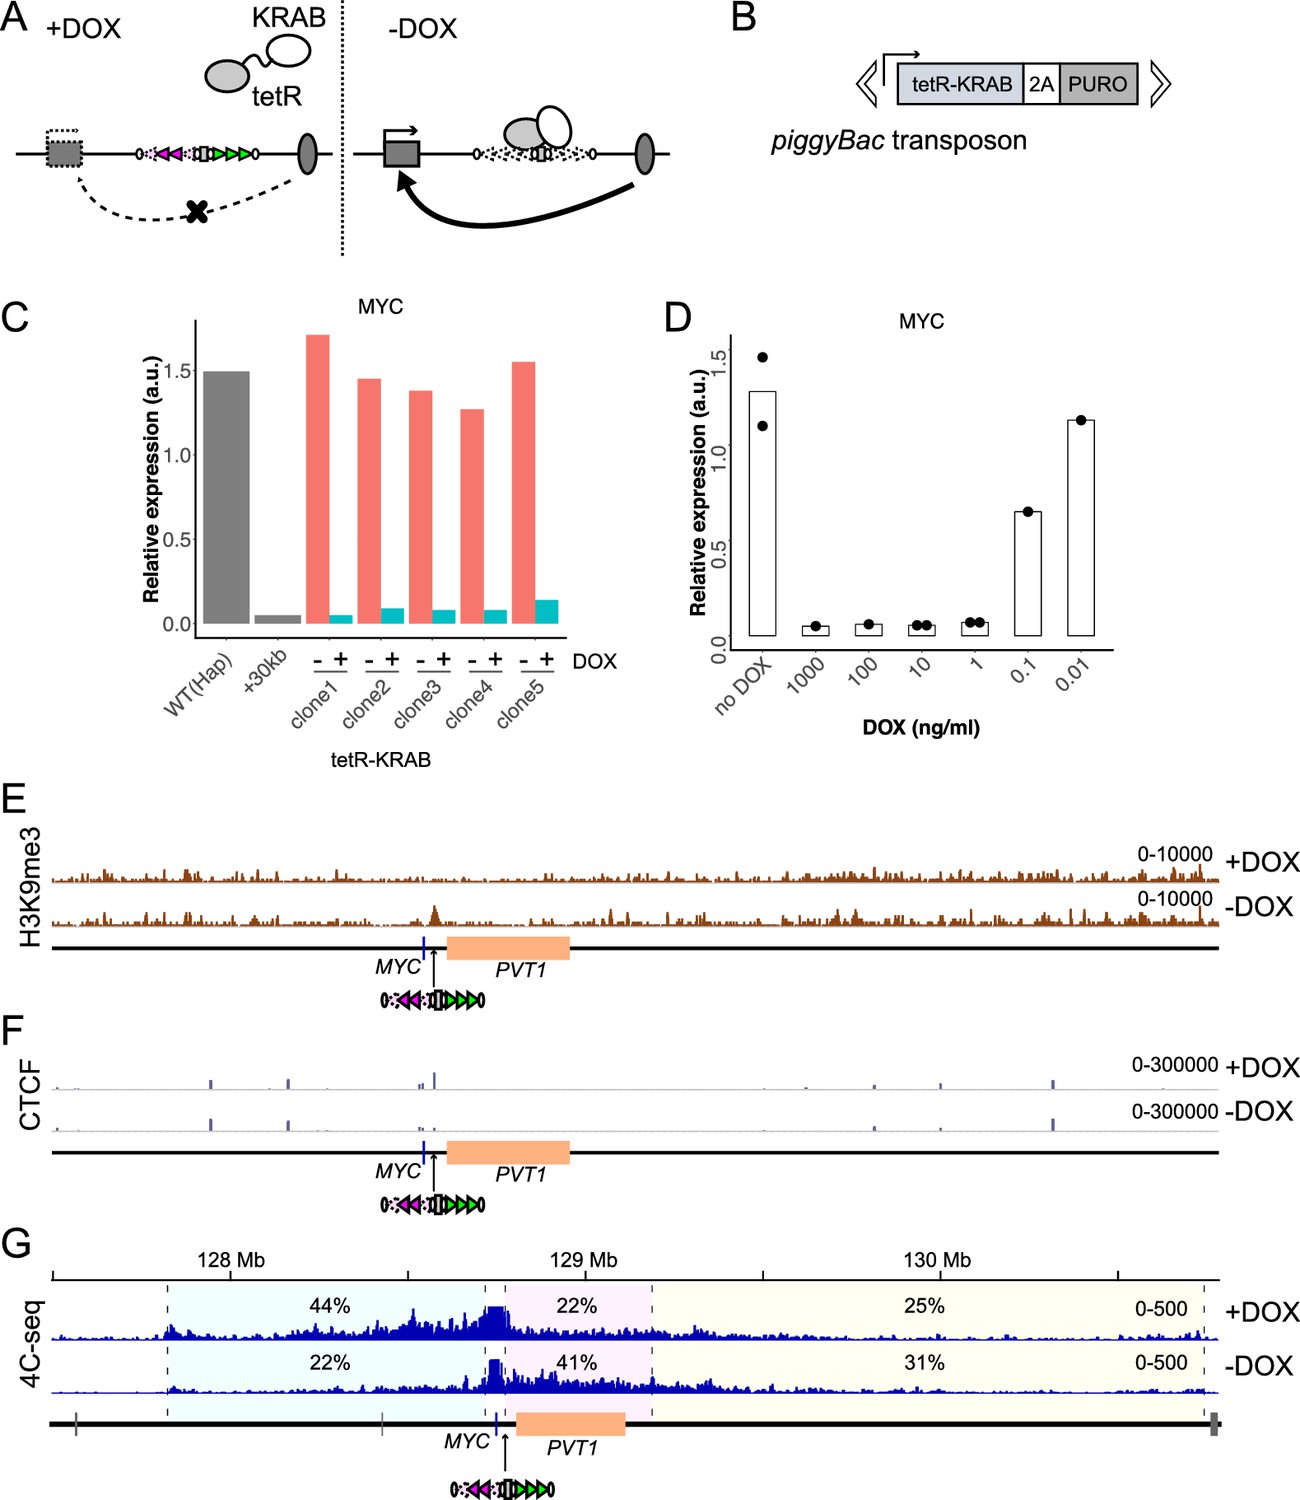
Drug-inducible control of STITCH insulation with tetR-KRAB.
(A) DOX dependent binding to and dissociation from STITCH of tetR-KRAB. (B) The piggyBac transposon with the tetR-KRAB transgene followed by a sequence encoding 2A peptide and puromycin resistant gene. (C) The relative expression levels of MYC normalized to ACTB in five independent clones of STITCH/KRAB with and without DOX were compared to the expression levels of the ancestral Hap and STITCH+30kb clones from which the STITCH/KRAB clones were derived. (D) The MYC expression level in the clone 1 of STITCH/KRAB with different concentrations of DOX. The dots represent data from replicate experiments, and the bars indicate the means. (E, F) nChIP-seq tracks for H3K9me3 (E) and CTCF (F) of the clone one with and without DOX. The reads were mapped to a synthetic genomic DNA sequence around the MYC locus carrying the STITCH insert. (G) The 4C-seq tracks with and without DOX from VP-MYC2. The numbers indicate the ratios of sequence reads mapped to given intervals within the locally haploid 3 Mb region except for the 10 kb region from the viewpoint fragment.
-
Figure 5—source data 1
4C-seq read counts in the given intervals, and CTCF nChIP-seq read counts in the peaks.
- https://cdn.elifesciences.org/articles/47980/elife-47980-fig5-data1-v1.xlsx
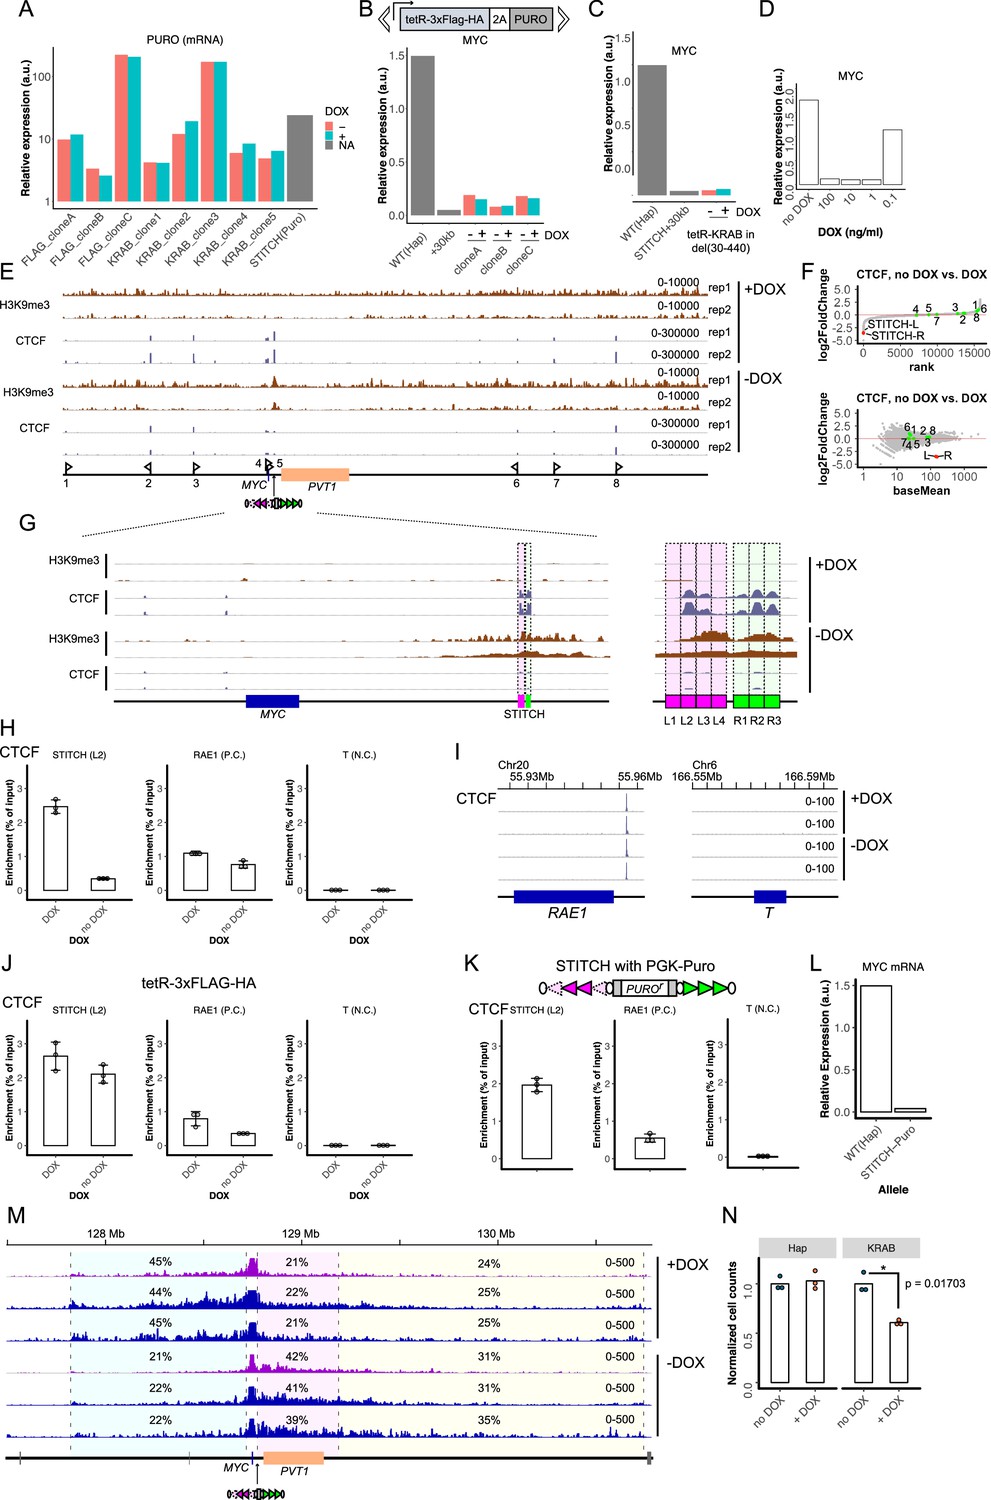
Figure 5—figure supplement 1
Heterochromatin induction by tetR-KRAB at STITCH.
(A) The relative expression levels of the PUROr gene normalized to ACTB in the three clones of STITCH/tetR-3xFlag-HA and the five clones of STITCH/KRAB, with and without DOX. We also compared the PUROr expression level in the STITCH+30kb clone with the selection cassette before the Cre induction. (B) The MYC expression levels normalized to ACTB in the three STITCH/tetR-3xFlag-HA clones with and without DOX. The MYC expression levels of ancestral Hap and STITCH+30kb clones are also plotted. (C) The MYC expression level normalized to ACTB in a del(30-440)/tetR-KRAB clone with and without DOX, together with those in the ancestral Hap and STITCH+30kb clones. (D) The relative MYC expression levels of the clone 3 of STITCH/KRAB with different concentrations of DOX. (E) The nChIP-seq tracks for H3K9me3 and CTCF with and without DOX. The reads were mapped to a synthetic genomic DNA sequence around the MYC locus with the STITCH insert. The experiments were performed in duplicates (rep1 and rep2). (F) The normalized log2 fold changes in STITCH/KRAB without DOX compared to with DOX were calculated for all the peaks of CTCF nChIP-seq. The peaks are ordered according to the rank of the fold change (upper) and also plotted as an MA-plot. (G) Magnified views around STITCH of (E). (H) nChIP-qPCR for CTCF binding at the L2 motif of STITCH in the STITCH/KRAB clone with and without DOX. As the negative and positive controls, the enrichment at T and the binding site near RAE1 was also quantified. (I) The CTCF nChIP-seq tracks around RAE1, and T. (J) nChIP-qPCR for CTCF binding at L2, RAE1, and T in the STITCH/tetR-3xFLAG-HA with and without DOX. (K) CTCF nChIP-qPCR at L2, RAE1, and T in the STITCH+30kb with the PUROr cassette before the Cre recombination. (L) The MYC expression level in the STITCH+30kb with the PUROr cassette, compared to the expression level of the Hap clone. (M) The 4C-seq tracks in the STITCH/KRAB clone with and without DOX from VP-MYC1 (purple) and VP-MYC2 (blue). The numbers indicate ratios of mapped reads to given intervals within the locally haploid 3 Mb region except for the 10 kb region from the viewpoint fragment. (N) Normalized cell numbers after five-days culture with and without DOX. The dots represent replicates, and the bars indicate their means. * indicates p<0.05 by two-sided Welch's two-sample t-test.
Figure 6
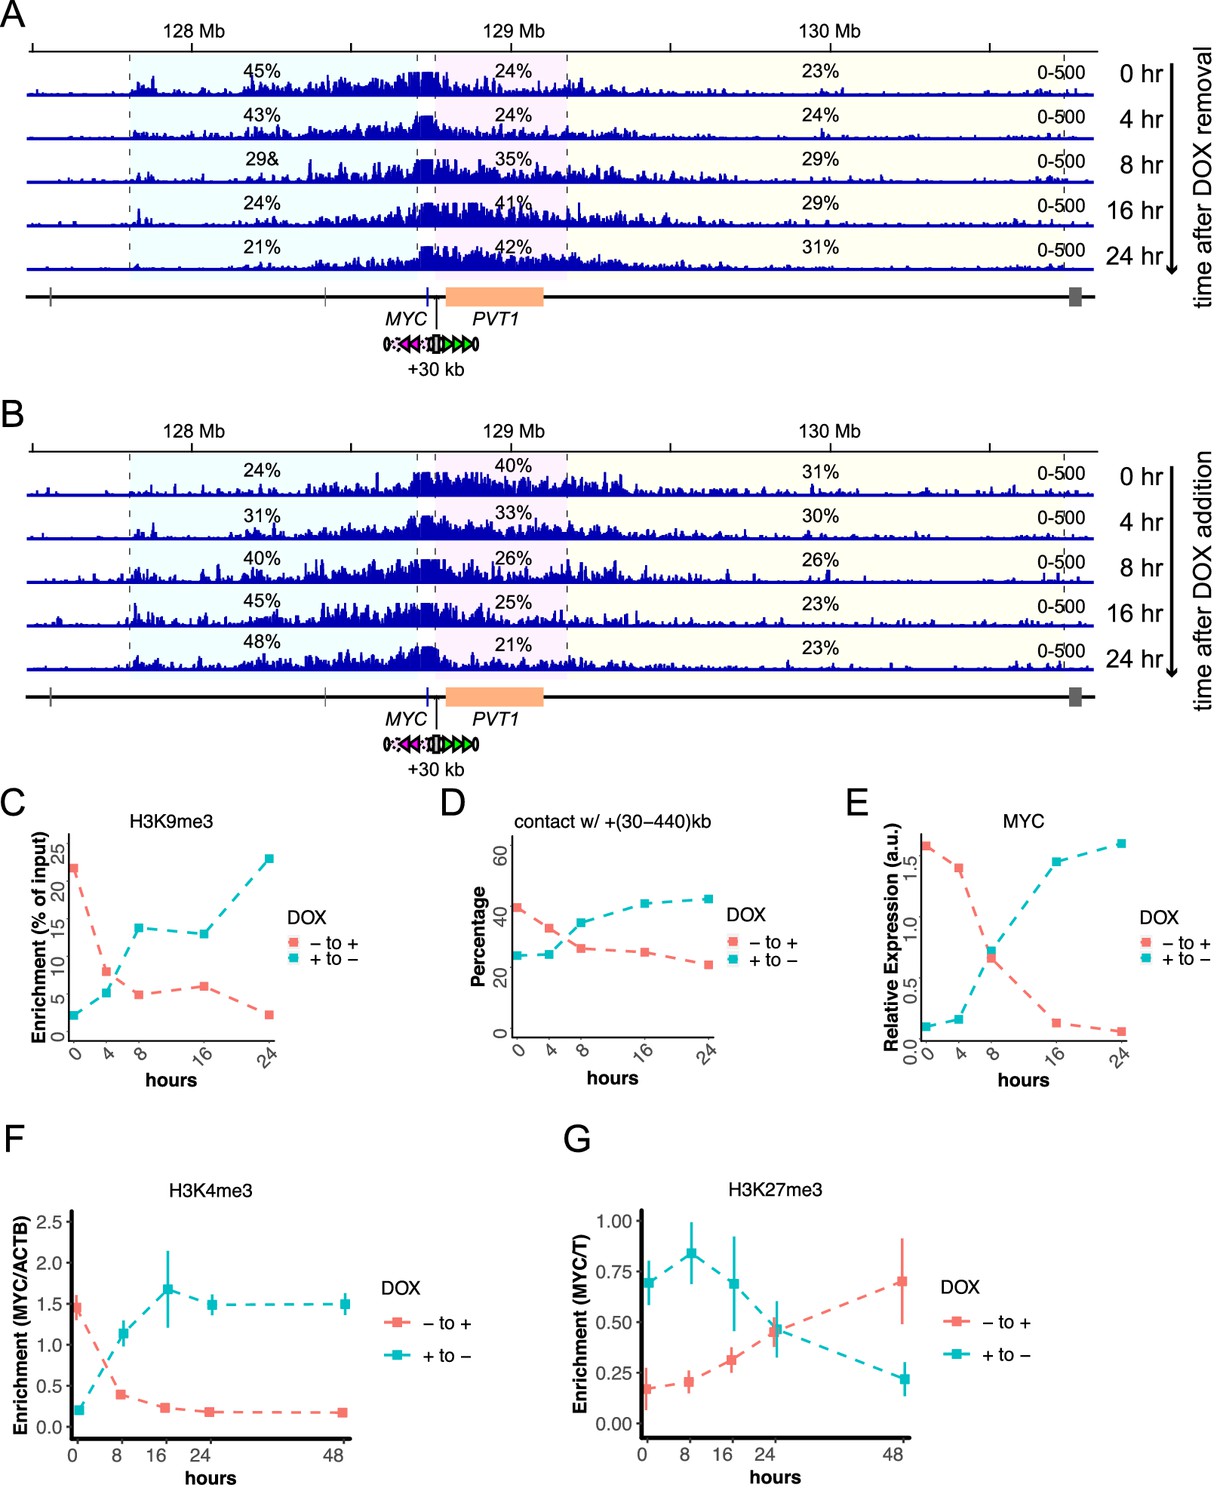
Temporal changes of STITCH insulation upon removal and addition of DOX.
(A, B) The 4C-seq profiles in 0, 4, 8, 16, and 24 hr after removal (A) and addition (B) of DOX. The numbers indicate the ratios of sequence reads mapped to given intervals within the locally haploid 3 Mb region except for the 10 kb region from the viewpoint fragment. (C–E) Temporal changes of nChIP-qPCR for H3K9me3 at STITCH (C), 4C contact frequency with +(30-440)kb region from VP-MYC2 (D), the relative MYC expression level normalized to ACTB (E). (F, G) Temporal changes of relative enrichment of H3K4me3 at MYC normalized with that at ACTB (F), and relative enrichment of H3K27me3 at MYC normalized with that at T (G), up to 48 hr after removal and addition of DOX. We did not perform replicate experiments in (A–E). The nChIP-qPCR for H3K4me3 and H3K27me3 were performed for three replicate samples. The means and SDs are represented in the plots (F, G).
-
Figure 6—source data 1
4C-seq read counts in the given intervals, and the results of nChIP-qPCR for H3K4me3 and H3K27me3.
- https://cdn.elifesciences.org/articles/47980/elife-47980-fig6-data1-v1.xlsx
Figure 7

Delayed turnover of H3K27me3 enrichment after the gene expression change.
(A–F) Relative MYC expression levels normalized to ACTB (A and B), relative H3K27me3 enrichment at MYC normalized to the enrichment at T (C and D) and relative H3K4me3 level at MYC normalized to that at ACTB (E and F) were measured at 24 hr (1 day) and 72 hr (3 days) after removal (A, C, E) or addition (B, D, F) of DOX in the STITCH/KRAB. The controls are the cells kept without (A, C, E) or with (B, D, F) DOX without switching for a few passages. The dots represent data from replicate experiments, the bars indicate their means, and the error bars indicate the SDs. *, *** and n.s. indicate p<0.05, p<0.001 and p>0.05, respectively, by one-way ANOVA. The p-values with Tukey’s multiple-comparison post hoc test are indicated. (G, H) Enrichment of H3K27me3 (G) and H3K4me3 (H) at MYC after two days treatment with EPZ or DMSO in STITCH+30kb. The dots represent replicates, the bars indicate their means, and the error bars indicate the SDs. * and n.s. indicate p<0.05 and>0.05, respectively, by two-sided Welch's two-sample t-test. (I) Relative MYC expression levels in the Hap, STITCH+30kb, and the mutants of STITCH after three-days treatment of EPZ or DMSO. The dots represent replicates, and the bars indicate their means. (J) Temporal changes of relative MYC expression levels after DOX removal in the STITCH/KRAB. Before DOX was removed, cells were exposed to EPZ or DMSO for two days. Means and SDs of three replicate experiments were plotted. (I, J) n.s. indicates p>0.05, by one-sided Welch's two-sample t-test, in which the alternative hypothesis was that the mean of EPZ was greater than DMSO.
-
Figure 7—source data 1
MYC expression levels upon removal of DOX with DMSO or EPZ.
- https://cdn.elifesciences.org/articles/47980/elife-47980-fig7-data1-v1.xlsx
Figure 8 with 2 supplements

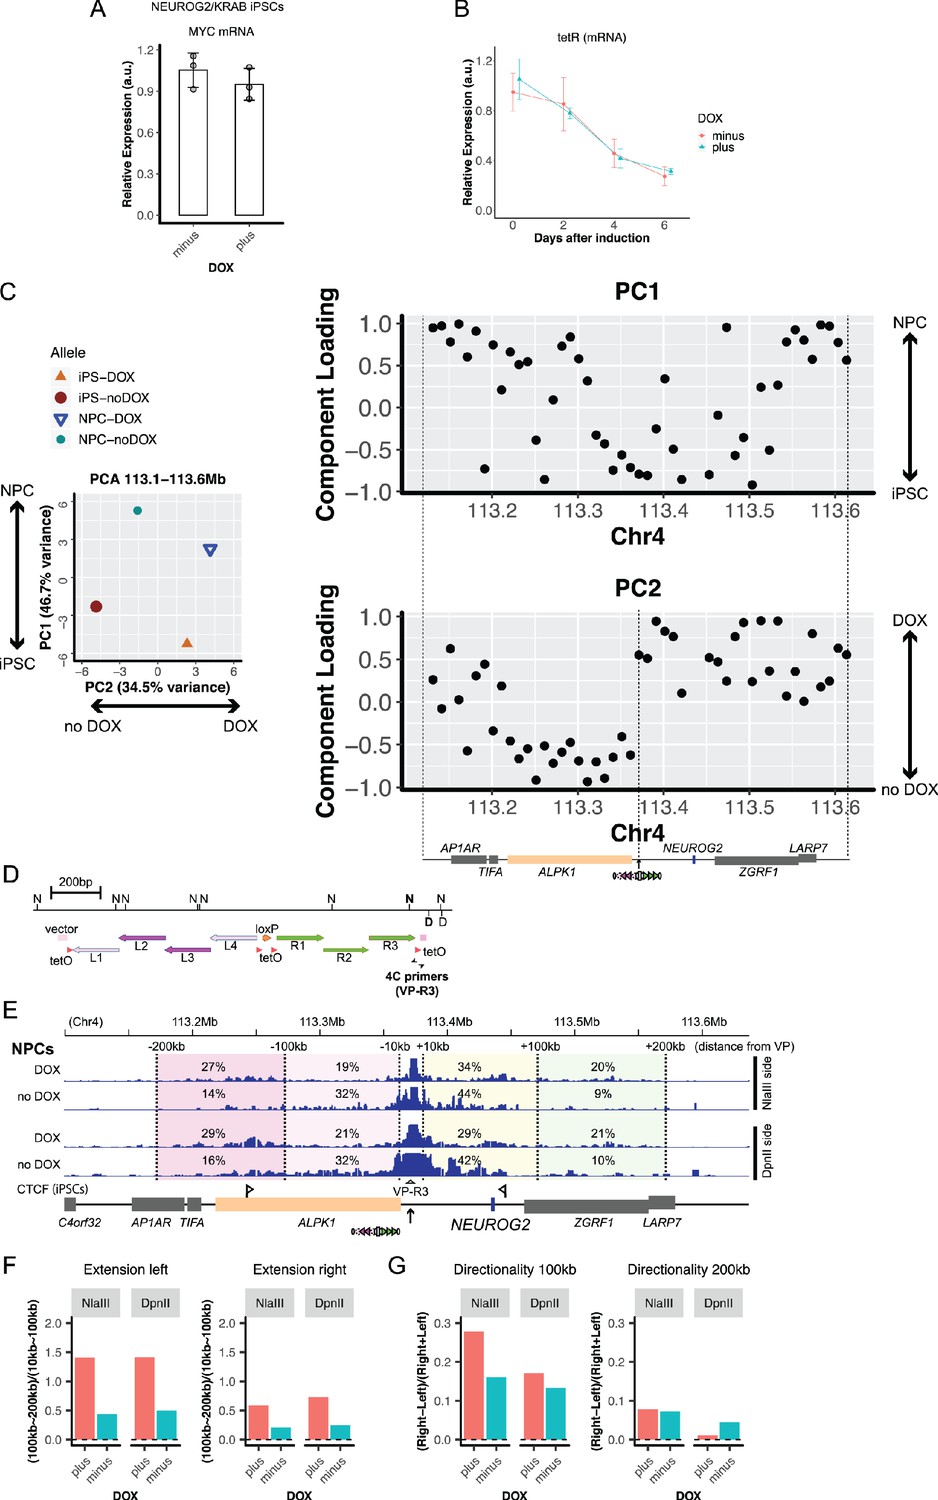
Testing STITCH/KRAB at the NEUROG2 locus in the neural progenitor cells.
(A) STITCH was inserted into the 65 kb downstream of NEUROG2 near ALPK1. There seem active enhancers over the ALPK1 genic region, as indicated by the previously reported H3K27ac profile in the NPCs (Xie et al., 2013). (B) The schematic illustration of the NEUROG2/KRAB cells (left) and the differentiation experiments (right). (C) The relative expression levels of NEUROG2, PAX6, and NANOG normalized by the ACTB expression levels during the differentiation process. Day 0 indicates iPSCs with or without DOX collected just before the start of the neural induction. The numbers of replicates were three for day 0 and four for days 2, 4, and 6. The means and the SDs of the replicate experiments are represented. The indicated p-values are obtained by one-sided Welch's two-sample t-test, where the alternative hypothesis was that the mean of DOX minus was greater than DOX plus. * and n.s. indicate p<0.05 and>0.05, respectively. (D and E) nChIP-qPCR for H3K9me3 (D) and CTCF (E) enrichment at STITCH (the L2 motif region) in iPSCs and NPCs (day6) with and without DOX. We also quantified the enrichment at ZNF544 (D) and RAE1 (E) regions as the positive controls for H3K9me3 and CTCF, respectively. We used the region around T as the negative control for both assays. (F) 4C-seq from VP-NEUROG2 in iPSCs and NPCs with and without DOX. The numbers indicate the ratios of the mapped reads in the given intervals.
-
Figure 8—source code 1
Source Code File_4CNGN2color.txt.
The file used in Figure 3-Source Code File to specify the dot colors in the PCA plots.
- https://cdn.elifesciences.org/articles/47980/elife-47980-fig8-code1-v1.txt
-
Figure 8—source code 2
Source Code File_4CNGN2count.txt.
The file containing the 4C-seq read counts used in Figure 3-Source Code File.
- https://cdn.elifesciences.org/articles/47980/elife-47980-fig8-code2-v1.txt
-
Figure 8—source code 3
Source Code File_4CNGN2shape.txt.
The file used in Figure 3-Source Code File to specify the dot shapes in the PCA plots.
- https://cdn.elifesciences.org/articles/47980/elife-47980-fig8-code3-v1.txt
-
Figure 8—source data 1
Relative gene expression levels of NEUROG2, PAX6, NANOG, and tetR in differentiating NPCs, and 4C-seq read counts in the given intervals.
- https://cdn.elifesciences.org/articles/47980/elife-47980-fig8-data1-v1.xlsx
Figure 8—figure supplement 1
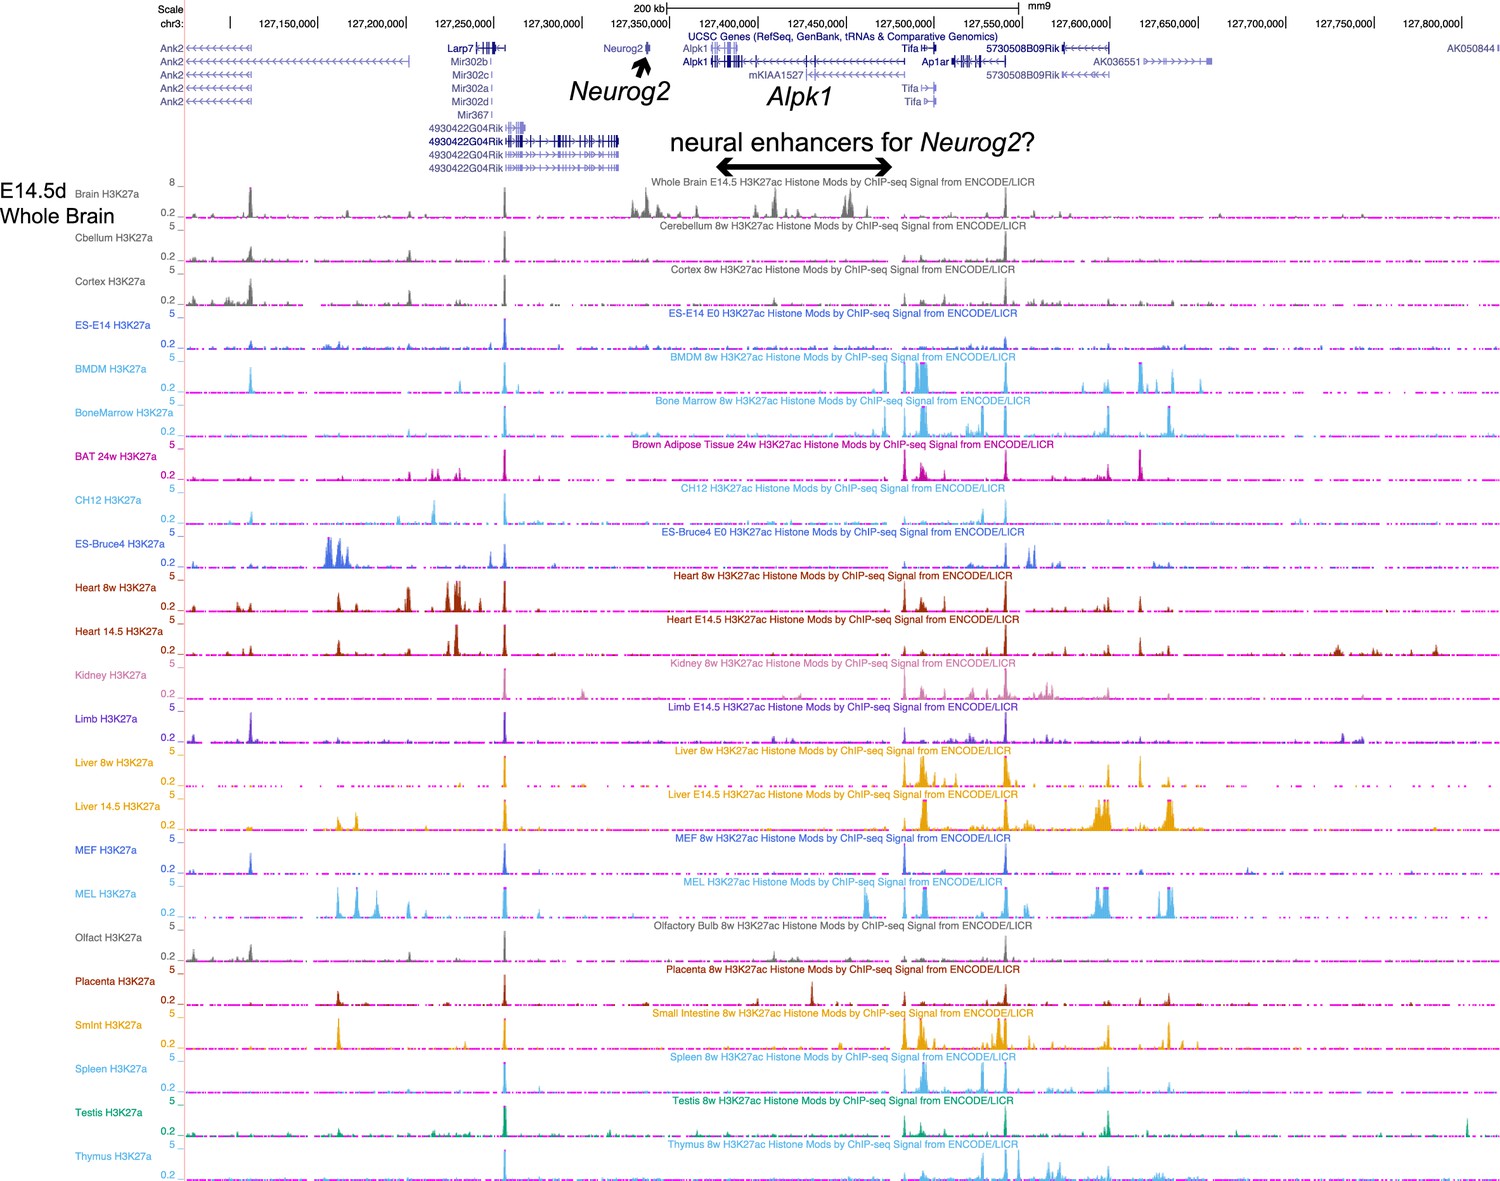
The UCSC genome browser view of the mouse genome around Neurog2 (mm9).
Below are the ENCODE/LICR H3K27ac tracks in various tissues (ENCODE Project Consortium, 2012). Note there are several tissue-specific peaks over the Alpk1 region in the E14.5d whole brains that are not seen in the other tissues.
Figure 8—figure supplement 2
Characterization of the NEUROG2/KRAB cells.
(A) The MYC mRNA expression levels normalized to ACTB in the NEUROG2/KRAB cells with and without DOX. (B) The relative expression levels of the tetR-KRAB transgene normalized to ACTB in the differentiating NEUROG2/KRAB cells. (C) The PCA plot (left) of the 4C-seq data from VP-NEUROG2 in iPSCs and NPCs with and without DOX and the component-loading plots of PC1 and PC2 (right). (D) The 4C-seq viewpoint, VP-R3, designed within the inserted STITCH cassette is depicted. N and D along the map represent the recognition sites of NlaIII and DpnII, respectively. (E) The 4C-seq plots from VP-R3 in NPCs with and without DOX. The sequencing was performed in the paired-end mode, and the reads from each of the NlaIII and DpnII sides were analyzed independently. The CTCF-binding sites identified in this study in iPSCs are depicted by the triangle flags, as in Figure 1B. The numbers indicate the ratios of sequence reads mapped to given intervals from the viewpoints. The reads within the 10 kb regions are not counted. (F) The degree of contact extension is represented by the ratio of the read counts between 100 and 200 kb distance region normalized by those immediately within the 100 kb region except for the closest 10 kb. (G) The directionality of the chromatin folding is represented by the difference of the reads between the right and the left sides for the indicated distances (100 kb or 200 kb), normalized by the sum of the reads on both sides.
-
Figure 8—figure supplement 2—source code 1
Source Code File.
The R code for the PCA in Figure 8—figure supplement 2C.
- https://cdn.elifesciences.org/articles/47980/elife-47980-fig8-figsupp2-code1-v1.r
Figure 9
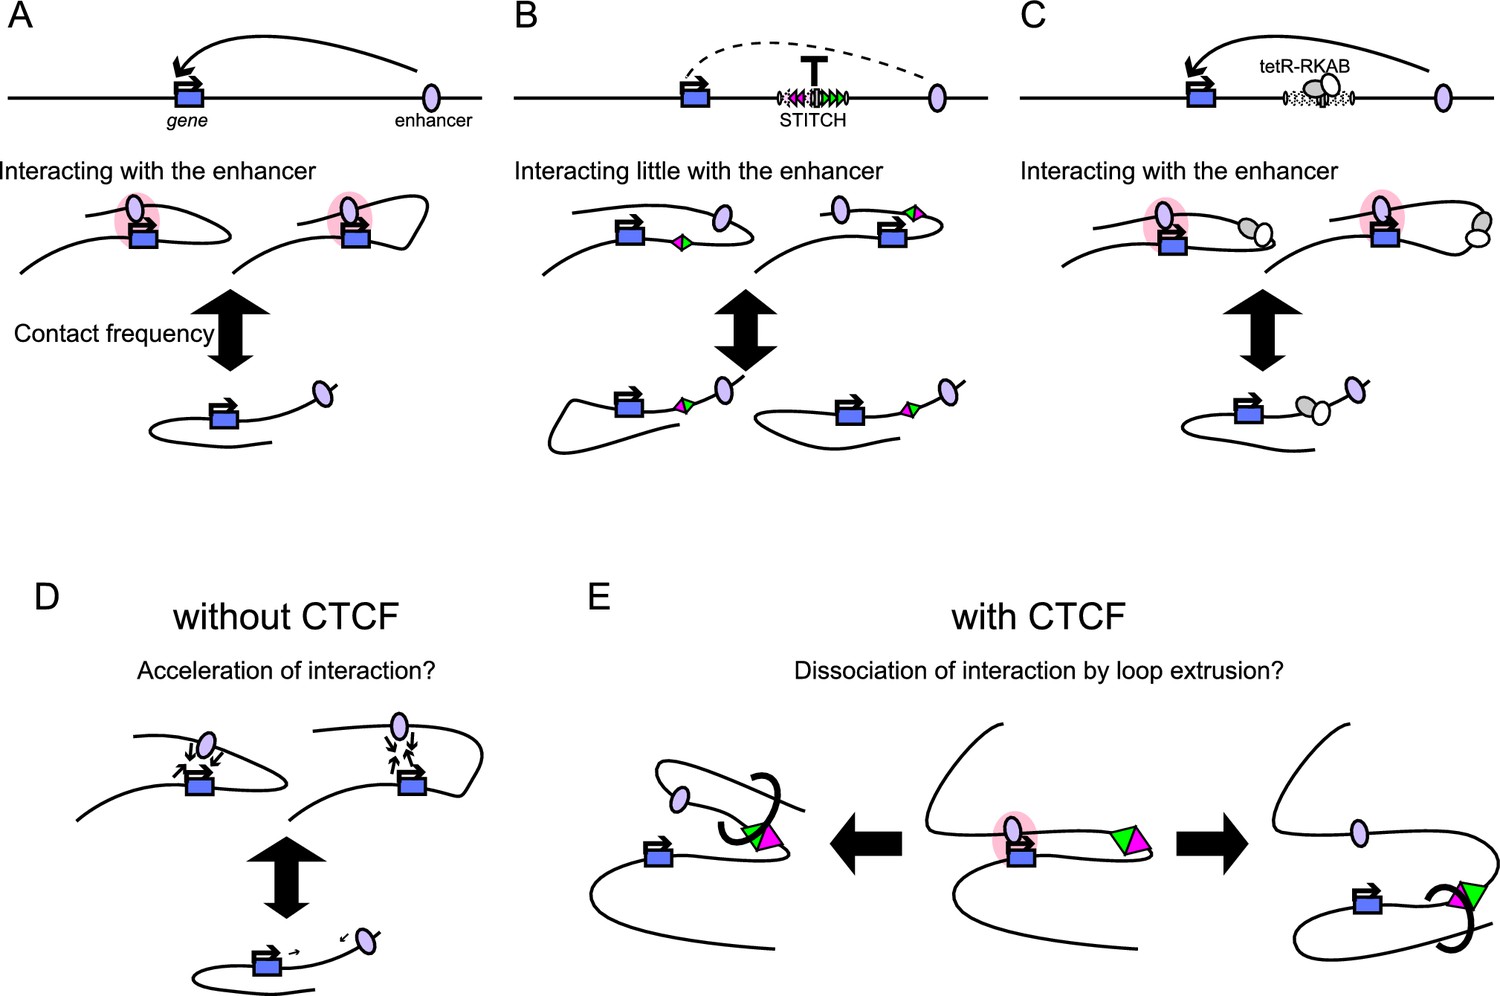
Summary of the STITCH system and models for the CTCF insulation.
(A, B) Schematic illustration of how STITCH blocks the gene-enhancer interaction. STITCH insertion efficiently blocks the interaction, while it also alters the contact tendency of the locus though less prominently. (C) Upon the tetR-KRAB induction, the contact frequency becomes normal, and the gene-enhancer interaction is restored. (D–E) Models of how CTCF efficiently impairs the gene-enhancer interaction. There might be a mechanism that a slight increase/decrease of contact frequency leads to a drastic increase/decrease of the gene-enhancer interaction (D). Also. CTCF might actively disentangle the gene-enhancer interaction through loop extrusion (E).
Tables
Key resources table
| Reagent type (species) or resource | Designation | Source or reference | Identifiers | Additional information |
|---|---|---|---|---|
| Cell line (Homo-sapiens) | 253G1 induced pluripotent stem cells | RIKEN BRC | HPS0002: 253G1, RRID:CVCL_B518 | |
| Cell line (Homo-sapiens) | Hap | This paper | 3 Mb deletion of an allele around MYC, in 253G1 cells | |
| Cell line (Homo-sapiens) | STITCH-30kb | This paper | STITCH insertion into 30 kb upstream of MYC, in Hap cells | |
| Cell line (Homo-sapiens) | STITCH+30kb | This paper | STITCH insertion into 30 kb downstream of MYC, in Hap cells | |
| Cell line (Homo-sapiens) | STITCH+440kb | This paper | STITCH insertion into 440 kb downstream of MYC, in Hap cells | |
| Cell line (Homo-sapiens) | STITCH+1760kb | This paper | STITCH insertion into 1760 kb downstream of MYC, in Hap cells | |
| Cell line (Homo-sapiens) | STITCH+1790kb | This paper | STITCH insertion into 1790 kb downstream of MYC, in Hap cells | |
| Cell line (Homo-sapiens) | del(30-440) | This paper | Deletion of +(30.440)kb region in Hap cells | |
| Cell line (Homo-sapiens) | delL | This paper | Deletion of the CTCF binding sites L1-L4 of STITCH in STITCH+30kb | |
| Cell line (Homo-sapiens) | delR | This paper | Deletion of the CTCF binding sites R1-R3 of STITCH in STITCH+30kb | |
| Cell line (Homo-sapiens) | invR | This paper | Inversion of the CTCF binding sites R1-R3 of STITCH in STITCH+30kb | |
| Cell line (Homo-sapiens) | inv(L1-R3) | This paper | Inversion of the whole STITCH in STITCH+30kb | |
| Cell line (Homo-sapiens) | del(L1-R3) | This paper | Deletion of the whole STITCH in STITCH+30kb | |
| Cell line (Homo-sapiens) | del(L2-R2) | This paper | Deletion of the CTCF binding sites L2-R2 of STITCH in STITCH+30kb | |
| Cell line (Homo-sapiens) | del(L1-R2) | This paper | Deletion of the CTCF binding sites L1-R2 of STITCH in STITCH+30kb | |
| Cell line (Homo-sapiens) | STITCH+30kb/KRAB | This paper | STITCH+30kb with piggyBac integration of tetR-KRAB-2A-Puror | |
| Cell line (Homo-sapiens) | STITCH+30kb/tetR-3xFLAG-HA | This paper | STITCH+30kb with piggyBac integration of tetR-3xFLAG-HA-2A-Puror | |
| Cell line (Homo-sapiens) | STITCH+30kb with Puror | This paper | STITCH+30kb with Purorinside STITCH | |
| Cell line (Homo-sapiens) | del(30-440)/KRAB | This paper | del(30-440) with piggyBac integration of tetR-KRAB-2A-Puror | |
| Cell line (Homo-sapiens) | NEUROG2/KRAB | This paper | STITCH insertion into the 65 kb downstream of NEUROG2 in Hap cells, with piggyBac integration of tetR-KRAB-2A-Puror | |
| Transfected construct (Escherichia virus P1) | Cre Recombinase encoding mRNA | OZ Biosciences | Cat#MRNA32-20 | synthetic mRNA encoding Cre recombinase |
| Antibody | anti-CTCF (Rabbit polyclonal) | Millipore | Cat#07–729, RRID:AB_441965 | ChIP (1:88) |
| Antibody | anti-H3K4me3 (mouse monoclonal) | MAB Institute | Cat#MABI0304S, RRID:AB_11123891 | ChIP (1:147) |
| Antibody | anti-H3K27me3 (mouse monoclonal) | MAB Institute | Cat#MABI0323S, RRID:AB_11123929 | ChIP (1:220) |
| Antibody | anti-H3K9me3 (mouse monoclonal) | MAB Institute | Cat#MABI0318S | ChIP (1:176) |
| Antibody | anti-H3K27ac (mouse monoclonal) | MAB Institute | Cat#MABI0309S, RRID:AB_11126964 | ChIP (1:220) |
| Recombinant DNA reagent | pUC-STITCH (plasmid) | This paper | AddGene 129535 | A plasmid carrying STITCH with the homology arms with the MYC+30kb integreation site. Supplementary file 1B |
| Recombinant DNA reagent | pUC57-PB-PGK-tetR-KRAB-2A-Puro (plasmid) | This paper | AddGene 129536 | A piggyBac transposon vector encoding tetR-KRAB-2A-Puror under the PGK promoter. |
| Recombinant DNA reagent | pUC57-PB-PGK-tetR-3xFLAG-HA-2A-Puro (plasmid) | This paper | AddGene 129537 | A piggyBac transposon vector encoding tetR-3xFLAG-HA-2A-Purorunder the PGK promoter. |
| Recombinant DNA reagent | Super PiggyBac Transposase Expression Vector | System Biosciences | Cat#PB210PA-1 | |
| Sequence-based reagent | Alt-R CRISPR tracrRNA | Integrated DNA Technologies | Cat#1072532 | |
| Sequence- based reagent | Alt-R CRISPR crRNA | Integrated DNA Technologies | Supplementary file 1A | |
| Sequence-based reagent | PCR primers | This paper | Supplementary file 1C-G | |
| Peptide, recombinant protein | Alt-R S.p. Cas9 Nuclease 3NLS | Integrated DNA Technologies | Cat#1074181 | |
| Peptide, recombinant protein | Dynabeads Protein G | Thermo Fisher Scientific | Cat# 10003D | |
| Peptide, recombinant protein | micrococcal nuclease | New England Biolabs | Cat#M0247S | |
| Peptide, recombinant protein | NlaIII restriction enzyme | New England Biolabs | Cat#R0125 | 4C-seq Library Prep |
| Peptide, recombinant protein | DpnII restriction enzyme | New England Biolabs | Cat#R0543 | 4C-seq Library Prep |
| Peptide, recombinant protein | T4 DNA ligase | Thermo Fisher Scientific | Cat#EL0014 | 4C-seq Library Prep |
| Peptide, recombinant protein | Tks Gflex DNA Polymerase | Takara | Cat#R060A | 4C-seq Library Prep |
| Commercial assay or kit | NEBNext Poly(A) mRNA Magnetic Isolation | New England Biolabs | Cat#E7490S | |
| Commercial assay or kit | NEXTflex Rapid RNA-Seq Kit | Bioo Scientific | Cat#NOVA-5238–01 | |
| Commercial assay or kit | NEBNext Ultra II DNA Library Prep with Sample Purification Beads | New England Biolabs | Cat#E7103S | |
| Chemical compound, drug | Doxycycline | Sigma Aldrich | Cat#D9891 | |
| Chemical compound, drug | EPZ-6438 | Adipogen Life Sciences | Cat#SYN-3045-M001 | |
| Chemical compound, drug | LDN-193189 | StemRD | ||
| Chemical compound, drug | SB-431542 | Tocris | Cat#1614 | |
| Software, algorithm | WebGestalt | PMID:31114916 | http://www.webgestalt.org | |
| Software, algorithm | DESeq2 | PMID:25516281 | ||
| Software, algorithm | topGO | PMID:16606683 | ||
| Software, algorithm | Bowtie2 | PMID:22388286 | ||
| Software, algorithm | FourCSeq | PMID:26034064 | ||
| Software, algorithm | HISAT2 | PMID:31375807 | ||
| Software, algorithm | HOMER | PMID:20513432 | ||
| Software, algorithm | HTSeq | PMID:25260700 | ||
| Software, algorithm | Integrated Genome Viewer | PMID:21221095 | ||
| Software, algorithm | GimmeMotifs | PMID:21081511 | ||
| Software, algorithm | SAMtools | PMID:19505943 | ||
| Software, algorithm | BEDtools | PMID:20110278 | ||
| Software, algorithm | R | CRAN |
Additional files
-
Supplementary file 1
Tables for DNA sequences of oligo DNAs, of gRNA target sites, of the STITCH construct, and of indexes for NGS libraries.
(A) List of guide RNAs for CRISPR genome editing used in the study. (B) The DNA sequences of the elements composing STITCH. (C) List of primers used to prepare the targeting cassettes. (D) List of primers used for the genotyping. (E) List of primers used in the qPCR assays. (F) List of primers used for the 4C 1st PCR. (G) List of primers used to prepare the NGS libraries. (H) List of the NGS libraries.
- https://cdn.elifesciences.org/articles/47980/elife-47980-supp1-v1.xlsx
-
Transparent reporting form
- https://cdn.elifesciences.org/articles/47980/elife-47980-transrepform-v1.docx
Download links
A two-part list of links to download the article, or parts of the article, in various formats.
Downloads (link to download the article as PDF)
Open citations (links to open the citations from this article in various online reference manager services)
Cite this article (links to download the citations from this article in formats compatible with various reference manager tools)
Controlling gene activation by enhancers through a drug-inducible topological insulator
eLife 9:e47980.
https://doi.org/10.7554/eLife.47980


