Accelerated phosphatidylcholine turnover in macrophages promotes adipose tissue inflammation in obesity
- University of Cambridge Metabolic Research Laboratories, Institute of Metabolic Science, MDU MRC, United Kingdom
- Fundación Progreso y Salud, CDCA, Hospital Virgen del Rocio, Spain
- INB-ELIXIR-es, FPS, Hospital Virgen del Rocio, Spain
- Centro de Investigación Biomédica en Red de Enfermedades Raras (CIBERER), FPS, Hospital Virgen del Rocio, Spain
- Karolinska Institutet, Sweden
- Amsterdam University Medical Center, Netherlands
- Wellcome Trust Sanger Institute, United Kingdom
Figures
Figure 1 with 5 supplements
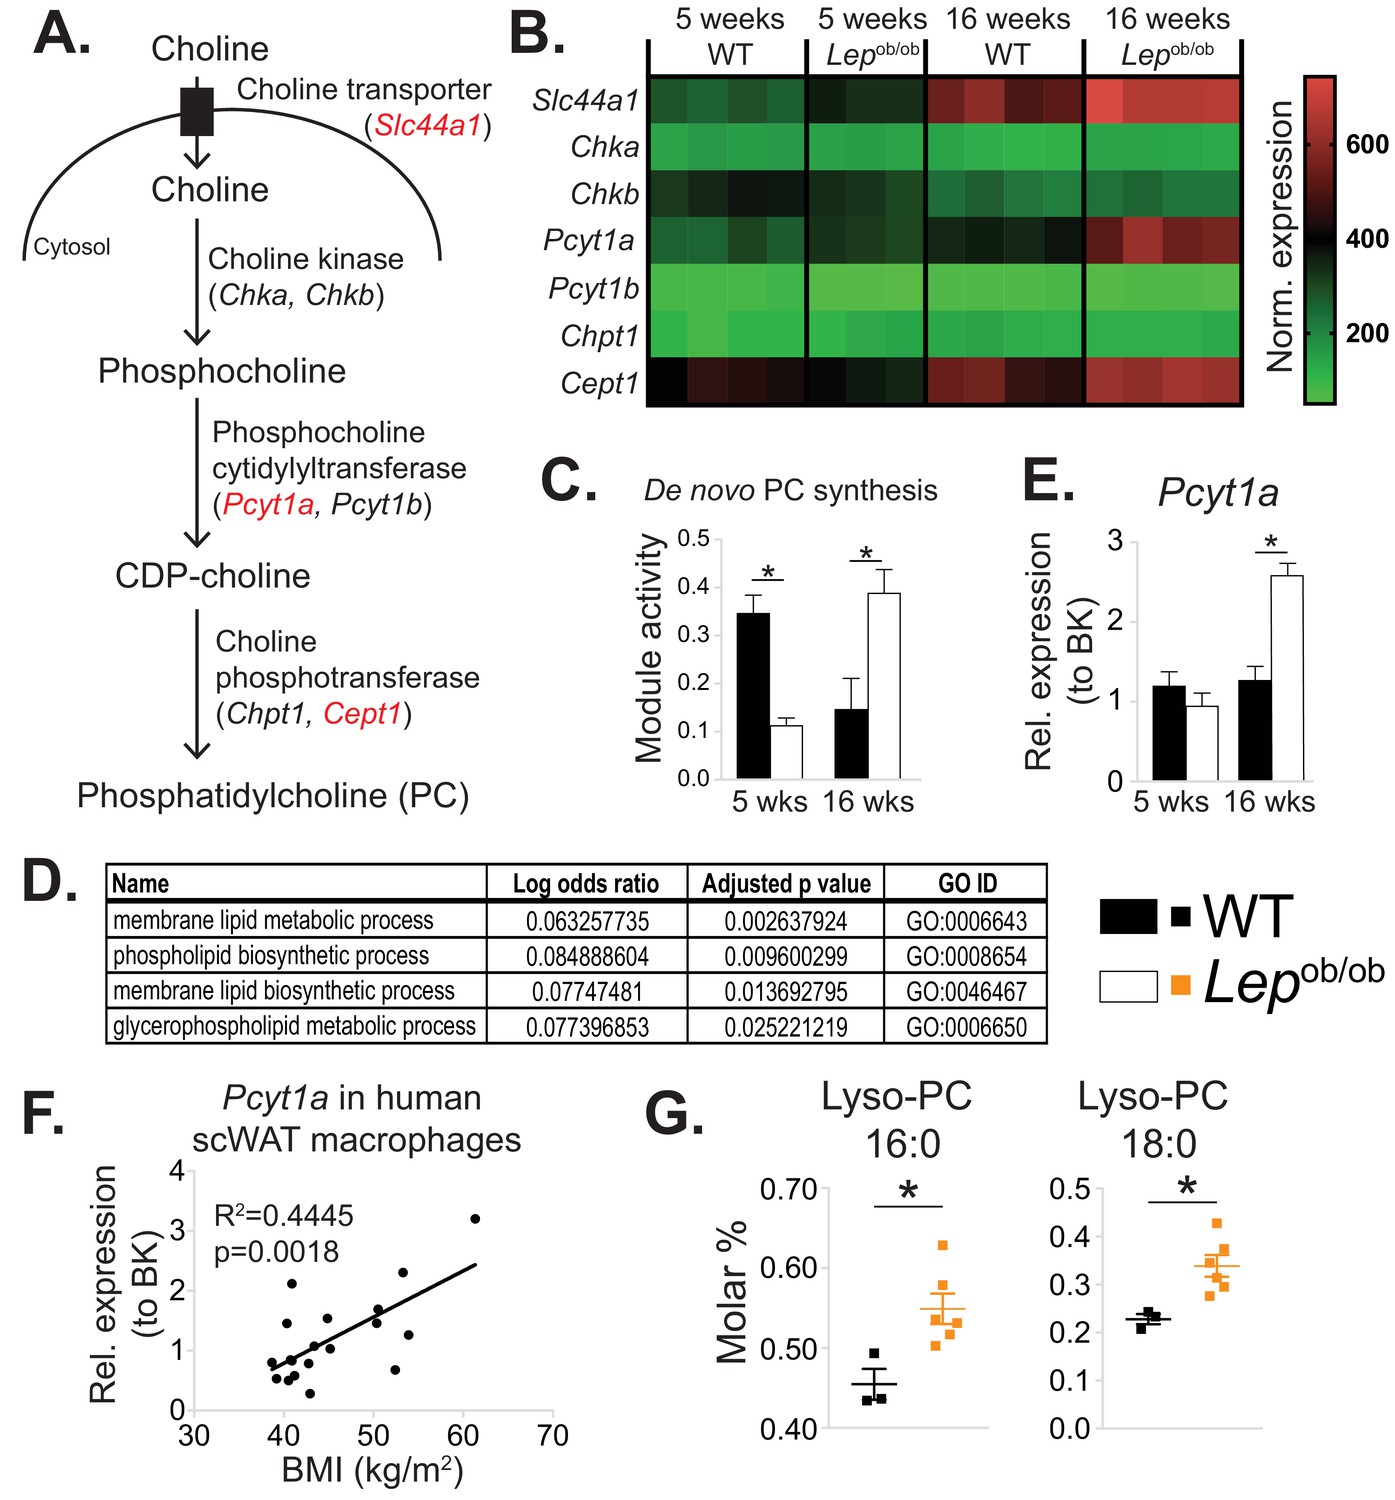
De novo PC synthesis rate is increased in ATMs during obesity.
(A) Simplified schema of the Kennedy pathway of de novo PC biosynthesis. Transcripts in red are upregulated in 16-week-old Lepob/ob eWAT macrophages compared to WT controls. (B) Normalised microarray gene expression values for the enzymes of the Kennedy pathway of de novo PC biosynthesis in eWAT macrophages. (C) De novo PC biosynthesis pathway module (M00090) activity in eWAT macrophages, as inferred by the Metabolizer algorithm. (D) Gene Ontology (GO) pathways related to membrane lipid metabolism that are increased in Lepob/ob eWAT macrophages at 16 weeks, but not at 5 weeks of age compared to WT controls. (E) Pcyt1a expression in eWAT macrophages, measured by qPCR. (F)Pcyt1a expression, measured by qPCR in subcutaneous WAT macrophages isolated from obese patients undergoing bariatric surgery, plotted against their body weight (n = 19). (G) Molar abundance of 16:0 and 18:0 lyso-PC species (expressed as percentage of total measured PLs) in eWAT macrophages (n = 3 pools of 5 WT, n = 6 Lepob/ob mice). ∗p<0.05 between genotypes, error bars indicate SEM.
Figure 1—figure supplement 1
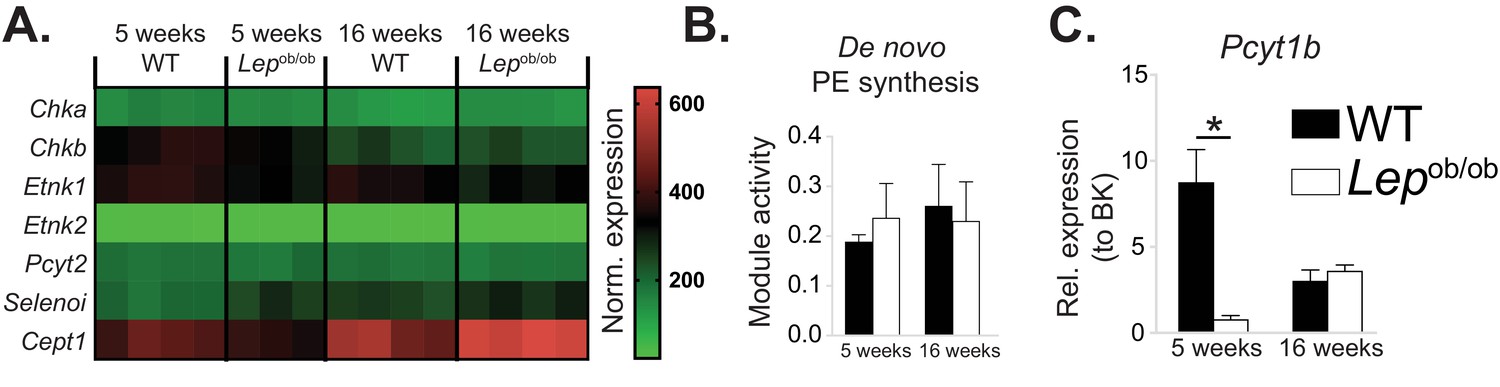
Obesity does not affect de novo PE synthesis rate in ATMs.
(A) Normalised microarray gene expression for the enzymes of the Kennedy pathway of de novo PE biosynthesis in eWAT macrophages. (B) De novo PE biosynthesis pathway module (M00092) activity in eWAT macrophages, as inferred by the Metabolizer algorithm. (C) Pcyt1b expression in eWAT macrophages, measured by qPCR.
Figure 1—figure supplement 2
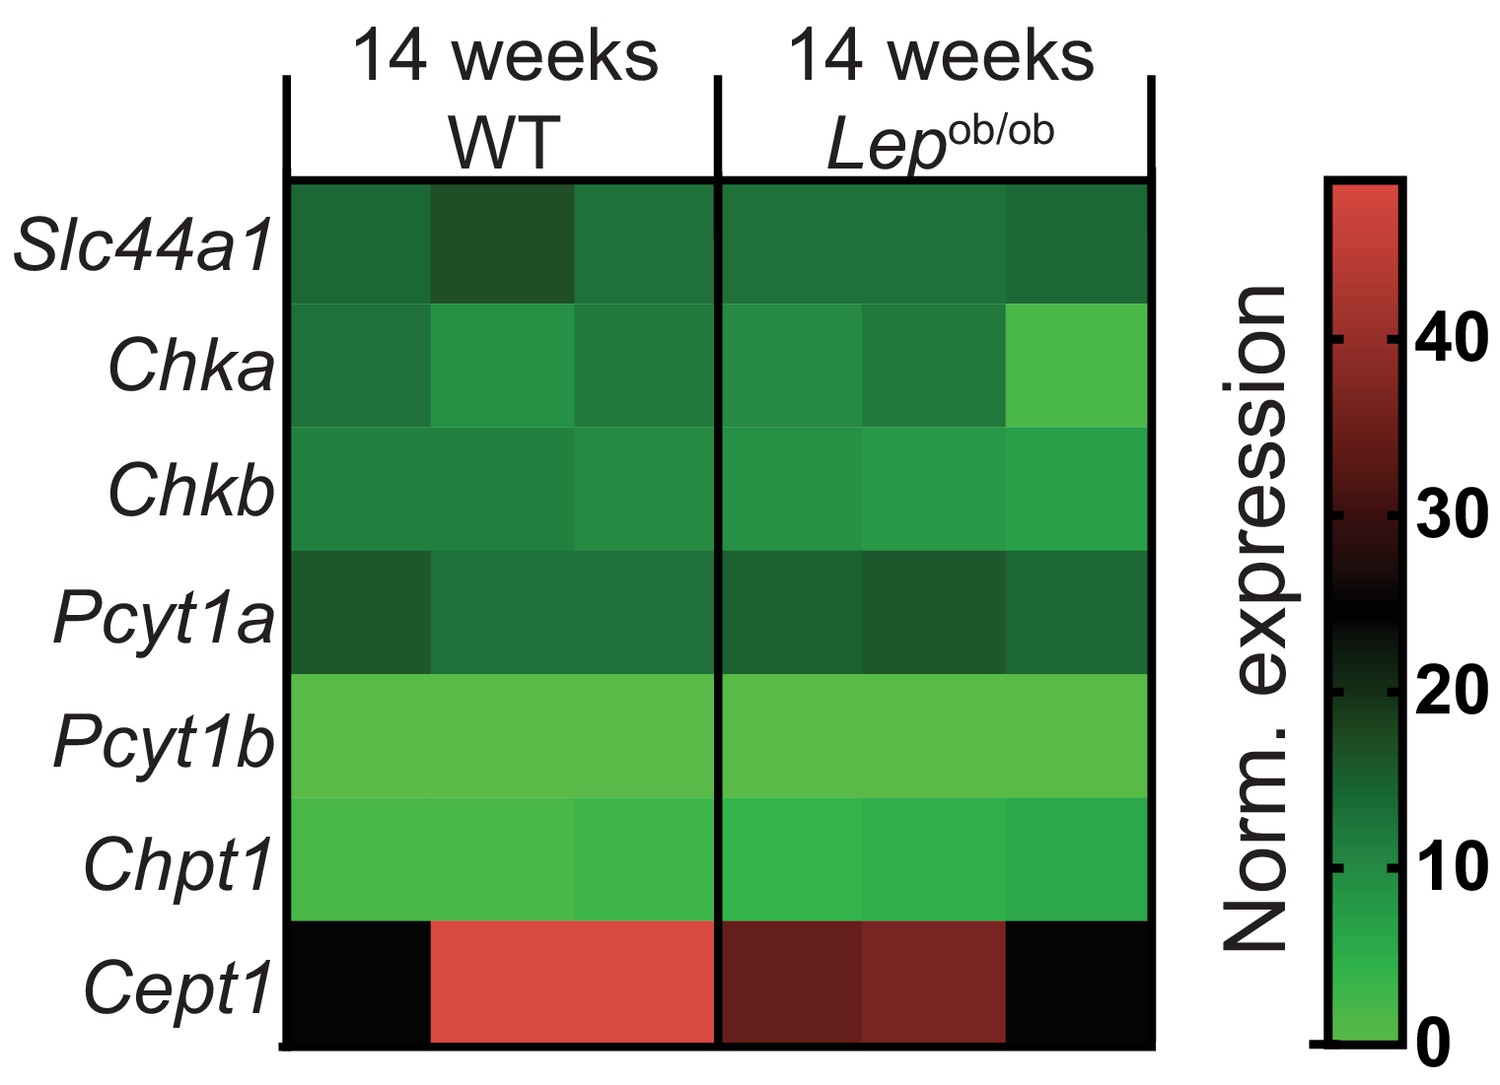
Obesity does not affect de novo PC synthesis rate in liver macrophages.
Normalised RNAseq gene expression for the enzymes of the Kennedy pathway of de novo PC biosynthesis in liver macrophages, isolated from 14-week-old WT and Lepob/ob mice (n = 3).
Figure 1—figure supplement 3
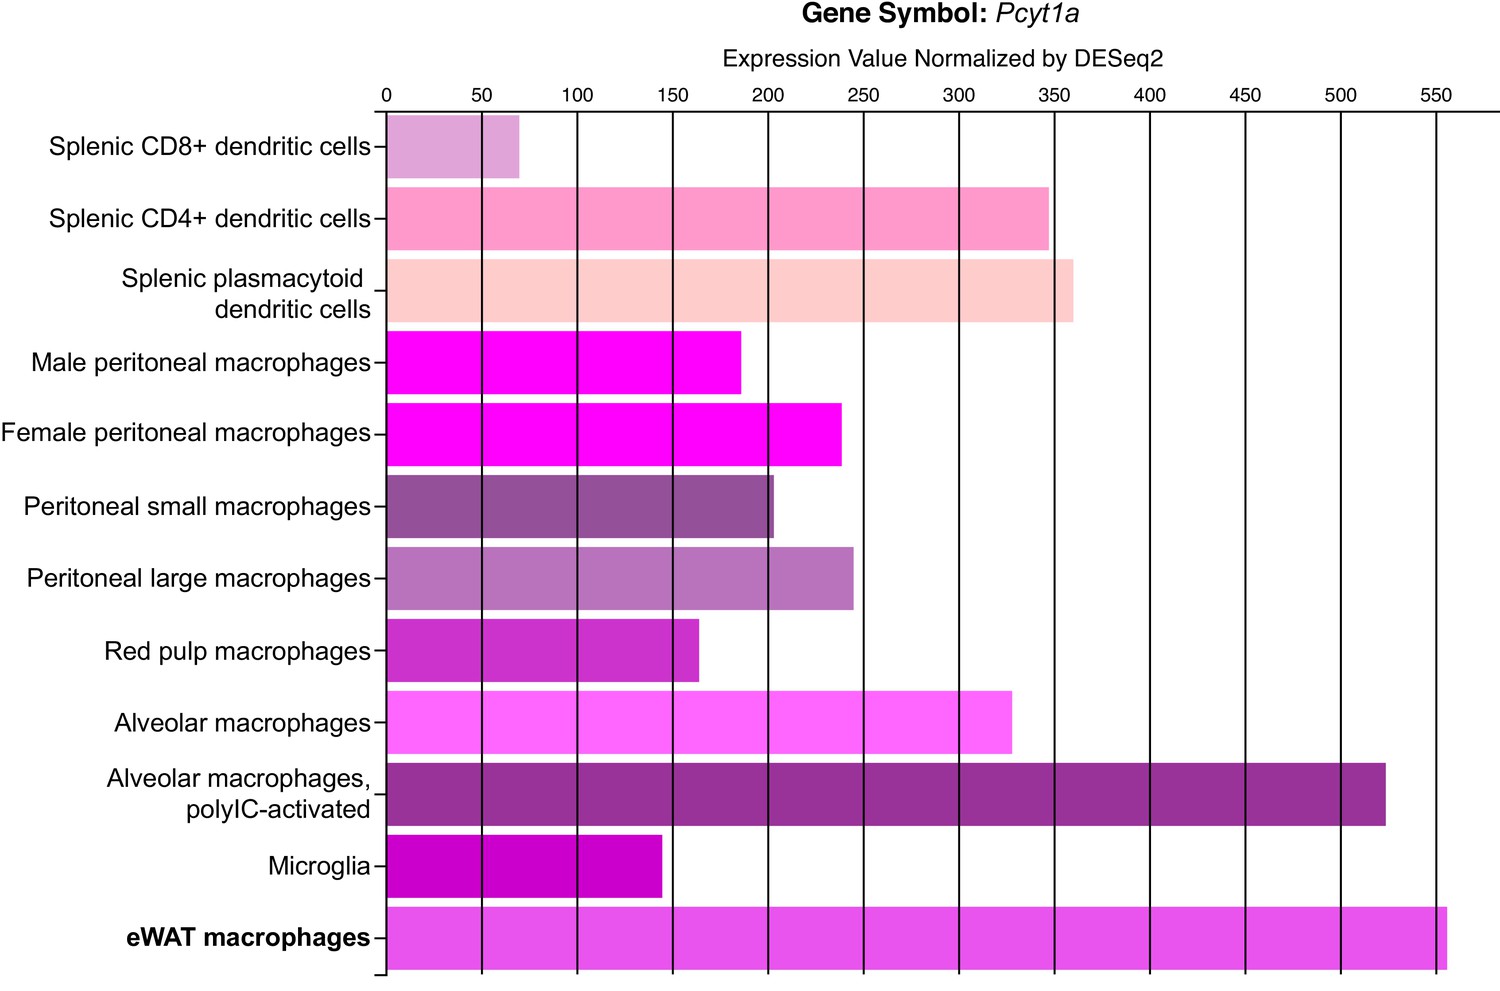
Pcyt1a expression levels in different tissue macrophage populations.
Figure indicating Pcyt1a mRNA levels in isolated tissue macrophage populations, measured by RNAseq was obtained directly from Immgen database (www.immgen.org).
Figure 1—figure supplement 4
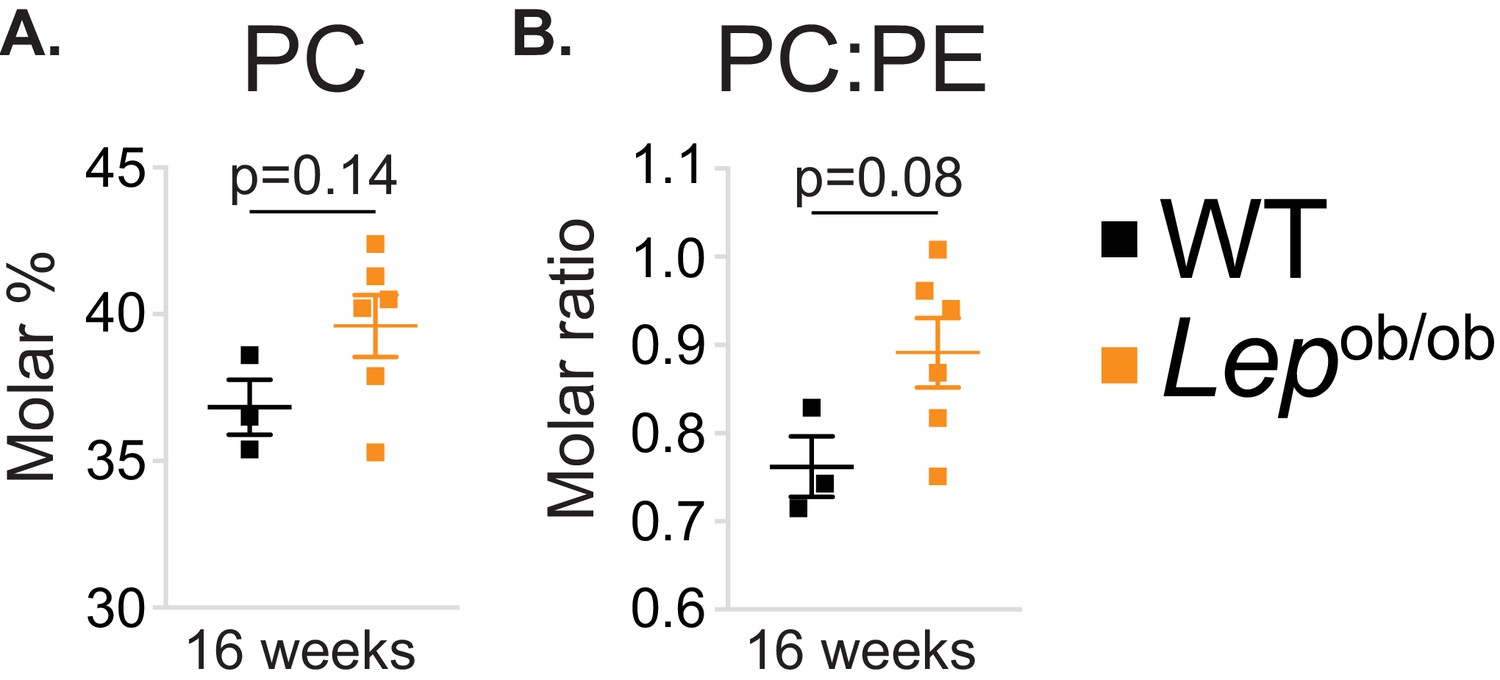
Obesity tends to increase PC molar percentage and PC to PE molar ratio in ATMs.
(A) PC molar abundance (expressed as percentage of total measured PLs), and (B) PC:PE molar ratio in eWAT macrophages (n = 3 pools of 5 WT, n = 6 16 week-old Lepob/ob mice).
Figure 1—figure supplement 5
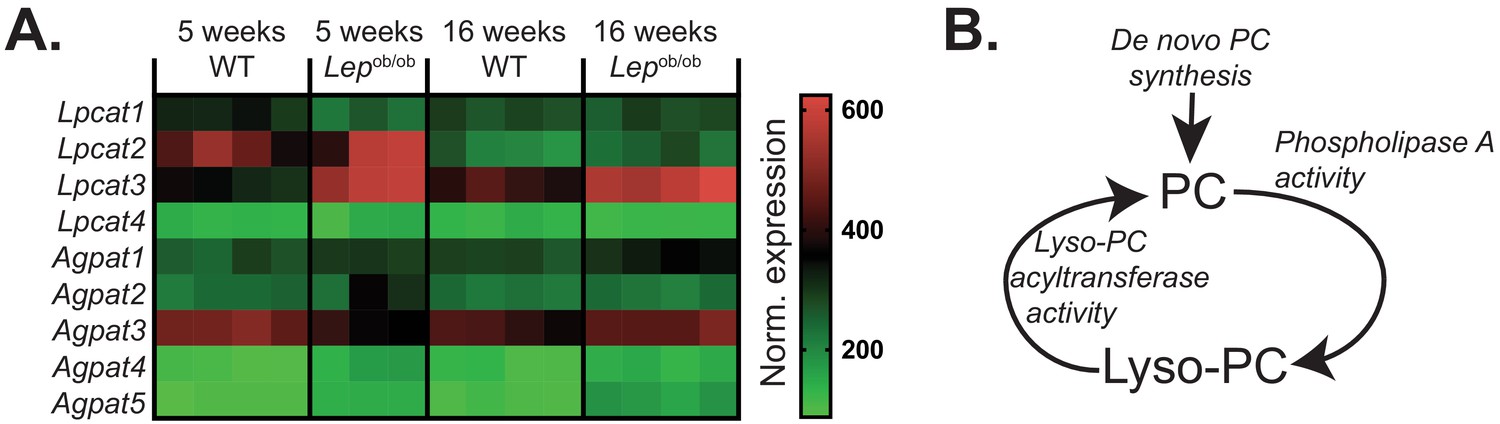
The effects of obesity on PC remodelling gene expression in ATMs.
(A) Normalised microarray gene expression for the enzymes involved in PC remodelling in eWAT macrophages. (B) Simplified schema of the interaction between de novo PC synthesis and PC remodelling pathways.
Figure 2 with 4 supplements
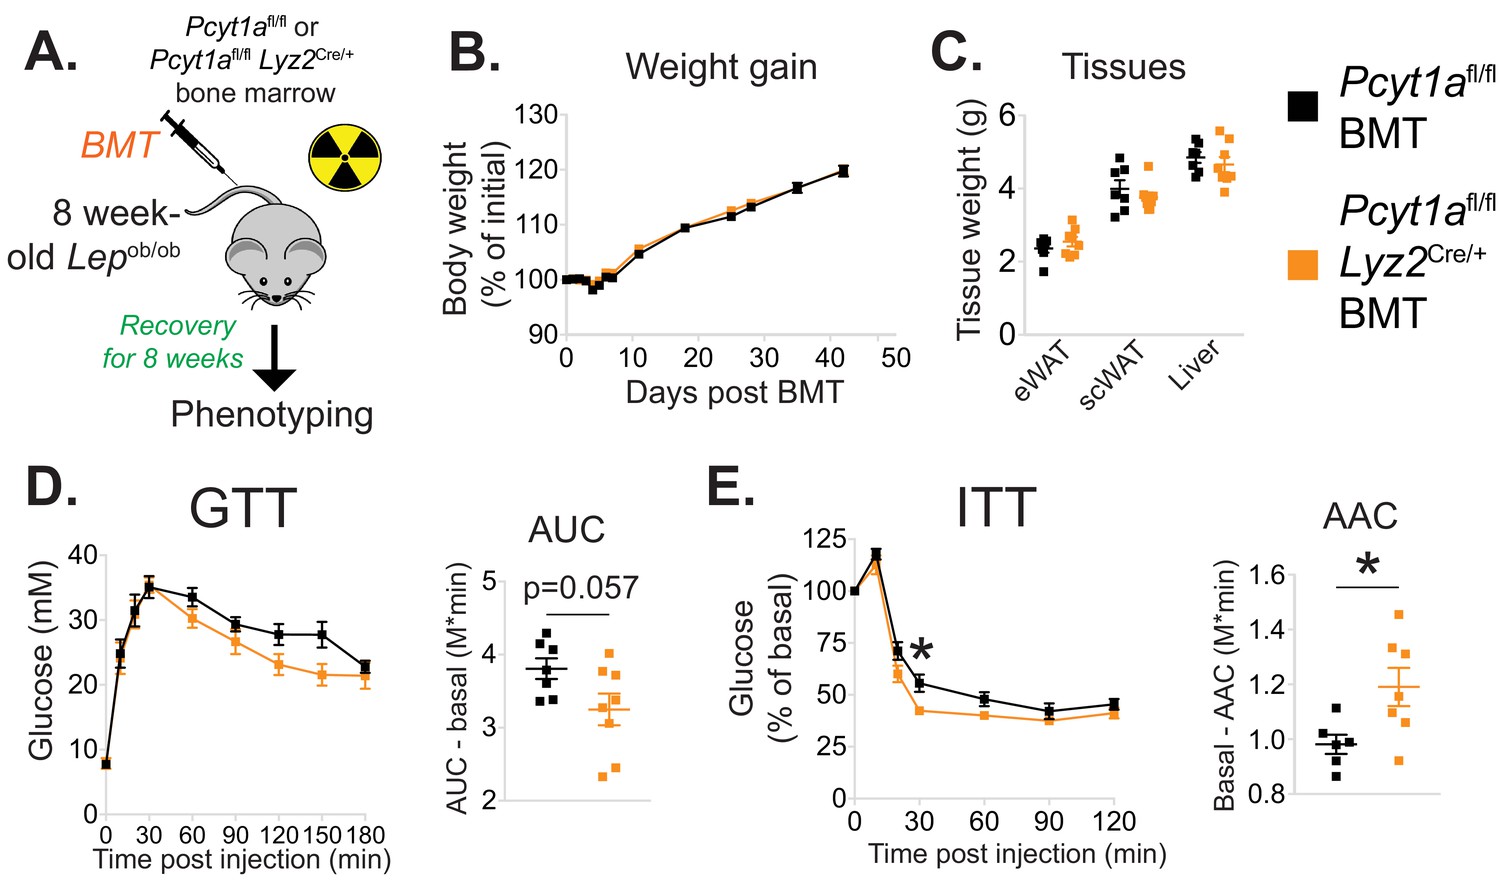
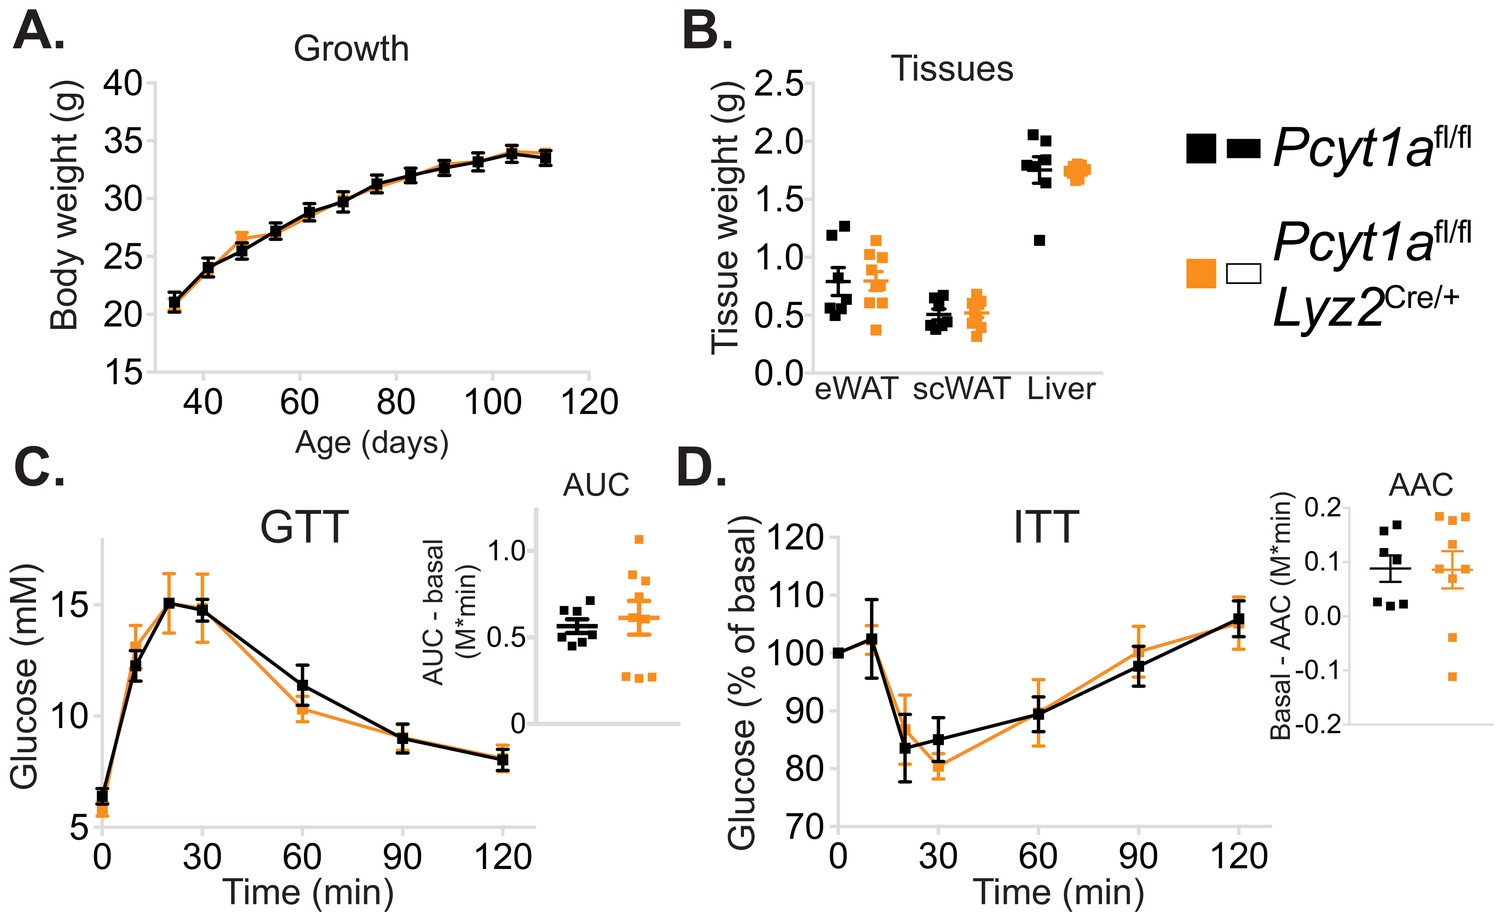
Myeloid cell-specific deletion of Pcyt1a leads to improved systemic glucose metabolism on the Lepob/ob genetic background.
(A) Schema of the BMT study design. (B) Body weight gain curves and (C) weights of indicated tissues of Lepob/ob mice transplanted with Pcyt1afl/fl (n = 7) or Pcyt1afl/fl Lyz2Cre/+ (n = 8) bone marrow. (D)GTT curves and areas under curve (AUC), normalised to basal glucose levels. (E) ITT curves, presented as percentage values of basal glucose levels, and areas above curve (AAC), normalised to basal glucose levels.
Figure 2—figure supplement 1
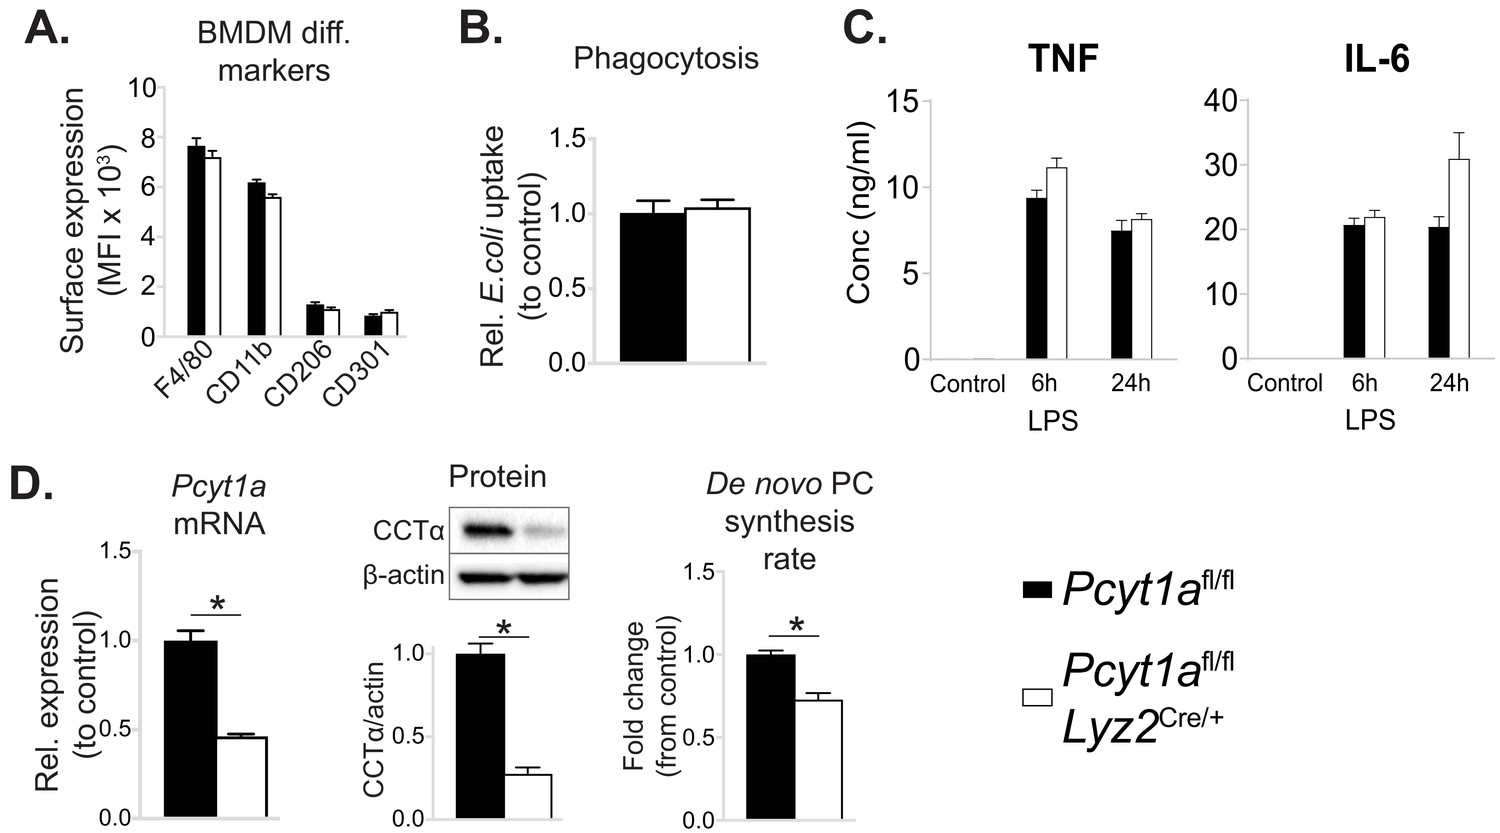
Myeloid cell-specific deletion of Pcyt1a does not impair BMDM differentiation or function in vitro.
(A) Flow cytometry quantification of macrophage differentiation markers. (B) Phagocytosis of E. coli (normalised to control values). (C) Cytokine secretion into the medium of BMDMs stimulated with LPS for 6 or 24 hr. (D) Pcyt1a expression, CCTα protein levels and 3H-choline incorporation rate into membrane lipids. Pcyt1afl/fl (n = 4) or Pcyt1afl/fl Lyz2Cre/+ (n = 4) BMDMs.
Figure 2—figure supplement 2
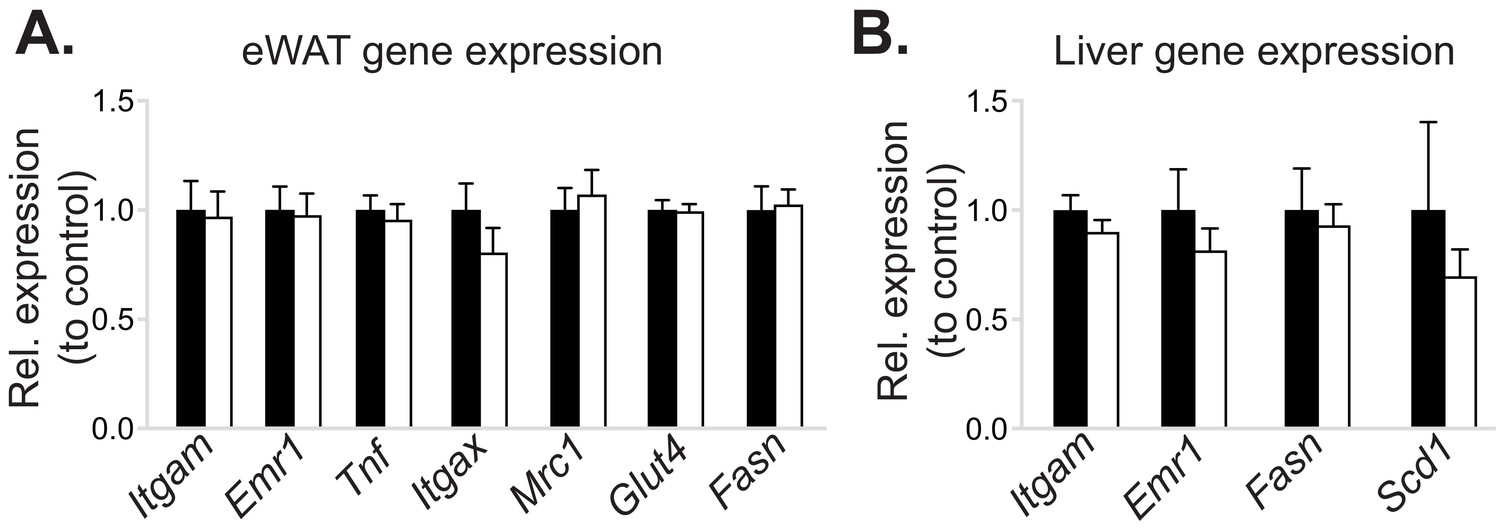
Myeloid cell-specific deletion of Pcyt1a does not affect eWAT or liver gene expression in lean mice.
Normalised expression of indicated genes in (A) eWAT and (B) liver of Pcyt1afl/fl (n = 7) or Pcyt1afl/fl Lyz2Cre/+ (n = 9) animals on a C57Bl/6J genetic background, measured by qPCR.
Figure 2—figure supplement 3
Myeloid cell-specific deletion of Pcyt1a does not affect growth or glucose metabolism of lean mice.
(A) Body weight gain curves and (B) tissue weights of lean mice. (C) GTT curves and areas under curve (AUC), normalised to basal glucose levels. (D) ITT curves, presented as percentage values of basal glucose levels, and areas above curve (AAC), normalised to basal glucose levels.
Figure 2—figure supplement 4

WT to Lepob/ob bone marrow transplant does not affect the increase of Pcyt1a transcription in eWAT ATMs.
Pcyt1a expression measured by qPCR in eWAT macrophages isolated from WT and Lepob/ob mice carrying WT bone marrow at 18 weeks of age (n = 7 mice/group).
Figure 3 with 3 supplements

Myeloid cell-specific deletion of Pcyt1a leads to reduced WAT inflammation on the Lepob/ob genetic background.
(A) Selected pathways from eWAT RNAseq analysis, upregulated (red) or downregulated (blue) in Lepob/ob mice transplanted with Pcyt1afl/fl Lyz2Cre/+ (n = 8) bone marrow compared to controls (n = 7). (B) Representative AKT phosphorylation Western blots and (C) their densitometry quantification in eWAT of Lepob/ob mice transplanted with Pcyt1afl/fl (n = 7) or Pcyt1afl/fl Lyz2Cre/+ (n = 8) bone marrow. (D) Flow cytometry gating strategy, quantification of ATM number per gram of eWAT and the relative polarisation of ATM population in Lepob/ob mice.
Figure 3—figure supplement 1
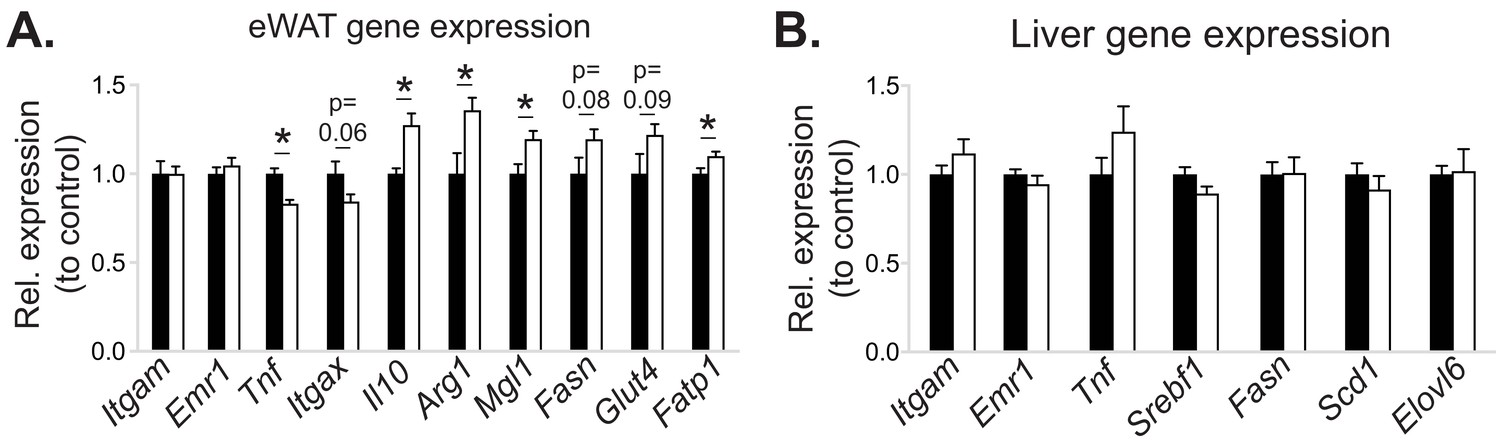
The effects of myeloid cell-specific deletion of Pcyt1a on eWAT and liver gene expression on the Lepob/ob genetic background.
Relative expression of indicated genes in the (A) eWAT and (B) liver of Lepob/ob BMT mice, measured by qPCR.
Figure 3—figure supplement 2
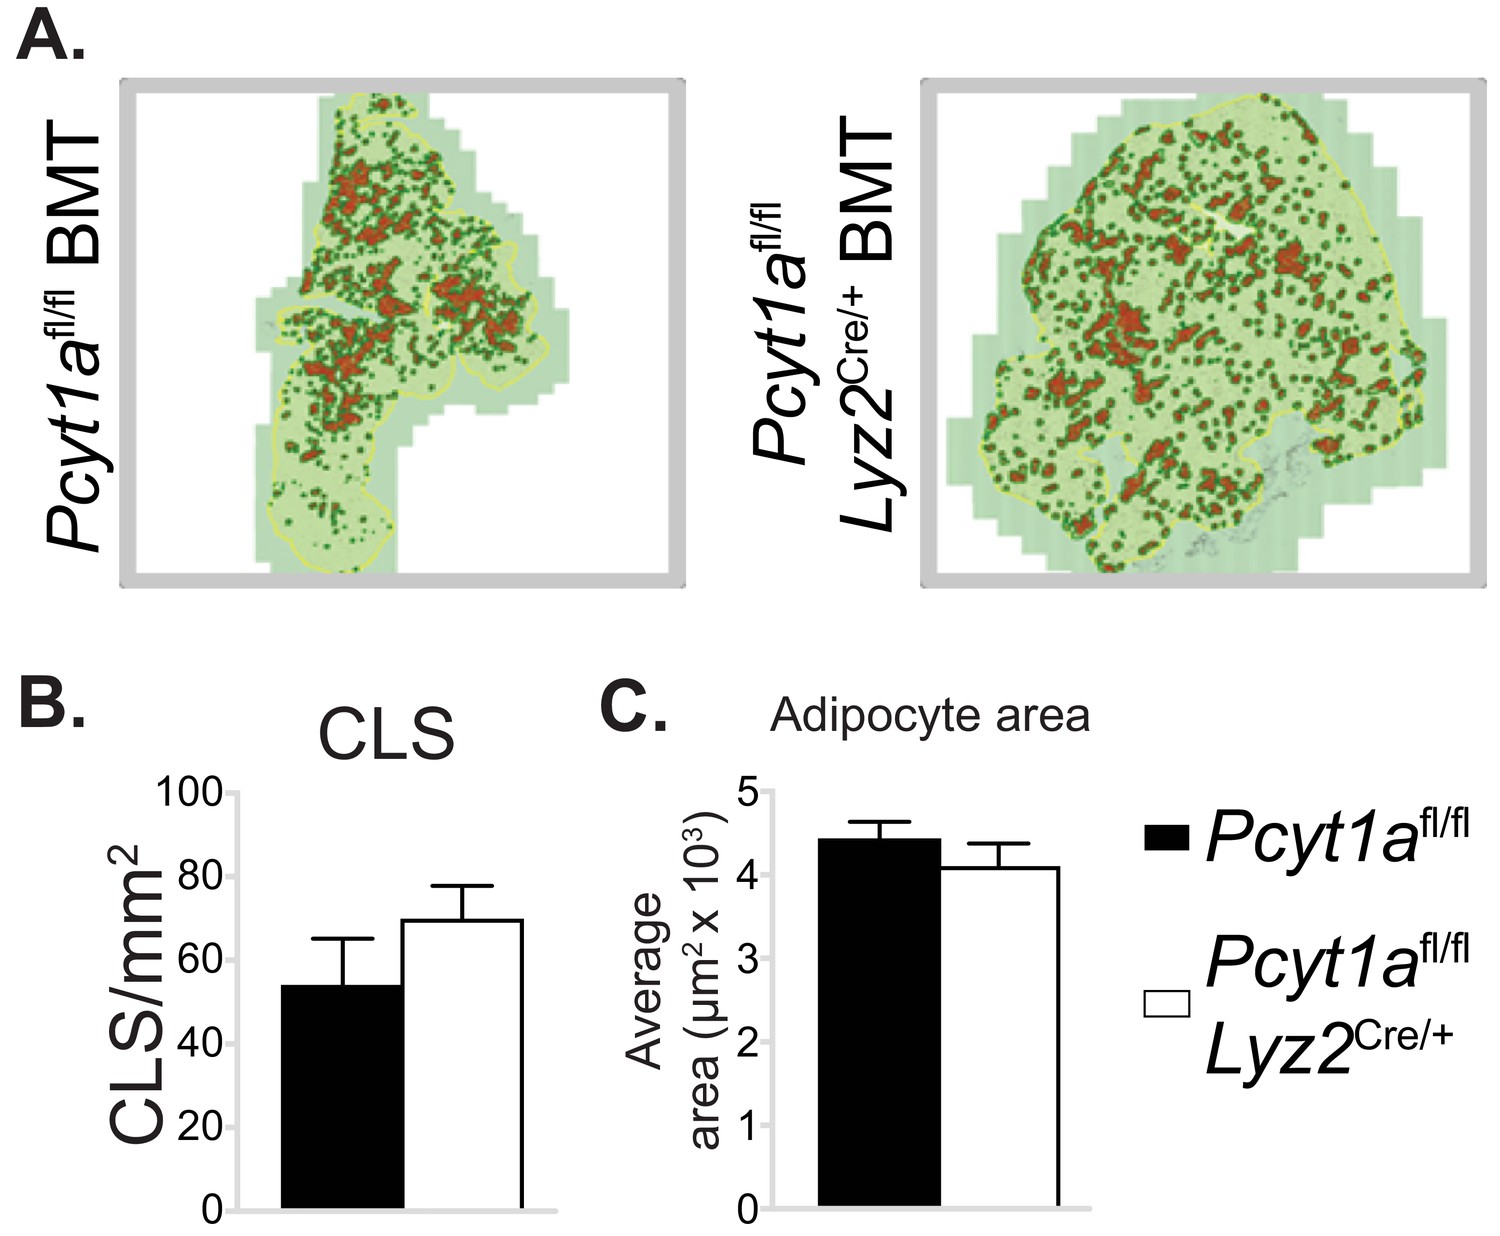
Myeloid cell-specific deletion of Pcyt1a does not affect eWAT CLS number or adipocyte size on the Lepob/ob genetic background.
(A) Representative histology images of eWAT sections of Lepob/ob BMT mice, CLS are marked in red. Quantification of (B) CLS and (C) average adipocyte area in the eWAT sections of Lepob/ob BMT mice.
Figure 3—figure supplement 3
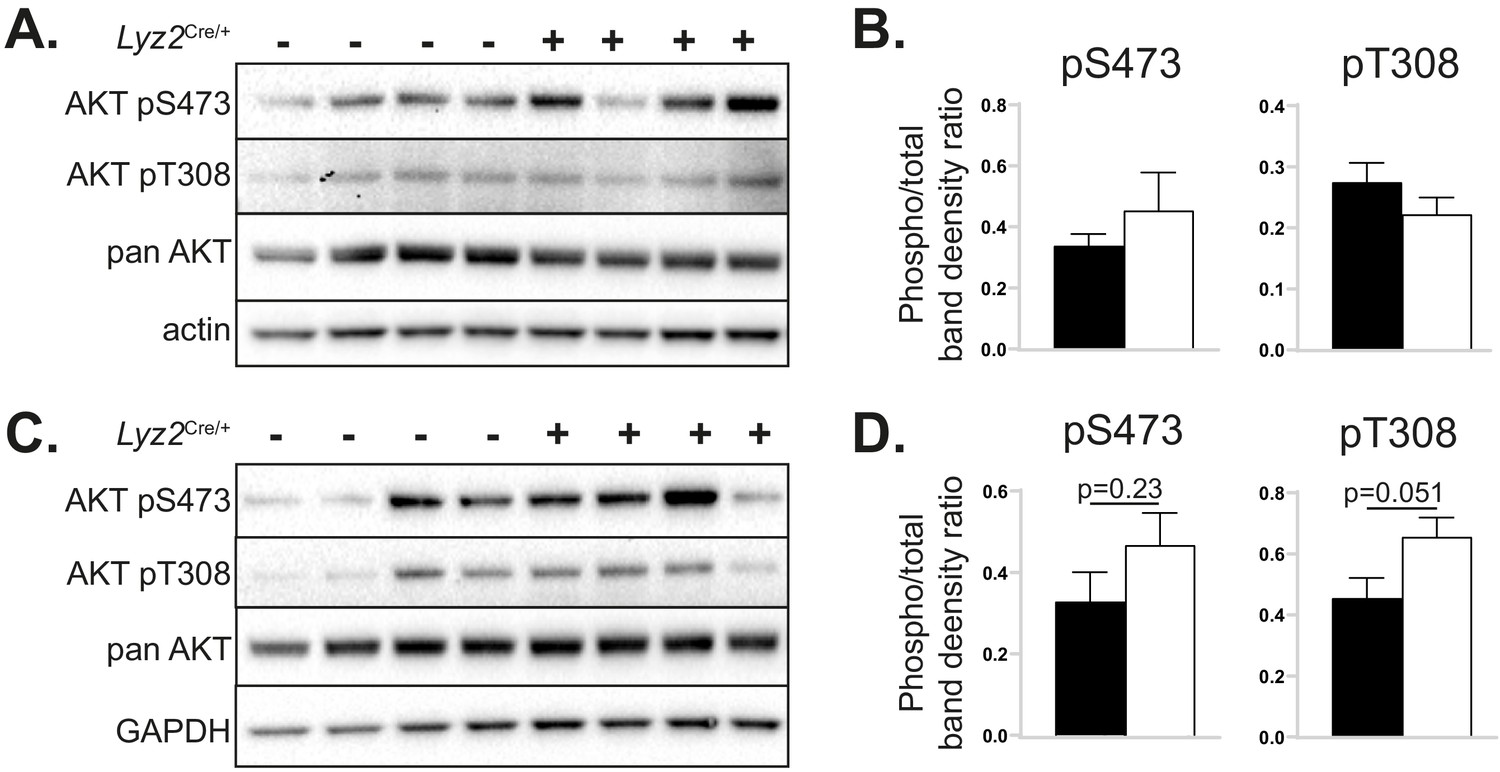
The effects of myeloid cell-specific deletion of Pcyt1a on liver and skeletal muscle AKT signalling on the Lepob/ob genetic background.
Representative AKT phosphorylation Western blots and their densitometry quantification in (A, B) liver and (C, D) gastrocnemius muscle of Lepob/ob mice transplanted with Pcyt1afl/fl (n = 7) or Pcyt1afl/fl Lyz2Cre/+ (n = 8) bone marrow.
Figure 4 with 2 supplements

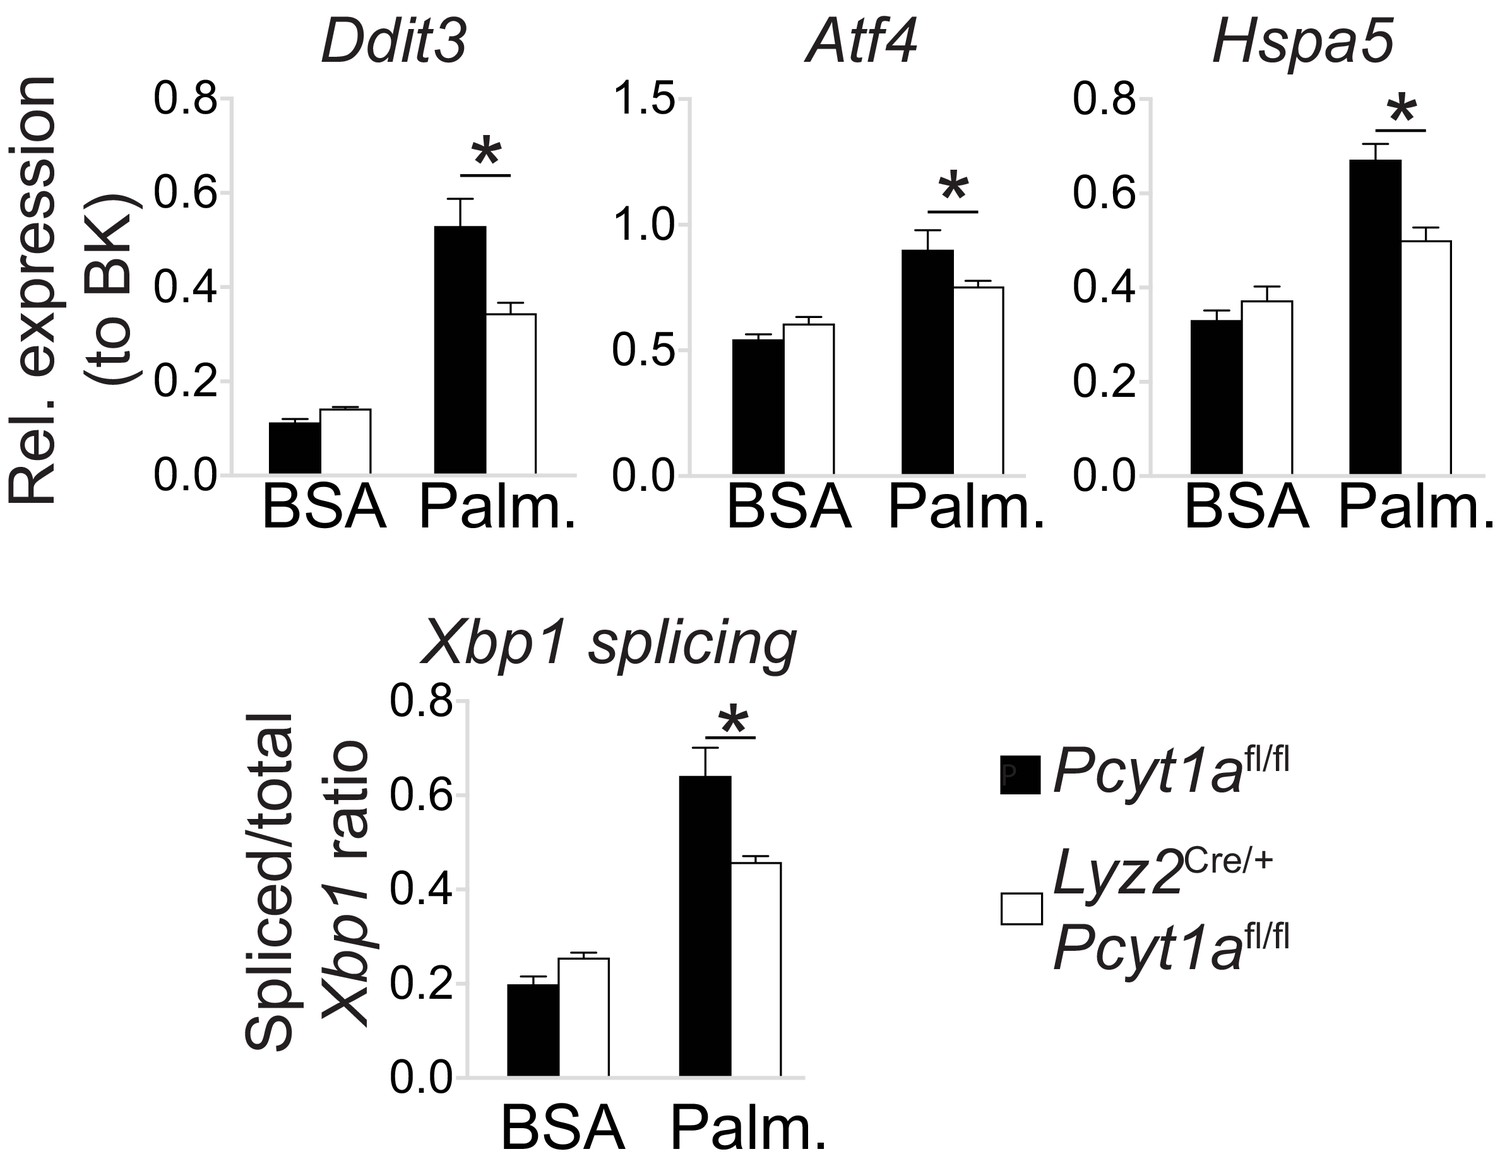
Pcyt1a deficiency protects macrophages from palmitate-induced ER stress and inflammation.
(A) Tnf expression levels in Pcyt1afl/fl (n=5) or Pcyt1afl/fl Lyz2Cre/+ (n=3) BMDMs treated with indicated doses of palmitate for 16 hours. (B) Fold induction (compared to BSA alone) of indicated ER stress marker gene expression Pcyt1afl/fl (n=7) or Pcyt1afl/fl Lyz2Cre/+ (n=8) BMDMs treated with 250 μM palmitate for 16 hours. (C) Representative Western blots and (D) their densitometry quantification of Pcyt1afl/fl (n=5) or Pcyt1afl/fl Lyz2Cre/+ (n=3) BMDMs treated with indicated doses of palmitate for 16 hours. ∗p < 0.05 between genotypes, error bars indicate SEM. All presented experiments are representative of at least 3 BMDM cultures.
Figure 4—figure supplement 1
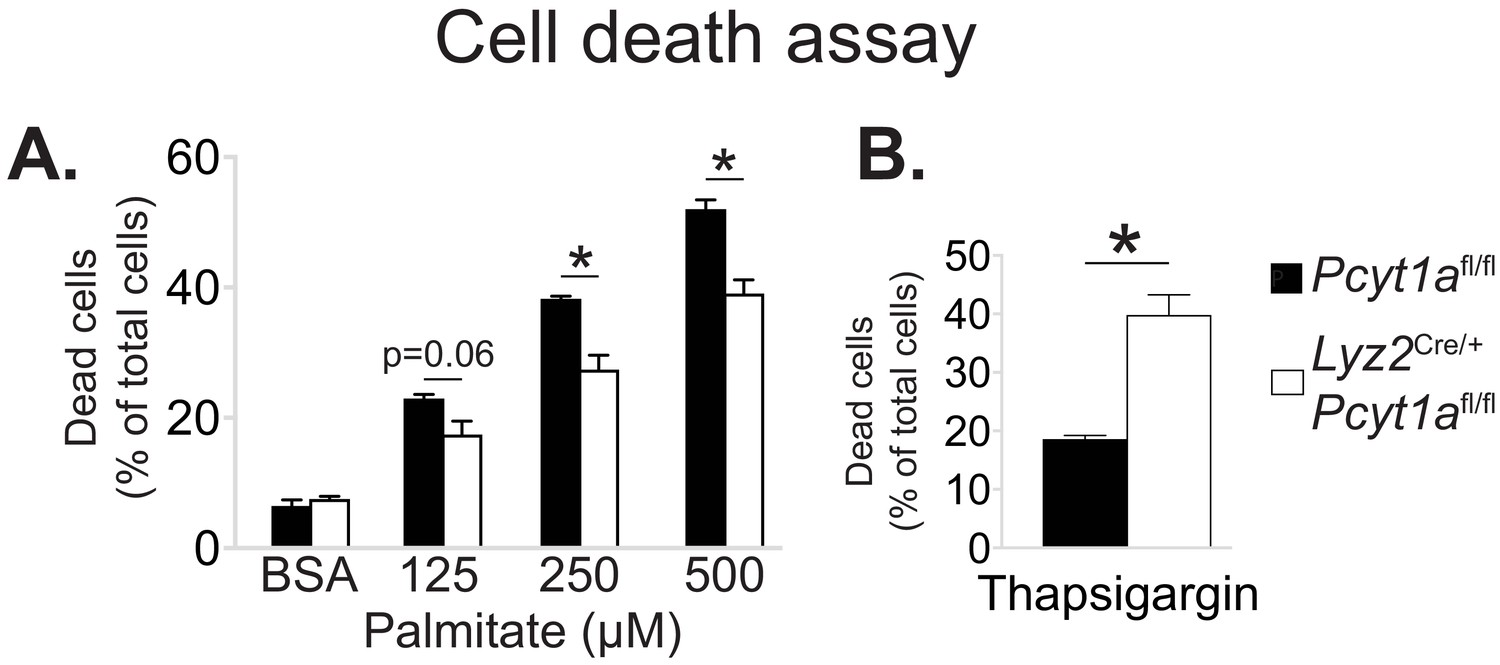
Pcyt1a deficiency protects macrophages from palmitate, but not thapsigargin-induced cell death.
Flow cytometry quantification of dead Pcyt1afl/fl (n = 4) or Pcyt1afl/fl Lyz2Cre/+ (n = 4) BMDMs treated with indicated doses of (A) palmitate or (B) 150 nM thapsigargin for 16 hr.
Figure 4—figure supplement 2
Pcyt1a deficiency protects peritoneal macrophages from palmitate-induced ER stress.
ER stress marker gene expression in cultured peritoneal macrophages from Pcyt1afl/fl (n = 4) or Pcyt1afl/fl Lyz2Cre/+ (n = 8) treated with 250 μM palmitate for 16 hr.
Figure 5
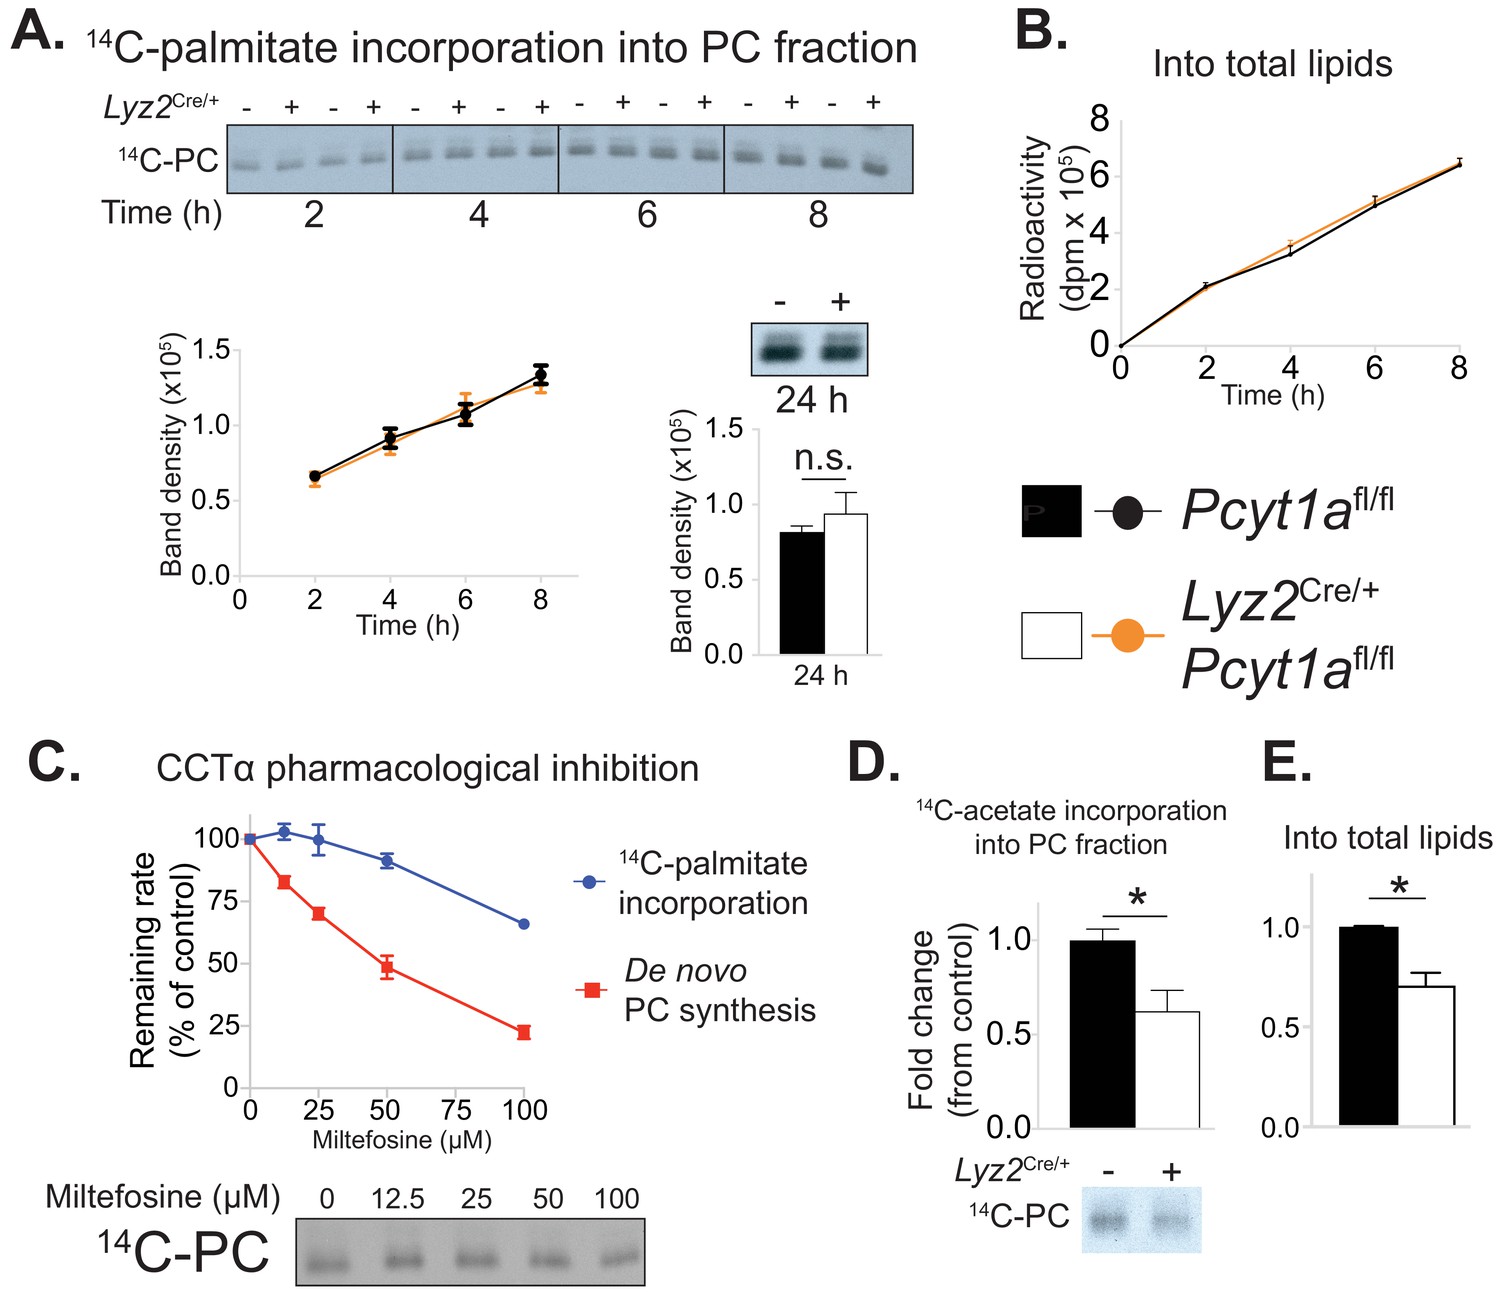
Pcyt1a deficiency in macrophages does not affect the rate of exogenous palmitate incorporation into PCs.
(A) Representative autoradiogram and densitometry quantification of 14C-palmitate incorporation into PCs or (B) total lipids of Pcyt1afl/fl (n = 4) or Pcyt1afl/fl Lyz2Cre/+ (n = 4) BMDMs treated with 250 μM palmitate for indicated periods of time. (C) Inhibition of de novo PC biosynthesis (red line) and 14C-palmitate incorporation into PC fraction (blue line) of WT BMDMs (n = 4), pretreated with indicated doses of miltefosine for 1 hr and stimulated with 250 μM palmitate for 3 hr. Representative autoradiogram is presented below. (D) Representative autoradiogram and densitometry quantification of 14C-acetate incorporation into PCs or (E) total lipids of untreated Pcyt1afl/fl (n = 4) or Pcyt1afl/fl Lyz2Cre/+ (n = 4) BMDMs over 3 hr, normalised to Pcyt1afl/fl group average. ∗p<0.05 between genotypes, error bars indicate SEM. All presented experiments are representative of at least 3 BMDM cultures.
Figure 6 with 4 supplements

Pcyt1a deficiency increases PUFA-containing PC levels in macrophages.
(A) Volcano plot of indicated PC species, expressed as molar percentage of all measured PCs, in Pcyt1afl/fl (n = 7) or Pcyt1afl/fl Lyz2Cre/+ (n = 8) BMDMs. (B) Pie charts indicating the relative abundance of PC species with different degrees of unsaturation in Pcyt1afl/fl (n = 7) or Pcyt1afl/fl Lyz2Cre/+ (n = 8) BMDMs in a basal state or after 16 hr treatment with 250 μM palmitate. (C) Volcano plot of indicated fatty acid species, expressed as molar percentage of all measured fatty acids, in Pcyt1afl/fl (n = 7) or Pcyt1afl/fl Lyz2Cre/+ (n = 8) BMDMs. (D) Fold induction (compared to BSA alone) of indicated ER stress marker gene and Tnf expression in Pcyt1afl/fl (n = 4) or Pcyt1afl/fl Lyz2Cre/+ (n = 4) BMDMs after 16 hr treatment with 250 μM palmitate, supplemented with or without 25 μM arachidonate.
-
Figure 6—source data 1
A list of all measured lipid species by LC-MS in Pcyt1afl/fl (n = 7) or Pcyt1afl/fl Lyz2Cre/+ (n = 8) BMDMs in a basal state or after 16 hr treatment with 250 μM palmitate.
Peak areas for each lipid were normalised to the peak areas of a respective internal standard and expressed as peak area ratios.
- https://doi.org/10.7554/eLife.47990.027
Figure 6—figure supplement 1
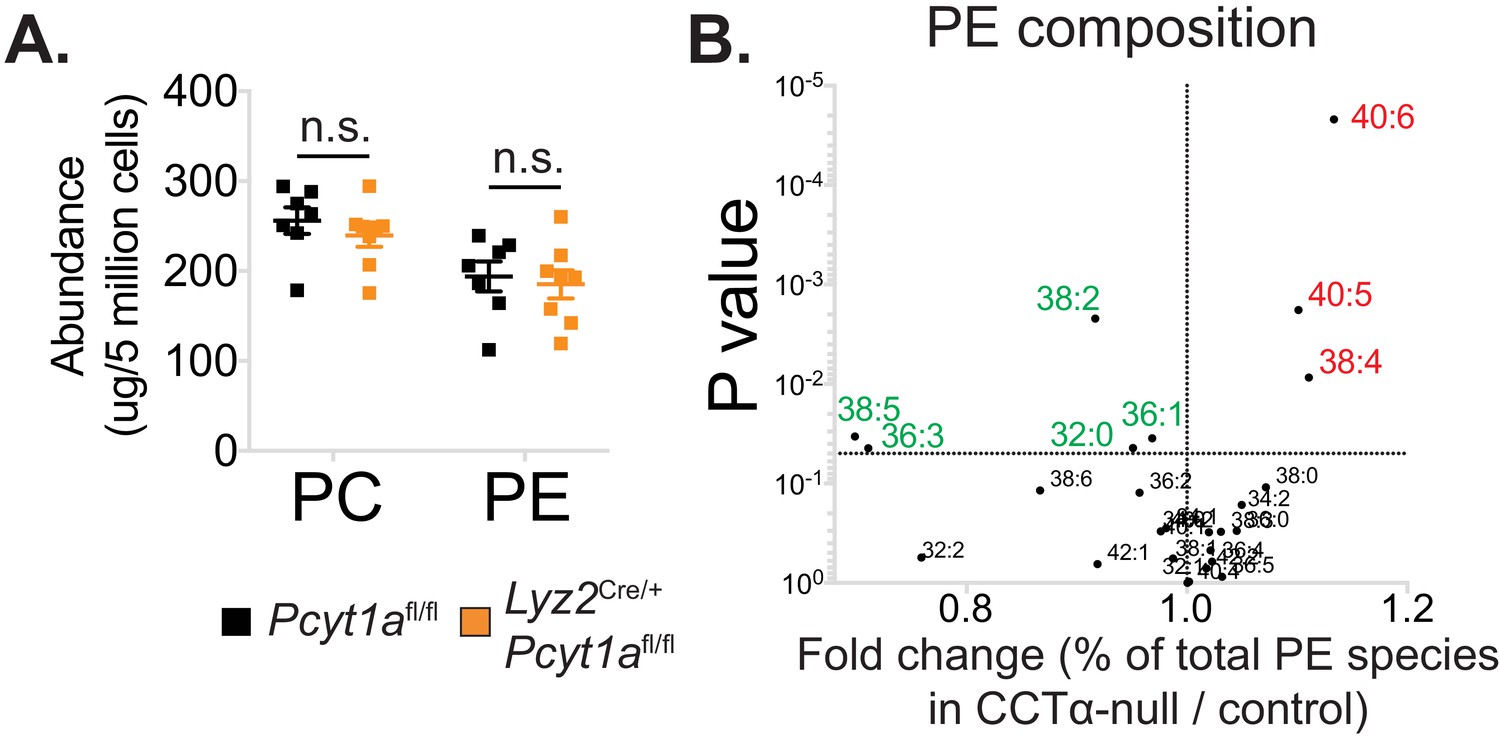
The effects of Pcyt1a deficiency on total PC and PE levels and PE composition in macrophages.
(A) Abundance of all detected PC and PE species in Pcyt1afl/fl (n = 7) or Pcyt1afl/fl Lyz2Cre/+ (n = 8) BMDMs in a basal state. (B) Volcano plot of indicated PE species, expressed as molar percentage of all measured PEs, in Pcyt1afl/fl (n = 7) or Pcyt1afl/fl Lyz2Cre/+ (n = 8) BMDMs in a steady state.
Figure 6—figure supplement 2
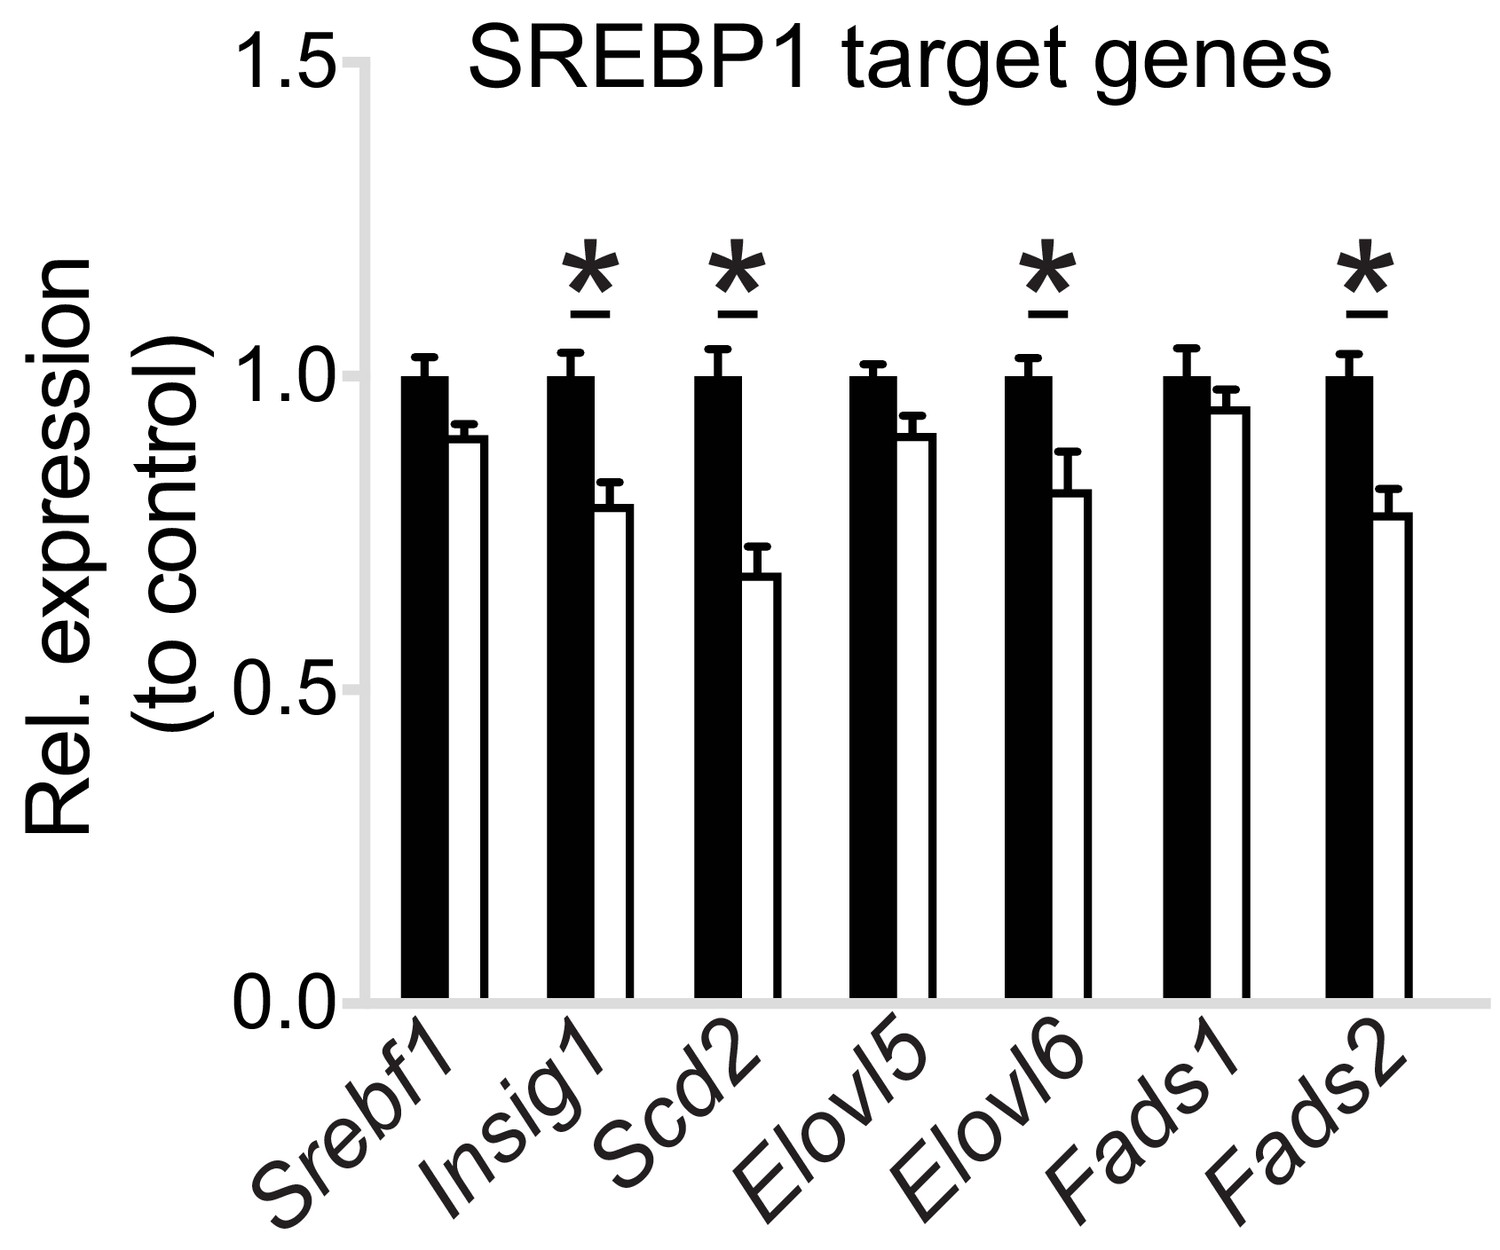
Pcyt1a deficiency reduces SREBP1 target gene expression in macrophages.
Normalised expression of SREBP1 target genes in Pcyt1afl/fl (n = 7) or Pcyt1afl/fl Lyz2Cre/+ (n = 8) BMDMs in a basal state.
Figure 6—figure supplement 3
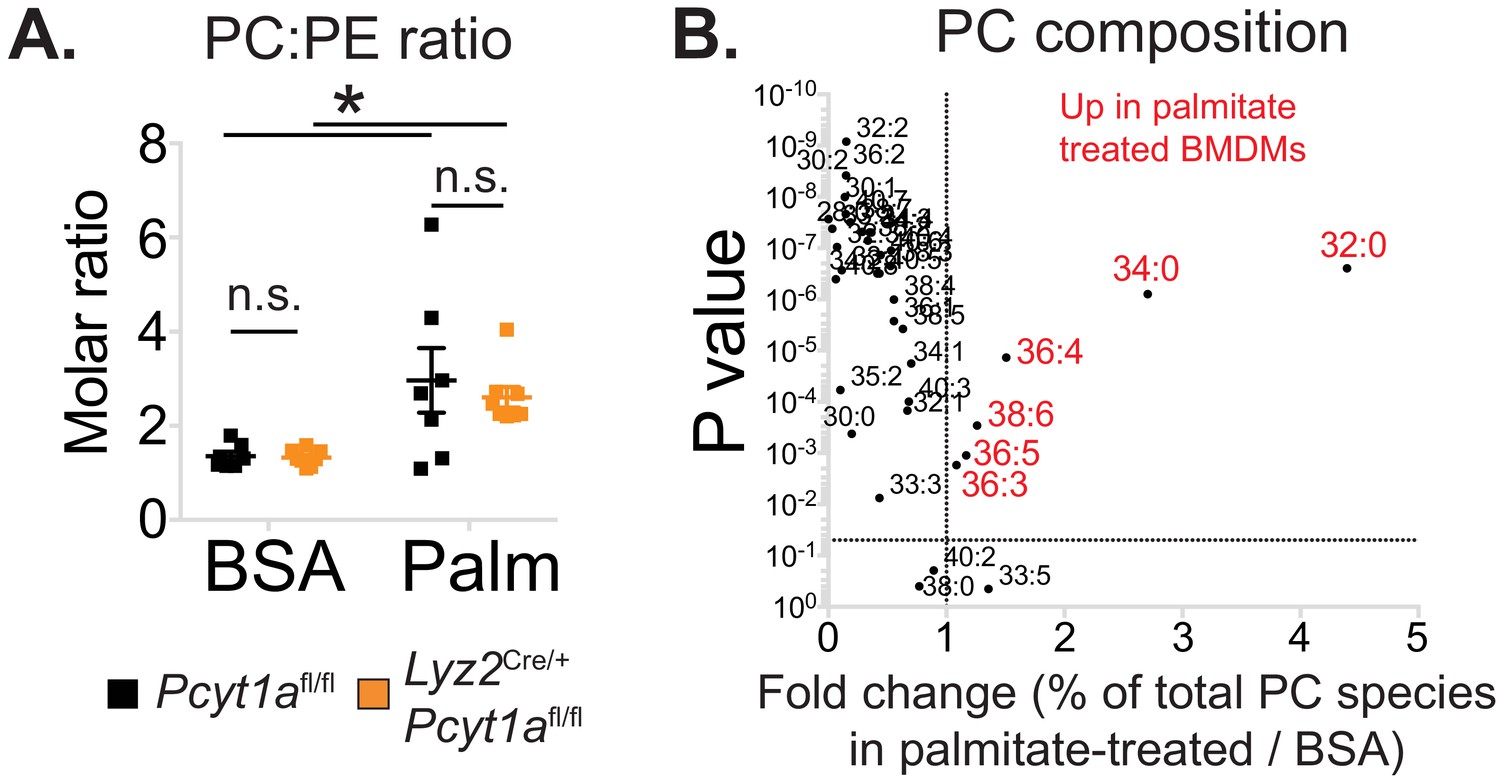
The effects of palmitate treatment on PC to PE ratio and PC composition in macrophages.
(A) PC to PE molar ratio in Pcyt1afl/fl (n = 7) or Pcyt1afl/fl Lyz2Cre/+ (n = 8) BMDMs in a basal state or after 16 hr treatment with 250 μM palmitate. (B) Volcano plot of indicated PC species, expressed as molar percentage of all measured PCs, in Pcyt1afl/fl (n = 7) BMDMs treated with BSA or 250 μM palmitate for 16 hr.
Figure 6—figure supplement 4
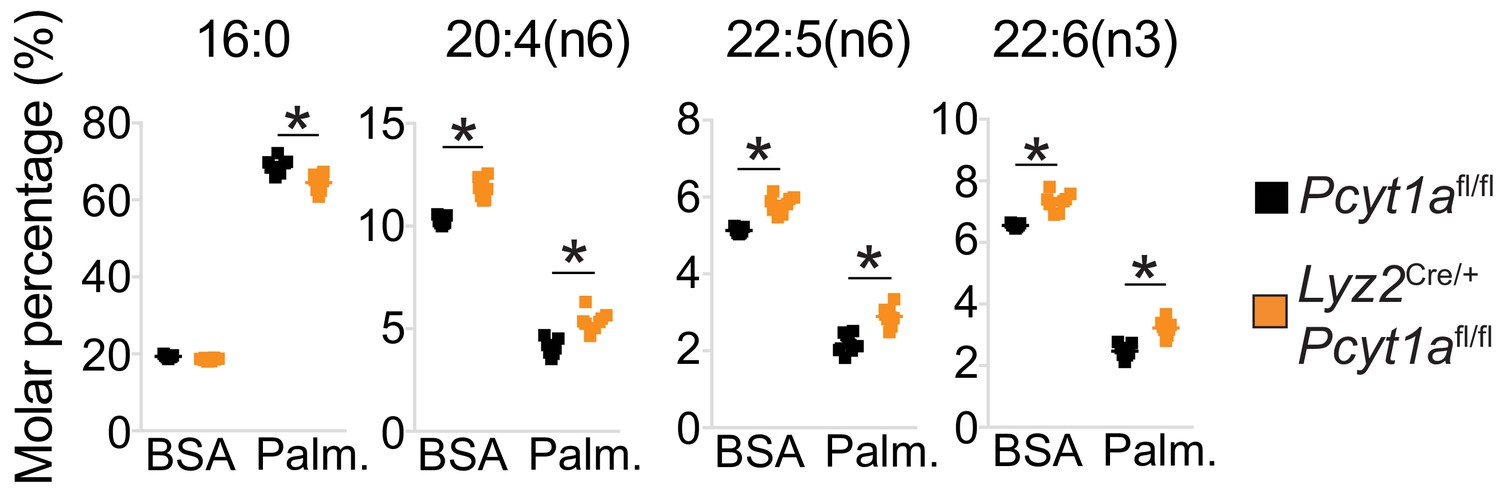
Pcyt1a deficiency increases total PUFA levels in macrophages.
Relative abundance of indicated fatty acids in Pcyt1afl/fl (n = 7) or Pcyt1afl/fl Lyz2Cre/+ (n = 8) BMDMs in a basal state or after 16 hr treatment with 250 μM palmitate.
Figure 7

Reduced PC turnover increases membrane PUFA levels in macrophages.
(A) 3H-arachidonate levels in Pcyt1afl/fl (n = 4) or Pcyt1afl/fl Lyz2Cre/+ (n = 4) BMDMs, pulsed with tracer amounts of 3H-arachidonate for 16 hr and chased with medium for indicated periods of time. (B) Linear regression analysis of the correlation between fold changes in the molar fatty acid percentage induced by genetic Pcyt1a deletion (n = 4) and by PLD inhibition using 15 μM 1-butanol for 24 hr (n = 4).
Tables
Key resources table
| Reagent type (species) or resource | Designation | Source or reference | Identifiers | Additional information |
|---|---|---|---|---|
| Genetic reagent (M. musculus, male) | Lepob/ob | The Jackson Laboratory | IMSR Cat# JAX:000632, RRID:IMSR_JAX:000632 | |
| Genetic reagent (M. musculus) | Lyz2Cre/+ | Clausen et al., 1999 | IMSR Cat# JAX:004781, RRID:IMSR_JAX:004781 | Lyz2tm1(cre)Ifo; Donated by Dr. Susan Jackowski |
| Genetic reagent (M. musculus) | Pcyt1afl/fl | Zhang et al., 2000 | IMSR Cat# JAX:008397, RRID:IMSR_JAX:008397 | Pcyt1atm1Irt; Donated by Dr. Susan Jackowski |
| Antibody | anti-CD45 | BD Biosciences | 564279, RRID:AB_2651134 | Flow cytometry (1:200) |
| Antibody | anti-CD11b | BD Biosciences | 564443, RRID:AB_2722548 | Flow cytometry (1:200) |
| Antibody | anti-SiglecF | BD Biosciences | 562757, RRID:AB_2687994 | Flow cytometry (1:200) |
| Antibody | anti-F4/80 | BioLegend | 123116, RRID:AB_893481 | Flow cytometry (1:200) |
| Antibody | Anti-F4/80 (IHC) | Bio-Rad | Cl:A3-1, RRID:AB_1102558 | IHC(1:100) |
| Antibody | anti-CD206 | BioLegend | 141723, RRID:AB_2562445 | Flow cytometry (1:200) |
| Antibody | anti-CD11c | BioLegend | 117336, RRID:AB_2565268 | Flow cytometry (1:200) |
| Antibody | anti-Ly6G | BioLegend | 127608, RRID:AB_1186099 | Flow cytometry (1:200) |
| Antibody | anti-CD301 | BioLegend | 145704, RRID:AB_2561961 | Flow cytometry (1:200) |
| Antibody | anti-CCTa | Abcam | ab109263, RRID:AB_10859965 | WB(1:1000 dilution in 3% milk TBS-T), 4°Covernight |
| Antibody | anti-beta Actin | Abcam | ab8227, RRID:AB_2305186 | WB(1:1000 dilution in 3% milk TBS-T), 4°C overnight |
| Antibody | anti-P-Thr183/Tyr185 JNK | Cell signalling | 9251, RRID:AB_331659 | WB(1:1000 dilution in 3% BSA TBS-T), 4°C overnight |
| Antibody | anti-JNK | Cell signalling | 9252, RRID:AB_2250373 | WB(1:1000 dilution in 3% BSA TBS-T), 4°C overnight |
| Antibody | anti-P-Thr180/Tyr182 p38 MAPK | Cell signalling | 4511L, RRID:AB_2139679 | WB(1:1000 dilution in 3% BSA TBS-T), 4°C overnight |
| Antibody | anti-p38 MAPK | Cell signalling | 9212, RRID:AB_330713 | WB(1:1000 dilution in 3% BSA TBS-T), 4°C overnight |
| Antibody | Anti-P-Ser473 AKT | Cell signalling | 4060, RRID:AB_2315049 | WB(1:1000 dilution in 3% BSA TBS-T), 4°C overnight |
| Antibody | Anti-P-Thr308 AKT | Cell signalling | 9275, RRID:AB_329828 | WB(1:1000 dilution in 3% BSA TBS-T), 4°C overnight |
| Antibody | Anti-pan AKT | Cell signalling | 9272, RRID:AB_329827 | WB(1:1000 dilution in 3% BSA TBS-T), 4°C overnight |
| Antibody | Anti-GAPDH | Cell signalling | 97166, RRID:AB_2756824 | WB(1:1000 dilution in 3% BSA TBS-T), 4°C overnight |
| Sequence-based reagent | List of nucleotide sequences | This paper | PCR primers | See Table S3 for the full list of qPCR primer sequences |
| Commercial assay or kit | Alpha Trak two glucose meter | Zoetis | N/A | |
| Commercial assay or kit | TruSeq Stranded mRNA Library Prep (96 Samples) | Illumina | 20020595 | |
| Commercial assay or kit | Vybrant Phagocytosis Assay Kit | Thermofisher | V-6694 | |
| Commercial assay or kit | RNeasy Mini Kit (250) | Qiagen | 74106 | |
| Chemical compound, drug | Insulin | Novo Nordisk | EU/1/02/230/003 | |
| Chemical compound, drug | STAT 60 | AMS Biotech | CS-502 | |
| Chemical compound, drug | Reverse Transcriptase M-MLV | Promega | M170b | |
| Chemical compound, drug | M-MLV RT 5x buffer | Promega | M351A | |
| Chemical compound, drug | MgCl2 25 mM | Promega | A351B | |
| Chemical compound, drug | Random Primers | Promega | C118A | |
| Chemical compound, drug | dNTP Mix 10 mM | Promega | U151B | |
| Chemical compound, drug | Chlorofom | Sigma | 34854 | |
| Chemical compound, drug | Methanol | Sigma | 34860 | |
| Chemical compound, drug | BF3 Methanol | Sigma | B1127 | |
| Chemical compound, drug | Hexane | Sigma | 34859 | |
| Chemical compound, drug | Ammonium formate | Sigma | 516961 | |
| Chemical compound, drug | Acetonitrile | VWR | 83640.320 | |
| Chemical compound, drug | 1-butanol | Sigma | 281549 | |
| Chemical compound, drug | Miltefosine | Sigma | M5571 | |
| Chemical compound, drug | Arachidonic acid | Cayman | 90010 | |
| Chemical compound, drug | Palmitic acid | Cayman | 1000627 | |
| Chemical compound, drug | [1-14C]- palmitic acid | Perkin Elmer | NEC075H050UC | |
| Chemical compound, drug | [1,2-14C]- acetic acid, sodium salt | Perkin Elmer | NEC553250UC | |
| Chemical compound, drug | Methyl-[3H]- choline chloride | Perkin Elmer | NET109250UC | |
| Chemical compound, drug | [5,6,8,9,11,12,14,15-3H(N)]-arachidonic acid | Perkin Elmer | NET298Z050UC | |
| Chemical compound, drug | Bovine Serum Albumin | Sigma | A8806 | BSA used for cell culture experiments |
| Chemical compound, drug | Hionic-Fluor scintillation liquid | Perkin Elmer | 6013319 | |
| Chemical compound, drug | Opti-Fluor scintillation liquid | Perkin Elmer | 6013199 | |
| Chemical compound, drug | Ethanol | Sigma | 459836 | |
| Chemical compound, drug | DAKO Real Peroxidase Blocking solution | Agilent | S2023 | |
| Chemical compound, drug | MOM ImmPress Polymer Reagent | Vector | MP-2400 | |
| Chemical compound, drug | DAB Peroxidase (HRP) Substrate Kit | Vector | SK-4100 | |
| Chemical compound, drug | Dako REAL Haematoxylin | Agilent | S2020 | |
| Software, algorithm | Metabolizer algorithm | Cubuk et al., 2018 | n/a | http://metabolizer.babelomics.org |
| Software, algorithm | MassHunter Workstation Software Quantitative Analysis (Version B.07.00) | Agilent Technologies Inc | n/a | |
| Software, algorithm | Thermo Xcalibur Quan browser integration software (Version 3.0) | Thermofisher | n/a | |
| Software, algorithm | HALO AI | Indica Labs | n/a | |
| Software, algorithm | TopHat (Version 2.0.11) | Kim et al., 2013 | RRID:SCR_013035 | |
| Software, algorithm | EdgeR | Robinson et al., 2010 | RRID:SCR_012802 | |
| Software, algorithm | HiPathia | Hidalgo et al., 2017 | n/a | http://hipathia.babelomics.org |
Additional files
-
Supplementary file 1
The list of biological processes increased in Lepob/ob compared to WT ATMs at week 16 and no change at week 5, ranked in ascending order of adjusted p value.
- https://doi.org/10.7554/eLife.47990.029
-
Supplementary file 2
The list of differentially regulated GO biological processes in eWAT isolated from Lepob/ob BMT Pcyt1afl/fl and Pcyt1afl/flLyz2Cre/+ mice, ranked in ascending order of p value.
Supplementary file 2b. The list of differentially expressed genes in eWAT isolated from Lepob/ob BMT Pcyt1afl/fl and Pcyt1afl/flLyz2Cre/+ mice, ranked in ascending order of p value.
- https://doi.org/10.7554/eLife.47990.030
-
Supplementary file 3
The list of qPCR primer sequences used in this publication.
FAM/TAMRA reporter and quencher detection system was used for genes with indicated probe sequences, and SYBR was used for the remaining genes.
- https://doi.org/10.7554/eLife.47990.031
-
Transparent reporting form
- https://doi.org/10.7554/eLife.47990.032
Download links
A two-part list of links to download the article, or parts of the article, in various formats.
Downloads (link to download the article as PDF)
Open citations (links to open the citations from this article in various online reference manager services)
Cite this article (links to download the citations from this article in formats compatible with various reference manager tools)
Accelerated phosphatidylcholine turnover in macrophages promotes adipose tissue inflammation in obesity
eLife 8:e47990.
https://doi.org/10.7554/eLife.47990


