piRNA-guided co-transcriptional silencing coopts nuclear export factors
- University of Cambridge, United Kingdom
Figures
Figure 1 with 2 supplements
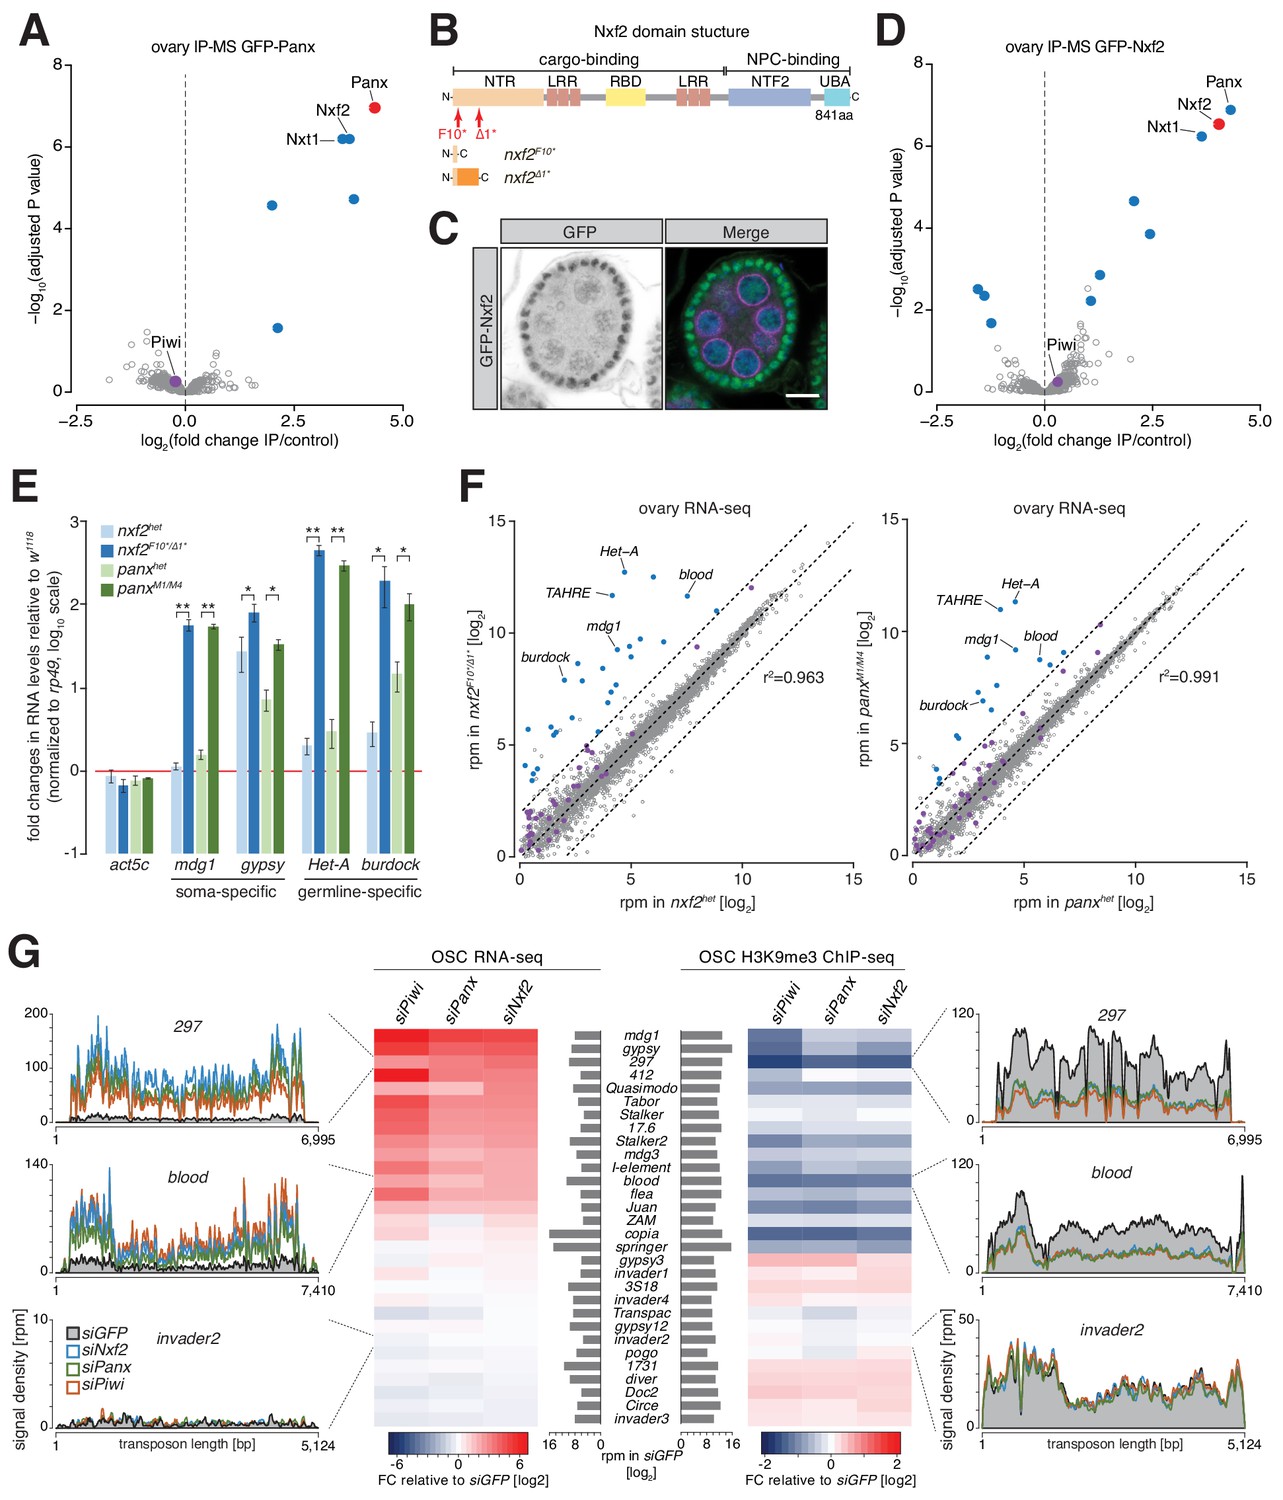
Nxf2 is a piRNA pathway factor that functions in transcriptional gene silencing.
(A) Volcano plot showing enrichment values and corresponding significance levels for proteins co-purified with GFP-Panx from ovary lysates (n = 4 for GFP-Panx and n = 3 for control ovaries). Proteins with fold change >2 and adjusted P value < 0.05 are highlighted in blue. The bait protein is labeled in red and Piwi is shown in purple. (B) Cartoon displaying the Nxf2 domain structure and generated mutants. NTR, amino-terminal region; LRR, leucine rich repeats; RBD, RNA-binding domain; NTF2, NTF2-like domain; UBA, Ubiquitin associated domain. (C) Expression and localization of GFP-Nxf2 in an egg chamber is shown by immunofluorescence (see also Figure 1—figure supplement 1C). Green, GFP-Nxf2; magenta, Aubergine; blue, DNA. Scale bar, 10 µm. (D) as (A) but co-purification from GFP-Nxf2 ovary lysates (GFP-Nxf2, n = 4; control, n = 3). (E) Bar graphs showing fold changes in steady-state RNA levels of soma- (mdg1, gypsy) and germline- (HeT-A, burdock) specific transposons in total ovarian RNA from the indicated genotypes (relative to wild-type and normalized to rp49). * denotes P value < 0.05; ** denotes p<0.001 (unpaired t-test). Error bars indicate standard deviation (n = 3). (F) Scatter plots showing expression levels (reads per million sequenced reads) of genes (in grey) and transposons (in purple) from total RNA from ovaries of the indicated genotypes (left, nxf2; right, panx; n = 3; r2 values represent expression of genes only). Transposons whose abundance change more than four-fold compared to heterozygotes are highlighted in blue. (G) Heat maps showing RNA-seq (left) and H3K9me3 ChIP-seq (right) of the 30 most expressed transposons in OSCs (compared with siGFP) upon the indicated knockdowns. Density profiles of normalized reads from RNA-seq (left) and H3K9me3 ChIP-seq (right) experiments mapping to the indicated transposons.
-
Figure 1—source data 1
List of proteins recovered in GFP-Panx IP-MS.
- https://doi.org/10.7554/eLife.47999.006
-
Figure 1—source data 2
List of proteins recovered in GFP-Nxf2 IP-MS.
- https://doi.org/10.7554/eLife.47999.007
Figure 1—figure supplement 1

Nxf2 is a piRNA pathway factor acting in TGS.
(A) Western blot analyses of GFP-trap co-immunoprecipitation from lysates of ovaries from the indicated genotypes (representative replicate subjected to mass spectrometry analysis; IN, input; UB, unbound; IP, immunoprecipitate). (B) Cartoon displaying the domain structure of the Drosophila nuclear export factor (NXF) family. NTR, amino-terminal region; LRR, leucine rich repeats; RBD, RNA-binding domain; NTF2, NTF2-like domain; UBA, Ubiquitin associated domain. (C) Expression and localization of GFP-Nxf2 and GFP-Panx alongside Aubergine (Aub) and DNA (visualized by DAPI) in an egg chamber is shown by immunofluorescence. Scale bar, 10 µm. (D) Western blot analyses of FLAG-tag co-immunoprecipitation from lysates of OSCs transfected with the indicated expression constructs (IN, input; UB, unbound; IP, immunoprecipitate). The bottom panel shows Piwi signal with enhanced contrast. (E) Cartoon displaying the domain structure of wild-type Nxf2 and the generated mutants as well as their underlying sequence alterations. (F) Bar graphs showing the egg hatching rate of female flies of the indicated genotypes. (G) Bar graphs showing the size distribution of transposon-mapping small RNAs from ovaries of the indicated genotypes (sense in blue, antisense in red). (H) Expression and localization of Piwi in egg chambers from nxf2 and panx heterozygote and mutant ovaries is shown by immunofluorescence. Scale bar, 10 µm.
Figure 1—figure supplement 2
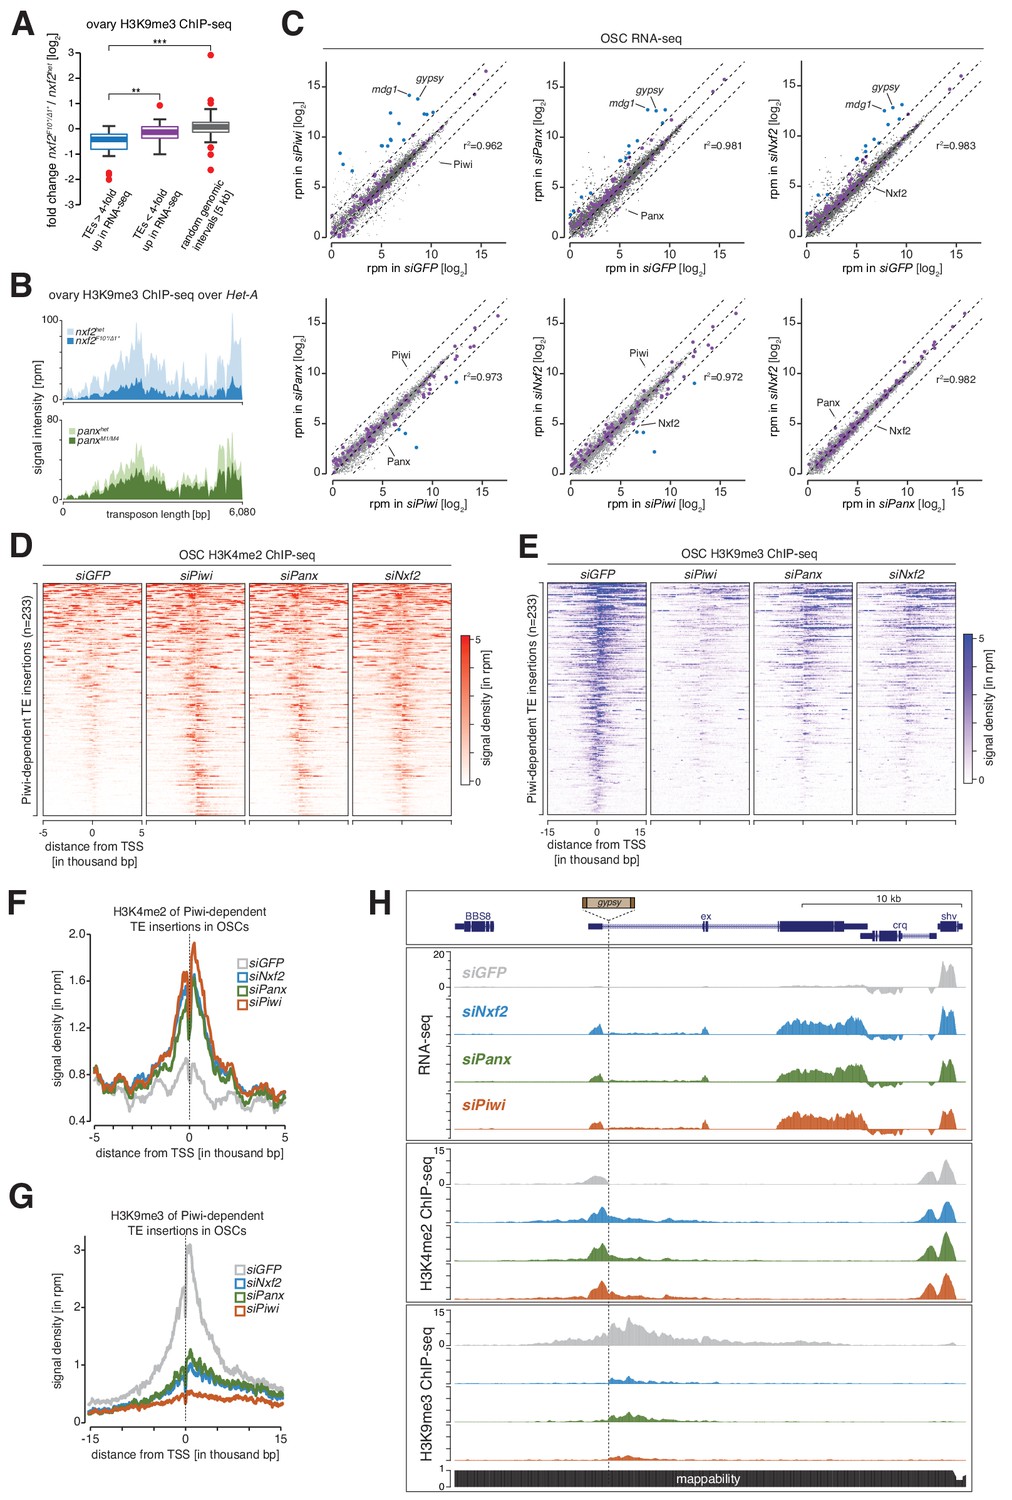
Loss of Nxf2 impairs TGS at levels comparable to Panx.
(A) Box plot showing changes in H3K9me3 levels between nxf2 heterozygotes and mutants in ovarian ChIP-seq for the indicated categories (coloring of transposons is based on their fold change in RNA-seq in Figure 1F; 100 random genomic intervals of 5 kb bin size are shown in grey). ** denotes P value < 0.001; *** denotes P value < 0.0001 (Welch two sample t-test). (B) Density plots representing ChIP-seq signal from ovaries mutant for nxf2 and panx over the Het-A transposon consensus sequence are shown along with heterozygote flies. (C) Scatter plots showing expression levels (reads per million sequenced reads) of genes (in grey) and transposons (in purple) from total RNA from OSCs of the indicated knockdowns (n = 3; r2 values represent expression of genes only). Transposons whose abundance change more than four-fold are highlighted in blue. (D) Heat maps showing H3K4me2 levels calculated from 233 Piwi-dependent transposon insertions in the indicated knockdowns in OSCs (sorted for decreasing intensity in siGFP). Genomic regions flanking the transposon insertions (5 kb upstream and downstream) are shown. (E) As in (D) but H3K9me3 levels are shown for 15 kb up- and downstream of the transposon insertions (sorted for decreasing intensity in siGFP). (F) Shown are metaprofiles of the average H3K4me2 signals 5 kb up- and downstream of 233 euchromatic transposon insertions in the gfp, piwi, panx and nxf2 knockdowns shown in (D). (G) as in (F) but showing metaprofiles displaying average H3K9me3 signals 15 kb up- and downstream of the insertions shown in (E). (H) Genome browser shot displaying profiles of RNA-seq levels and the density of H3K4me2 and H3K9me3 chromatin marks in OSCs upon the indicated knockdowns. Shown is an euchromatic gypsy insertion located within an intron of the 5' UTR of the gene ex located on chromosome 2L.
Figure 2 with 1 supplement
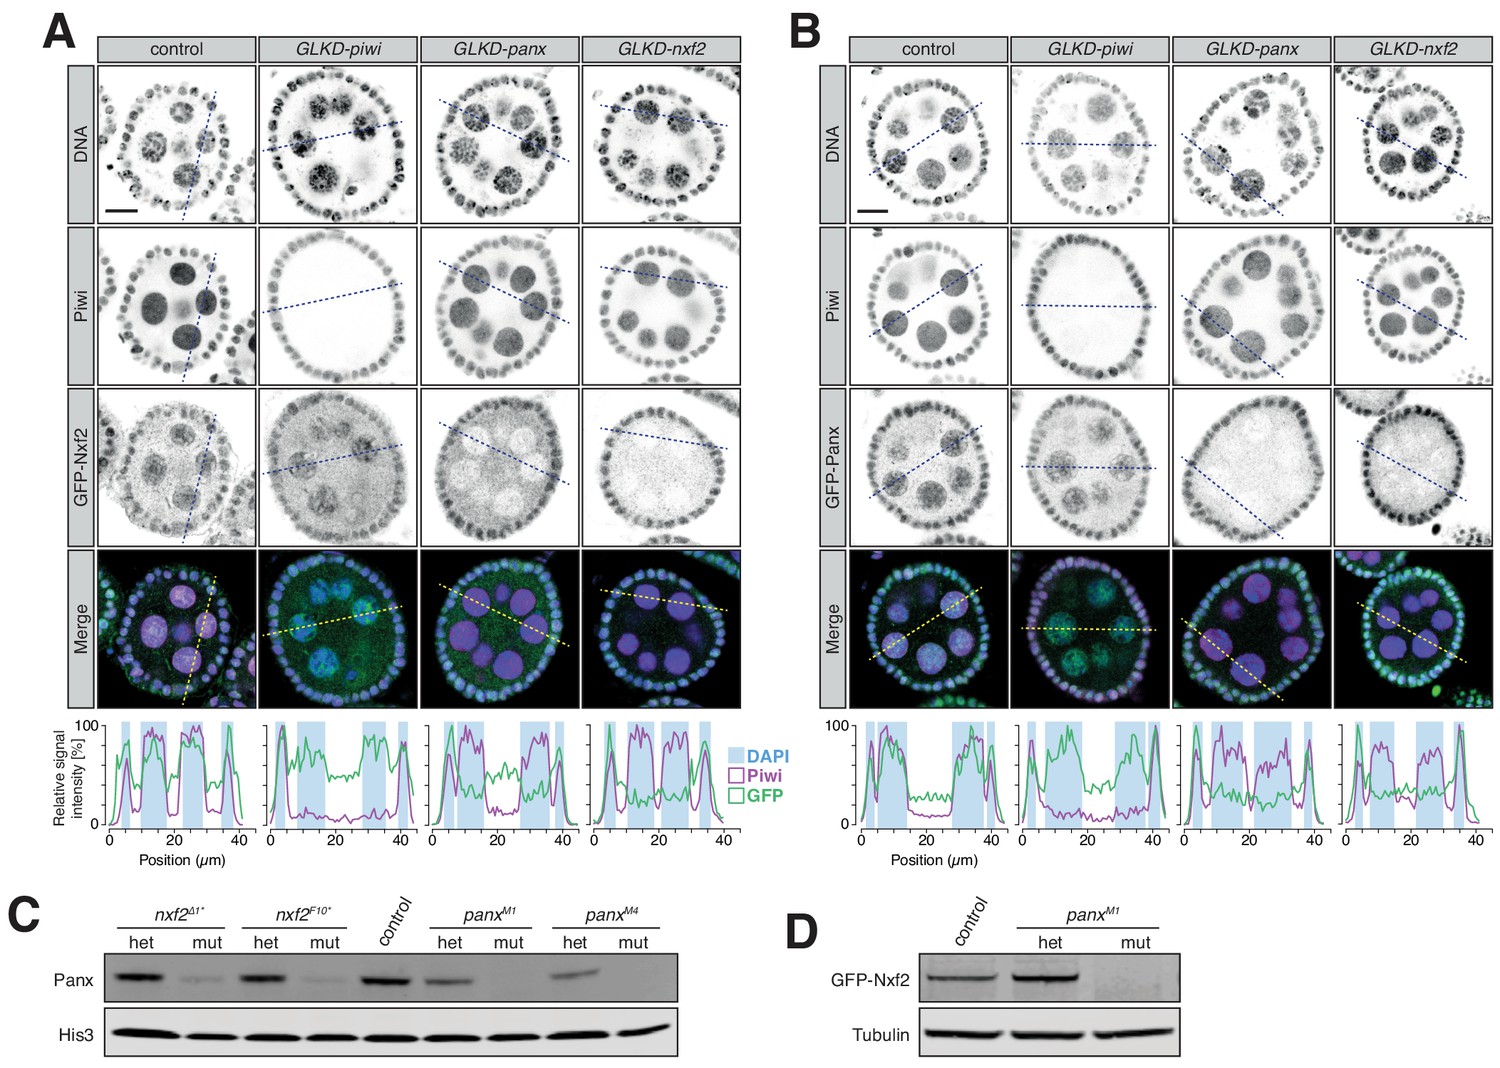
Protein stability and localization of Nxf2 and Panx is reciprocally co-dependent.
(A) Expression and localization of Piwi and GFP-Nxf2 in egg chambers upon germline-specific knockdown (GLKD) of the indicated factors are shown by immunofluorescence (GFP, green; Piwi, magenta; DNA, blue). Scale bar, 10 µm. Plot profiles showing the relative signal intensity of Piwi (magenta), GFP-Nxf2 fusion protein (green) and DAPI (blue background box) were computed from the indicated sections. (B) as (A) but showing GFP-Panx. (C) Western blot showing Panx protein levels in ovaries from panx and nxf2 heterozygotes and mutants compared to w1118 control flies. His3 served as loading control. (D) as (C) but showing levels of GFP-Nxf2 protein.
Figure 2—figure supplement 1
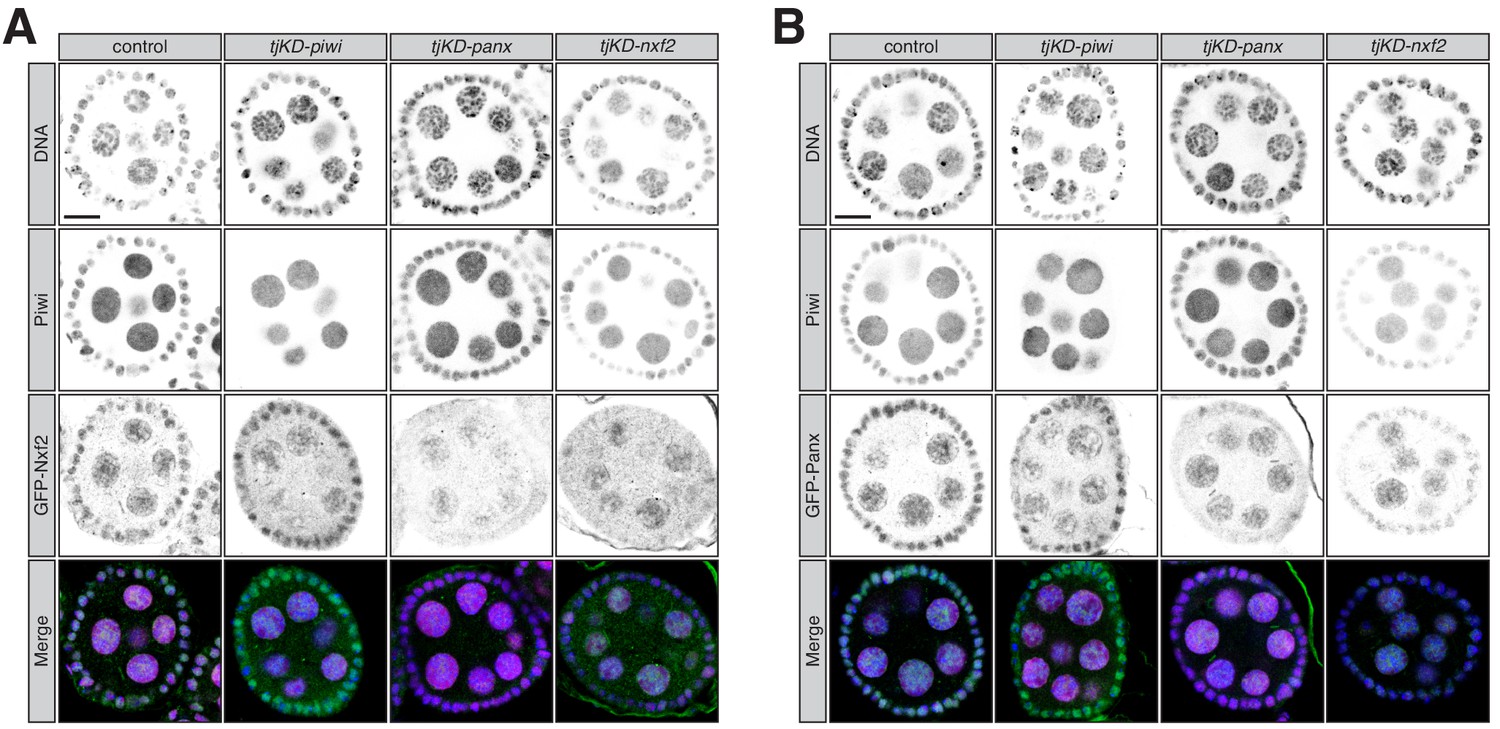
Protein stability and localization of Nxf2 and Panx is reciprocally co-dependent.
(A) Expression and localization of Piwi and GFP-Nxf2 in egg chambers upon follicle cell-specific knockdown (tjKD) of the indicated factors are shown by immunofluorescence (GFP, green; Piwi, magenta; DNA, blue). Scale bar, 10 µm. (B) as (A) but showing Piwi and GFP-Panx.
Figure 3 with 2 supplements
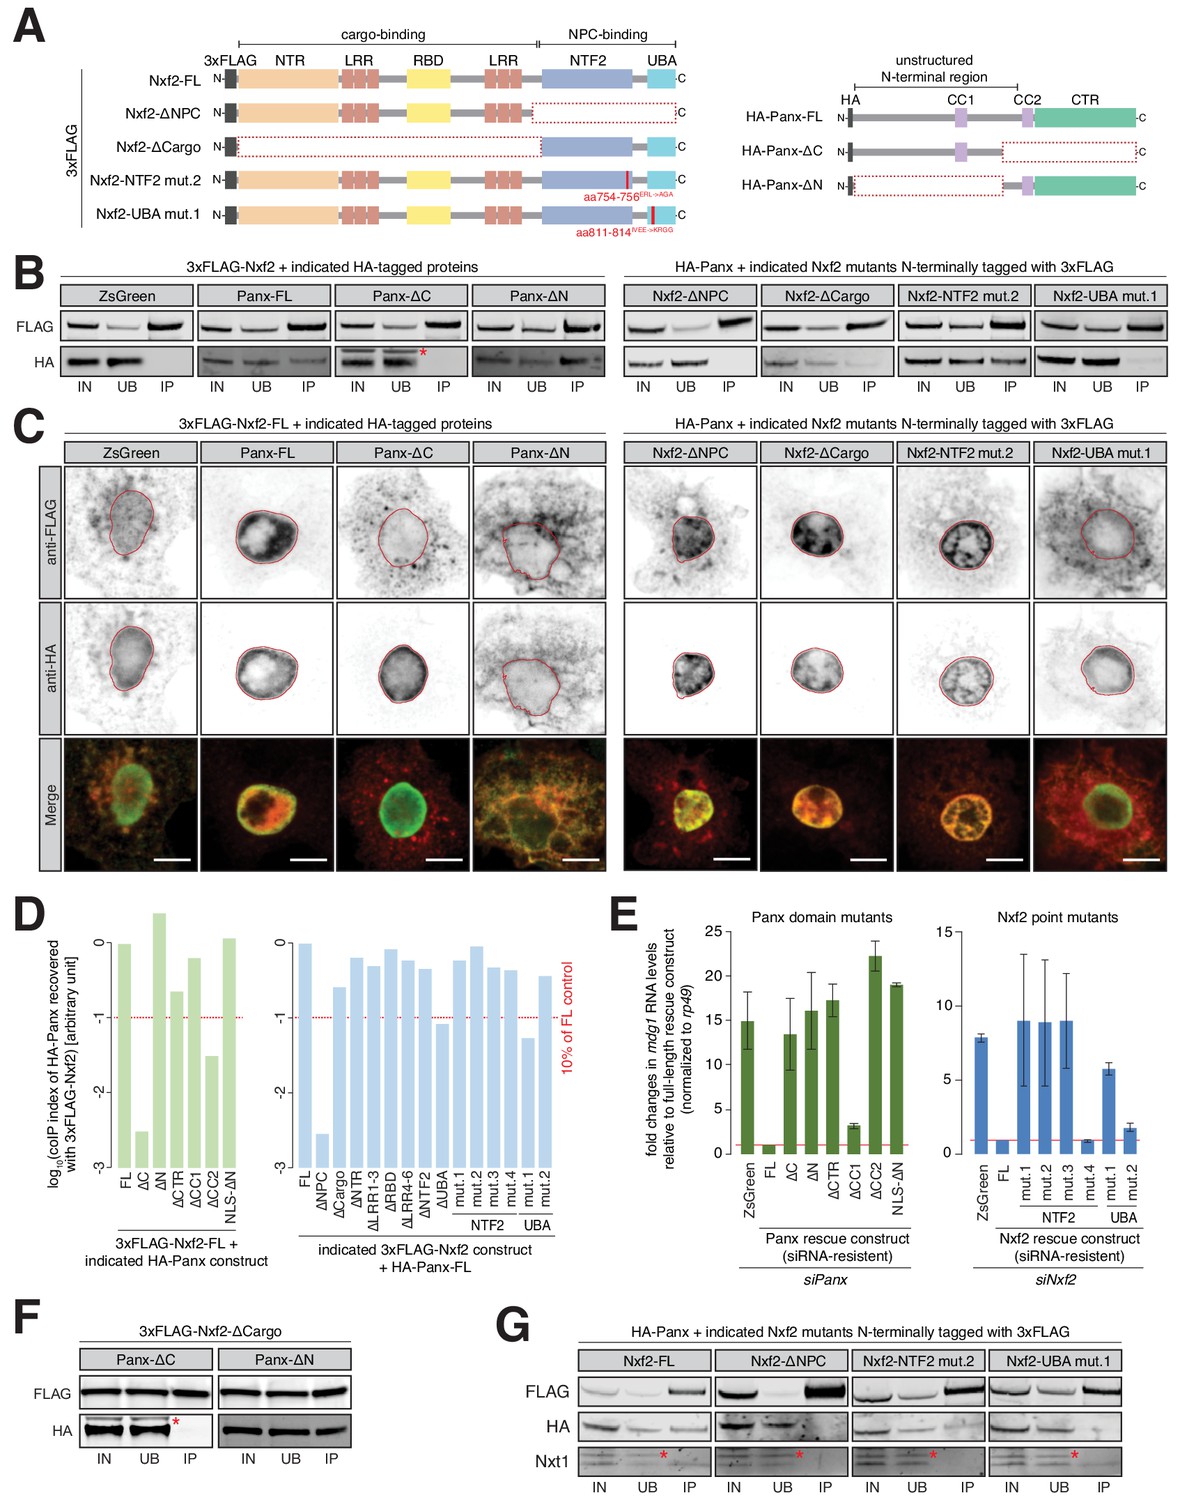
Requirements for the formation and function of the PICTS complex.
(A) Cartoons displaying the Nxf2 and Panx protein structures and domain mutants used (see also Figure 3—figure supplement 1A and Figure 3—figure supplement 2A). NTR, amino-terminal region; LRR, leucine rich repeats; RBD, RNA-binding domain; NTF2, NTF2-like domain; UBA, Ubiquitin associated domain; CC, coiled coil domain; HA, Hemagglutinin tag. (B) Western blot analyses of FLAG-tag co-immunoprecipitation from lysates of S2 cells transfected with the indicated expression constructs (IN, input; UB, unbound; IP, immunoprecipitate). Asterisk indicates unspecific band from anti-HA antibody (see also Figure 3—figure supplement 1C, Figure 3—figure supplement 2B and Figure 3—figure supplement 2E). (C) Expression and localization of the indicated Nxf2 (3xFLAG-tagged, top, shown in red in the merge) and Panx (HA-tagged, bottom, shown in green in the merge) expression constructs in transfected S2 cells are shown by immunofluorescence (see also Figure 3—figure supplement 1D, Figure 3—figure supplement 2C and Figure 3—figure supplement 2F). Lamin staining (red lines) was used to draw the outline of the nuclear envelope. Scale bar, 5 µm. (D) Bar graphs showing quantification of (B) and Figure 3—figure supplement 1D and Figure 3—figure supplement 2B,E. Co-immunoprecipitation (coIP) index was calculated from HA[IP/input] over FLAG[IP/input] (see also Figure 3—figure supplement 1B). (E) Bar graphs showing fold changes in steady-state RNA levels of the mdg1 transposon in total RNA from OSCs transfected with siRNAs against Panx (left) and Nxf2 (right) and the indicated siRNA-resistant expression constructs (relative to full-length rescue construct and normalized to rp49). Error bars indicate standard deviation (Panx, n = 2; Nxf2, n = 3). (F) As in (B) but showing co-immunoprecipitation of Nxf2-∆Cargo with Panx-∆C and Panx-∆N constructs. (G) As in (B) but showing co-immunoprecipitation of HA-Panx and Nxt1 recovered with the indicated Nxf2 expression constructs. Asterisks indicate an unspecific band from anti-Nxt1 antibody.
Figure 3—figure supplement 1

Interaction between Nxf2 and Panx is required for proper transposon silencing.
(A) Cartoons displaying the Panx protein structure and domain mutants used in panels (C) and (D). CC, coiled coil domain; HA, Hemagglutinin tag. (B) Representative western blot displaying calculation of Co-immunoprecipitation (coIP) index from HA IP and input signals as well as FLAG IP and input signals. (C) Western blot analyses of FLAG-tag co-immunoprecipitation from lysates of S2 cells transfected with the indicated expression constructs (IN, input; UB, unbound; IP, immunoprecipitate). Asterisk indicates unspecific band from anti-HA antibody. (D) Expression and localization of full-length Nxf2 (3xFLAG-tagged, top, shown in red in the merge) and the indicated Panx (HA-tagged, bottom, shown in green in the merge) expression constructs in transfected S2 cells are shown by immunofluorescence. Lamin staining (red lines) was used to draw the outline of the nuclear envelope. Scale bar, 5 µm.
Figure 3—figure supplement 2

Interaction between Nxf2 and Panx is required for proper transposon silencing.
(A) Cartoons displaying the Nxf2 protein structure and domain mutants and altered residues used in panels (B) through (H). (B) Western blot analyses of FLAG-tag co-immunoprecipitation from lysates of S2 cells transfected with the indicated expression constructs (IN, input; UB, unbound; IP, immunoprecipitate). (C) Expression and localization of the indicated Nxf2 domain mutant (3xFLAG-tagged, top, shown in red in the merge) and full-length Panx (HA-tagged, bottom, shown in green in the merge) expression constructs in transfected S2 cells are shown by immunofluorescence. Lamin staining (red lines) was used to draw the outline of the nuclear envelope. Scale bar, 5 µm. (D) Bar graphs showing fold changes in steady-state RNA levels of the mdg1 transposon in total RNA from OSCs transfected with siRNAs against and Nxf2 and the indicated siRNA-resistant expression constructs (relative to full-length rescue construct and normalized to rp49; n = 1). (E) As in (B) but showing co-immunoprecipitation of the indicated Nxf2 point mutants. (F) As in (C) but showing the expression and localization of Nxf2 point mutants. (G) As in (B) but showing co-immunoprecipitation of HA-tagged Panx and Nxt1 with the indicated Nxf2 point mutants.
Figure 4 with 1 supplement
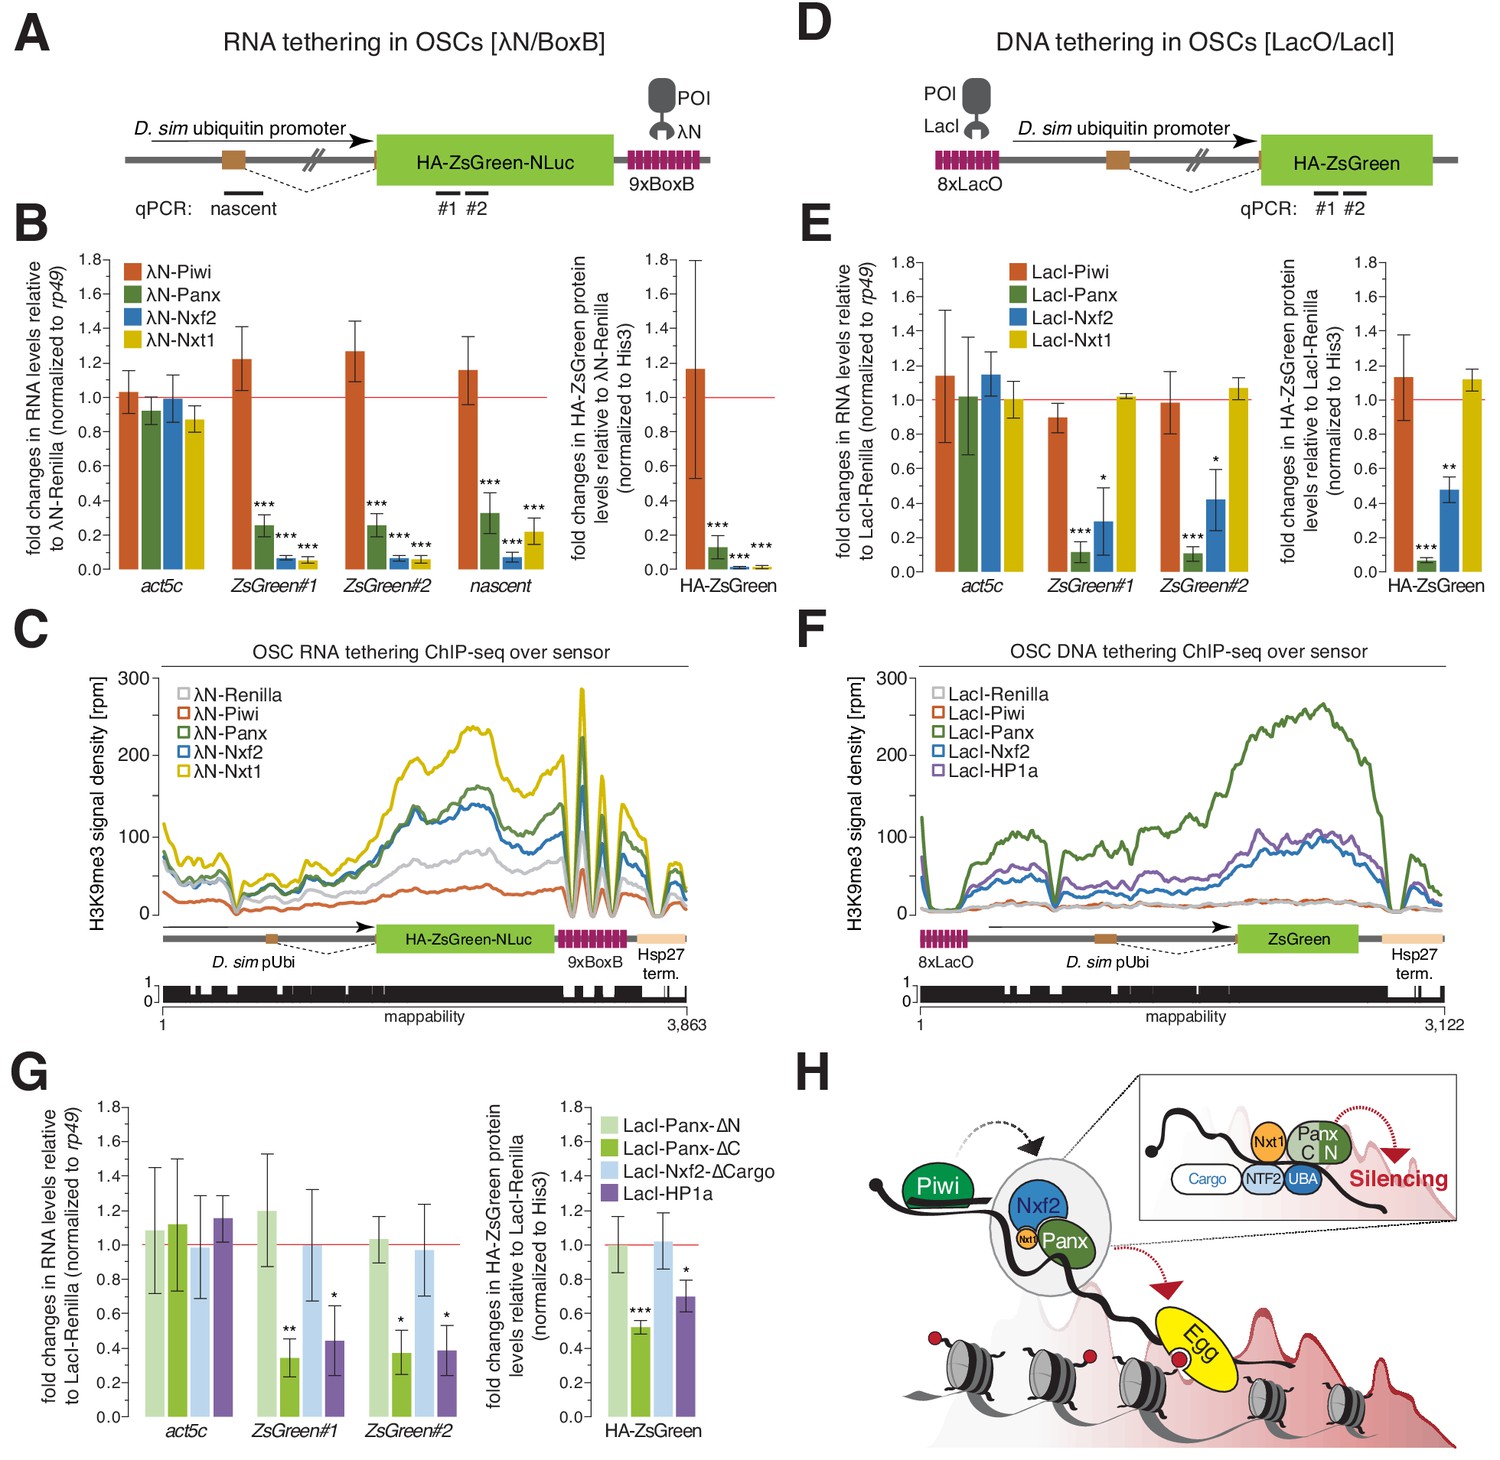
Recruitment of PICTS components to nascent RNA results in chromatin silencing.
(A) Cartoon displaying the RNA tethering sensor construct used in OSCs. The construct was stably integrated and features the Drosophila simulans ubiquitin promoter (which contains an intron), the ZsGreen coding sequence (fused to the HA-tag, a nuclear localization sequence and the NLuc luciferase), and a 3' UTR containing 9x BoxB sites. Amplicons for qPCR are indicated. (B) Left: Bar graphs showing fold changes in steady-state RNA levels of the sensor and act5c in total RNA from OSCs transfected with the indicated λN-fusion expression constructs (relative to a λN-Renilla construct and normalized to rp49). Right: Bar graphs showing fold changes in protein levels of HA-ZsGreen in lysates from OSCs transfected with the indicated λN expression constructs (relative to a λN-Renilla construct and normalized to His3). *** denotes P value < 0.0001 (unpaired t-test). Error bars indicate standard deviation (n = 4). (C) Density profiles of normalized reads from H3K9me3 ChIP-seq experiments mapping to the tethering reporter as indicated in the cartoon below. The mappability of reads is shown below. (D) as in (A) but showing the DNA tethering sensor. The construct features 8x LacO binding sites followed by the Drosophila simulans ubiquitin promoter and the HA-ZsGreen coding sequence. Amplicons for qPCR are indicated. (E) as in (B) but showing quantification of DNA tethering experiments. * denotes P value < 0.01; ** denotes p<0.001; *** denotes p<0.0001 (unpaired t-test). Error bars indicate standard deviation (n = 3). (F) as in (C) but showing density profiles of normalized reads from the DNA tethering reporter. (G) Quantification of DNA tethering experiments normalized to rp49 (qPCR) or His3 (protein) and relative to the same LacI-Renilla construct used in (E). * denotes P value < 0.01; ** denotes p<0.001; *** denotes p<0.0001 (unpaired t-test). Error bars indicate standard deviation (n = 3). (H) Model for piRNA-guided co-transcriptional silencing. Piwi scans for nascent transposon transcripts and upon target engagement recruits the PICTS complex to the RNA via an unknown signal. The association of the PICTS complex with target transcript causes co-transcriptional silencing, with the amino-terminus of Panx being required for silencing (insert). PICTS complex recruitment results in chromatin remodeling (H3K4me2 removal, H3K9me3 deposition), and depends on general silencing machinery factors such as Egg/dSetDB1.
Figure 4—figure supplement 1
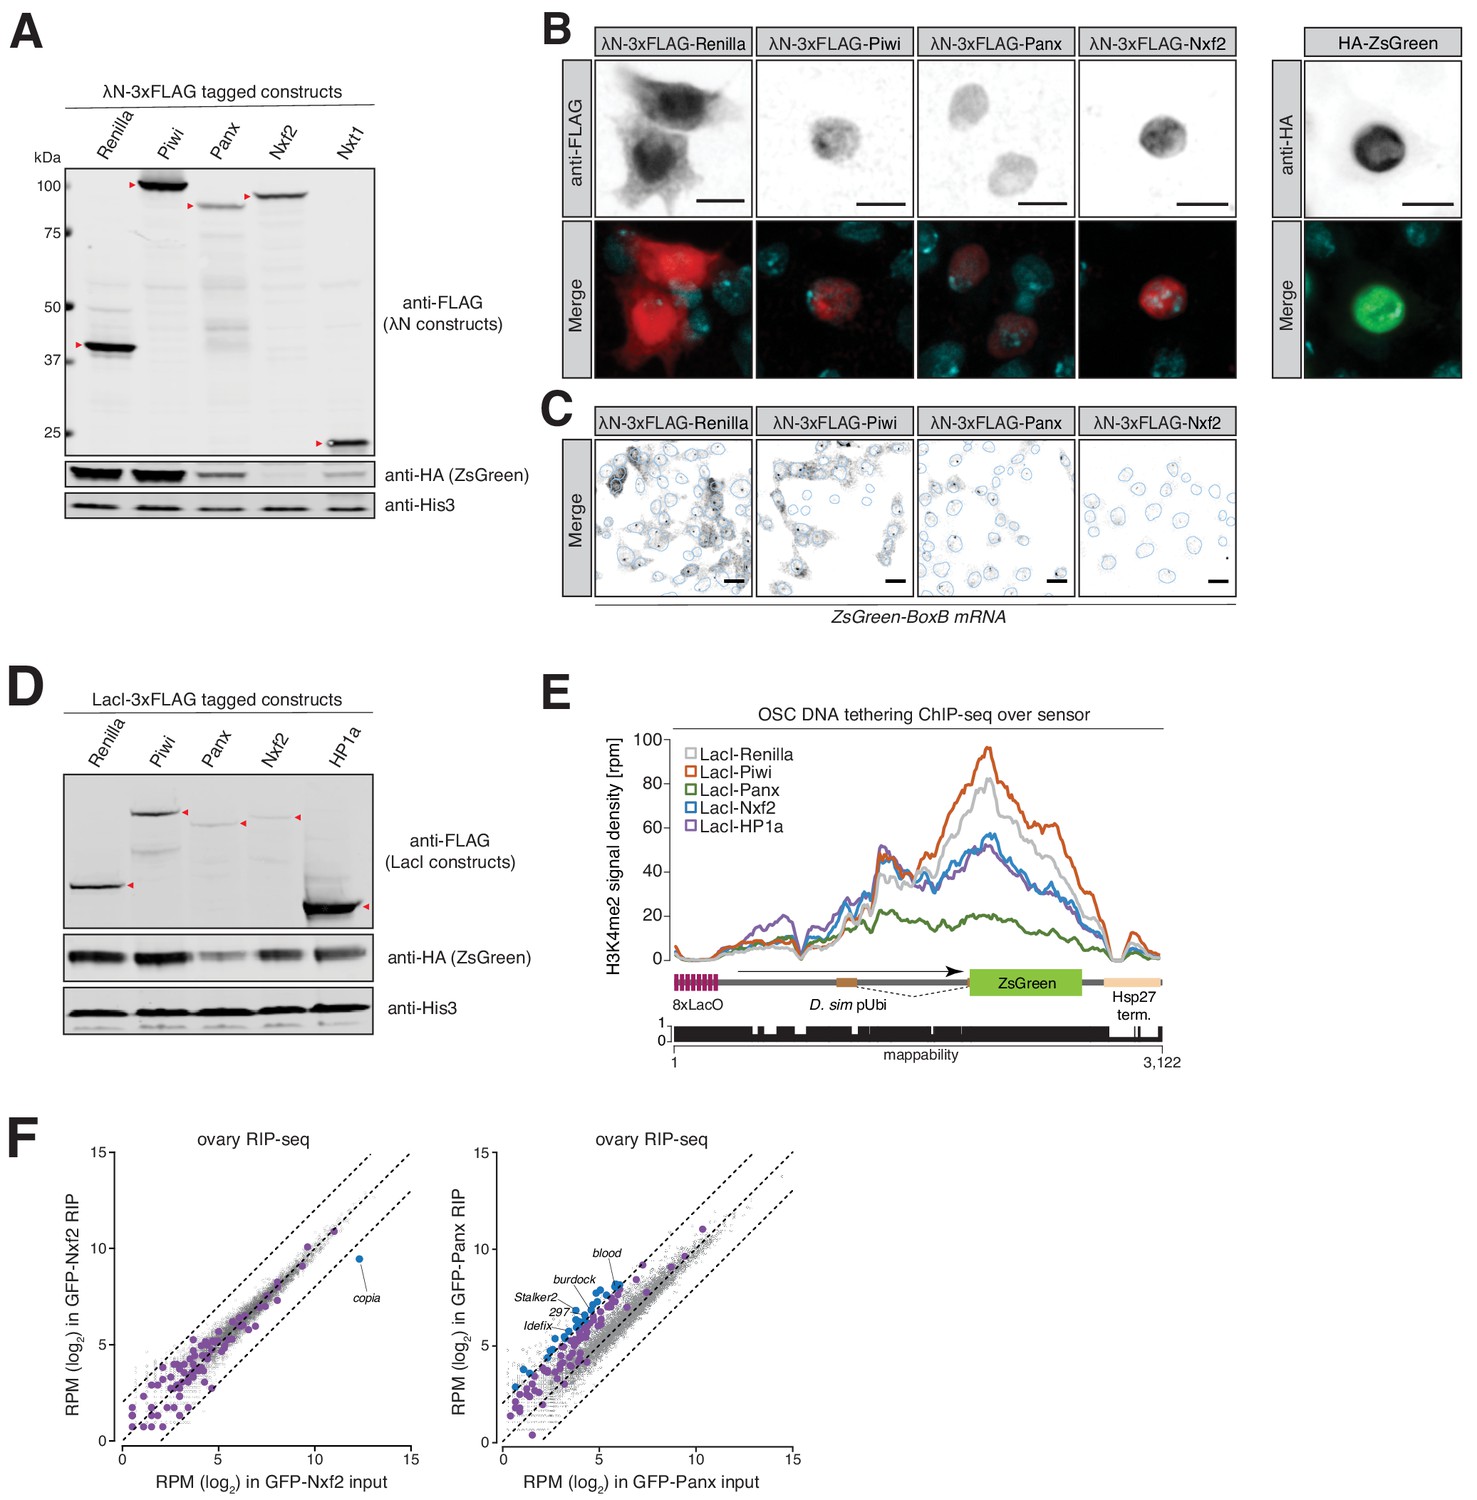
Artificial recruitment of Nxf2 to RNA or DNA results in chromatin silencing.
(A) Representative western blot analyses of λN-3xFLAG-fusion proteins, the HA-ZsGreen sensor and a loading control (His3) from lysates of OSCs transfected with the indicated constructs, used for quantification of RNA tethering in Figure 4B. (B) Immunofluorescence staining showing the expression and localization of the indicated λN-3xFLAG-fusion constructs (left, shown in red in the merge) used for tethering assays and the HA-ZsGreen sensor (right, shown in green in the merge) in OSCs alongside DAPI (cyan). Scale bar, 5 µm. (C) Expression and localization of the steady-state RNA levels of the tethering sensor transcript in OSCs transfected with the indicated λN-fusion proteins is shown by RNA-FISH. Scale bar, 10 µm. DAPI was used to draw the nuclear outline. (D) As in (A) but showing representative western blot images of LacI-3xFLAG-fusion constructs used for DNA tethering in Figure 4D. (E) Density profiles of normalized reads from H3K4me2 ChIP-seq experiments mapping to the DNA tethering reporter as indicated in the cartoon below. The mappability of reads is shown below. (F) Scatter plots showing expression levels (reads per million sequenced reads) of genes (in grey) and transposons (in purple) from ovaries in the indicated RIP-seq libraries (left, GFP-Nxf2; right, GFP-Panx). Transposons whose abundance change more than four-fold compared to the input are highlighted in blue.
Additional files
-
Source code 1
Bash script for counting transposon derived reads.
- https://doi.org/10.7554/eLife.47999.015
-
Source code 2
R code for differential expression analysis.
- https://doi.org/10.7554/eLife.47999.016
-
Supplementary file 1
Oligonucleotides used in this study.
- https://doi.org/10.7554/eLife.47999.017
-
Transparent reporting form
- https://doi.org/10.7554/eLife.47999.018
Download links
A two-part list of links to download the article, or parts of the article, in various formats.
Downloads (link to download the article as PDF)
Open citations (links to open the citations from this article in various online reference manager services)
Cite this article (links to download the citations from this article in formats compatible with various reference manager tools)
piRNA-guided co-transcriptional silencing coopts nuclear export factors
eLife 8:e47999.
https://doi.org/10.7554/eLife.47999


