Cell-autonomous regulation of epithelial cell quiescence by calcium channel Trpv6
- University of Michigan, United States
Figures
Figure 1 with 2 supplements

Genetic deletion of the conserved epithelial calcium channel Trpv6 results in calcium deficiency and premature death.
(A) Schematic diagram showing trpv6 gene (WT) and various mutant sequences. Filled boxes indicate trpv6 ORF and open boxes indicate UTRs. Introns are shown as lines. The gRNA targeting site is indicated in blue color and PAM motif is underlined. Deleted and inserted nucleotides are indicated by dash lines and red letters, respectively. (B) Schematic diagram of Trpv6 (WT) and its mutants. Putative functional domains are indicated. The gray box indicates altered sequence caused by frame shifts. (C–D) Survival curves of trpv6Δ8-/-; Tg(igfbp5a:GFP) (C) and trpv6Δ7-/-; Tg (igfbp5a:GFP) fish (D) and siblings. The numbers of total fish are indicated. (E) Representative images of Alizarin red stained wild-type and trpv6Δ8-/-; Tg(igfbp5a:GFP) fish at 7 days post fertilization (dpf). (F) Fura-2 Ca2+ imaging analysis of HEK293 cells transfected with the indicated plasmids. n > 50 cells from three independent experiments. (G) The maximal influx rate. n = 3 independent experiments. (H) Currents evoked by a RAMP voltage from −120 mV to +120 mV in HEK293 cells transfected with the indicated plasmids. In this and all subsequent figures, unless specified otherwise data shown are Mean ± SEM. Different letters indicate significant difference at p<0.05, one-way ANOVA followed by Tukey’s multiple comparison test.
-
Figure 1—source data 1
Excel spreadsheet containing quantitative data for Figure 1.
- https://doi.org/10.7554/eLife.48003.005
Figure 1—figure supplement 1
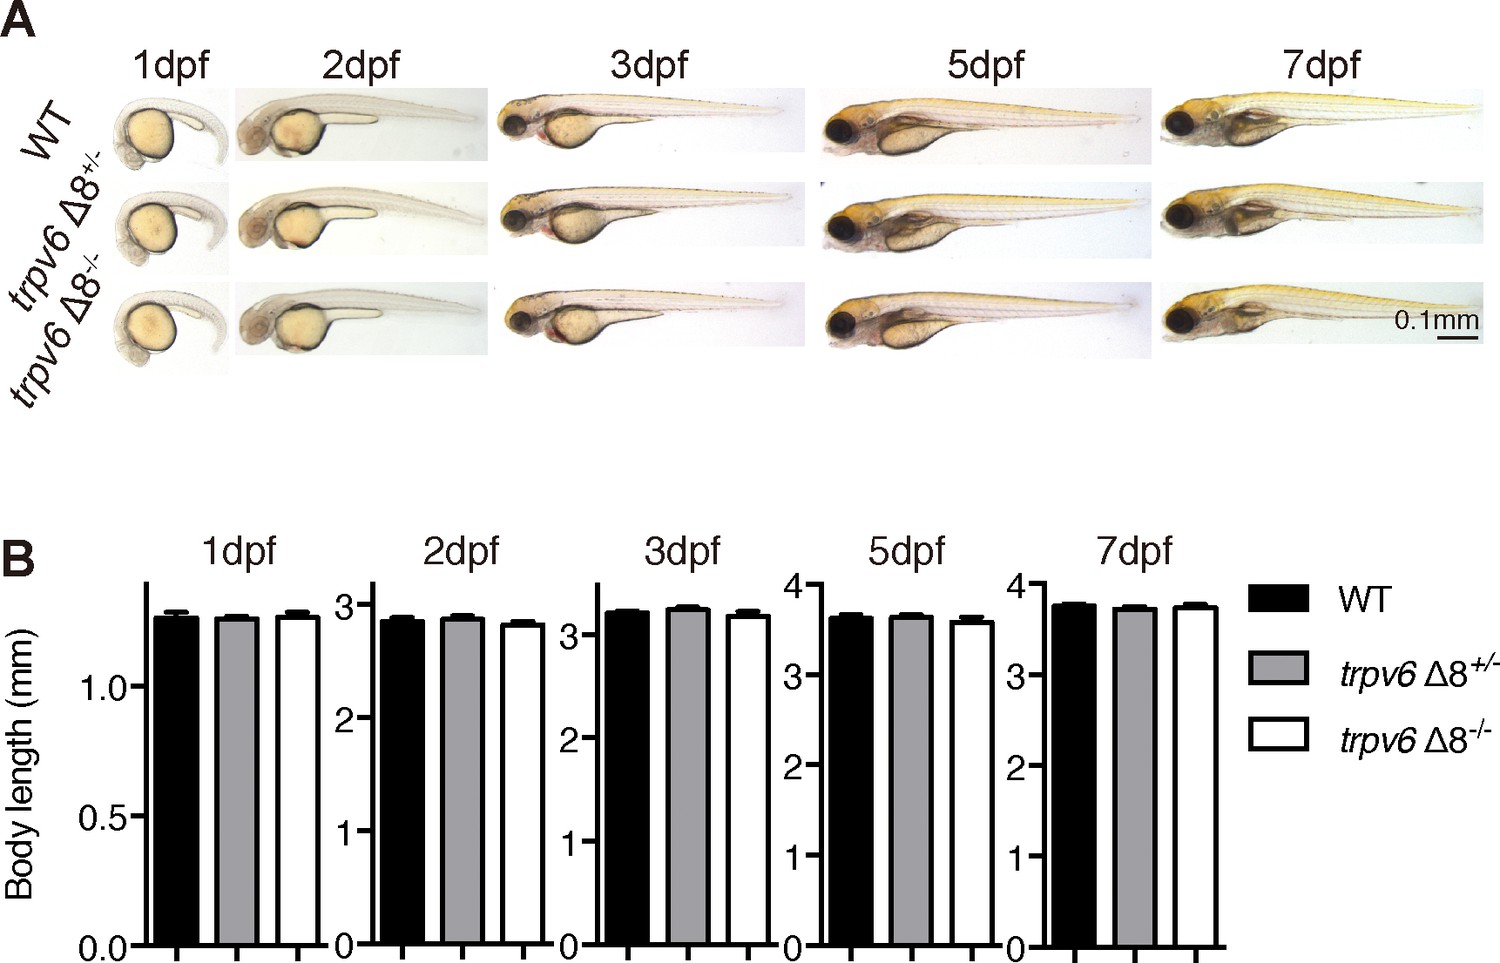
Morphology of trpv6 mutant fish.
(A–B) Gross morphology (A) and body size (B) of trpv6Δ8-/-; Tg(igfbp5a:GFP) fish and siblings. Values are Mean ± SEM, n = 7–23 fish. No statistical significance was found.
Figure 1—figure supplement 2
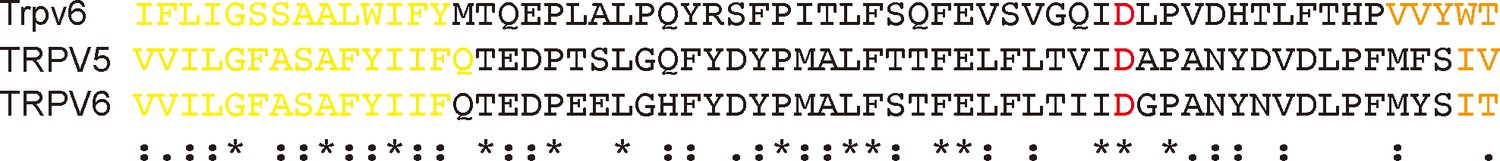
Sequence alignment of the zebrafish Trpv6, human TRPV5, and human TRPV6 pore region.
Transmembrane domain 5 and 6 are indicated in yellow and orange letters, respectively. The ion pore region is indicated by black letters and the critical Asp residue (D) is labeled in red.
Figure 2 with 2 supplements
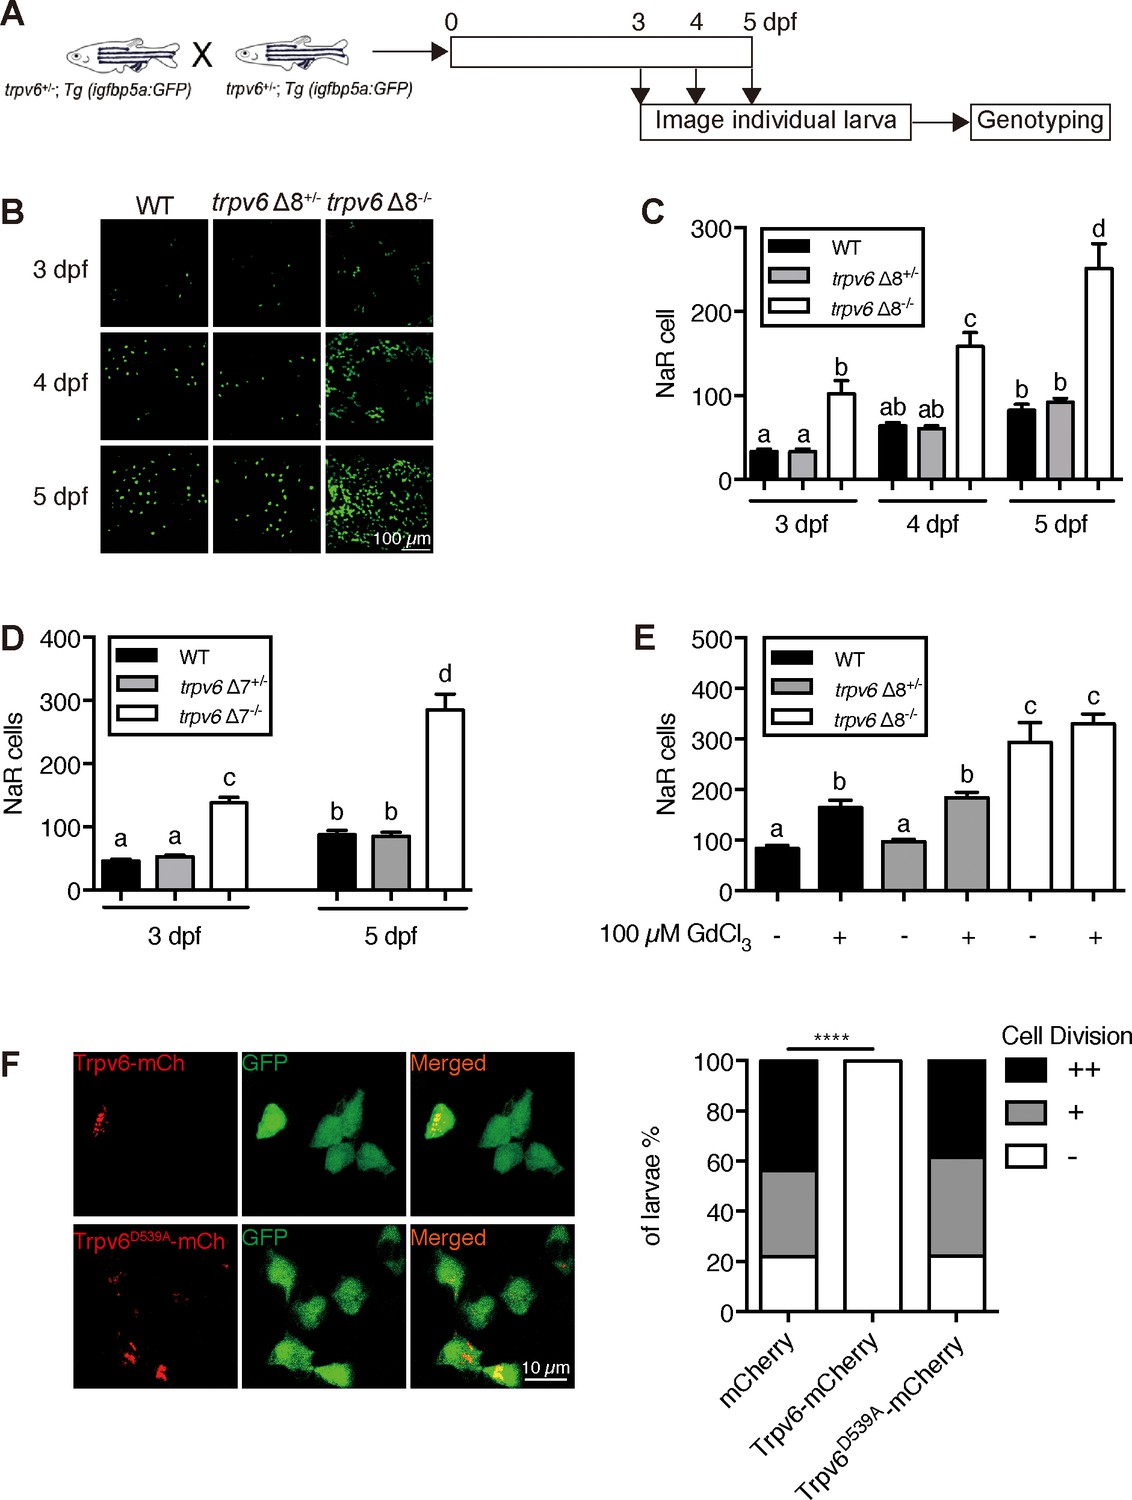
Trpv6 regulates epithelial cell quiescence-proliferation decision.
(A) Diagram of the experimental design. (B) Representative images. In this and all subsequent larval images, lateral views of the yolk-sac region are shown with dorsal up and anterior to the left. (C–D) Mean NaR cell number/fish of the indicated genotypes. n = 6–9. (E) Progenies of trpv6 Δ8+/-; Tg (igfbp5a:GFP) intercross were raised to 3 dpf and treated with 100 µM GdCl3 from 3 to 5 dpf. NaR cells in each fish were quantified following individual genotyping. n = 13–22. (F) Progenies of trpv6Δ8+/-;Tg(igfbp5a:GFP) intercross were injected with the indicated BAC-mCherry DNA at one-cell stage. At 5 dpf, the Trpv6-expressing NaR cells in each fish were scored following a published scoring system (Liu et al., 2018). Representative images are shown in the left and quantified results in the right panel. ****, p<0.0001 by Chi-Square test, fish n = 12–38.
-
Figure 2—source data 1
Excel spreadsheet containing quantitative data for Figure 2.
- https://doi.org/10.7554/eLife.48003.009
Figure 2—figure supplement 1
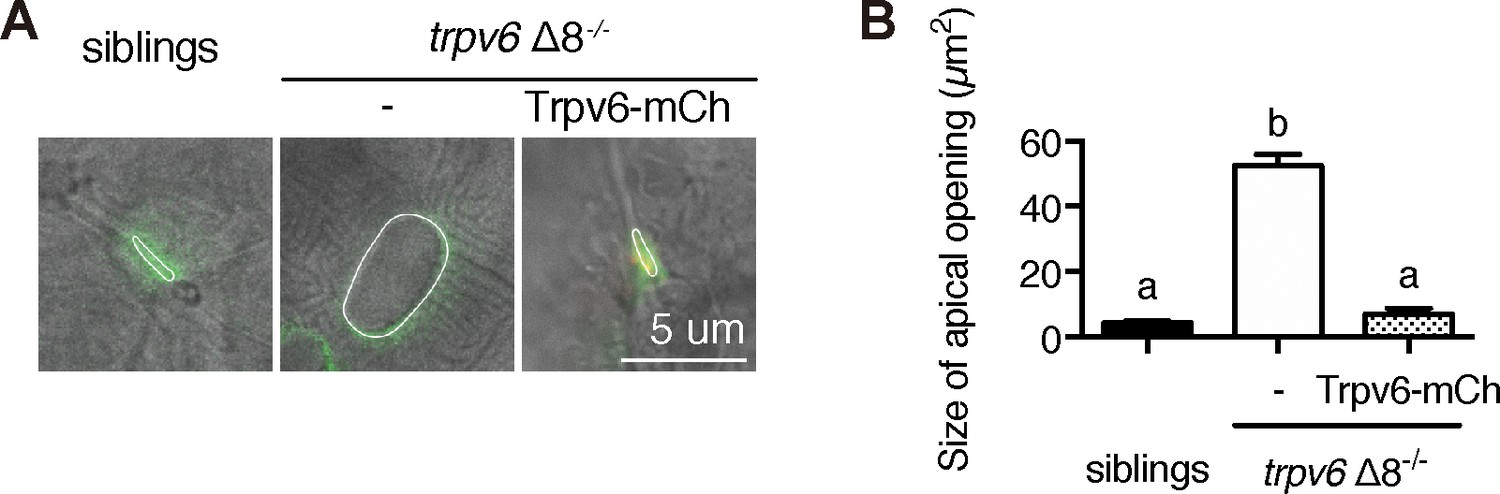
Genetic deletion of Trpv6 increases epithelial cell apical opening.
(A–B) Progenies of a trpv6Δ8+/-;Tg(igfbp5a:GFP) intercross were injected with or without the BAC(igfbp5a:Trpv6-mCherry) DNA. At 3 dpf, larvae were photographed, followed by individual genotyping. Representative images are shown in (A). The apical opening of NaR cells were quantified and shown in (B). Data are Mean ± SEM, n = 8–42. Different letters indicate significant difference at p<0.05, one-way ANOVA followed by Tukey’s multiple comparison test.
Figure 2—figure supplement 2
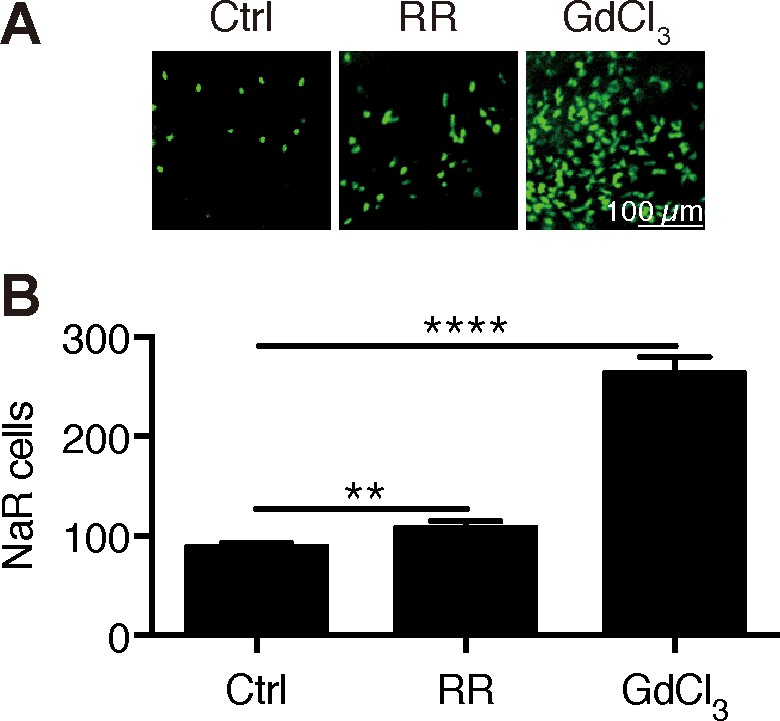
Inhibition of Trpv6 increases epithelial cell proliferation.
(A–B) Tg(igfbp5a:GFP) fish were treated with Ruthenium Red (2 µM) or GdCl3 (100 µM) from 3 to 5 dpf. Representative images are shown in (A). NaR cell numbers were quantified and shown in (B). **, **** indicate p<0.01 and 0.0001 by unpaired t-test.
Figure 3 with 4 supplements
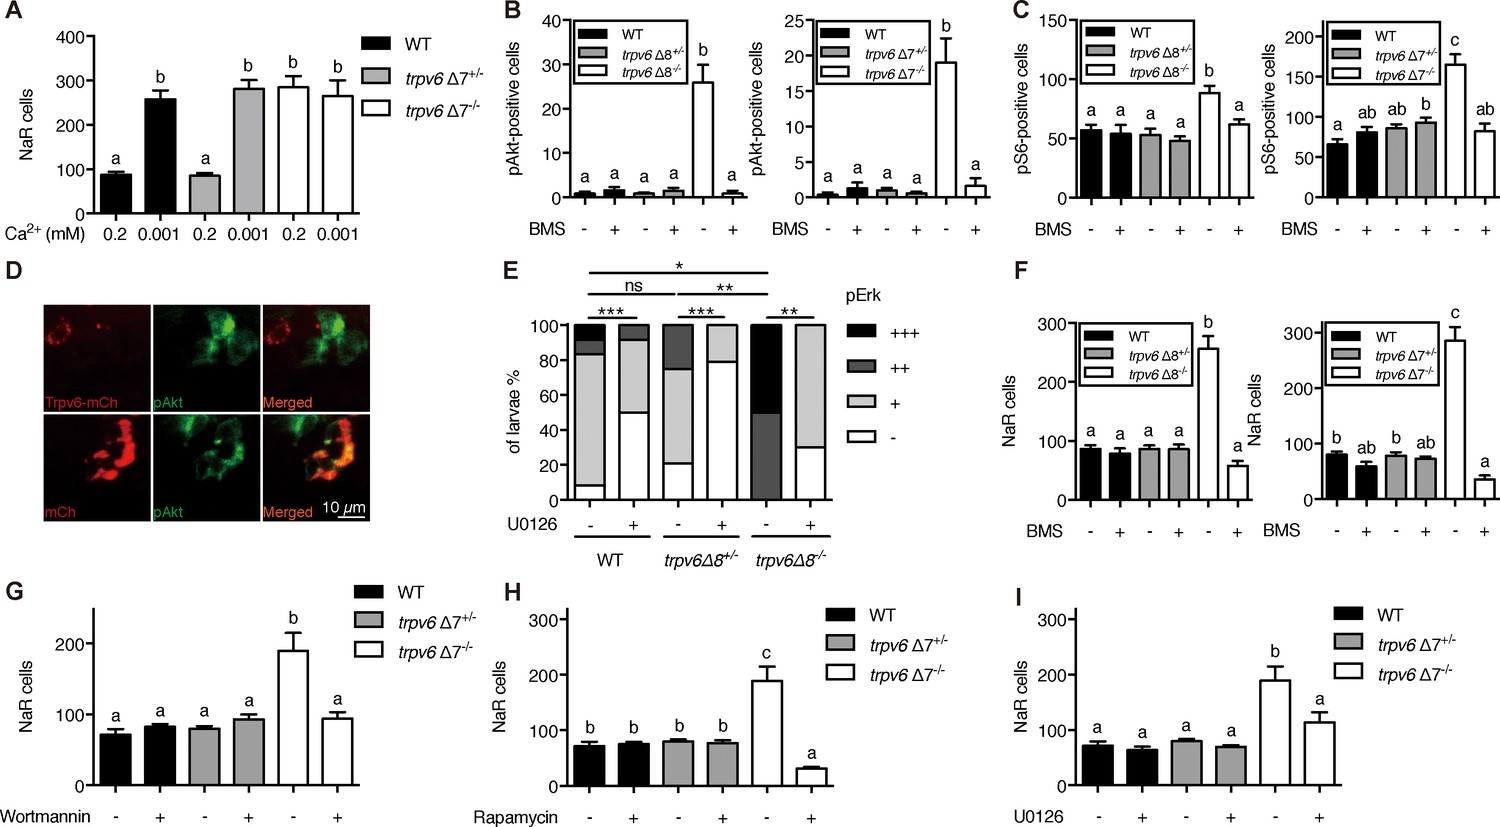
Trpv6 prevents the quiescence to proliferation transition via regulating IGF1 receptor-mediated IGF signaling.
(A) Progenies of trpv6Δ7+/-; Tg(igfbp5a:GFP) intercrosses were grown in embryo solutions with the indicated Ca2+ concentration from 3 dpf to 5 dpf. NaR cells in each fish were quantified followed by individual genotyping. n = 5–17 fish. (B–C) Embryos of the indicated genotypes were raised to 3 dpf and treated with 0.3 µM BMS-754807 or DMSO. At 4 dpf, the treated fish were subjected to immunostaining using an anti-phospho-Akt antibody (B) or an anti-phospho-S6 antibody (C). Representative images are shown in (Figure 3—figure supplement 2A and B). n = 5–41. (D) Progenies of a trpv6Δ8+/-; Tg (igfbp5a:GFP) intercross were injected with the indicated BAC-mCherry DNA at one-cell stage. At 4 dpf, the larvae were subjected to phospho-Akt and mCherry double staining. (E) Embryos of the indicated genotypes were raised to 3 dpf and treated with 30 µM U0126 or DMSO. At 4 dpf, the treated fish were subjected to immunostaining using an anti-phospho-Erk antibody. pErk signals were scaled as shown in Dai et al. (2014). n = 4–24. (F–I) Progenies of trpv6Δ8+/-; Tg(igfbp5a:GFP) or trpv6Δ7+/-; Tg(igfbp5a:GFP) intercrosses were raised to 3 dpf and treated with BMS-754807 (0. 3 µM), Wortmannin (0. 06 µM), Rapamycin (1 µM), U0126 (10 µM) or DMSO from 3 to 5 dpf. NaR cells in each fish were quantified followed by individual genotyping, n = 6–22.
-
Figure 3—source data 1
Excel spreadsheet containing quantitative data for Figure 3.
- https://doi.org/10.7554/eLife.48003.015
Figure 3—figure supplement 1
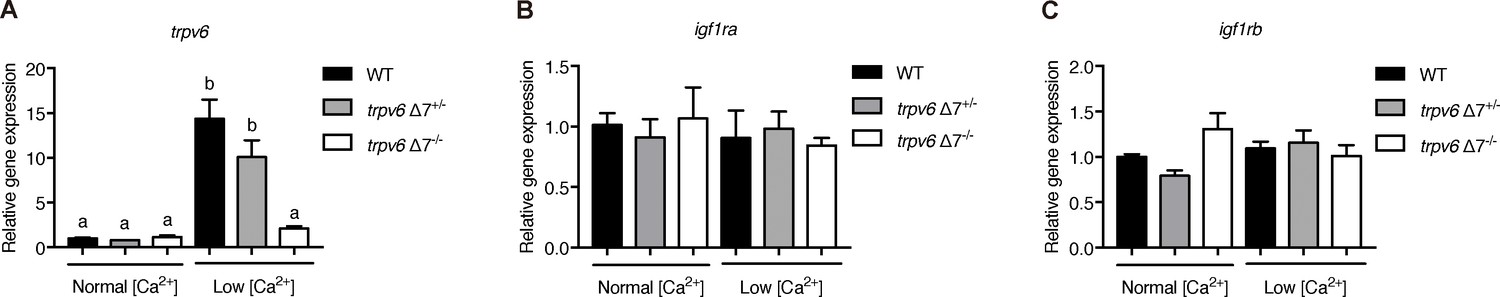
trpv6, igf1ra, igf1rb expression in trpv6-/-.
(A–C) trpv6Δ7+/-; Tg(igfbp5a:GFP) intercrosses were raised in normal or low [Ca2+] solutions from 3 to 5 dpf. Caudal fin was clipped for genotyping and 4–6 fish from the same genotype group were pooled for RNA extraction and RT-qPCR. Gene expression level was normalized to 18 s. Values shown are Mean ± SEM, n = 3.
Figure 3—figure supplement 2
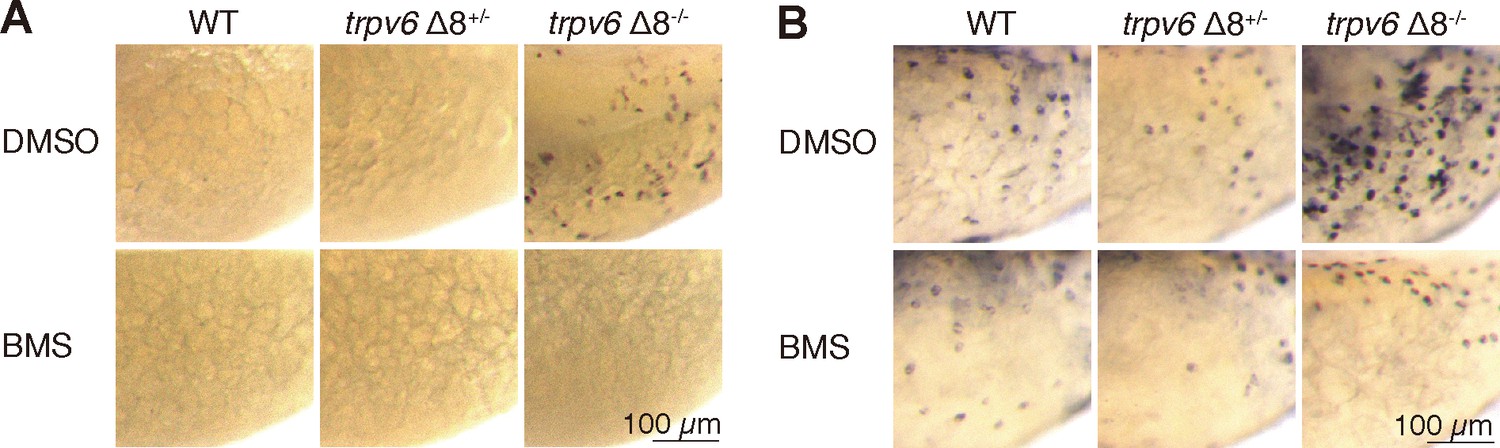
Akt-Tor pathway activation in trpv6-/-.
(A–B) trpv6Δ8+/-; Tg(igfbp5a:GFP) intercrosses were treated with 0.3 µM BMS-754807 or DMSO. At 4 dpf, the treated fish were subjected to immunostaining using an anti-phospho-Akt antibody (A) or an anti-phospho-S6 antibody (B).
Figure 3—figure supplement 3
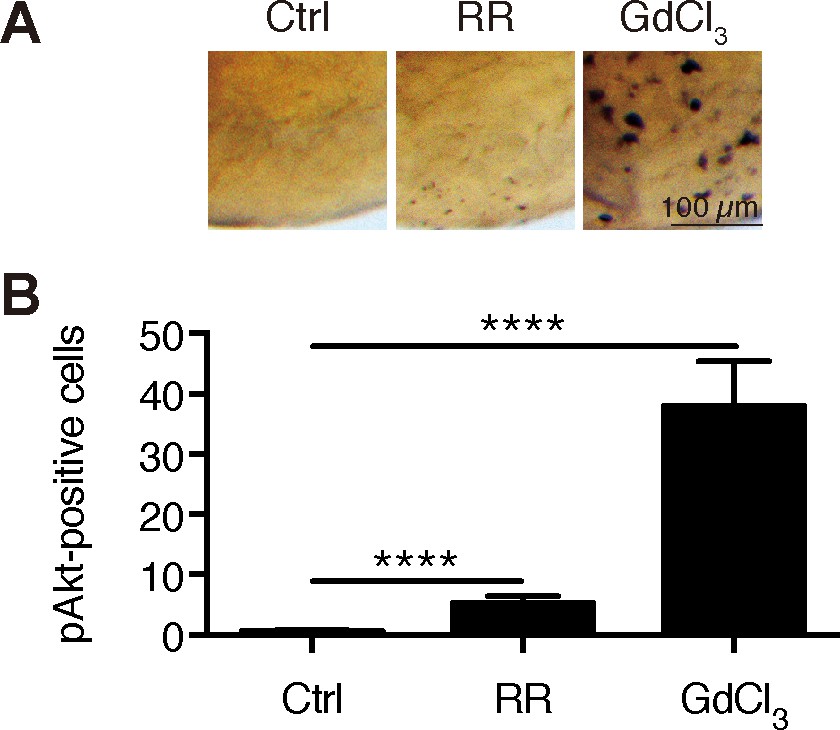
Inhibition of Trpv6 increases Akt signaling.
(A–B) Wild type fish were treated with Ruthenium Red (30 µM) or GdCl3 (100 µM) from 3 to 4 dpf and analyzed by immunostaining using an anti-phospho-Akt antibody. Representative images are shown in (A) and quantified results shown in (B). **, **** indicate p<0.01 and 0.0001 by unpaired t-test.
Figure 3—figure supplement 4
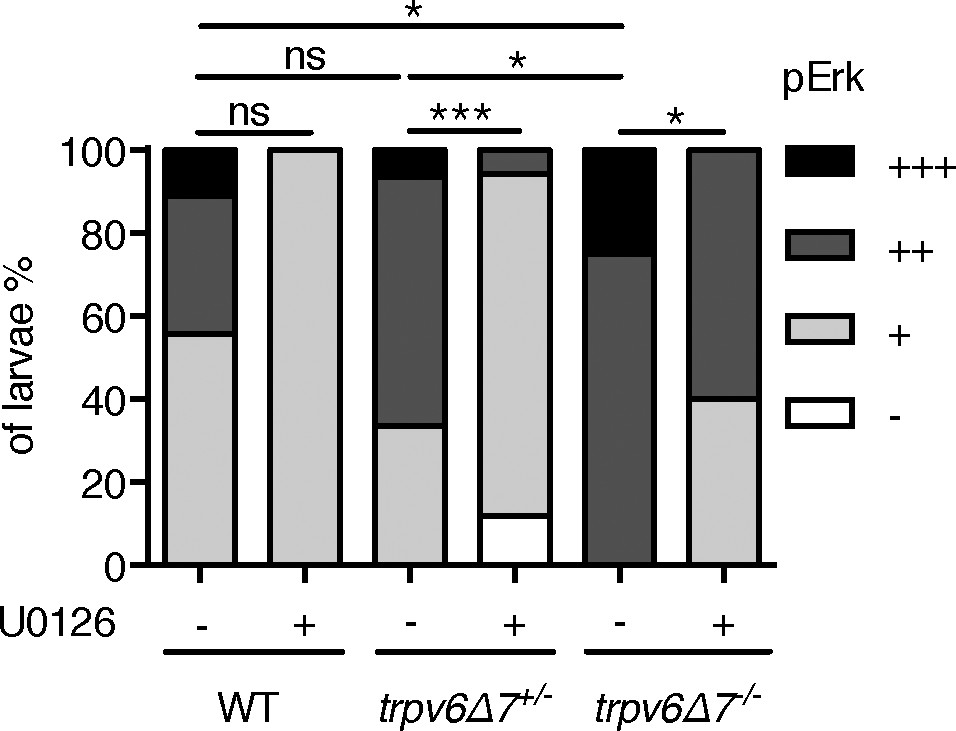
pErk level was elevated in in trpv6-/-.
(A) trpv6Δ7+/-; Tg(igfbp5a:GFP) intercrosses were treated with 30 µM U0126 or DMSO from 3 to 4 dpf and then stained for phosphorylated-Erk signals. pErk signals were scaled as shown in Dai et al. (2014) n = 5–17.
Figure 4 with 4 supplements
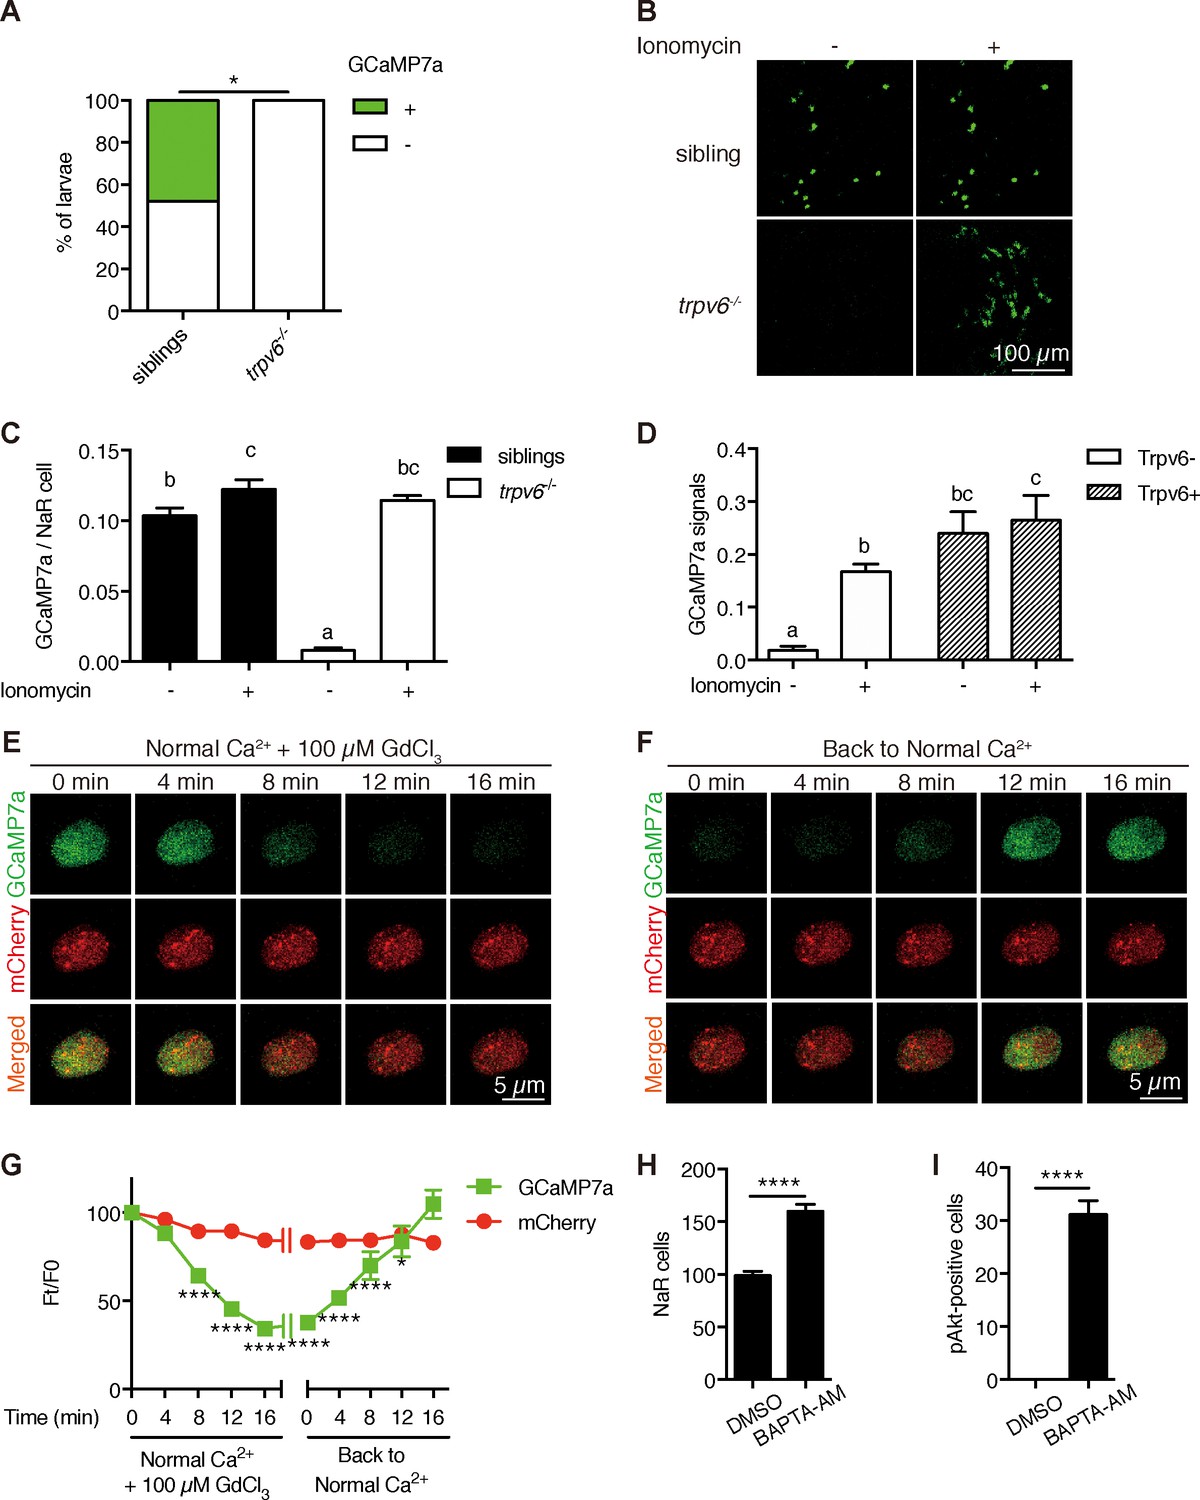
Trpv6 is constitutively open and mediates Ca2+ influx and maintain high [Ca2+]i in epithelial cells in vivo.
(A) trpv6Δ8–2+/-;Tg (igfbp5a:GCaMP7a)+/- was crossed with trpv6Δ8–2+/-. The progenies were imaged at three dpf followed by individual genotyping. Percentage of GCaMP7a-positive fish is shown. *, p<0.05 by Chi-Square test, n = 21. (B–C) Fish described in (A) were imaged before and after the addition of 7.5 µM Ionomycin + 10 mM CaCl2. Representative images are shown in (B) and the quantified results are shown in (C). n = 5–7. (D) Progenies from a trpv6Δ8–2+/-;Tg (igfbp5a:GCaMP7a)+/- and trpv6Δ8–2+/- intercross were injected with BAC (igfbp5a:Trpv6-mCherry) DNA at 1 cell stage. They were raised to three dpf. GCaMP7a signal intensity in Trpv6-mCherry-expressing cells and non-expressing NaR cells were quantified before and after the addition of 7.5 µM Ionomycin+10 mM CaCl2. n = 4. (E–G) Time-lapse images of 3 dpf Tg (igfbp5a:GCaMP7a) larvae after the addition of 100 µM GdCl3 (E) or following drug removal (F). Changes in GCaMP7a and mCherry signal intensity ratio were quantified and shown in (G). n = 5. * and **** indicate p<0.05 and<0.0001 by Two-way ANOVA followed by Dunnett's multiple comparison test. (H) Wild-type larvae were treated with BAPTA-AM (100 µM) from 3 dpf to 5 dpf. NaR cells were labeled by in situ hybridization using a trpv6 riboprobe and quantified. (I) Larvae described in (H) were stained for phosphor-Akt after 24 hr treatment. Mean ± SEM. ****, p<0.0001, unpaired t-test. n = 15–19.
-
Figure 4—source data 1
Excel spreadsheet containing quantitative data for Figure 4.
- https://doi.org/10.7554/eLife.48003.021
Figure 4—figure supplement 1
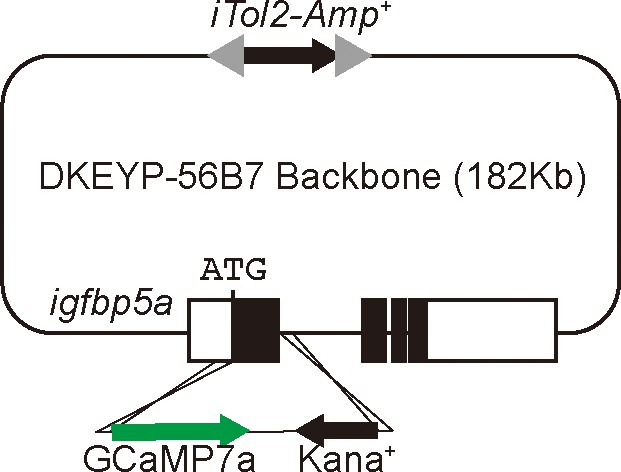
Schematic diagram showing the BAC(igfbp5a:GCaMP7a) construct.
Filled boxes indicate igfbp5a ORF and open boxes indicate its UTRs. The iTol2 cassette and GCaMP7a reporter cassette were introduced into DKEYP-56B7 by homologous recombination. The igfbp5a sequence from the start codon to the end of first exon was replaced by the GCaMP7a cassette.
Figure 4—figure supplement 2
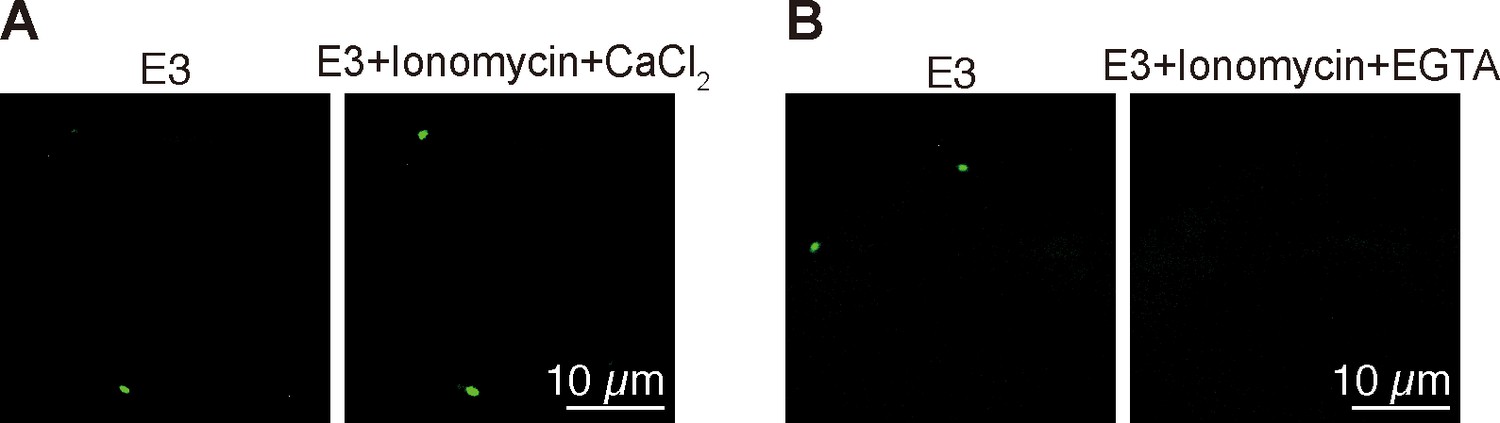
Validation of Tg(igfbp5a:GCaMP7a) fish.
(A–B) Embryos injected with BAC(igfbp5a:GCaMP7a) DNA were raised in E3 embryo solution and imaged at 3 dpf before and after the addition of the indicated chemicals (Ionomycin: 5 µM, CaCl2: 10 mM, EGTA: 10 mM).
Figure 4—figure supplement 3
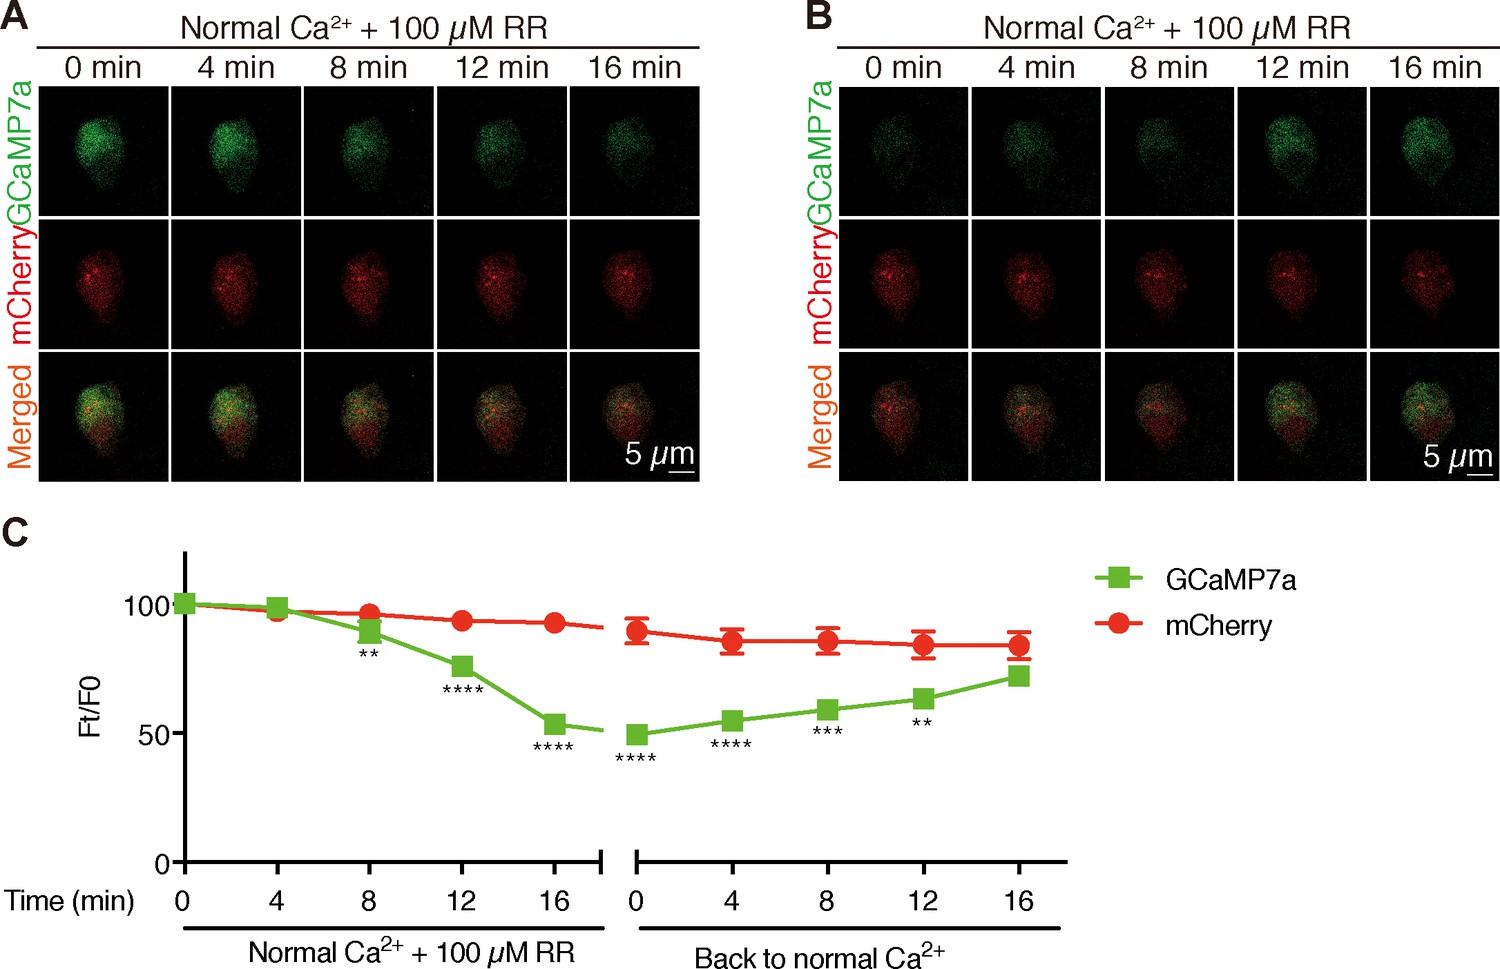
Inhibition of Trpv6 decreases [Ca2+]i in NaR cells.
(A–C) Time-lapse images of 3 dpf larvae were taken after the addition (A) and removal (B) of 100 µM Ruthenium red (RR) at the indicated time points. Fluorescence change of GCaMP7a (green) and mCherry (red) were quantified and shown in (C). Mean ± SEM, n = 8. **,***, and **** indicate p<0.01, p<0.001, p<0.0001 by multiple t-tests.
Figure 4—figure supplement 4
Inhibition of IGF1 receptor does not change [Ca2+]i in NaR cells.
Time-lapse images of 3 dpf Tg (igfbp5a:GCaMP7a) larvae at the indicated time points after adding 0.3 µM BMS-754807. Changes in GCaMP7a (green) and mCherry (red) signal intensity were quantified. Representative images are shown in (A) and quantified results are shown in (B). Mean ± SEM, n = 3. No significance was found by two-way ANOVA followed by Dunnett's multiple comparison test.
Figure 5 with 2 supplements
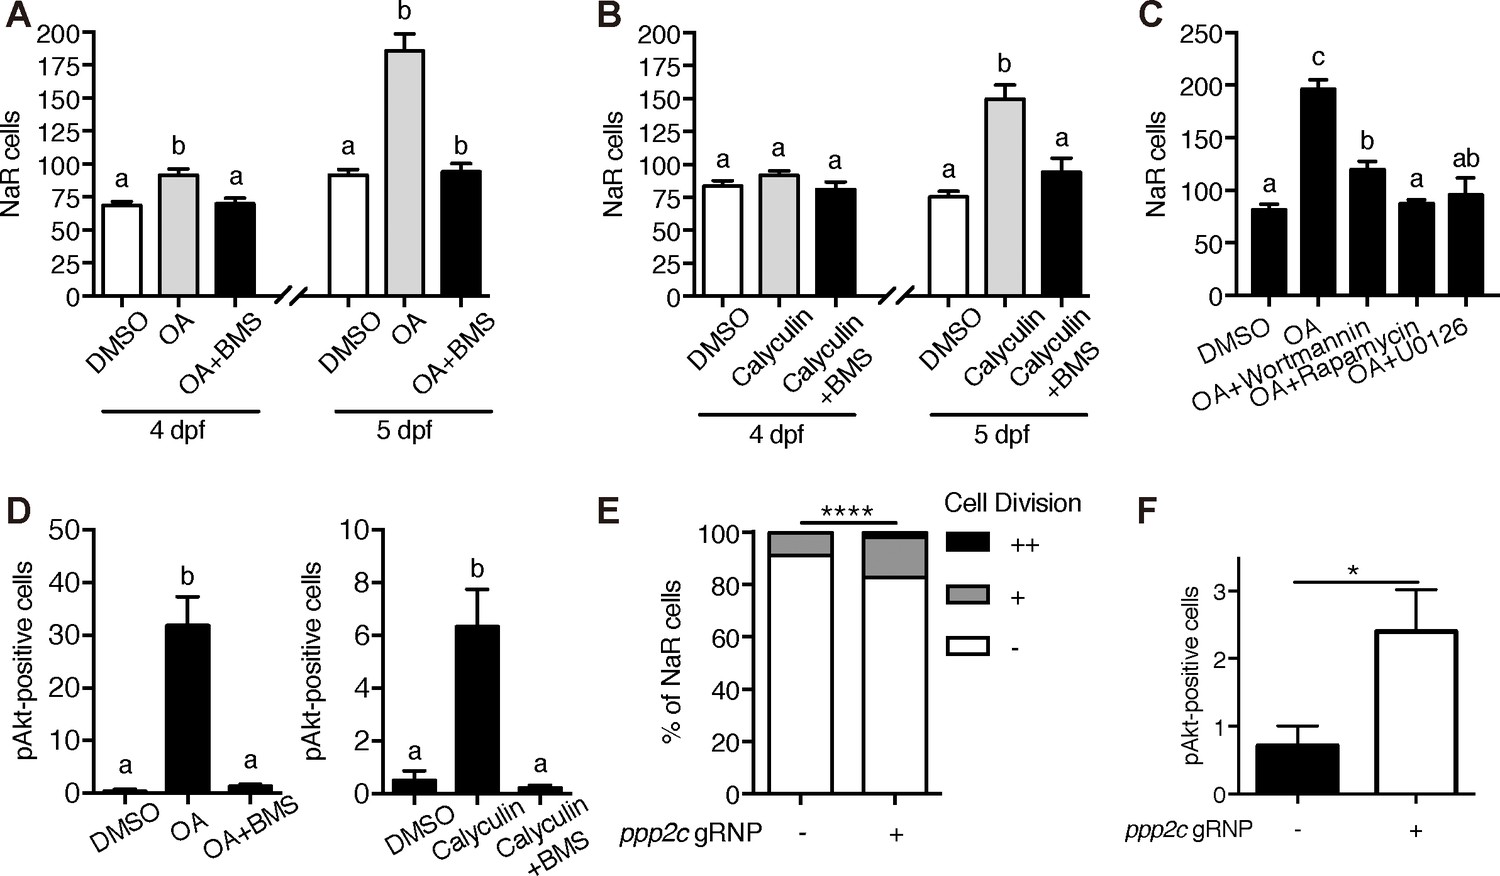
PP2A is a downstream effector of Trpv6.
(A–B) Tg(igfbp5a:GFP) embryos were treated with 1 µM Okadaic acid (OA) or 0.1 µM Calyculin A in the presence or absence of 0.3 µM BMS-754807 from 3 dpf. NaR cells were quantified at 4 and 5 dpf. Data shown are n = 10–38. (C) Tg(igfbp5a:GFP) embryos were treated with 1 µM Okadaic acid (OA) in the presence or absence of Wortmannin (0. 06 µM), Rapamycin (1 µM), U0126 (10 µM) or DMSO from 3 to 5 dpf. NaR cells were quantified at 4 and 5 dpf. Data shown are n = 16–19. (D) Wild-type larvae were treated with 1 µM Okadaic acid or 0.1 µM Calyculin A in the presence or absence of 0.3 µM BMS-754807 from 3 dpf to 4 dpf. They were analyzed by immunostaining for phospho-Akt. n = 9–16. (E) Tg(igfbp5a:GFP) embryos were injected with gRNAs targeting three ppp2c genes and Cas9 protein at one-cell stage. They were raised to five dpf. NaR cell division was quantified following a published scoring system (Liu et al., 2018). n = 24–28. ****, p<0.0001 by Chi-Square test. (F) The embryos treated as in (E) were raised to 4 dpf and analyzed by immunostaining for phospho-Akt signal. n = 20–21. *, p<0.05, unpaired t-test.
-
Figure 5—source data 1
Excel spreadsheet containing quantitative data for Figure 5.
- https://doi.org/10.7554/eLife.48003.027
Figure 5—figure supplement 1
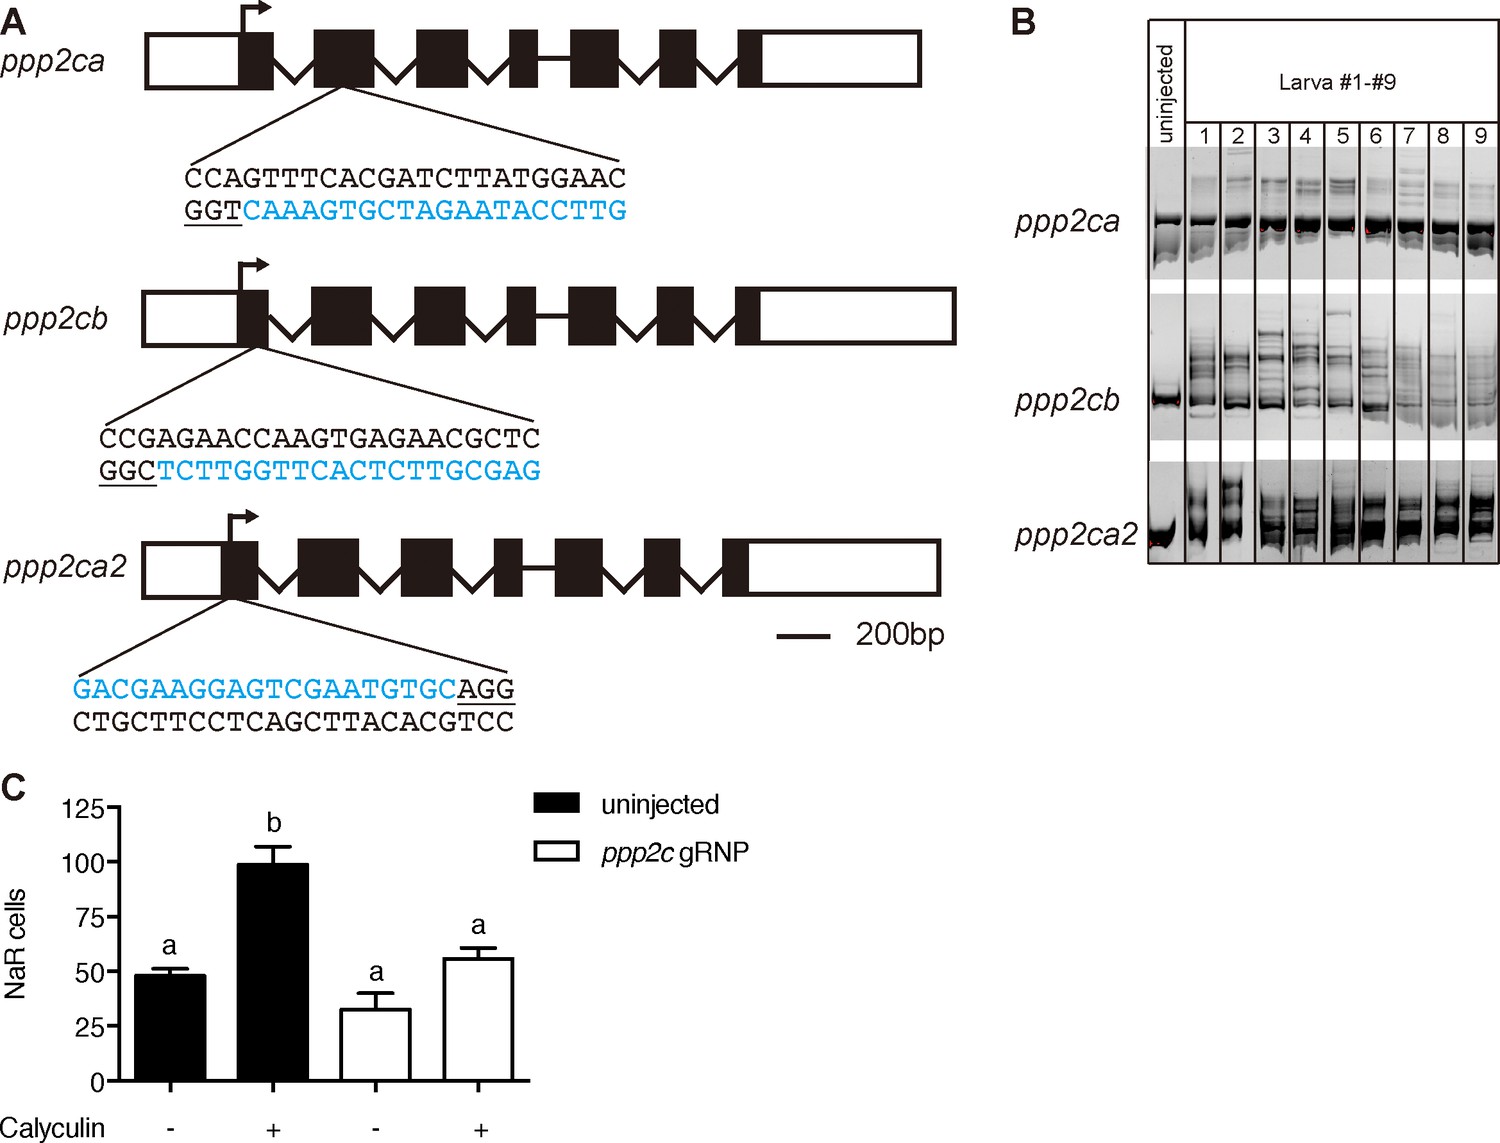
Transient knockdown of pp2a catalytic subunit genes.
(A) Schematic diagram and guide RNA targeting sites. The target sites are labeled by blue letters and the PAM motif is underlined. (B) Embryos injected with gRNAs and Cas9 protein were raised to 1 dpf. Each of them was lysed and analyzed by PCR followed by hetero-duplex motility assay. (C) Embryos injected with gRNAs and Cas9 protein were raised to 3 dpf and treated with Calyculin A or vehicle. Values are Mean ± SEM, n = 7–15.
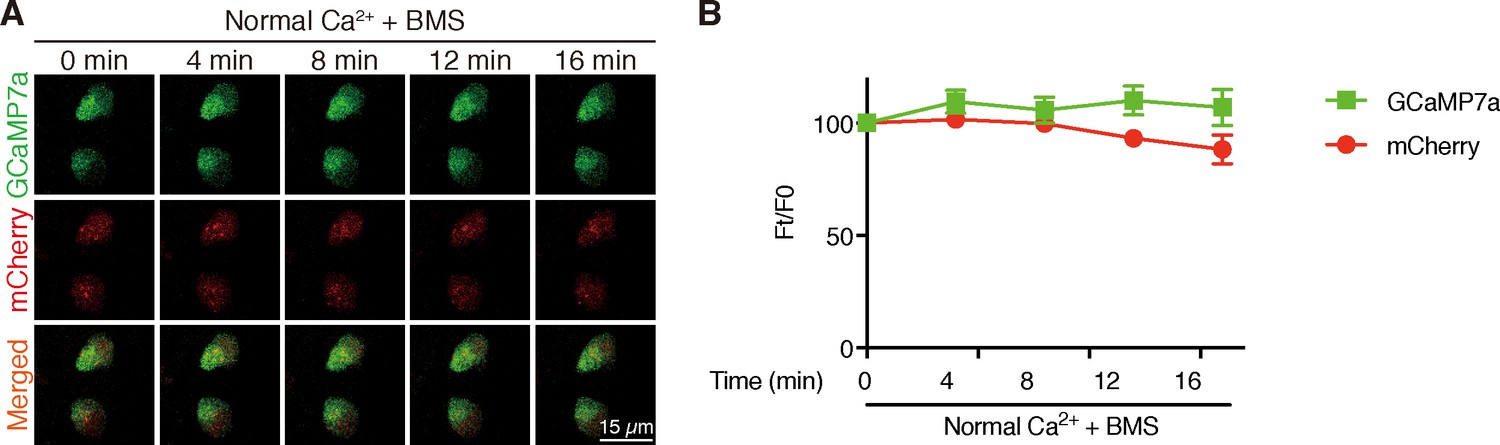
Figure 5—figure supplement 2
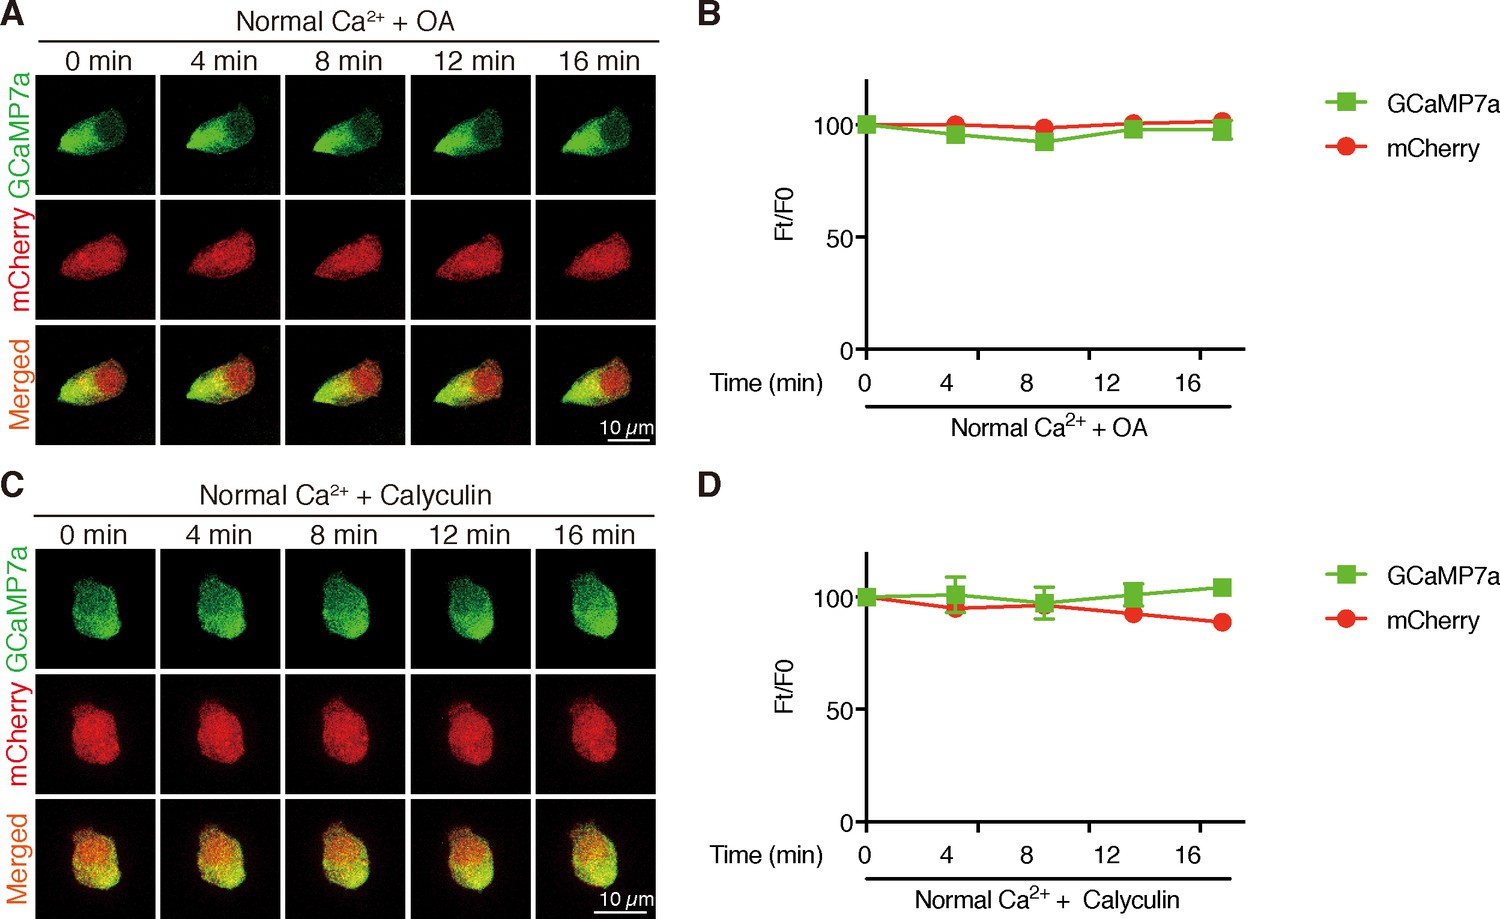
Inhibition of PP2A does not change [Ca2+]i in NaR cells.
Time-lapse images of 3 dpf Tg (igfbp5a:GCaMP7a) larvae at the indicated time points after adding 1 µM Okadaic acid (OA) (A, B) or 0.1 µM Calyculin A (C, D). Changes in GCaMP7a (green) and mCherry (red) signal intensity were quantified. Representative images are shown in (A, C) and quantified results are shown in (B, D). Mean ± SEM, n = 3. No significance was found by two-way ANOVA followed by Dunnett's multiple comparison test.
Figure 6 with 4 supplements

Knockdown and inhibition of TRPV6 and PP2A increases human colon carcinoma cell proliferation.
(A) LoVo cells transfected with scrambled siRNA or TRPV6 targeting siRNA were synchronized by serum starvation followed by serum re-stimulation. Cells were analyzed by flow cytometry analysis after propidium iodide staining. Percentage of S-phase cells are calculated and shown. Mean ± SEM, n = 3. **, p<0.01 by unpaired t-test. (B) LoVo cells were synchronized by serum starvation. They were re-stimulated with 2% FBS medium containing Ruthenium Red (RR, 100 µM), GdCl3 (100 µM), BAPTA-AM (100 µM), Okadaic acid (OA, 20 nM) or DMSO for 48 hr and analyzed by flow cytometry analysis after propidium iodide staining. Percentage of S-phase cells are shown. Mean ± SEM, n = 3. (C) LoVo cells transfected with the indicated DN-PP2A constructs were synchronized by serum starvation followed by serum re-stimulation. Cells were analyzed by flow cytometry analysis after propidium iodide staining. Percentage of S-phase cells are calculated and shown. Mean ± SEM, n = 3. ****, ***, ** indicate P<0.0001, P<0.001, P<0.01 by one-way ANOVA followed by Tukey’s multiple comparison test in (B) and (C). (D) Schematic diagram of the proposed model. See text for details.
-
Figure 6—source data 1
Excel spreadsheet containing quantitative data for Figure 6.
- https://doi.org/10.7554/eLife.48003.033
Figure 6—figure supplement 1
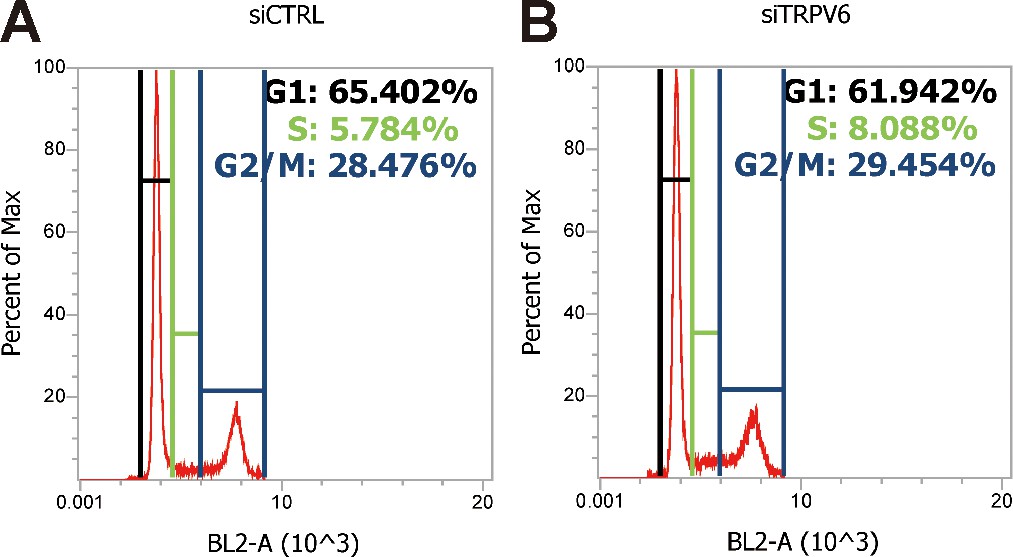
Cell cycle analysis profiles for experiments shown in Figure 6A.
The PI fluorescence intensity is given in arbitrary units (a.u.) on the X-axis, and the Y-axis indicates cell counts normalized to percent of the max as measured by flow cytometry.
Figure 6—figure supplement 2
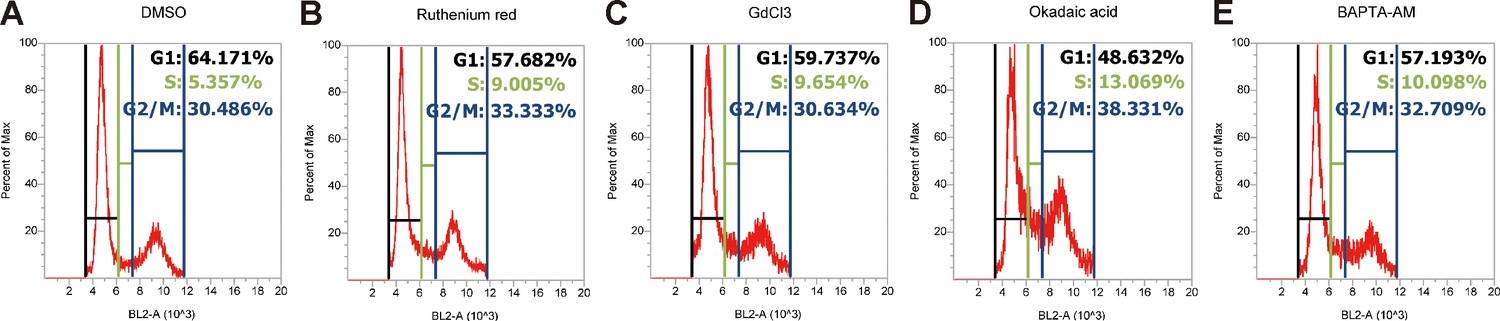
Cell cycle analysis profiles for inhibitor experiments shown in Figure 6B.
https://doi.org/10.7554/eLife.48003.030
Figure 6—figure supplement 3
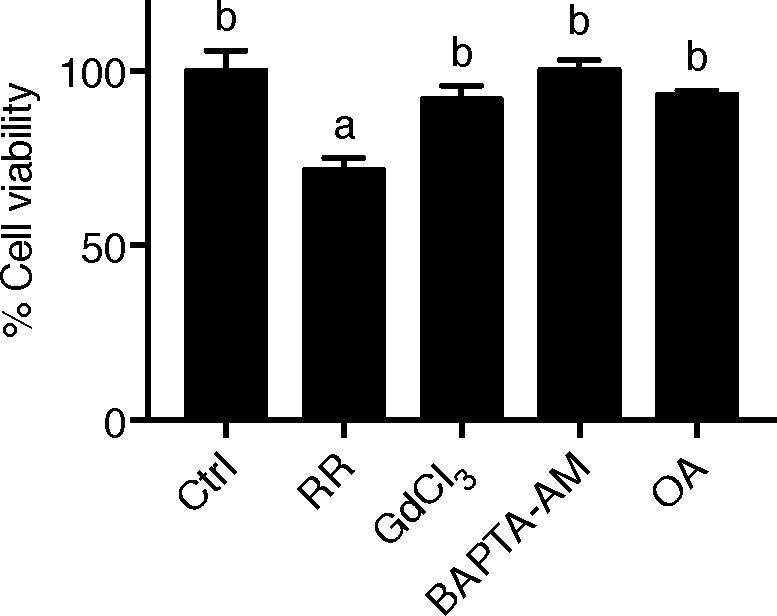
LoVo cell viability.
LoVo cells were synchronized by serum starvation. They were re-stimulated with 2% FBS medium containing Ruthenium Red (RR, 100 µM), GdCl3 (100 µM), BAPTA-AM (100 µM), Okadaic acid (OA, 20 nM) or DMSO for 48 hr and analyzed by MTT assays. Mean ± SEM, n = 3.
Figure 6—figure supplement 4
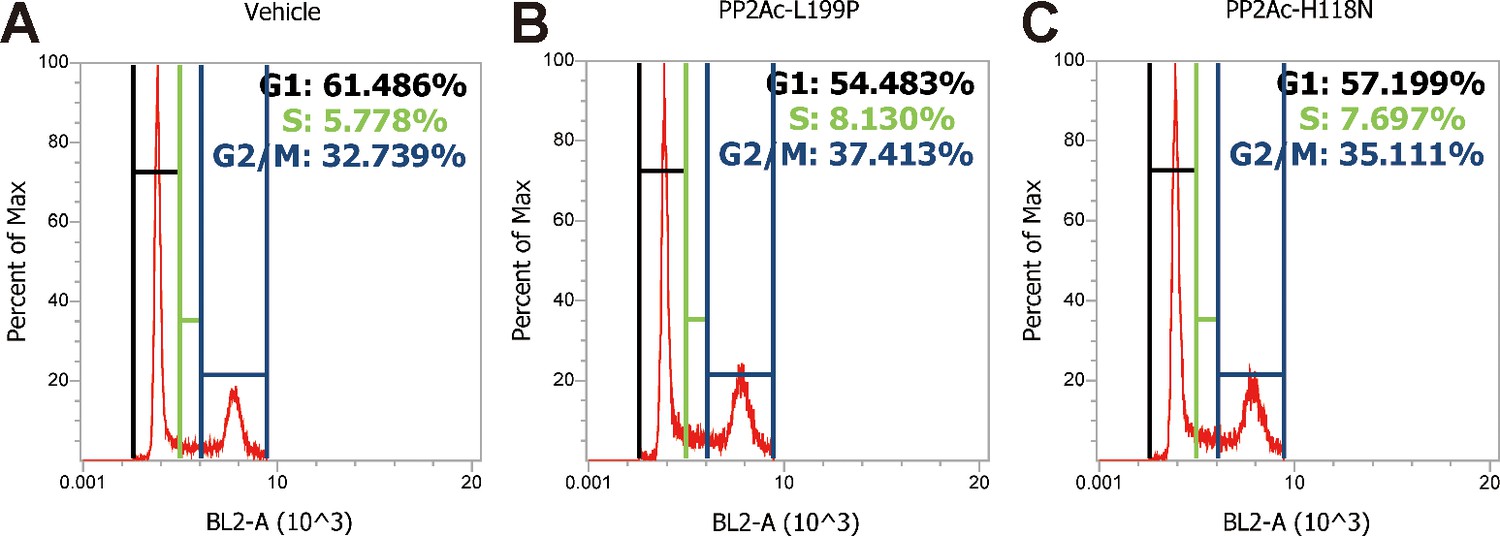
Cell cycle analysis profiles for experiments shown in Figure 6C.
https://doi.org/10.7554/eLife.48003.032Videos
Video 1
Normal Ca2+ + GdCl3.
https://doi.org/10.7554/eLife.48003.022
Video 2
Back to Normal Ca2+.
https://doi.org/10.7554/eLife.48003.023Tables
Key resources table
| Reagent type (species) or resource | Designation | Source or reference | Identifiers | Additional information |
|---|---|---|---|---|
| Strain, strain background (Danio rerio) | Tg(igfbp5a:GFP) | Pubmed ID: 28515443 | ZFIN ID: ZDB-TGCONSTRCT-170830–2 | |
| Strain, strain background (Danio rerio) | trpv6-/-; Tg(igfbp5a:GFP) | This paper | CRISPR/Cas9-mediated knockout | |
| Strain, strain background (Danio rerio) | Tg(igfbp5a:GCaMP7a) | This paper | Tol2-mediated transgenesis | |
| Strain, strain background (Danio rerio) | trpv6-/- | This paper | CRISPR/Cas9-mediated knockout | |
| Strain, strain background (Danio rerio) | trpv6-/-; Tg(igfbp5a:GCaMP7a) | This paper | Cross trpv6-/- with Tg (igfbp5a:GCaMP7a) | |
| Genetic reagent (Homo sapiens) | Human TRPV6 siRNA | Pubmed ID: 19270724 | GACUCUCUAUGACCUCACA | |
| Genetic reagent | Mission siRNA Universal Negative Control #1 | Sigma | Catalog no.: SIC001-10nmol | |
| Cell line (Homo sapiens) | LoVo | ATCC | RRID: CVCL_039 | |
| Cell line (Homo sapiens) | HEK293 | ATCC | RRID: CVCL_0045 | |
| Antibody | Phospho-Akt (Ser473) (Rabbit monoclonal) | Cell Signaling Technology | RRID: AB_2315049 | 1:200 |
| Antibody | Phospho-p44/42 MAPK (Erk1/2) (Thr202/Tyr204) (Rabbit monoclonal) | Cell Signaling Technology | RRID: AB_2315112 | 1:200 |
| Antibody | Phospho-S6 Ribosomal Protein (Ser235/236) (Rabbit monoclonal) | Cell Signaling Technology | RRID: AB_2181037 | 1:200 |
| Antibody | Peroxidase-conjugated AffiniPure Donkey Anti-Rabbit IgG (H+L) (Donkey polyclonal) | Jackson ImmunoResearch Laboratories | RRID: AB_10015282 | 1:400 |
| Antibody | Cy3 AffiniPure Goat Anti-Rabbit IgG (H+L) (Goat polyclonal) | Jackson ImmunoResearch Laboratories | RRID: AB_2338006 | 1:300 |
| Antibody | Anti-digoxigenin POD-conjugate (Sheep polyclonal) | Roche | RRID: AB_51450 | 1:500 |
| Recombinant DNA reagent | PP2Ac-L199P | Pubmed ID: 16224536 | ||
| Recombinant DNA reagent | PP2Ac-H118N | Pubmed ID: 16224536 | ||
| Chemical compound, drug | BMS-754807 | Active Biochemicals Co. | Catalog no.: A-1013 | |
| Chemical compound, drug | Wortmannin | Cell Signaling Technology | Catalog no.: 9951 | |
| Chemical compound, drug | Rapamycin | Calbiochem | Catalog no.: 553210 | |
| Chemical compound, drug | U0126 | Cell Signaling Technology | Catalog no.: 9903 | |
| Chemical compound, drug | Okadaic acid | Santa Cruz Biotechnology | Catalog no.: sc3513 | |
| Chemical compound, drug | Calyculin A | Alonmone | Catalog no.: C-100 | |
| Chemical compound, drug | Gadolinium (III) chloride | Sigma-Aldrich | Catalog no.: 439770 | |
| Chemical compound, drug | Ruthenium red | Sigma-Aldrich | Catalog no.: R2751 | |
| Chemical compound, drug | Alizarin red S | Sigma-Aldrich | Catalog no.: A5533 | |
| Chemical compound, drug | Propidium iodide | Sigma-Aldrich | Catalog no.: P4170 | |
| Chemical compound, drug | Fura-2, AM, cell permeant | Invitrogen | Catalog no.: F1221 | |
| Peptide, recombinant protein | Cas9 protein with NLS | PNA Bio | Catalog no.: CP01 | |
| Software, algorithm | GraphPad Prism | RRID: SCR_002798 |
Additional files
-
Transparent reporting form
- https://doi.org/10.7554/eLife.48003.034
Download links
A two-part list of links to download the article, or parts of the article, in various formats.
Downloads (link to download the article as PDF)
Open citations (links to open the citations from this article in various online reference manager services)
Cite this article (links to download the citations from this article in formats compatible with various reference manager tools)
Cell-autonomous regulation of epithelial cell quiescence by calcium channel Trpv6
eLife 8:e48003.
https://doi.org/10.7554/eLife.48003


