A scalable platform for the development of cell-type-specific viral drivers
- Harvard Medical School, United States
Figures
Figure 1 with 2 supplements
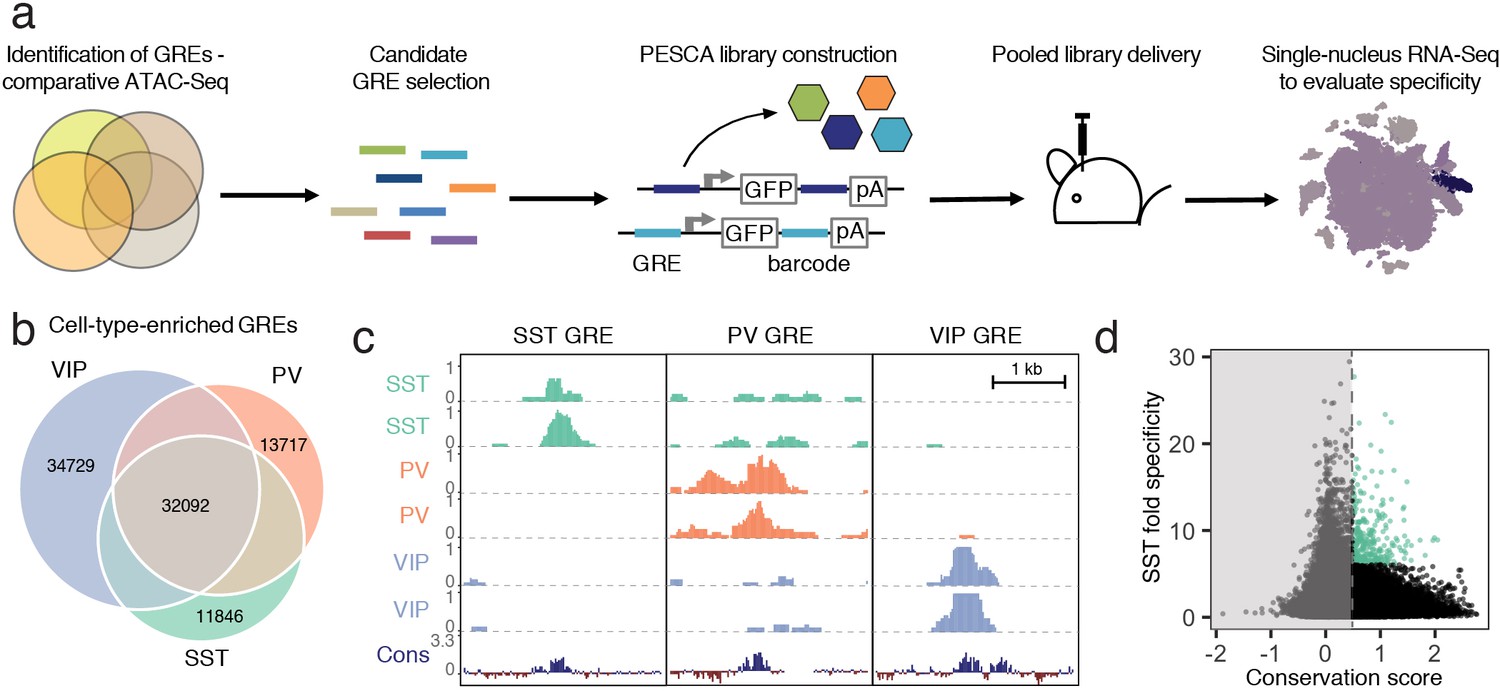
Experimental strategy and GRE selection.
(a) Paralleled Enhancer Single Cell Assay (PESCA). Comparative ATAC-Seq is used to identify candidate GREs. A library of gene regulatory elements (GREs) is inserted upstream of a minimal promoter-driven GFP. The viral barcode sequence is inserted in the 3’UTR, and the vector packaged into rAAVs. Following en masse injection of the rAAV library, the specificity of the constituent GREs for various cell types in vivo is determined by single-nucleus RNA sequencing, measuring expression of the barcoded transcripts in tens of thousands of individual cells in the target tissue. Finally, bioinformatic analysis determines the most cell-type-specific barcode-associated rAAV-GRE-GFP constructs. pA = polyA tail. (b) Area-proportional Venn diagram of the number of putative GREs identified by ATAC-Seq of purified PV, SST, and VIP nuclei. Overlapping areas indicate shared putative GREs. Non-overlapping areas represent GREs that are unique to a single cell type. (c) Representative ATAC-seq genome browser traces of a putative GRE enriched in SST, PV, or VIP interneurons (normalized counts per location). Sequence conservation across the Placental mammalian clade is also shown. (d) Putative GREs (n = 323,369) are plotted based on average sequence conservation (phyloP, 60 placental mammals) and SST-specificity (ratio of the average ATAC-Seq signal intensity between SST samples and non-SST samples). Dashed vertical line indicates the minimal conservation value cutoff (0.5). Green coloring indicates the 287 most SST-specific GREs selected for PESCA screening.
Figure 1—figure supplement 1
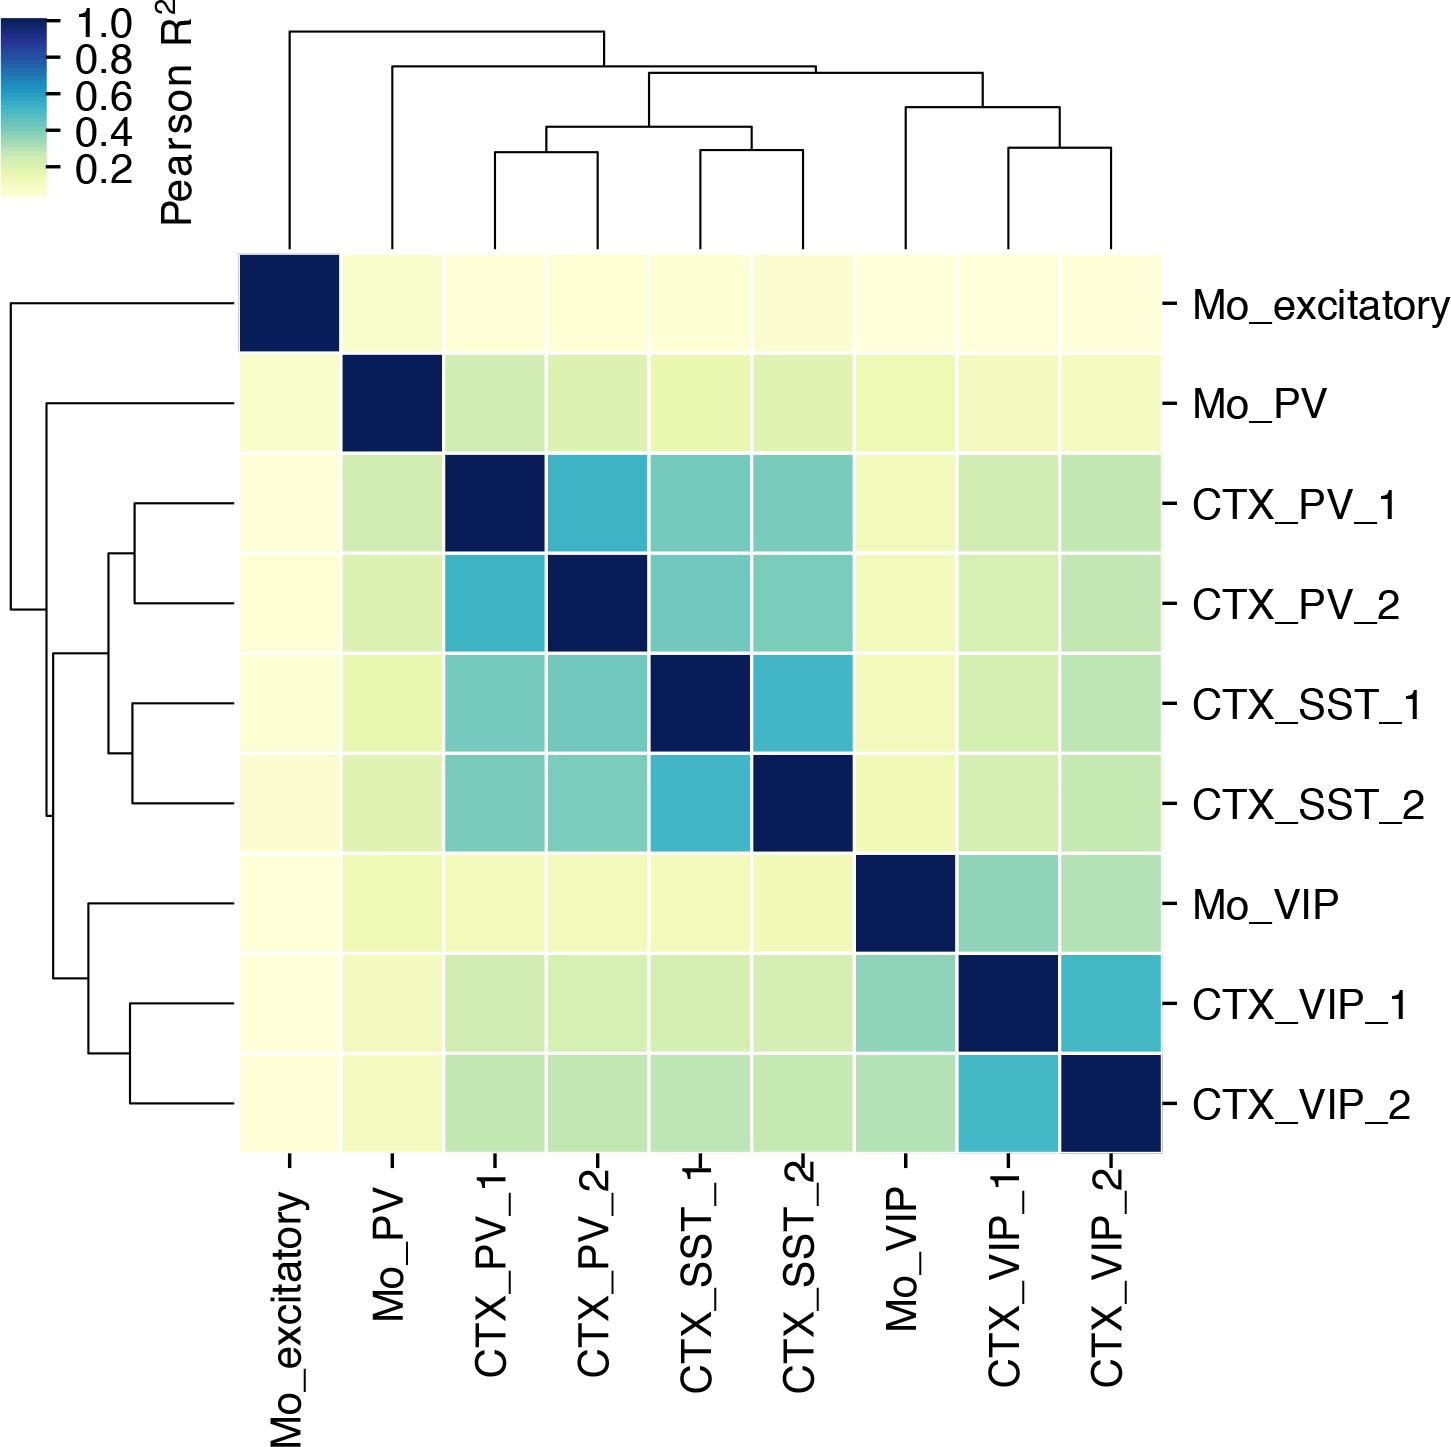
Hierarchical clustering of the Mo et al. (2015) and our own ATAC-seq datasets.
Any ATAC-seq peak identified in any of the PV, SST, or VIP ATAC-seq datasets of this manuscript was given a score of 0 or one depending on whether any reads fell into that peak for a given sample. We used a binary score rather than normalized read counts to account for batch effects (due to differences in sample preparation, processing, and sequencing depth) between our and Mo et al.’s datasets. The pairwise correlation coefficient of these binary vectors was then calculated for each possible combination of samples shown, and hierarchically clustered using (R^2) as the distance metric.
Figure 1—figure supplement 2

Identification of conserved GREs.
Left: For each of the 323,369 reference genomic regions that were identified by ATAC-Seq, a region of the same size was chosen exactly 100,000 bases away from the GRE. The mean sequence conservation score (phyloP, 60 placental mammals) for each of these GRE-distal regions was calculated and plotted. A vertical line at the conservation score of 0.5 indicates the 95th percentile of that distribution and was chosen as a minimal conservation score needed to consider a GRE sequence as conserved. Right: The mean sequence conservation score (phyloP, 60 placental mammals) for each of the 323,369 GREs was calculated and plotted. A vertical line indicates the minimal conservation score of 0.5. 36,215 GREs (11%) had a mean conservation greater than 0.5 and were deemed conserved.
Figure 2 with 6 supplements
PESCA screen identifies GREs highly enriched for SST+ interneurons.
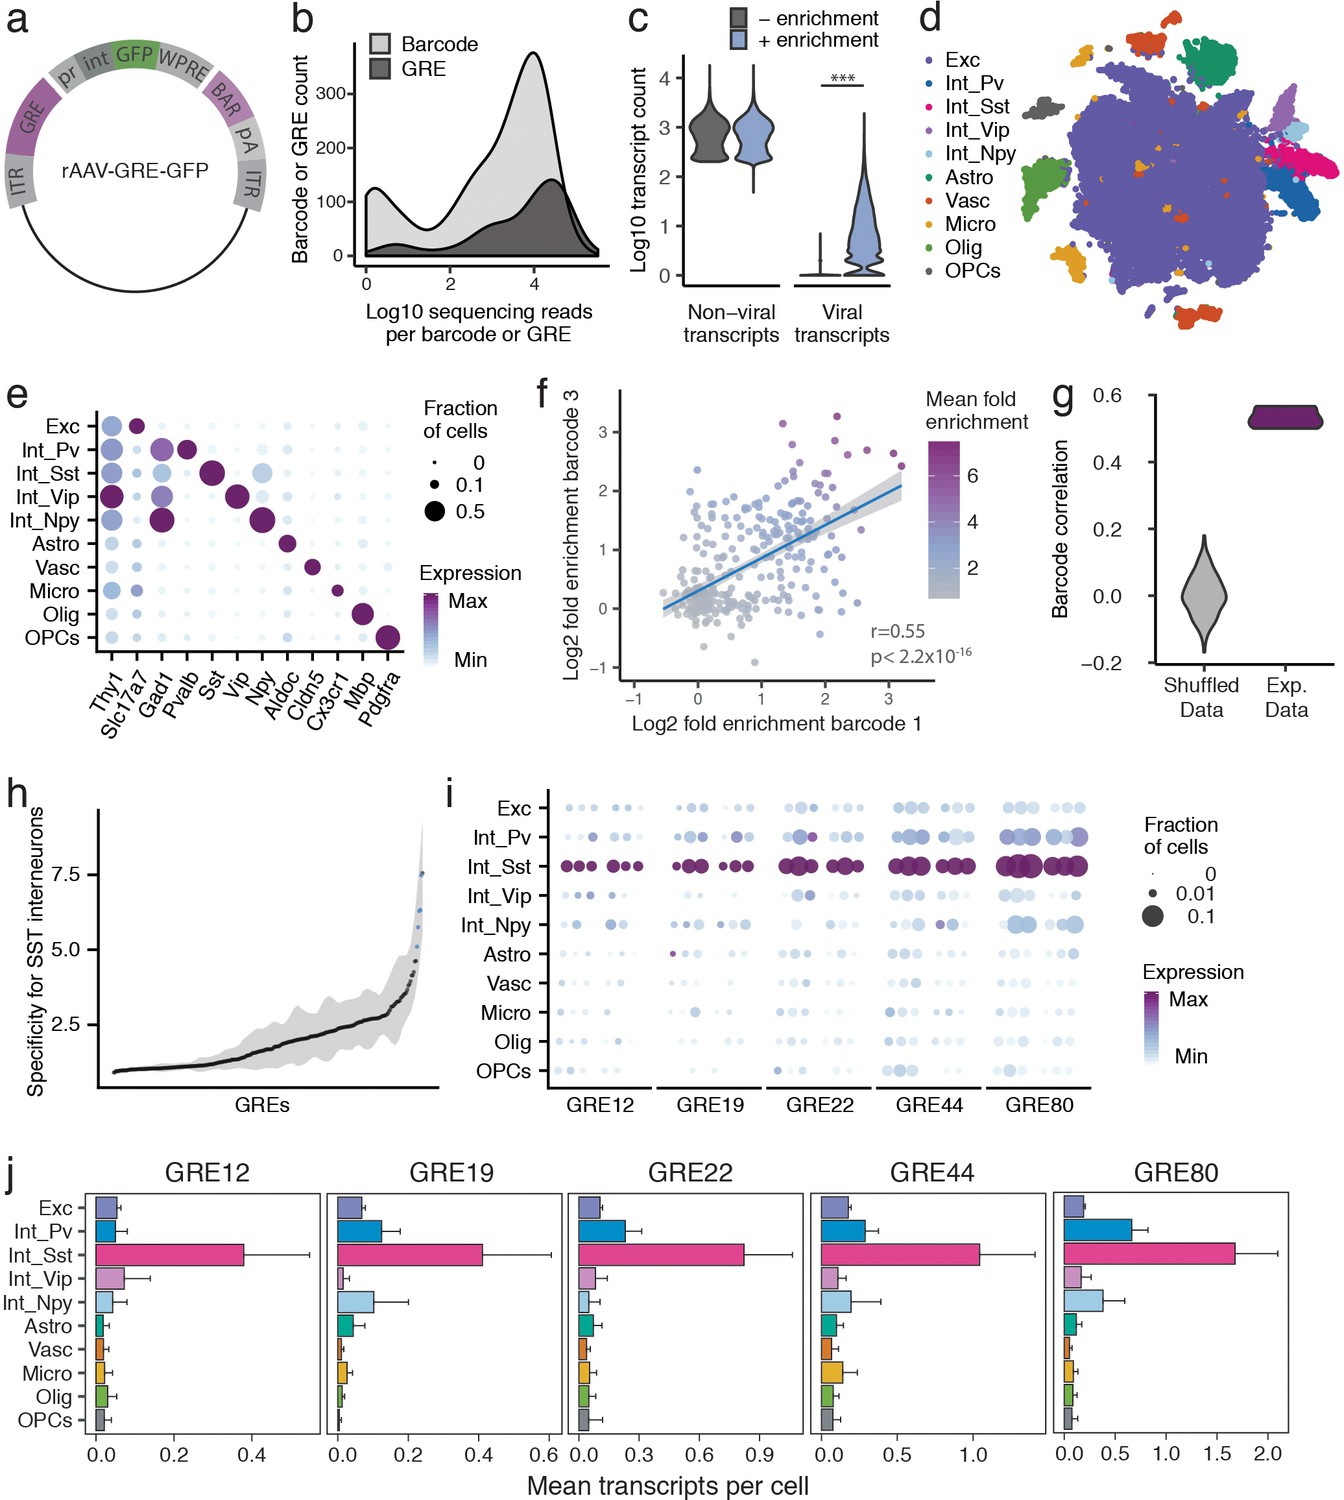
(a) PESCA library plasmid map. ITR, inverted terminal repeats; GRE, gene regulatory element; pr, HBB minimal promoter; int, intron; GFP, green fluorescent protein; WPRE, Woodchuck Hepatitis Virus post-transcriptional regulatory element; BAR, 10-mer sequence barcode associated with each GRE; pA, polyadenylation signal. (b) Library complexity plotted as distribution of the abundance of the 861 barcodes and 287 GREs in the AAV library. Barcodes and GREs were binned by number of sequencing reads attributed to each barcode or GRE within the library. (c) Transcript count per nucleus (n = 32,335 nuclei). Sequencing libraries were prepared with or without PCR-enrichment for viral transcripts. PCR enrichment resulted in a 382-fold increase in the number of recovered viral transcripts (p=0, Mann-Whitney U-test, two-sided) to an average of 15.6 unique viral transcripts per nucleus. Displayed as Log10(Count+1). (d) t-SNE plot of 32,335 nuclei from V1 cortex of two animals. Colors denote main cell types: Exc (Excitatory neurons), Pv (PV Interneurons), Sst (SST Interneurons), Vip (VIP interneurons), Npy (NPY Interneurons), Astro (Astrocytes), Vasc (Vascular-associated cells), Micro (Microglia), Olig (Oligodendrocytes), OPCs (Oligodendrocyte precursor cells). (e) Marker gene expression across cell types. Color denotes mean expression across all nuclei normalized to the highest mean across cell types. Size represents the fraction of nuclei in which the marker gene was detected. (f) Dot plot with each dot representing one GRE (n = 287). The values on each axis represent the Log2 SST fold-enrichment calculated for each GRE based on two of the three barcodes paired with that GRE - barcode one on the x-axis, and barcode three on the y-axis. Blue line indicates linear fit with 95% confidence intervals (shaded) (r = 0.55, p<2.2 × 10⁻¹⁶, Pearson’s correlation). Color gradient indicates the average enrichment between the two barcodes. (g) Pairwise Pearson correlation between the enrichment values calculated from three sets of barcodes associated with 287 GREs for experimental data (Exp. Data, r = 0.52 ± 0.05, p<2.2 × 10⁻¹⁶, Pearson’s correlation) and after random shuffling of enrichment values (Shuffled Data, r = 0 ± 0.06). (h) GREs ranked by average barcode expression specificity for SST interneurons across three barcodes. Shading indicates the minimal and maximal specificity calculated by analyzing each of the three barcodes associated with a GRE. Blue indicates the five top hits that also passed a statistical test for SST interneuron enrichment (FDR-corrected q < 0.01). (i) Expression of the top five hits: GRE12, GRE19, GRE22, GRE44, GRE80. For each GRE, expression values are split into two animals, and, for each animal, into the three barcodes associated with that GRE. Color denotes mean expression across all nuclei normalized to the highest mean across cell types. Size represents the fraction of nuclei in which the marker gene was detected. (j) Mean expression of GRE12, GRE19, GRE22, GRE44, and GRE80 across cell types. Error bars, s.e.m.
Figure 2—figure supplement 1
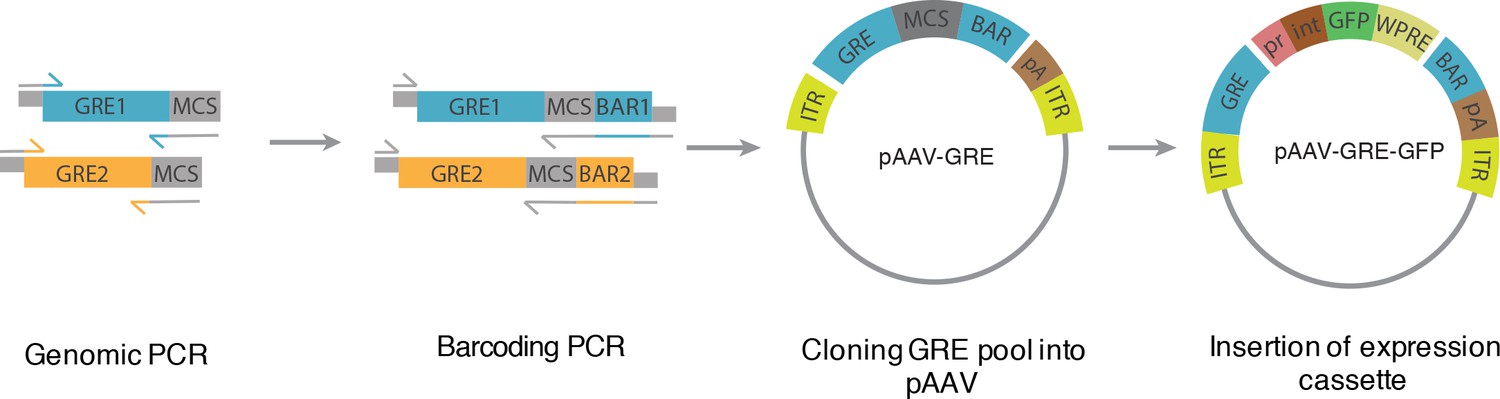
Schema for PESCA library construction.
PCR is used to amplify GREs from the genomic DNA and to introduce appropriate restriction enzyme sites and, subsequently, a 10 bp barcode sequence. Each GRE is amplified three times using three different barcode sequences. The amplified GREs are pooled and cloned into an AAV vector. Restriction enzyme sites between the GRE and the barcode are used to insert an expression cassette consisting of a minimal promoter, intron, GFP and WPRE sequences. See Materials and methods for details.
Figure 2—figure supplement 2

UMI, gene and GRE detection metrics.
(a) Dot plot of the number of unique molecular identifiers (UMIs) and the number of genes for each nucleus that was analyzed. (b) Plot showing the density distribution of number of UMIs and genes per nucleus. (c) Distribution of the number of unique barcodes and unique GREs detected per nucleus, displayed as Log10(Count+1). (d) t-SNE plot of 32,335 nuclei from V1 cortex of two injected animals. Color gradient denotes number of unique viral transcripts per nucleus displayed as Log10(Count+1). (e) Dot plot of the number of viral genomes in the AAV library and the number of infected cells recovered after snRNA-Seq. Each dot represents one barcode (n = 861). Line of linear fit with 95% confidence intervals (shaded). Pearson correlation r = 0.9, p<2.2 × 10⁻¹⁶.
Figure 2—figure supplement 3
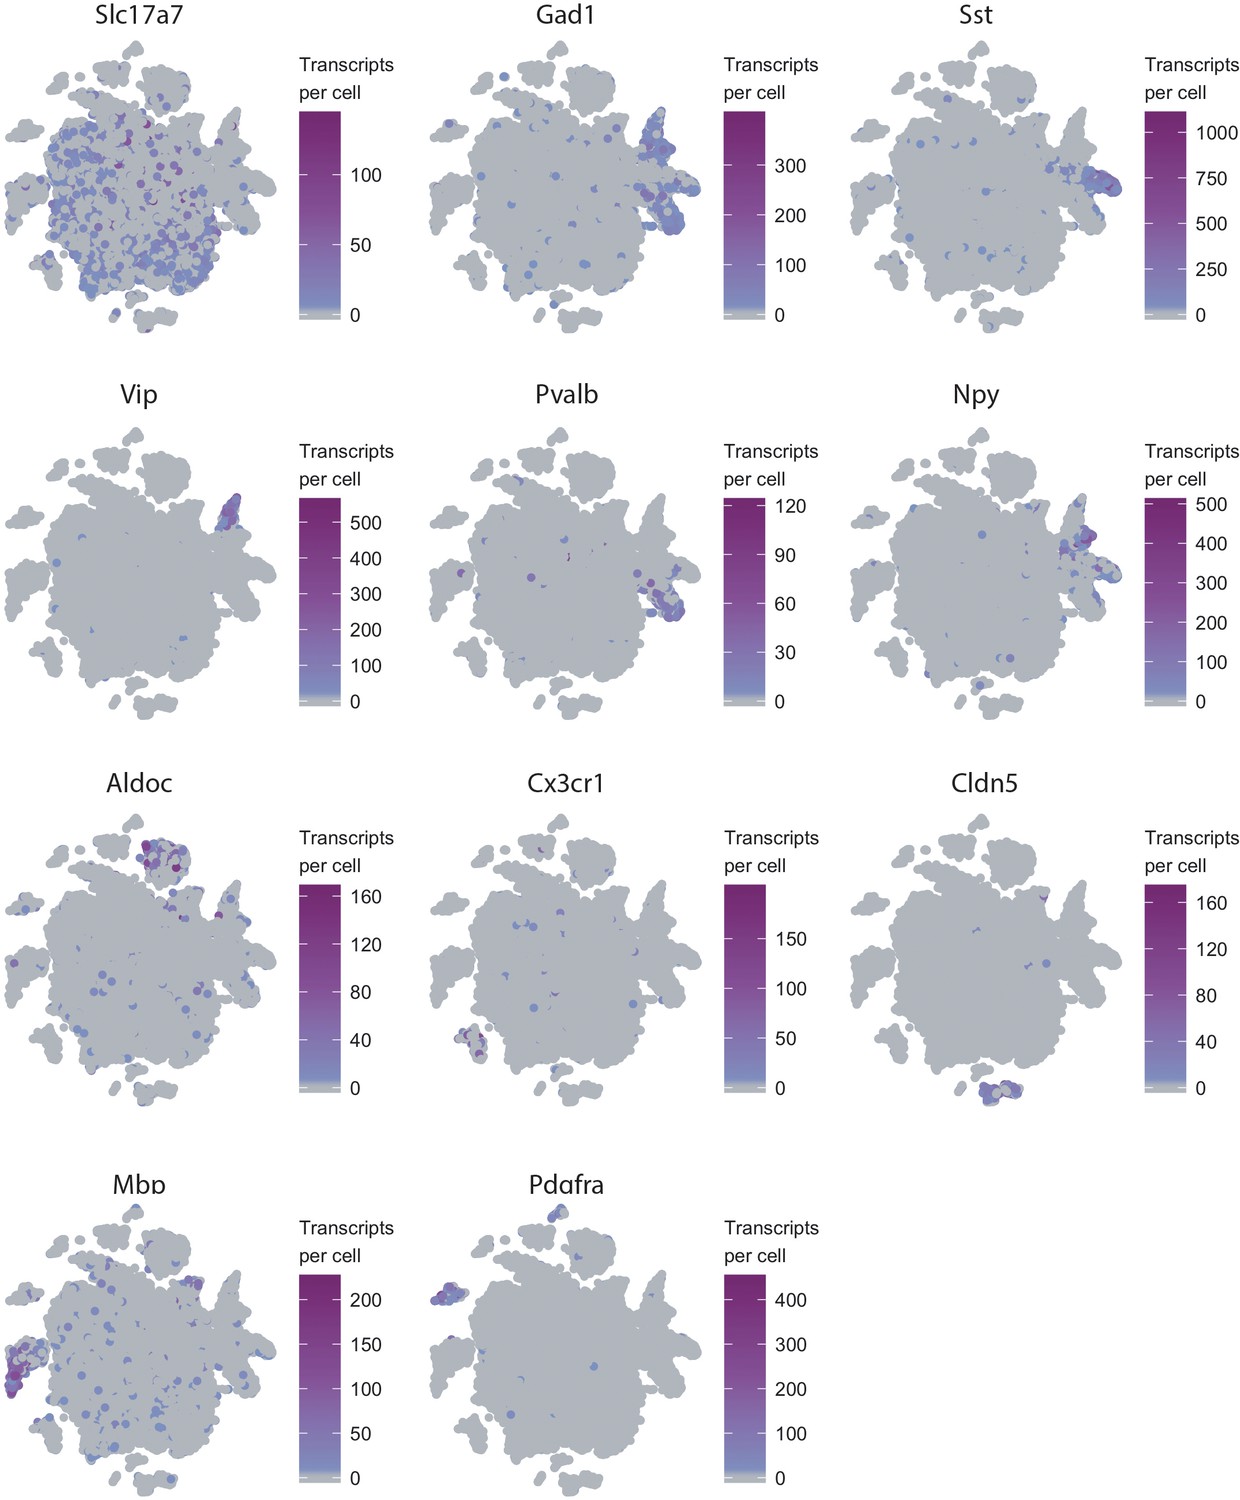
t-SNE plots of 32,335 nuclei from V1 cortex of two analyzed animals.
Color gradient denotes number of unique transcripts per nucleus of the indicated cellular marker gene.
Figure 2—figure supplement 4
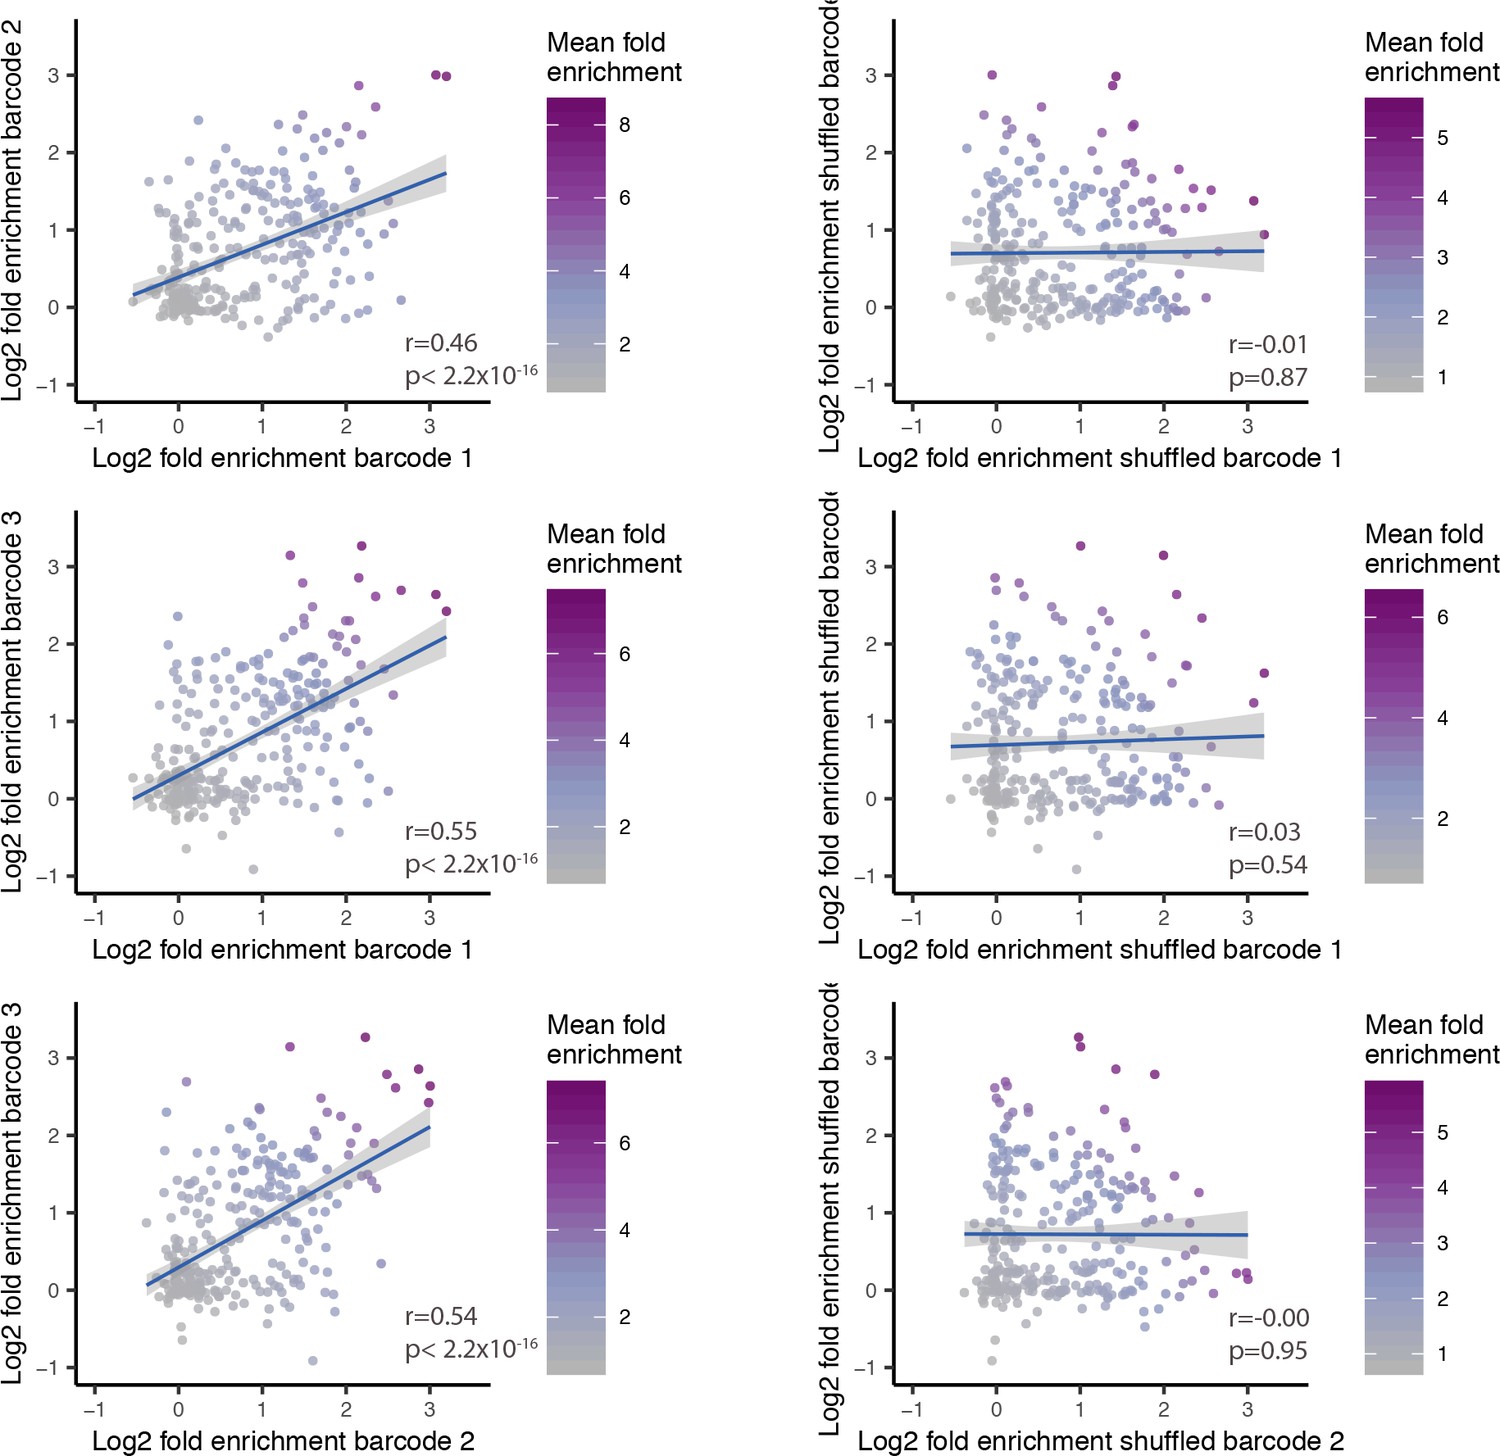
Pairwise comparison between SST fold-enrichment values.
Dot plot of pairwise comparison between SST fold-enrichment values across three pairs of barcodes associated with the same GRE (left) and across randomly shuffled barcodes (right). The values on each axis represent the Log2 SST fold-enrichment calculated for each barcode. Blue line indicates linear fit with 95% confidence intervals (shaded). Correlation and p-values are indicated for each plot. Color gradient indicates the average enrichment between the two barcodes.
Figure 2—figure supplement 5
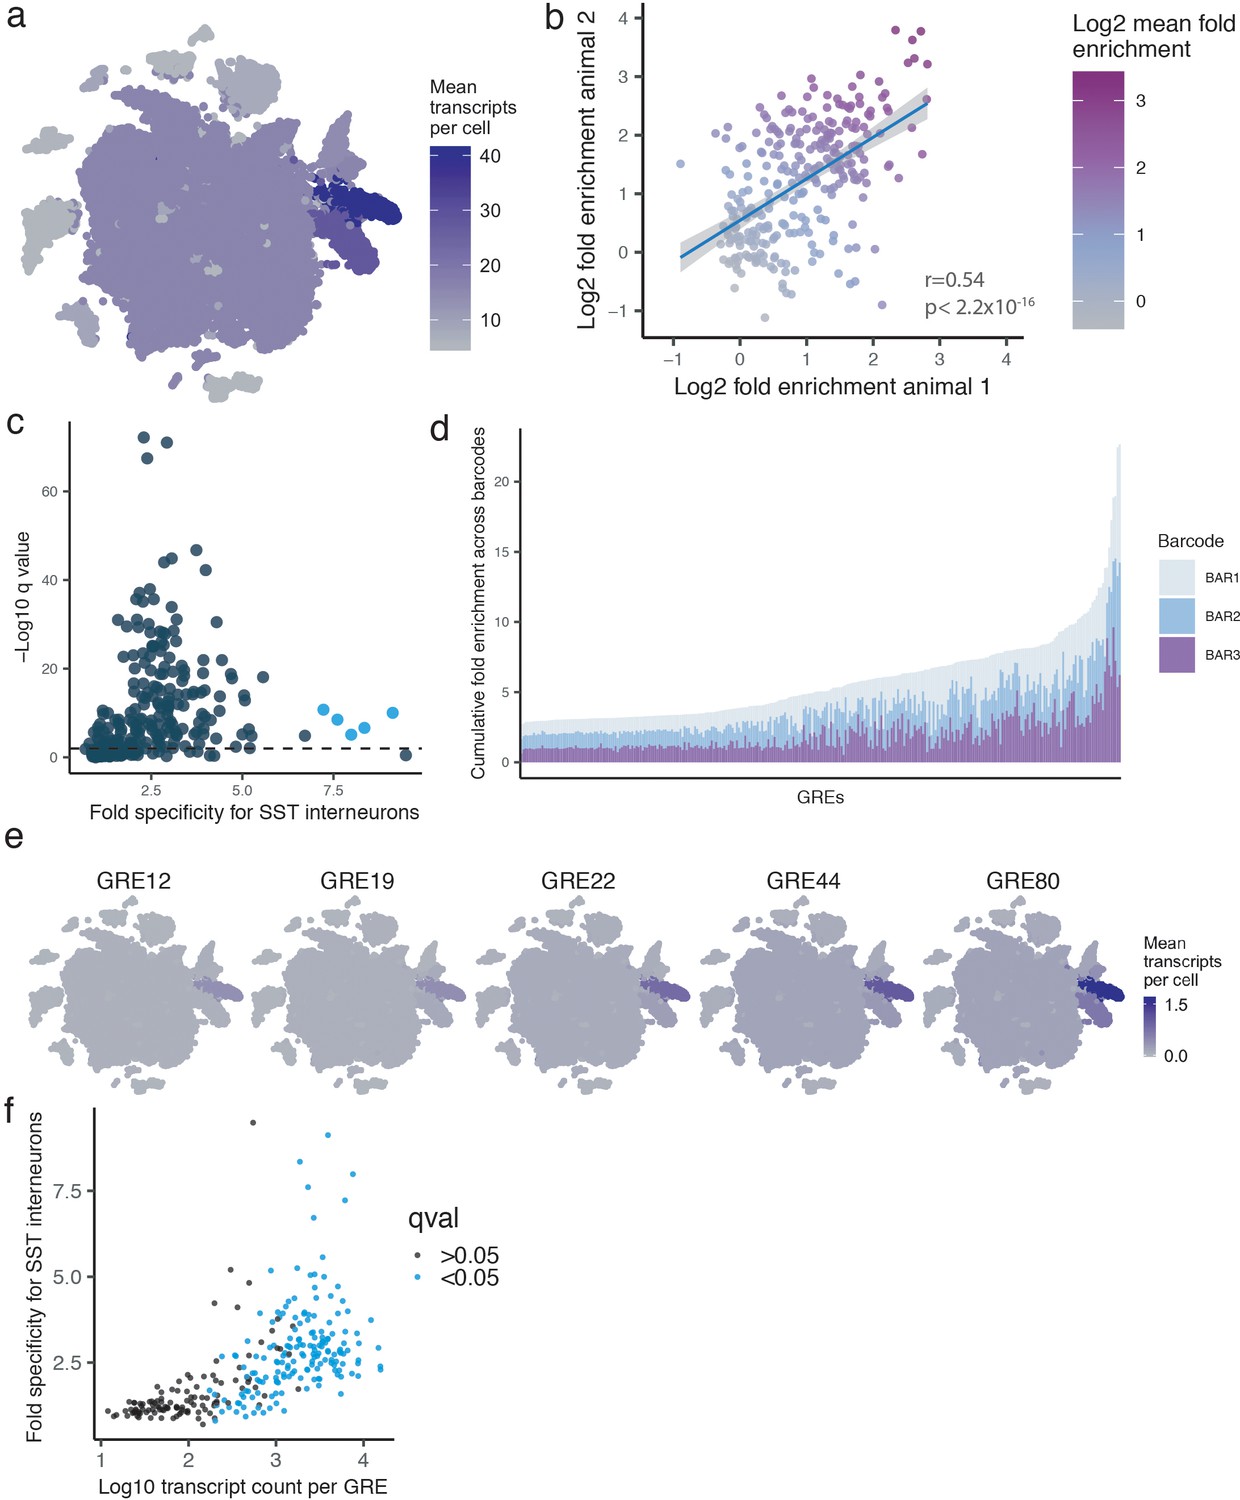
GRE specificity metrics.
(a) t-SNE plot of 32,335 nuclei from V1 cortex of two analyzed animals showing the mean viral expression across all GREs. Plot is pseudocolored based on the mean expression in each cell type. (b) Scatter plot of between Log2 SST fold-enrichment values across two animals. Blue line indicates linear fit with 95% confidence intervals (shaded). Correlation and p-values are indicated for each plot. Color gradient indicates the average enrichment between the two barcodes. (c) Scatter plot of GRE-driven transcripts plotted by fold SST-specificity and FDR-corrected q value of enrichment in SST+ versus SST- cells. Colored dots represent the five SST-enriched GREs that were considered hits (Fold-enrichment >7 and FDR < 0.01). (d) Cumulative bar plot of fold SST enrichment. Each bar represents three barcodes (colored differently) associated with one GRE. GREs on the X-axis ranked by cumulative enrichment. (e) t-SNE plot of 32,335 nuclei from V1 cortex of two animals, showing expression of GRE12, GRE19, GRE22, GRE44, and GRE80. Plot is pseudocolored based on the mean GRE expression in each cell type. (f) Scatter plot of GRE-driven transcripts plotted as Log10 transcript count by fold SST-specificity. Colored dots represent all GREs that were considered statistically enriched in SST+ cells (FDR corrected q < 0.05).
Figure 2—figure supplement 6
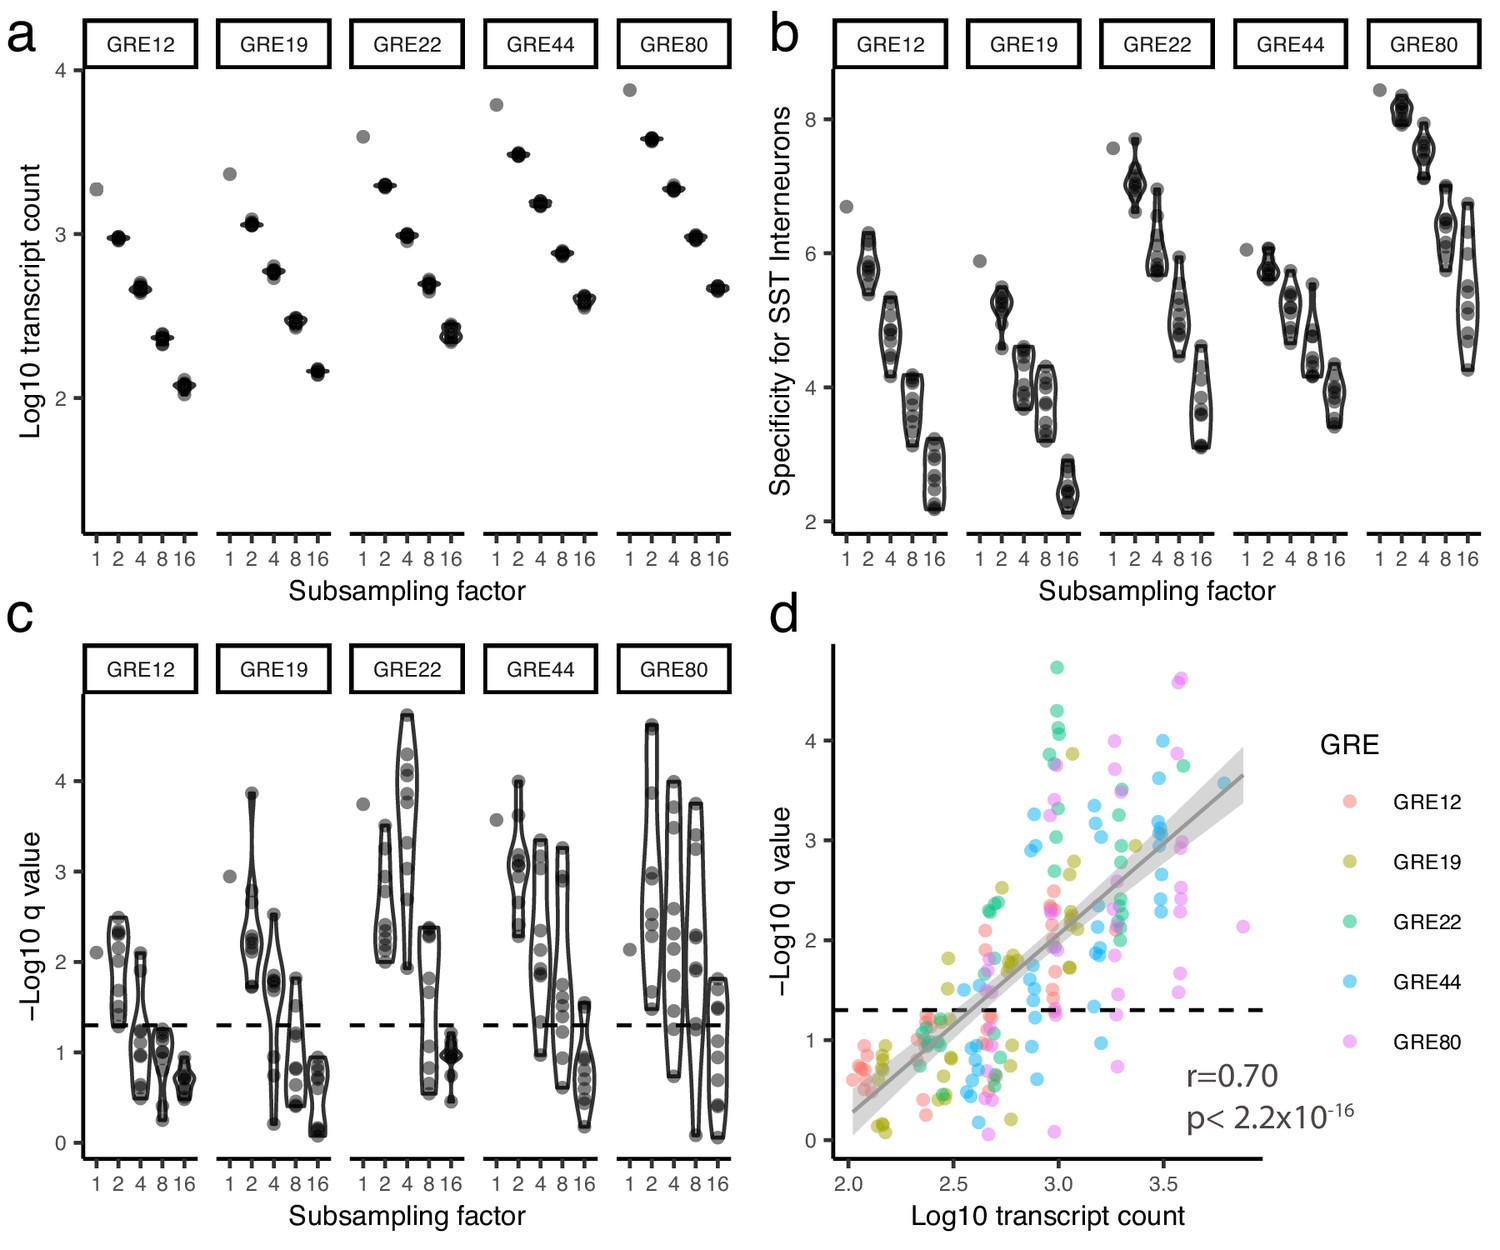
Analysis of computationally subsampled data.
Data from each of the five most cell-type-specific GRE hits was computationally subsampled to decrease the number of viral transcripts by 2, 4, 8, or 16 fold (x-axis) (Materials and methods). Each simulation was run ten times. The number of viral transcripts following subsampling (a), the fold specificity for SST cells (b), and the FDR-corrected q value of the enrichment in SST cells (c) is plotted on the y-axis for each GRE as a function of the subsampling factor. Panel (d) shows the scatter plot of the statistical enrichment as a function of the number of viral transcripts across all of the subsampling simulation. Dashed line indicates q=0.05. Gray line indicates linear fit with 95% confidence intervals (shaded, Pearson correlation, r = 0.70, p<2.2*10−16).
Figure 3 with 5 supplements
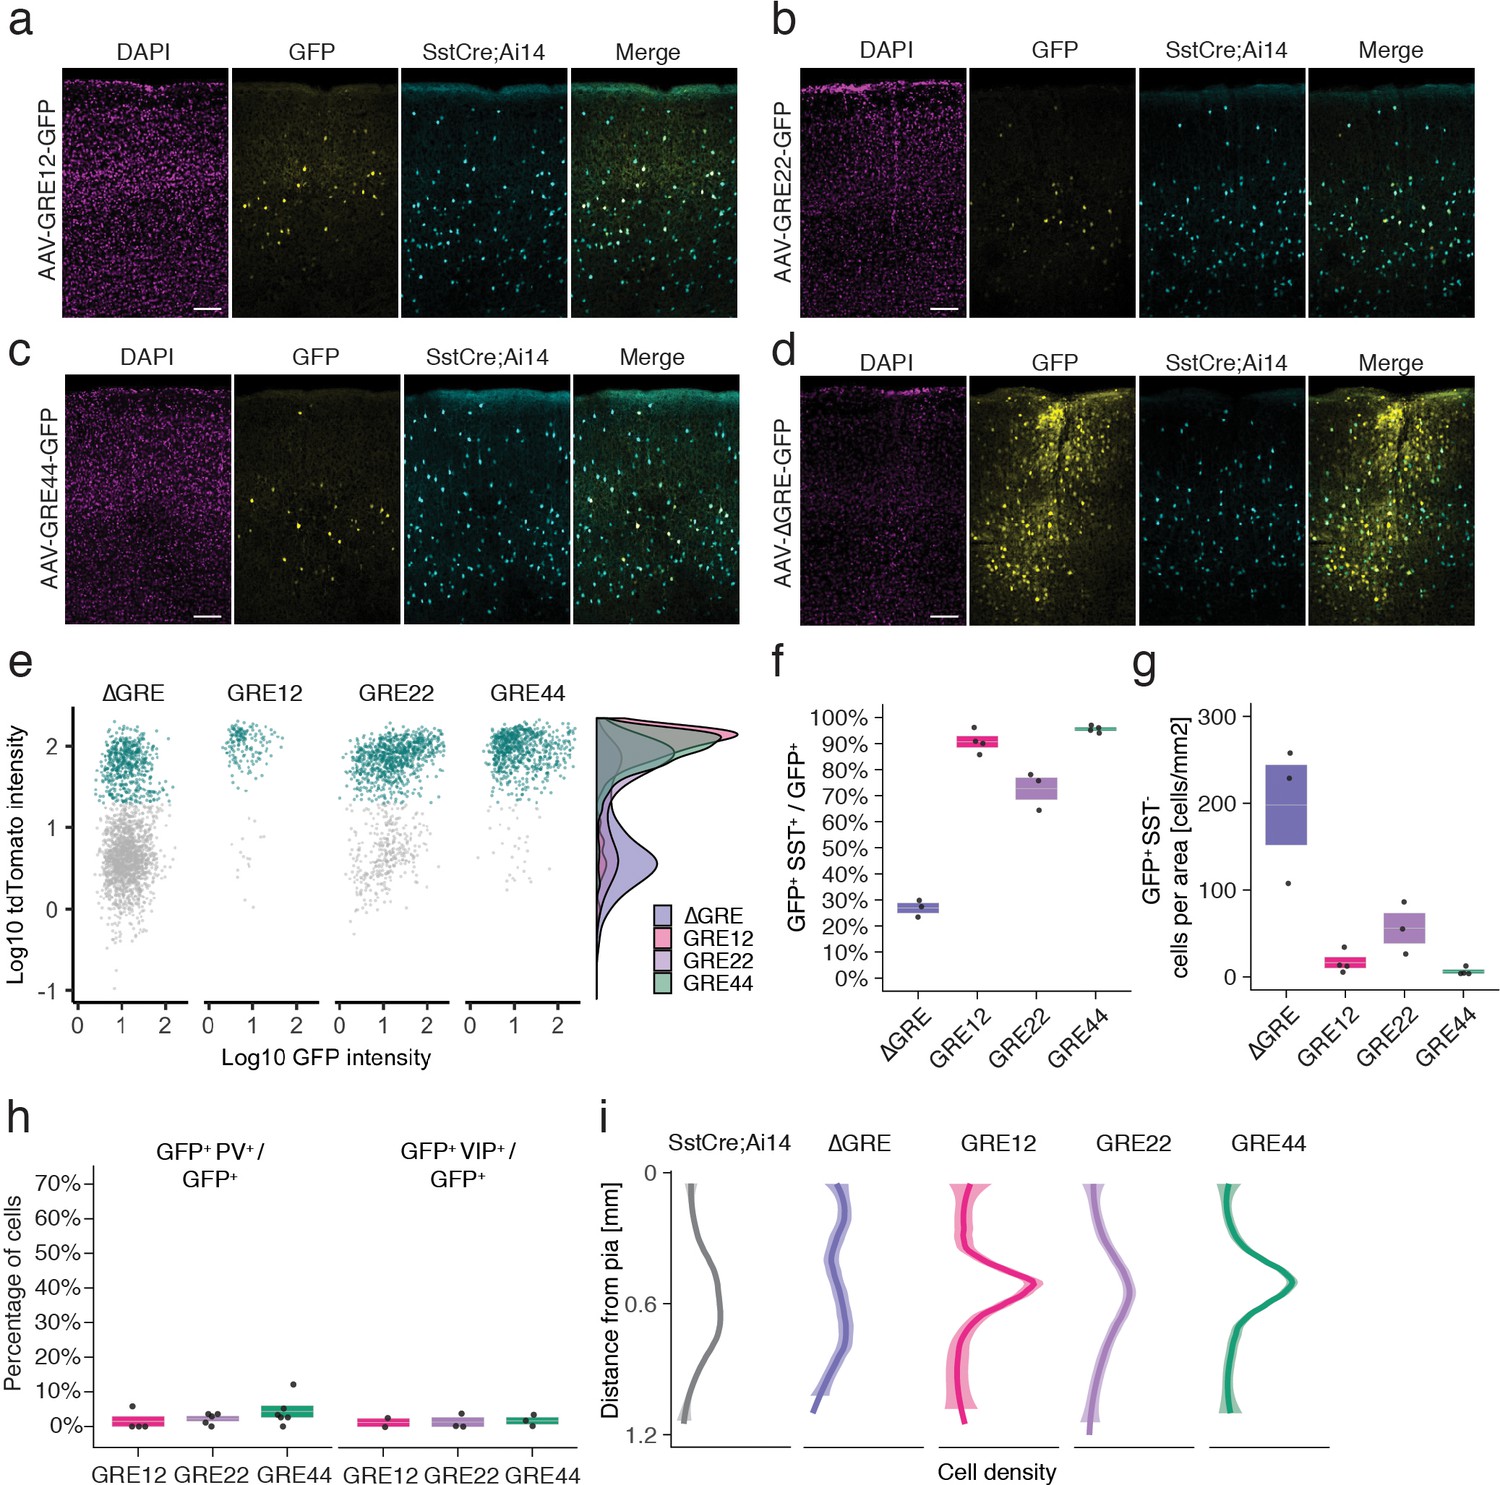
In situ characterization of rAAV-GRE reporter expression.
(a–d) Fluorescent images from adult Sst-Cre; Ai14 mouse visual cortex twelve days following injection with rAAV-GRE-GFP as indicated. Scale bars 100 µm. (e) Identification of rAAV-GRE-GFP+ cells that express tdTomato (SST+). Each dot represents a GFP+ cell (n = 2066, 172, 1164, and 765, for AAV-[ΔGRE, GRE12, GRE22, GRE44]-GFP, respectively). Cyan indicates tdTomato+ (SST+) cells. Distribution of cell frequency across tdTomato intensity is plotted on the right for each construct. (f) Quantification of the fraction of GFP+ cells that are SST+. Each dot represents one animal. Box plot represents mean ± standard error of the mean (s.e.m). Values are 27.2 ± 1.9%, 90.7 ± 2.1, 72.9 ± 4.2%, and 95.8 ± 0.6% for AAV-[ΔGRE, GRE12, GRE22, GRE44]-GFP, respectively. (g) Quantification of the number of GFP+ SST- cells normalized for area of infection. Each dot represents one animal. Box plot represents mean ± standard error of the mean (s.e.m). Values are 198.0 ± 46.0, 16.4 ± 6.2, 56.0 ± 17.3 and 6.1 ± 2.1 cells/mm2 for AAV-[ΔGRE, GRE12, GRE22, GRE44]-GFP, respectively. (h) Quantification of the fraction of GFP+ cells that are PV+ or VIP+. Box plot represents mean ± standard error of the mean (s.e.m). Fraction of AAV-GRE-GFP+ cells that are PV+ is 1.4 ± 1.4%, 2.2 ± 0.7, and 4.3 ± 1.7% for AAV-[GRE12, GRE22, GRE44]-GFP, respectively. Similarly, the fraction of AAV-GRE-GFP+ cells that are VIP+ is 1.2 ± 1.2%, 1.3 ± 1.3%, and 1.7 ± 1.0% for AAV-[GRE12, GRE22, GRE44]-GFP+ cells, respectively. (i) Distribution of the location of GFP-expressing cells as function of distance from the pia. Gray represents SST+ cells (n = 2648); Colored lines represents GFP+ SST+ cells (n = 2066, 172, 1164, and 765, respectively, for AAV-[ΔGRE, GRE12, GRE22, GRE44]-GFP). Shading represents the 95% confidence interval.
Figure 3—figure supplement 1
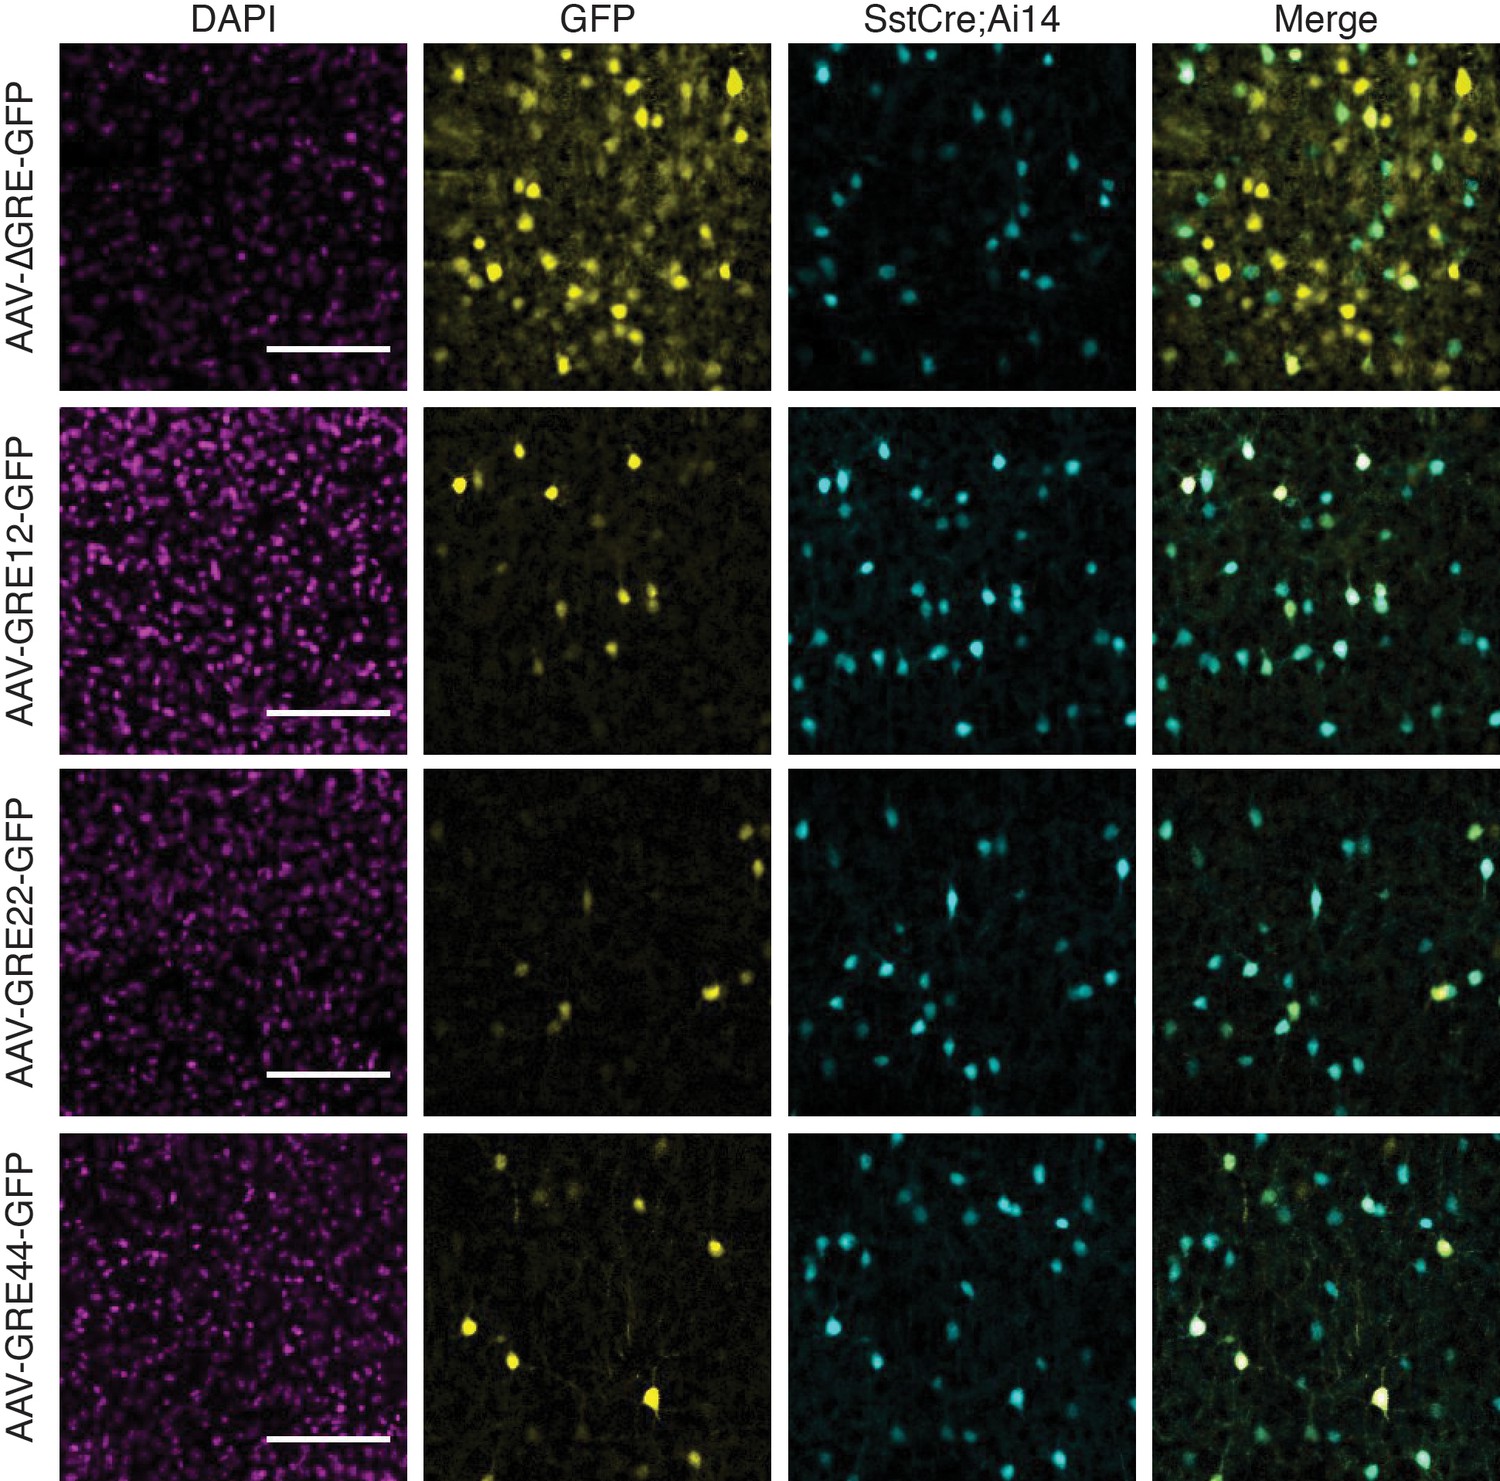
Fluorescent images from adult Sst-Cre; Ai14 mouse visual cortex twelve days following injection with rAAV-GRE-GFP as indicated.
https://doi.org/10.7554/eLife.48089.013
Figure 3—figure supplement 2

Analysis of mDlx5/6-GFP+ cells.
(a) Fluorescent images from adult Sst-Cre; Ai14 mouse visual cortex immunostained for PVALB twelve days following injection with rAAV-mDlx5/6-GFP as indicated. Scale bar 100 µm. (b) Quantification of the fraction of GFP+ cells that are SST+ and PVALB+. Each dot represents one animal. Box plot represents mean ± standard error of the mean (s.e.m). Values are 42.9 ± 3.9%, and 46.7 ± 5.6% for SST+ and PVALB+ respectively.
Figure 3—figure supplement 3
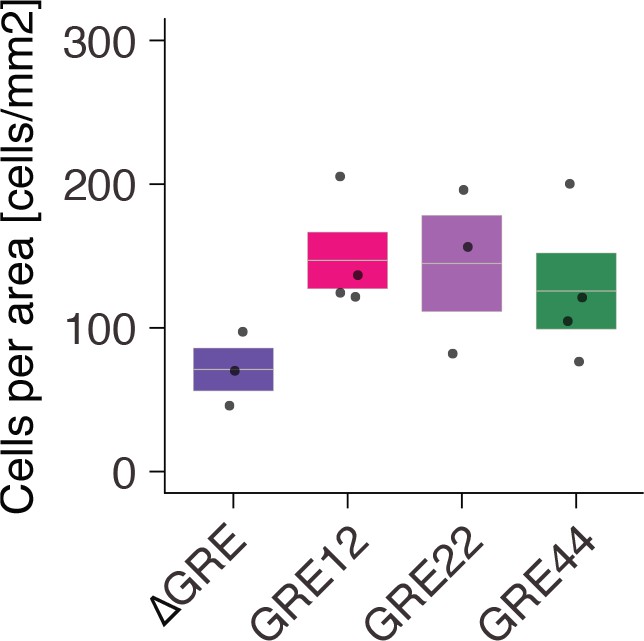
Quantification of the number of GFP+ SST+ cells normalized for area of infection.
Each dot represents one animal. Box plot represents mean ± standard error of the mean (s.e.m). Values are 73.0 ± 17.2, 146.9 ± 19.7, 144.8 ± 38.6 and 125.6 ± 26.4 cells/mm2 for AAV-[ΔGRE, GRE12, GRE22, GRE44]-GFP, respectively.
Figure 3—figure supplement 4
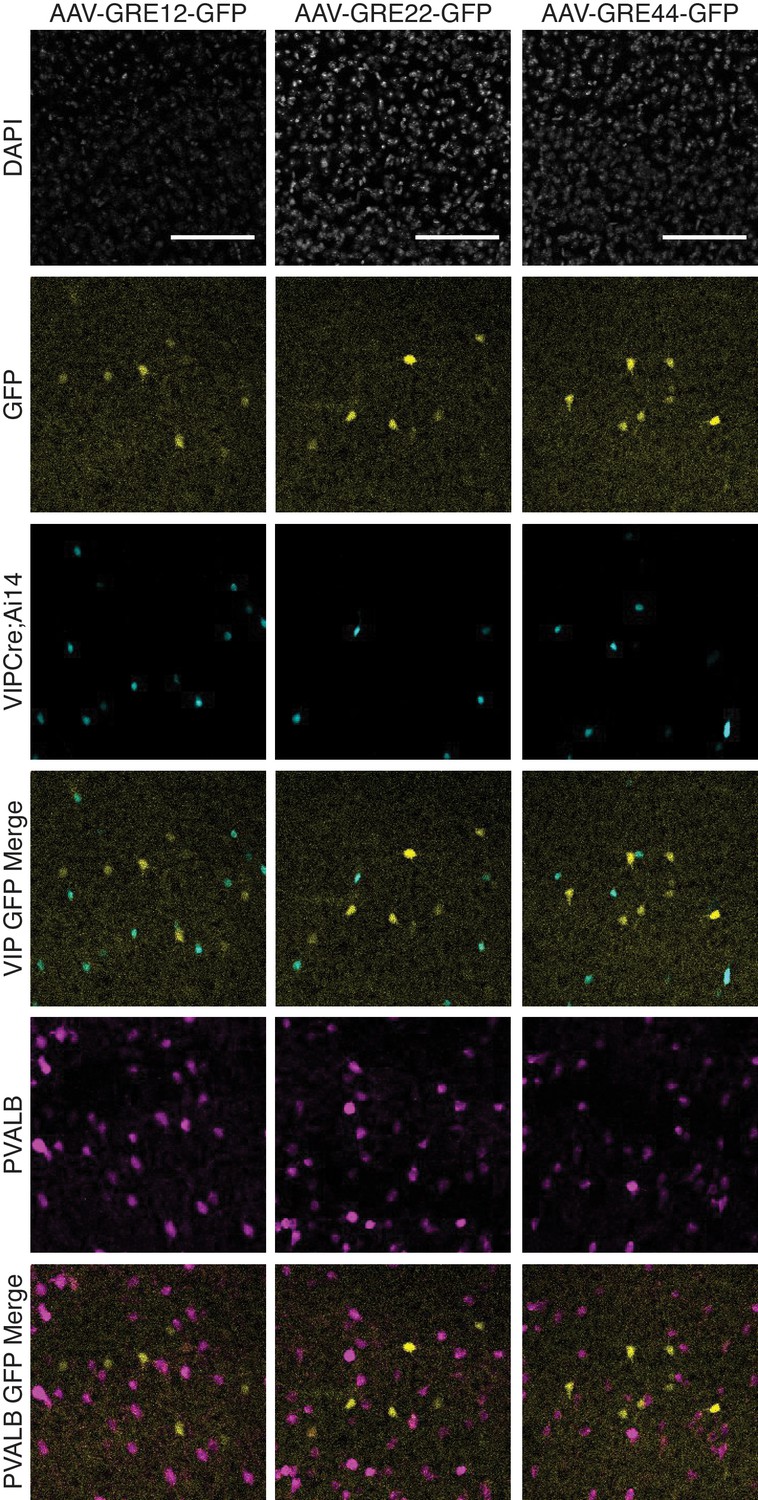
Fluorescent images from adult Vip-Cre; Ai14 mouse visual cortex immunostained for PVALB twelve days following injection with rAAV-GRE-GFP as indicated.
https://doi.org/10.7554/eLife.48089.016
Figure 3—figure supplement 5

Quantification of the fraction of GFP+ cells that are present it each cortical layer.
Each dot represents one animal. Box plot represents mean ± standard error of the mean (s.e.m). Gray represents all SST+ cells, colored plots represent GFP+ SST+ cells respectively, for AAV-[GRE12, GRE22, GRE44]-GFP).
Figure 4
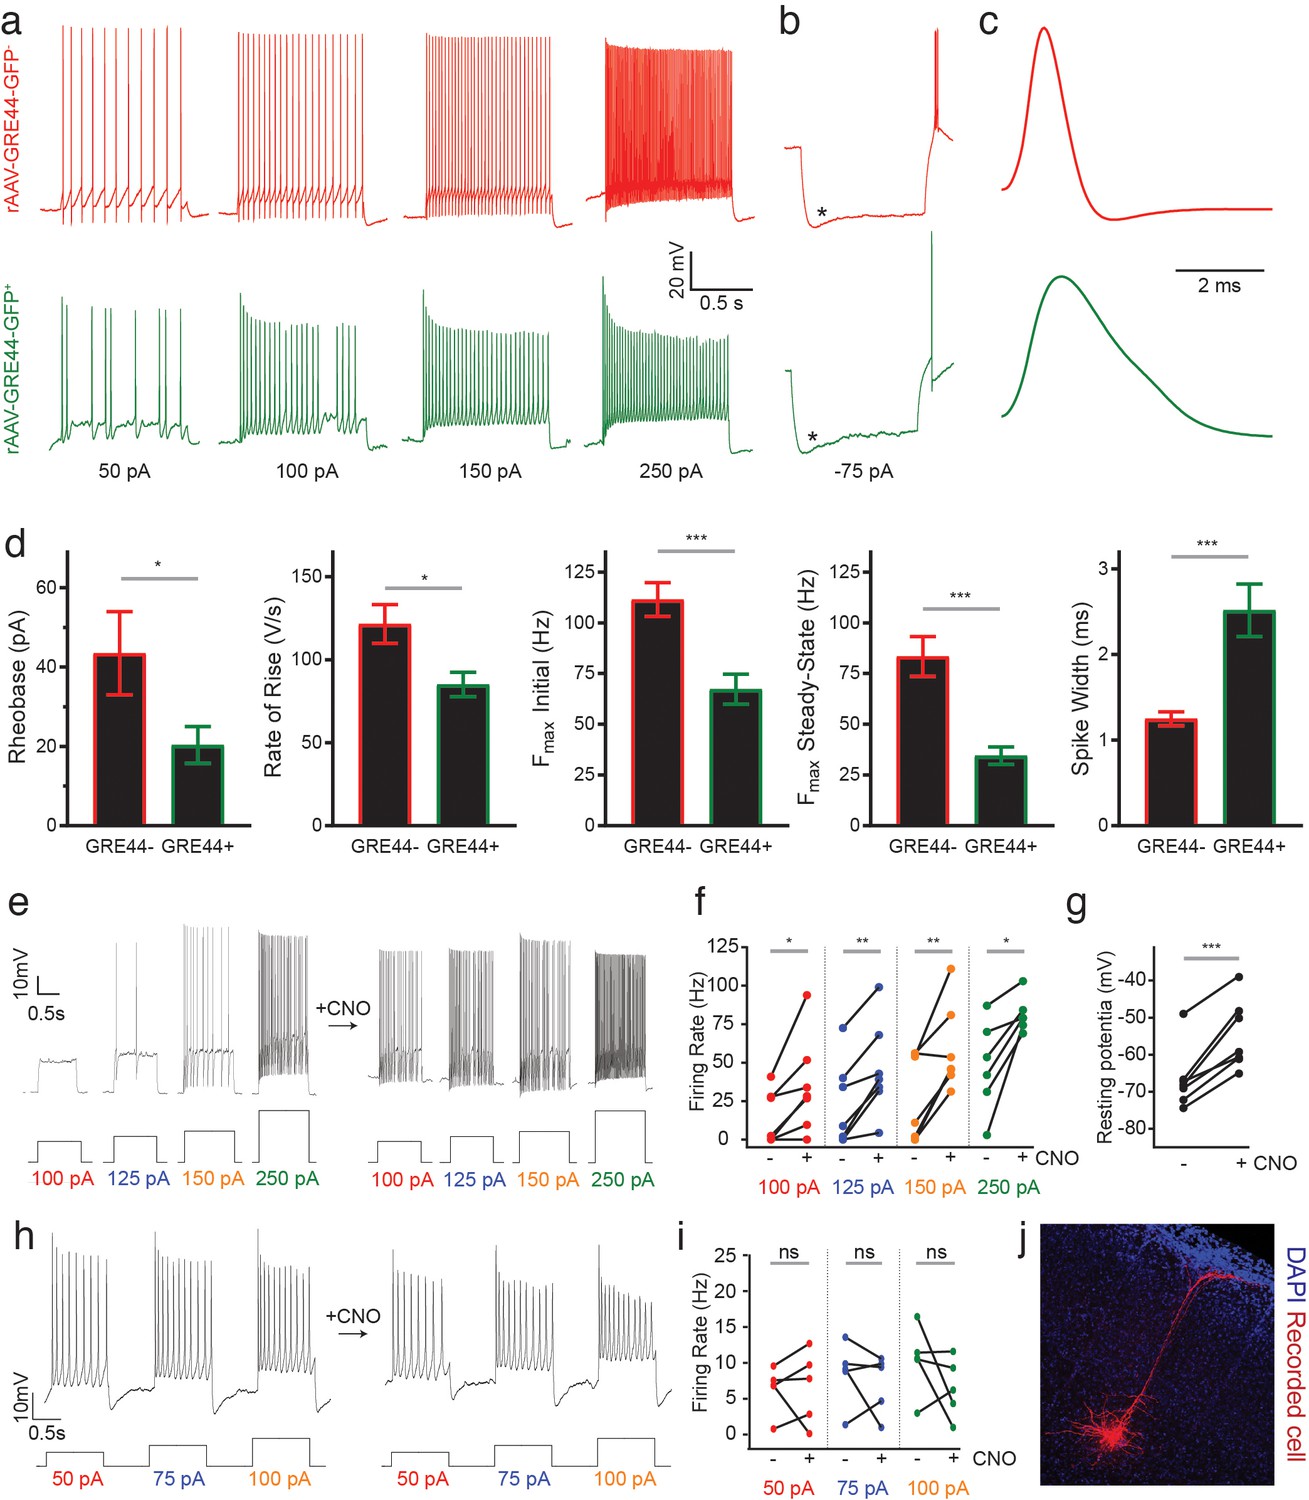
Electrophysiology of neurons expressing an rAAV-GRE-driven reporter and modulation of neuronal activity with rAAV-GREs.
(a) Representative current-clamp recordings from SST neurons in the visual cortex of Sst-Cre; Ai14 mice injected with rAAV-GRE44-GFP. Top: Representative traces from a cortical SST neuron with Cre-dependent expression of tdTomato, in response to 1000 ms depolarizing current injections as indicated in black (‘GRE44-”). Bottom: Traces from a tdTomato+ SST neuron with GRE44-driven expression of GFP (‘GRE44+”). GRE44- SST neurons were only recorded in the immediate vicinity of GRE44+ SST neurons. (b) Recordings from GRE44+ and GRE44- neurons in response to hyperpolarizing, 1000 ms currents. Asterisks indicate the sag likely due to the hyperpolarization-activated current Ih. Rebound action potentials following recovery from hyperpolarization, likely due to low-threshold calcium spikes mediated by T-type calcium channels, were also present in cells of both groups. Same scale as (a). (c) Broader action potentials in GRE44+ SST neurons (bottom) compared to GRE44- SST neurons (top). Same vertical scale as (a) and (b). (d) Electrophysiological properties that differ between GRE44+ (n = 16 cells from five mice) and GRE44- (n = 16 cells from four mice) SST neurons, including rheobase (minimal amount of current necessary to elicit a spike), maximal rate of rise during the depolarizing phase of the action potential, the initial and steady state firing frequencies (both measured at the maximal current step before spike inactivation), and spike width (measured as the width at half-maximal spike amplitude). *p<0.05; ***p<0.001, unpaired t-test, two-tailed. (e) Representative current-clamp recordings from AAV-GRE12-Gq-tdTomato+ cells before and during CNO application. (f) Increased firing rates of AAV-GRE12-Gq-tdTomato+ cells evoked by depolarizing current injections upon bath application of CNO (three animals, 6–7 cells). *p<0.05; **p<0.01, paired t-test, two-tailed. (g) Robust depolarization of AAV-GRE12-Gq-tdTomato+ cells upon bath application of CNO (three animals, 6–7 cells). ***p<0.001, paired t-test, two-tailed. (h) Representative recordings from nearby uninfected pyramidal neurons in the visual cortex of mice that were injected with AAV-GRE-12-Gq-tdTomato+, before (top) and during CNO application (bottom). (i) Firing rates of pyramidal neurons during CNO application remain unchanged (three animals, 5 cells). ns, p>0.05, paired t-test, two-tailed. (j) Representative image of a nearby recorded uninfected pyramidal neuron that was filled with neurobiotin.
Tables
Key resources table
| Reagent type (species) or resource | Designation | Source or reference | Identifiers | Additional information |
|---|---|---|---|---|
| Gene (Mus musculus) | Sst | NCBI Gene ID: 20604 | ||
| Genetic reagent (M. musculus) | Sst-IRES-Cre | Jackson Laboratory Stock # 013044 | IMSR Cat# JAX:013044, RRID:IMSR_JAX:013044 | |
| Genetic reagent (M. musculus) | Vip-IRES-Cre | The Jackson Laboratory Stock # 010908 | IMSR Cat# JAX:010908, RRID:IMSR_JAX:010908 | |
| Genetic reagent (M. musculus) | Pv-Cre | The Jackson Laboratory Stock # 017320 | IMSR Cat# JAX:017320, RRID:IMSR_JAX:017320 | |
| Genetic reagent (M. musculus) | SUN1-2xsfGFP-6xMYC | The Jackson Laboratory Stock # 021039 | IMSR Cat# JAX:021039, RRID:IMSR_JAX:021039 | |
| Genetic reagent (M. musculus) | Ai14 | The Jackson Laboratory Stock # 007914 | IMSR Cat# JAX:007914, RRID:IMSR_JAX:007914 | |
| Strain, strain background (Escherichia coli) | High Efficiency NEB 5-alpha | New England Biolabs | C2987H | Competent cells |
| Antibody | anti-GFP (Rabbit monoclonal) | Thermo Fisher | Cat# G10362; RRID:AB_2536526 | 0.012 ug/ul |
| Antibody | anti-Parvalbumin (Mouse monoclonal) | EMD Millipore | Cat# MAB1572; RRID:AB_2174013 | IF(1:2000) |
| Recombinant DNA reagent | pAAV-mDlx-GFP-Fishell-1 (plasmid) | PMID: 27798629 | Addgene # 83900; RRID:Addgene_83900 | |
| Recombinant DNA reagent | pAAV-ΔGRE -GFP- (plasmid) | This paper | ||
| Recombinant DNA reagent | pAAV-GRE12-GFP- (plasmid) | This paper | ||
| Recombinant DNA reagent | pAAV-GRE22-GFP- (plasmid) | This paper | ||
| Recombinant DNA reagent | pAAV-GRE44-GFP- (plasmid) | This paper | ||
| Commercial assay or kit | Nextera DNA Library Prep Kit | Illumina | FC-121–1030 | |
| Commercial assay or kit | In-Fusion HD cloning kit | Takara Bio | 639645 | |
| Commercial assay or kit | Agencourt AMPure XP | Beckman Coulter | # A63881 | |
| Commercial assay or kit | Hot Start High-Fidelity Q5 polymerase | New England Biolabs | M0494L |
Additional files
-
Supplementary file 1
Genomic coordinates and conservation scores for the 323,369 reference putative GRE regions.
- https://doi.org/10.7554/eLife.48089.019
-
Supplementary file 2
Genomic coordinates, distance to nearest TSS, nearest gene, ATAC-seq-specificity and PESCA-specificity of the 287 GREs that were included in the library.
- https://doi.org/10.7554/eLife.48089.020
-
Supplementary file 3
Vector sequences for the in situ evaluated vectors rAAV-ΔGRE/GRE12/GRE22/GRE44-GFP.
Gray highlighting indicates the ITRs, green indicates GFP and yellow indicates GRE.
- https://doi.org/10.7554/eLife.48089.021
-
Supplementary file 4
Electrophysiological Parameters of GRE44- and GRE44+ SST Neurons in Visual Cortex.
- https://doi.org/10.7554/eLife.48089.022
-
Transparent reporting form
- https://doi.org/10.7554/eLife.48089.023
Download links
A two-part list of links to download the article, or parts of the article, in various formats.
Downloads (link to download the article as PDF)
Open citations (links to open the citations from this article in various online reference manager services)
Cite this article (links to download the citations from this article in formats compatible with various reference manager tools)
A scalable platform for the development of cell-type-specific viral drivers
eLife 8:e48089.
https://doi.org/10.7554/eLife.48089


