T-cell co-stimulation in combination with targeting FAK drives enhanced anti-tumor immunity
- University of Edinburgh, United Kingdom
- Boehringer Ingelheim RCV GmbH & Co KG, Austria
Figures
Figure 1
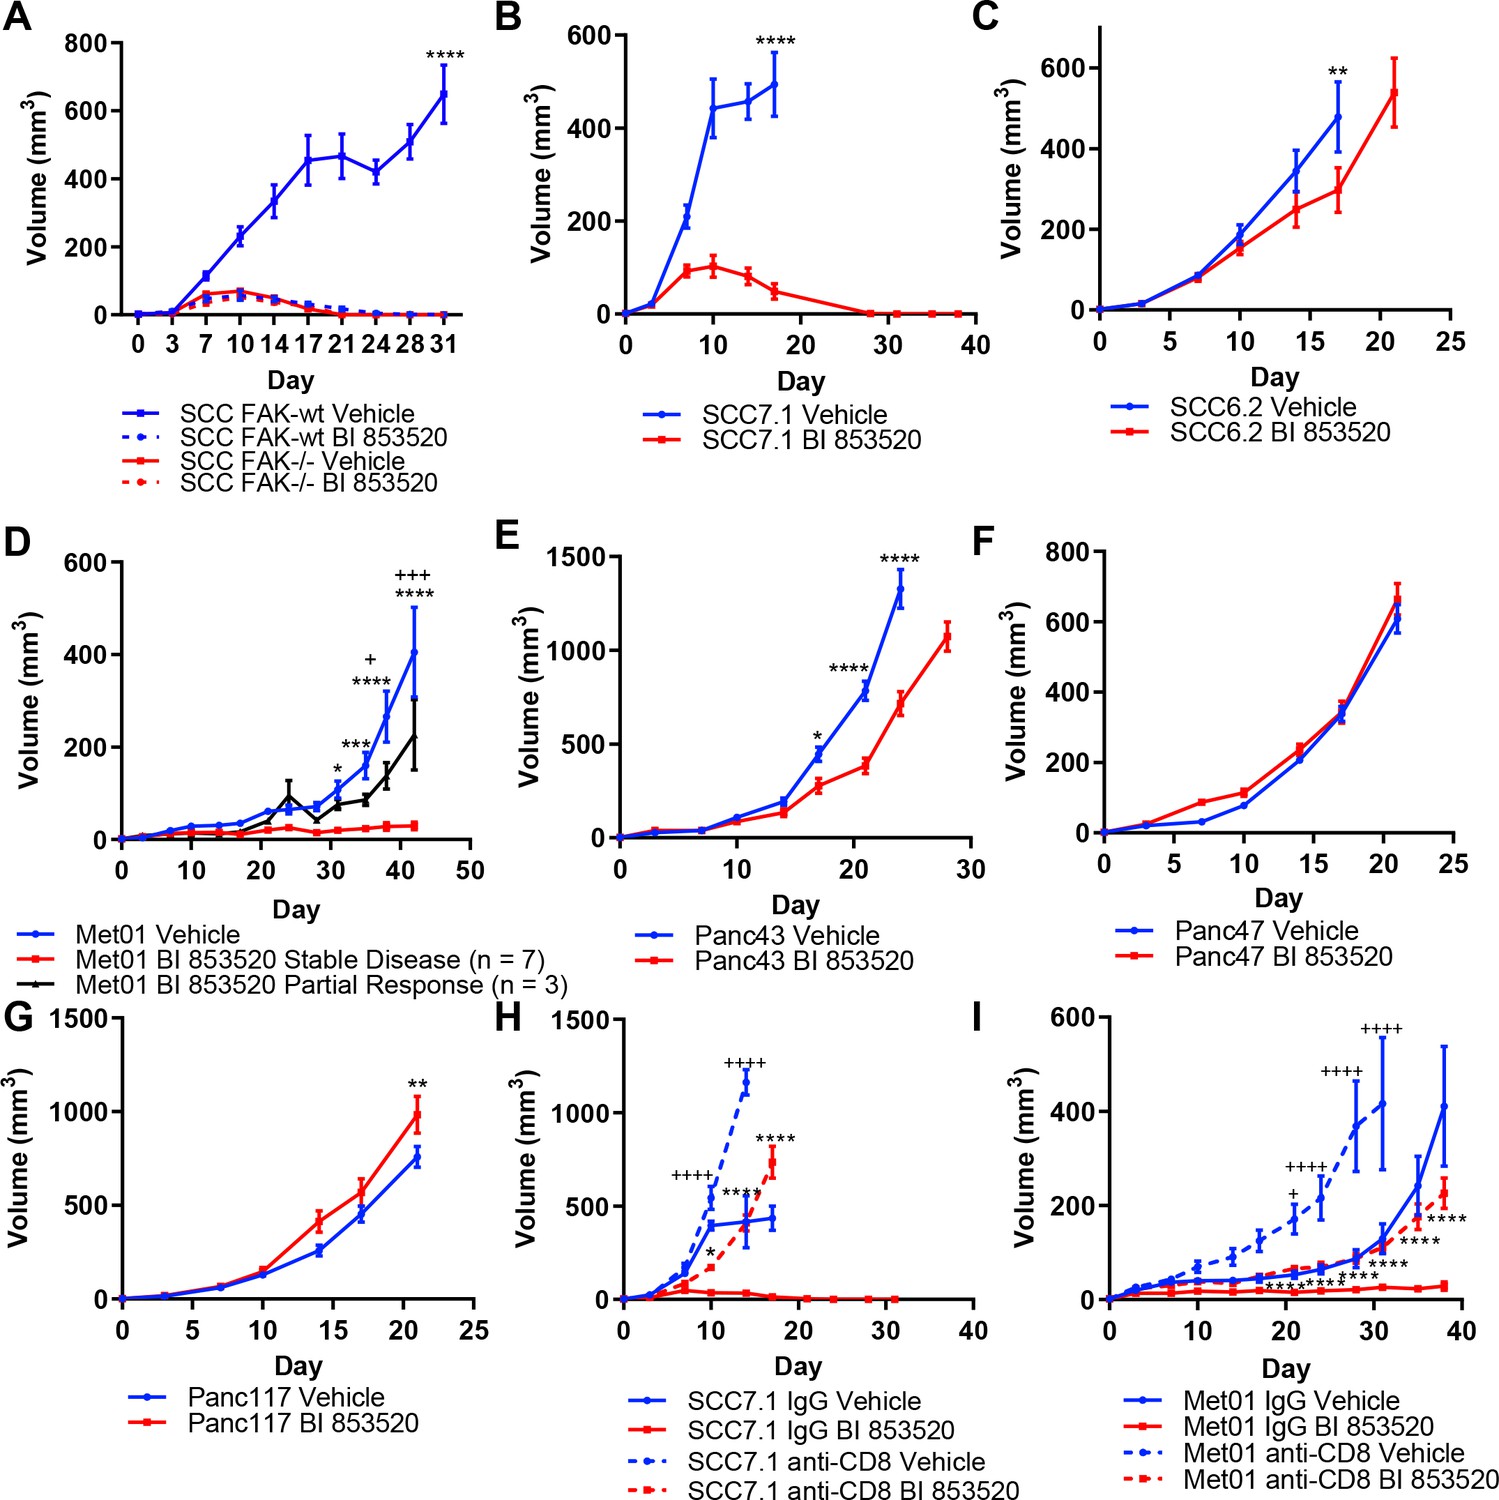
Treatment of a range of tumor models with the FAK kinase inhibitor BI 853520 identifies a spectrum of responses.
(A - G) Representative graphs of tumor growth in immune-competent mice treated with either Vehicle or 50 mg/kg BI 853520. *=comparison of Vehicle to BI 853520, + = comparison of Vehicle to BI 853520 partial response in graph (D) n = 8–10 tumors per group. (H and I) Tumor growth of SCC7.1 and Met01 cells treated with either Vehicle or BI 853520 and Isotype control antibody (IgG) or anti-CD8 T-cell depleting antibody. + = comparison of IgG Vehicle to IgG BI 853520, *=comparison of anti-CD8 Vehicle to anti-CD8 BI 853520. * or + = p ≤ 0.05, ** or ++ = p ≤ 0.01, *** or +++ = p ≤ 0.001, **** or ++++ = p ≤ 0.0001, two-way ANOVA with Tukey’s multiple comparison test. Data represented as mean + /- s.e.m. n = 6 tumors per group.
Figure 2 with 1 supplement
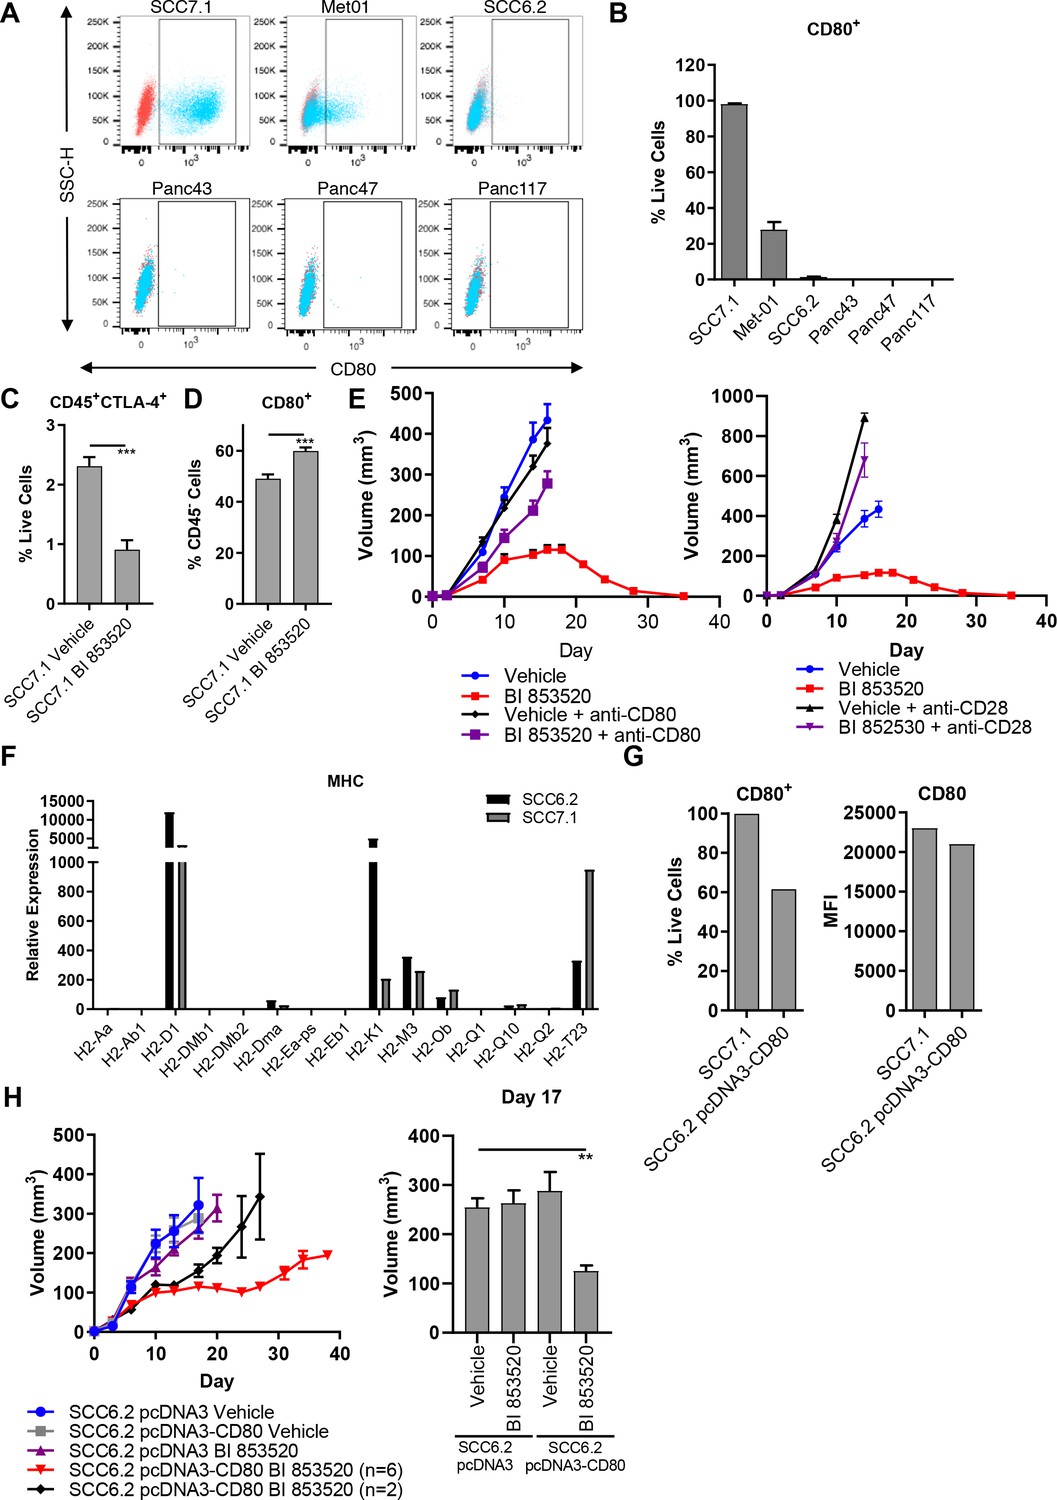
Expression of the immune costimulatory ligand CD80 renders tumors responsive to BI 853520.
(A) Representative flow cytometry scatter plots of CD80 expression on SCC7.1, Met01, SCC6.2, Panc43, Panc47, and Panc117 cells under normal culture conditions. (B) Quantification of the percentage of live cells expressing CD80 in (A). Data represented as mean + /- s.e.m, n = 3. (C) Flow cytometry quantification of CD45+CTLA-4+ tumor infiltrating immune cells represented as a percentage of live cells. Data represented as mean + /- s.e.m. p≤0.001, two-tailed parametric unpaired t-test. (D) Flow cytometry quantification of CD45-CD80+ cells represented as a percentage of live cells. Data represented as mean + /- s.e.m. p≤0.001, two-tailed parametric unpaired t-test. (E) Left - Subcutaneous tumor growth of SCC7.1 cells treated with either Vehicle or 50 mg/kg BI 853520 ± 100 µg anti-CD80 antibody. Right – subcutaneous tumor growth of SCC7.1 cells treated with either Vehicle or 50 mg/kg BI 853520 ± 100 µg anti-CD28 antibody. Data represented as mean + /- s.e.m. Vehicle (blue) and BI 853520 (red) datasets are the same for both graphs. (F) Nanostring gene expression analysis of Major Histocompatibility Complex (MHC) genes in SCC7.1 and SCC6.2 cells. (G) Comparison of CD80 surface expression between SCC7.1 cells and SCC6.2 cells transfected with a pcDNA3-CD80 vector. Left - Flow cytometry analysis of the percentage of cells expressing CD80. Right - mean fluorescent intensity (MFI) of CD80 cell surface expression. (H) Left - Subcutaneous tumor growth of SCC6.2 cells transfected with either pcDNA3 empty vector or pcDNA3-CD80 vector and treated with either Vehicle or 50 mg/kg BI 853520. Right – Comparison of tumor volume on day 17 post-implantation of tumor cells. Data represented as mean + /- s.e.m. p≤0.01, one-way ANOVA with Dunnett’s multiple comparison. n = 8–10 tumors per group.
Figure 2—figure supplement 1
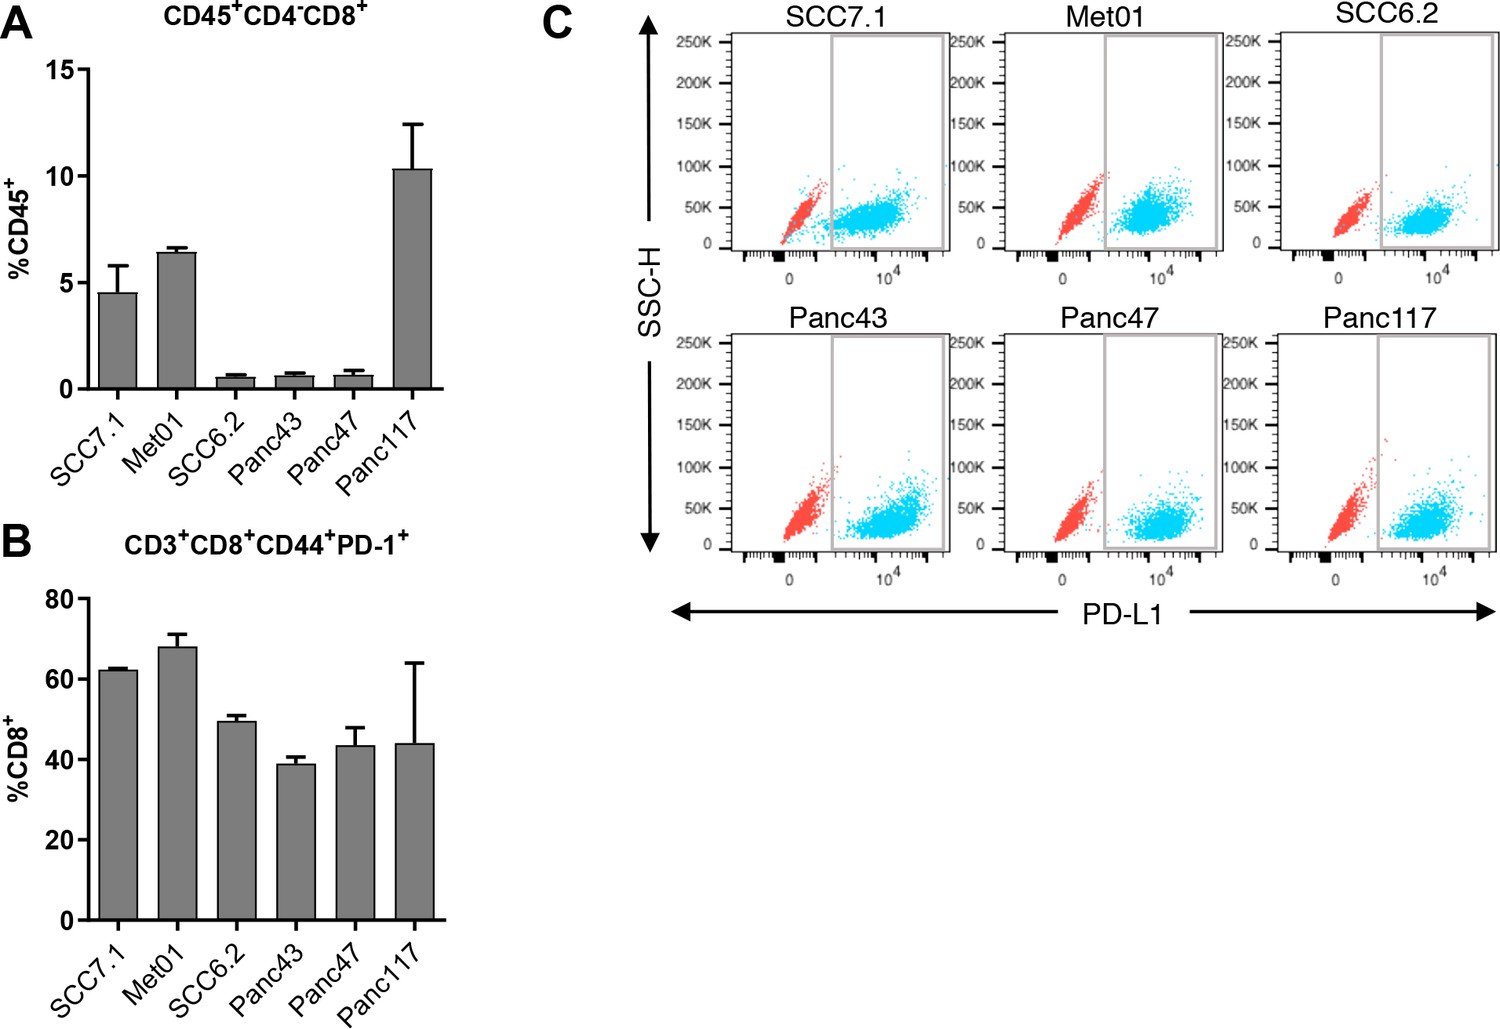
Regulation of PD-L1/PD-1 axis does not correlate with response of tumors to BI 853520.
(A) Flow cytometry analysis of CD8+ T-cell infiltration in SCC7.1, Met01, SCC6.2, Panc43, Panc47, and Panc117 tumors. (B) Flow cytometry quantification of the percentage of CD8+ T-cells expressing PD-1 in SCC7.1, Met01, SCC6.2, Panc43, Panc47, and Panc117 tumors. (C) Flow cytometry analysis of PD-L1 expression on SCC7.1, Met01, SCC6.2, Panc43, Panc47, and Panc117 cells following stimulation with 10 ng/ml IFNγ for 24 hr under normal culture conditions. (A and B) Data represented as mean + /- s.e.m, n = 3.
Figure 3
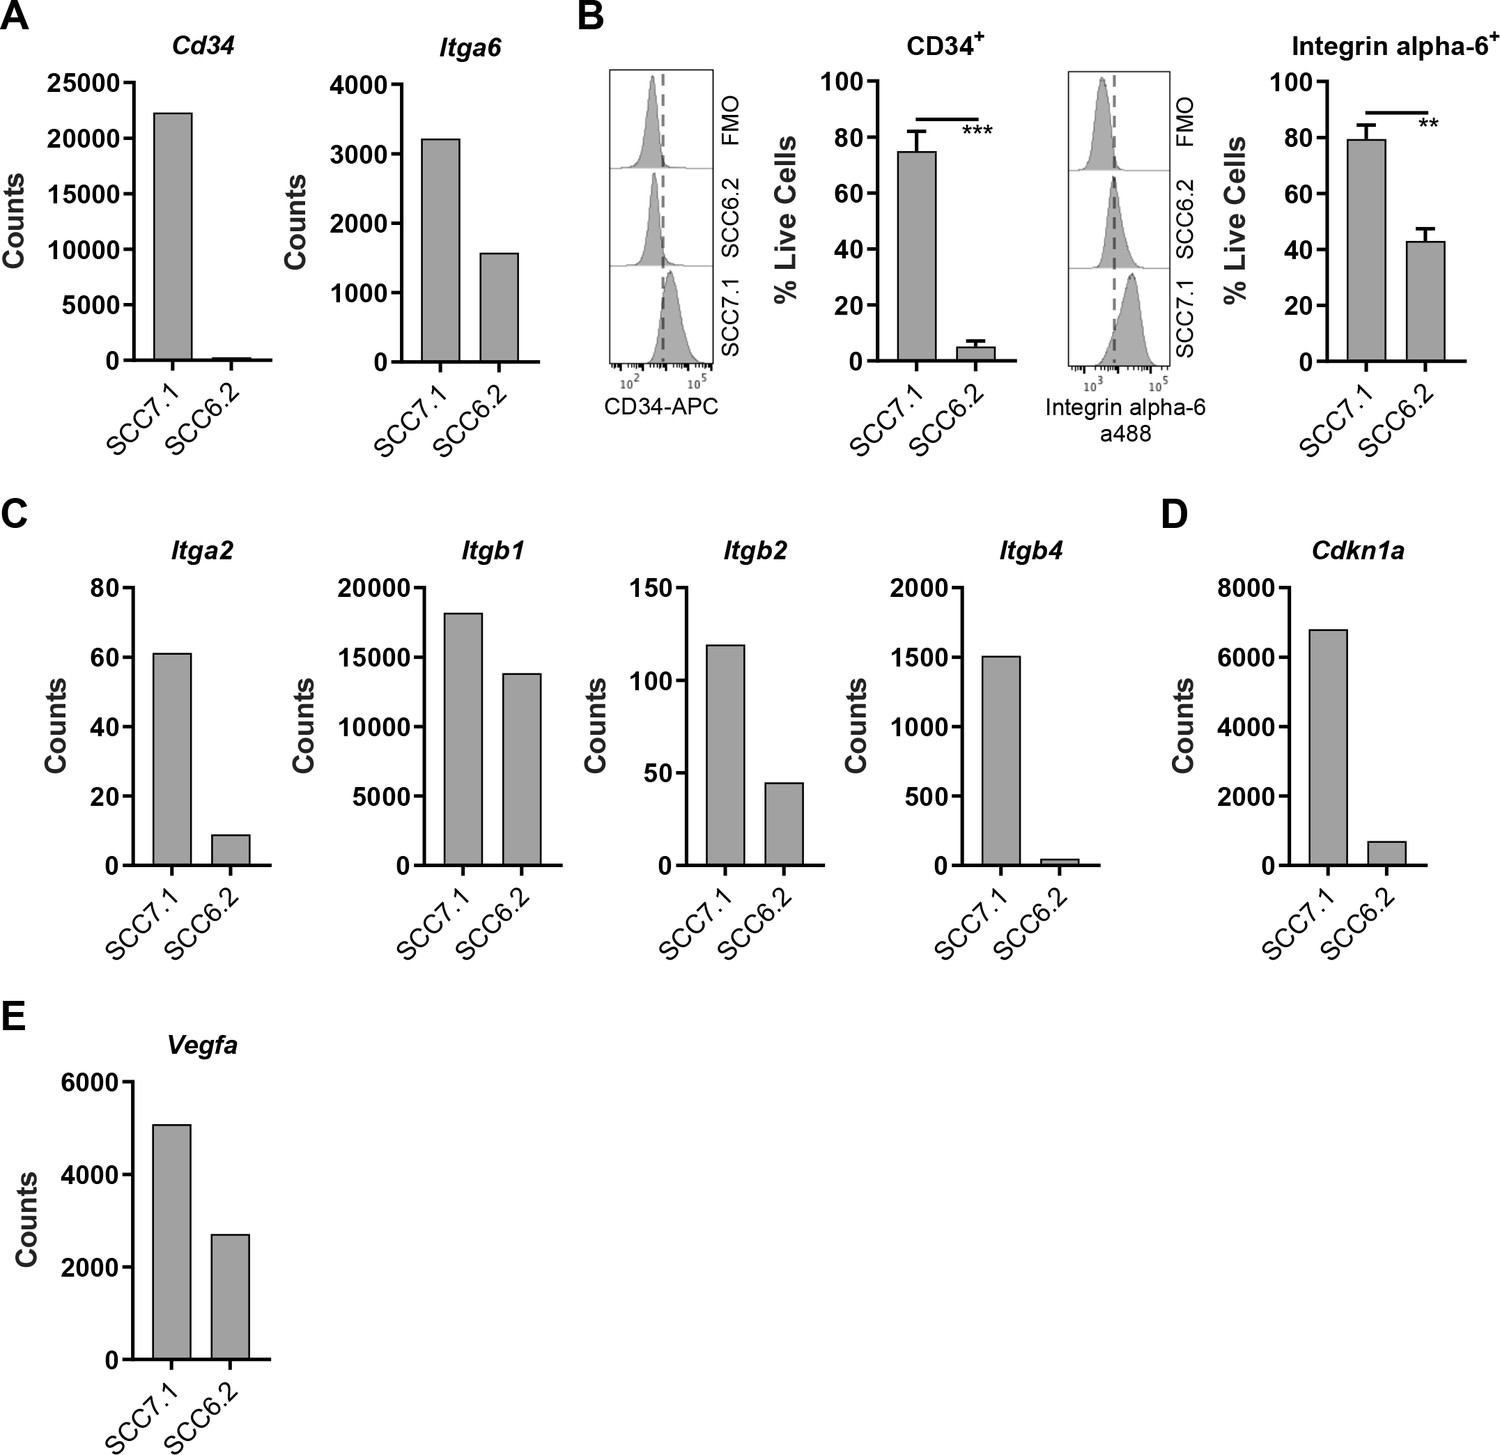
CD80+ SCC cells express markers associated with Cancer Stem Cells.
(A) Nanostring gene expression analysis using RNA isolated from SCC7.1 and SCC6.2 cells. (B) Histograms - representative flow cytometry histograms of fluorescent intensity in SCC7.1 and SCC6.2 cells stained with a combination of anti-CD34 APC and anti-integrin alpha-6 alexa488 conjugated antibodies. FMO control represented full stain minus the antibody of interest. Graphs – flow cytometry quantification of the percentage of live cells expressing either CD34 or integrin alpha-6. (C – E) Nanostring gene expression analysis using RNA isolated from SCC7.1 and SCC6.2 cells. Nanostring data normalised using nSolver software and represented as reporter probe counts. Flow cytometry data represented as mean + /- s.e.m. ***p≤0.001, **p≤0.01, unpaired two-tailed t-test.
-
Figure 3—source data 1
Nanostring gene expression analysis of SCC7.1 and SCC6.2 cells.
- https://cdn.elifesciences.org/articles/48092/elife-48092-fig3-data1-v1.xlsx
Figure 4
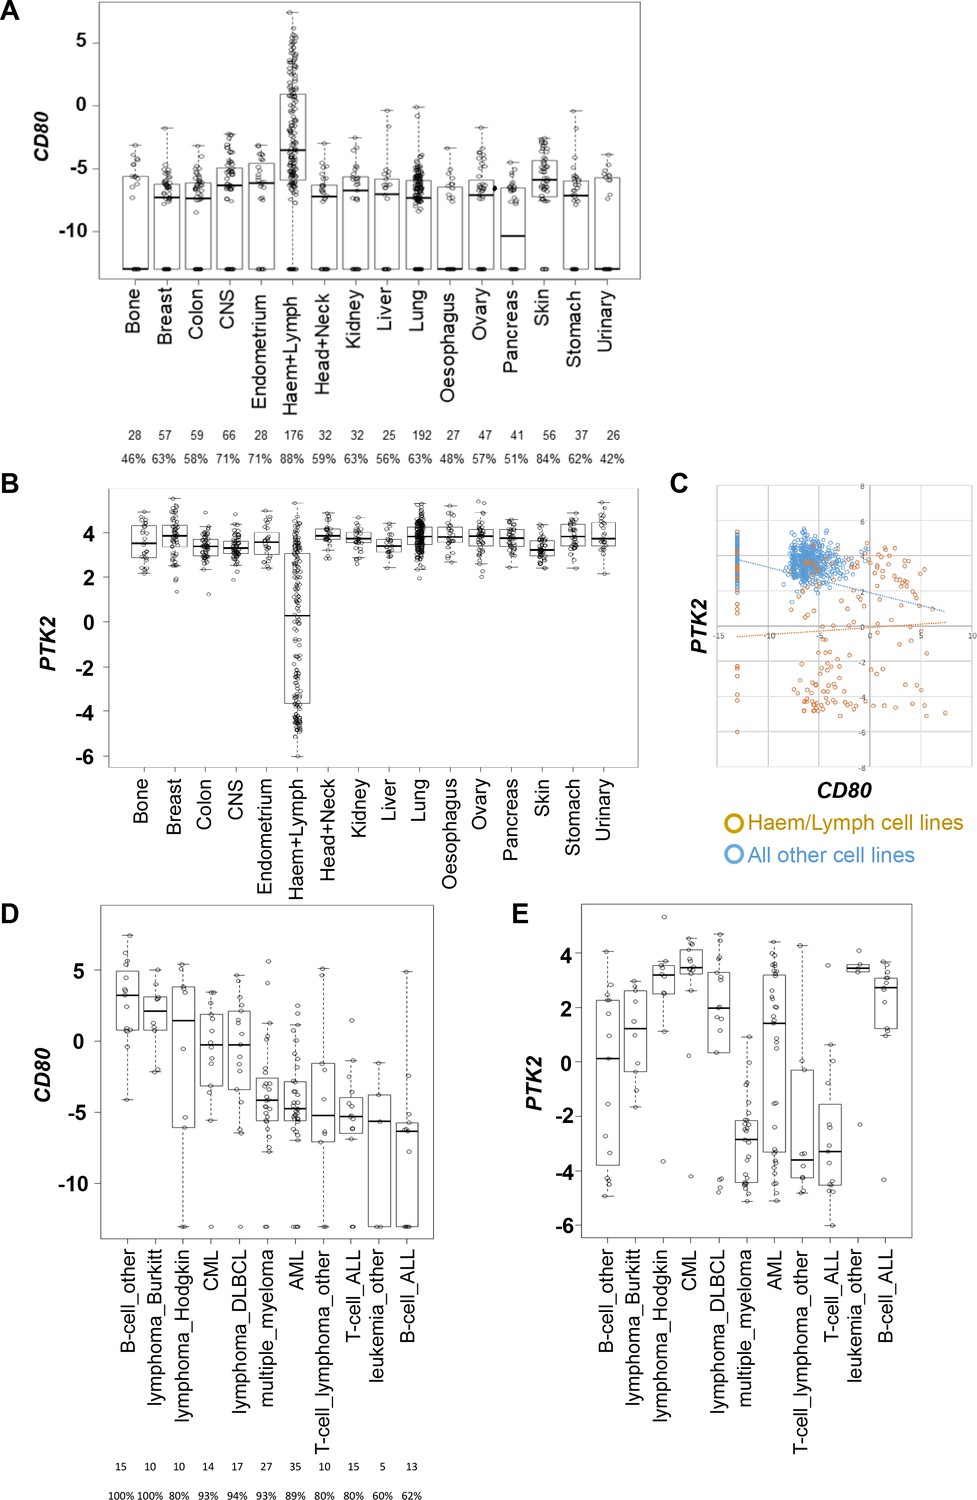
CD80 and PTK2 expression in human cancer cell lines.
(A) Analysis of CD80 expression in RNAseq datasets derived from human cancer cell lines. The number of cell lines from each tumor type is listed below along with the percentage positive for expression. (B) Analysis of PTK2 expression in the same datasets from human cancer cell lines. (C) Scatter plot of CD80 expression against PTK2 expression in all cell lines. (D) Analysis of CD80 expression in human cancer cell lines from different types of hematological malignancies. (E) Analysis of PTK2 expression in human cancer cell lines from different hematological malignancies.
Figure 5
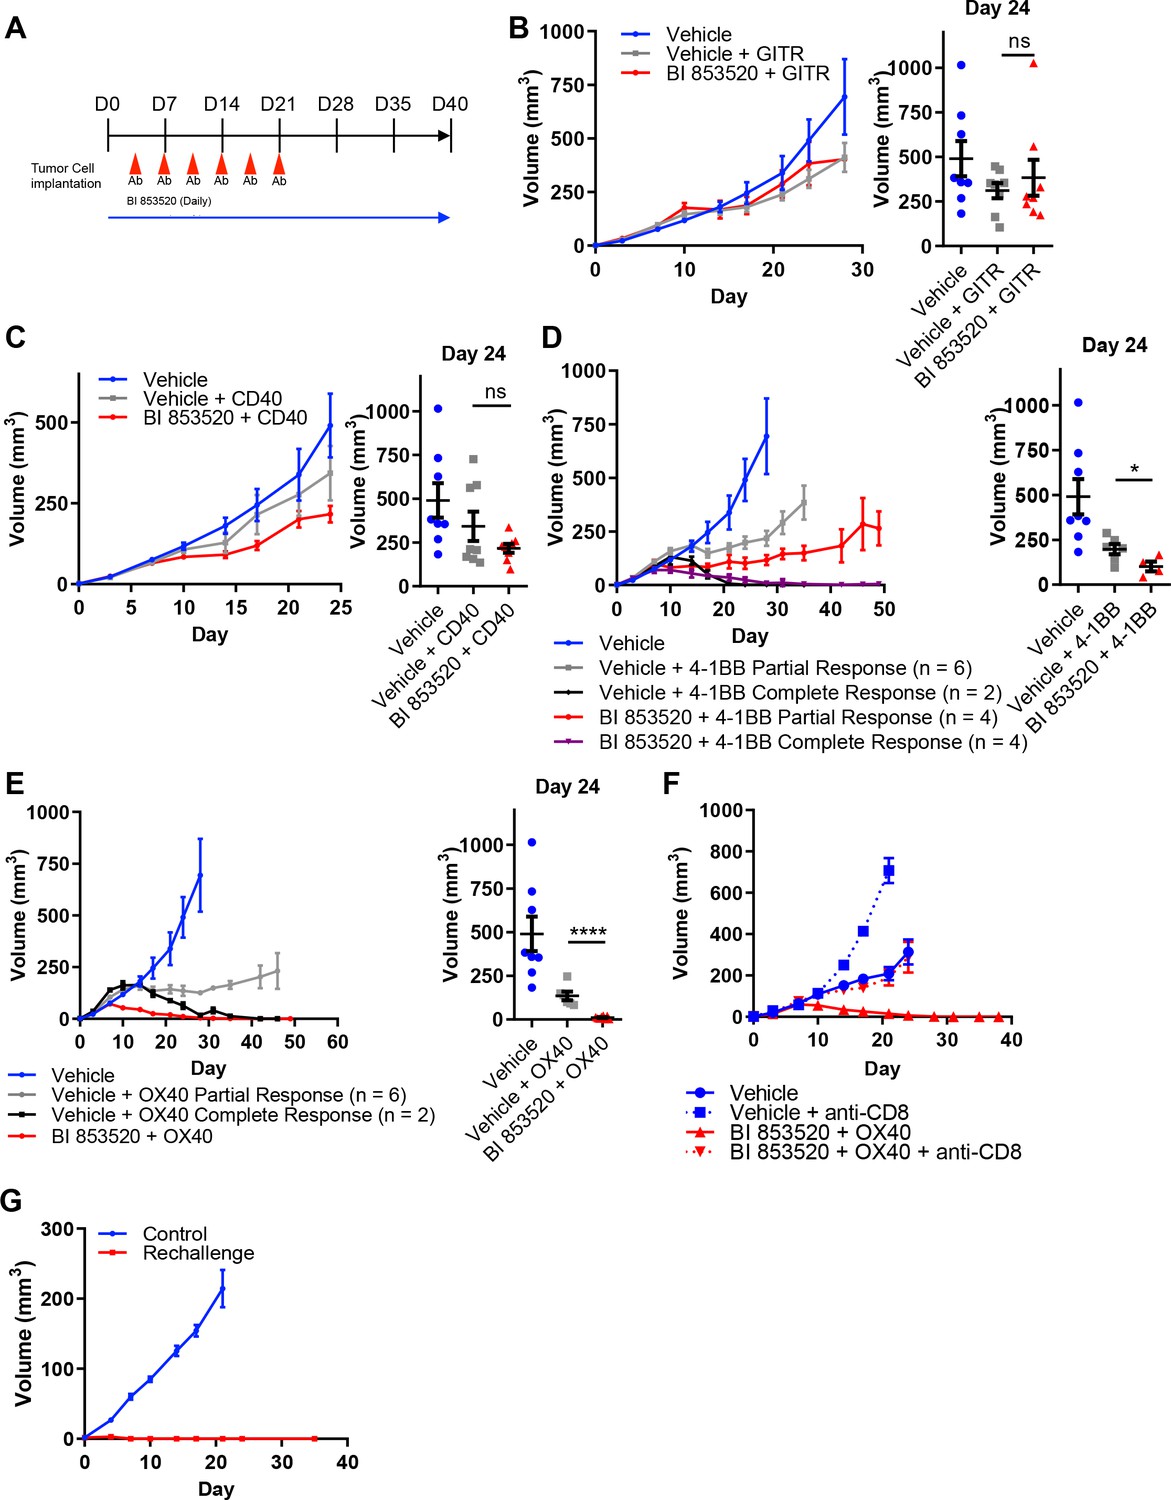
BI 853520 improves the response of SCC6.2 tumors to 4-1BB and OX40 agonistic antibodies.
(A) Dosing schedule. (B – E) Left - Subcutaneous growth of SCC6.2 tumors treated with either Vehicle or 50 mg/kg BI 853520 in combination with either 100 µg GITR, CD40, 4-1BB, or OX40 agonistic antibodies. Right - Comparison of tumor volume on day 24 post-implantation of tumor cells. Graph represents individual tumor measurements together with the mean + /- s.e.m. (F) Subcutaneous growth of SCC6.2 tumors treated with either Vehicle or BI 853520 + OX40 in combination with either isotype control or anti-CD8 T-cell depleting antibodies. (G) Subcutaneous growth of SCC6.2 tumors implanted into either naïve FVB mice (Control) or FVB mice from E in which treatment with BI 853520 + OX40 resulted in complete tumor regression and no tumor regrowth over a 2 month period off treatment (Rechallenge). (B – E) ns = not significant, *=p ≤ 0.05, ****=p ≤ 0.0001, unpaired t-test comparing immunotherapy to immunotherapy + BI 853520. Data represented as mean + /- s.e.m. n = 8–10 tumors per group.
Figure 6 with 7 supplements
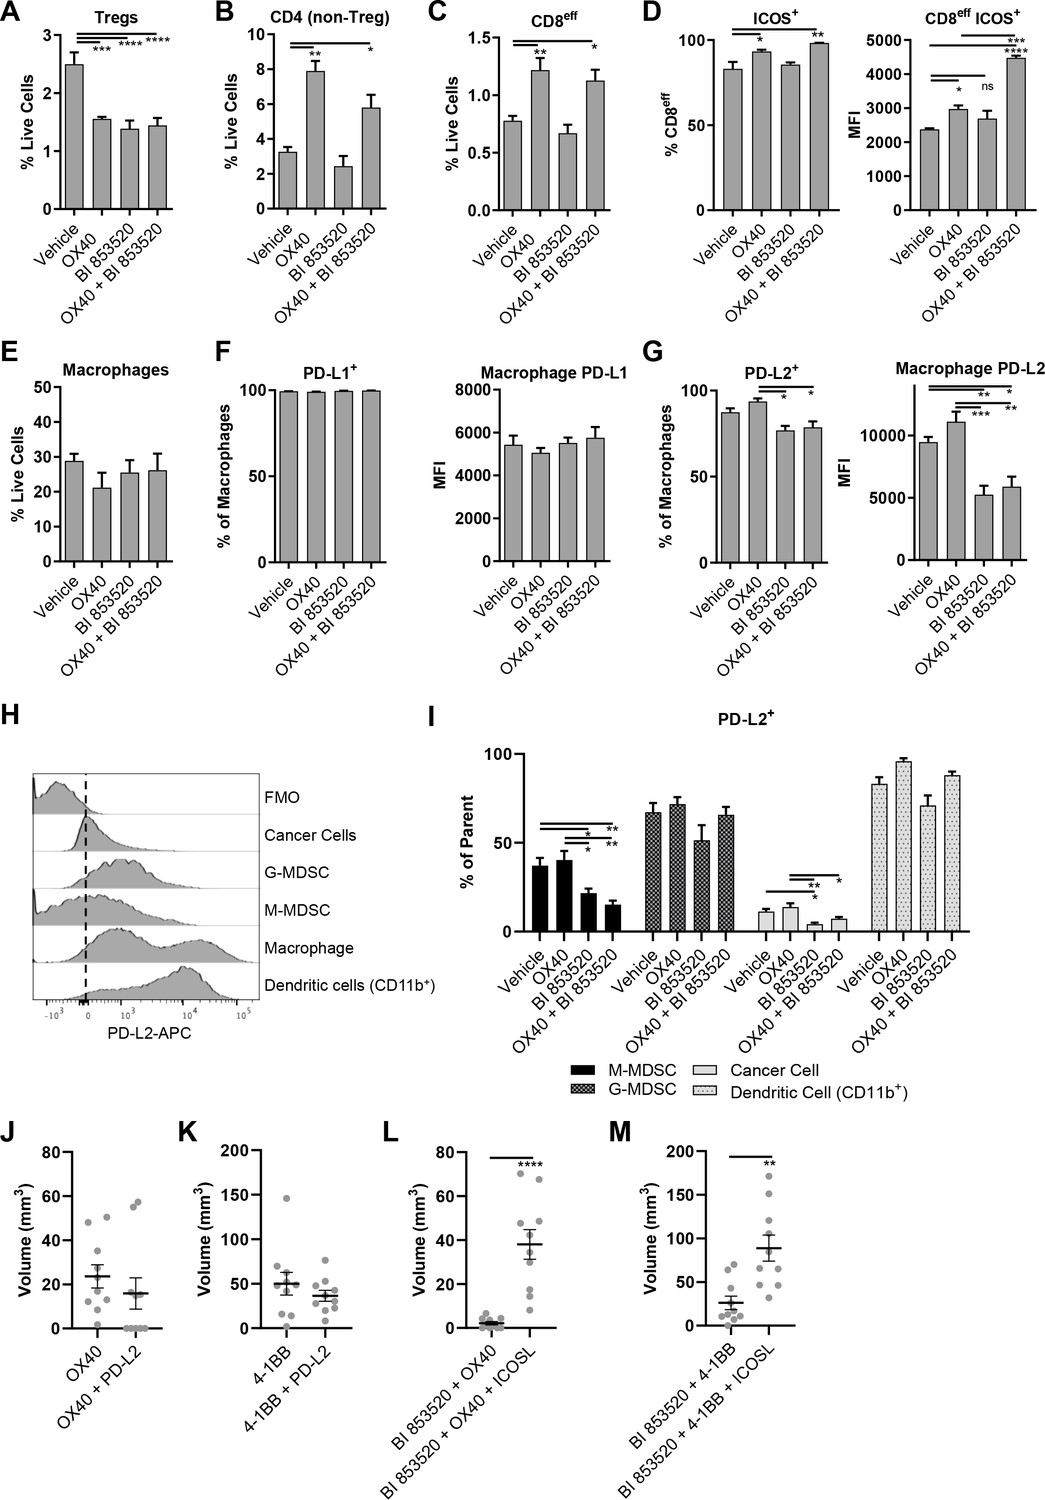
OX40 and BI 853520 display overlapping and distinct immune modulatory activity.
(A–C) Flow cytometry quantification of tumor infiltrating Tregs, CD4 (non-Treg) T-cells, and CD8eff T-cells. (D) Left – Flow cytometry quantification of the percentage of CD8eff T-cells expressing ICOS. Right - Flow cytometry quantification of the median fluorescent intensity (MFI) of ICOS expression on CD8eff T-cells. (E) Flow cytometry quantification of tumor infiltrating macrophages as a percentage of live cells. (F) Left - Flow cytometry quantification of the percentage of macrophages expressing PD-L1. Right - mean fluorescent intensity of PD-L1 expression on macrophages. (G) Left - Flow cytometry quantification of the percentage of macrophages expressing PD-L2. Right - mean fluorescent intensity of PD-L2 expression on macrophages. (H) Representative histogram of PD-L2 fluorescent intensity in cancer cells, G-MDSCs, M-MDSCs, Macrophages, and CD11b+Dendritic cells from a control sample stained with all antibodies. FMO is a fully stained samples except for PD-L2. (I) Flow cytometry quantification of the percentage of M-MDSCs, G-MDSCs, cancer cells, and dendritic cells positive for expression of PD-L2. (J) Comparison of subcutaneous tumor volume 21 days post-implantation of SCC6.2 cells. Tumors treated with either anti-OX40 or anti-OX40 + anti-PD-L2. (K) Comparison of subcutaneous tumor volume 21 days post-implantation of SCC6.2 cells. Tumors treated with either anti-4-1BB or anti-4-1BB + anti-PD-L2. (L) Comparison of subcutaneous tumor volume 21 days post-implantation of SCC6.2 cells. Tumors treated with either anti-OX40 or anti-OX40 + anti-ICOSL. (M) Comparison of subcutaneous tumor volume 21 days post-implantation of SCC6.2 cells. Tumors treated with either anti-4-1BB or anti-4-1BB + anti-ICOSL. (A - I) Data represented as mean + /- s.e.m. *=p ≤ 0.05, **=p ≤ 0.01, ***=p ≤ 0.001, ****=p ≤ 0.0001, ordinary one-way ANOVA with Tukey’s multiple comparison. n = 4–8 tumors per treatment condition. (J - M) Data represented as individual tumor measurements together with the mean + /- s.e.m. ***=p ≤ 0.001, unpaired nonparametric Mann-Whitney test. Dosing schedule identical to Figure 5A. n = 10 tumors per group.
Figure 6—figure supplement 1
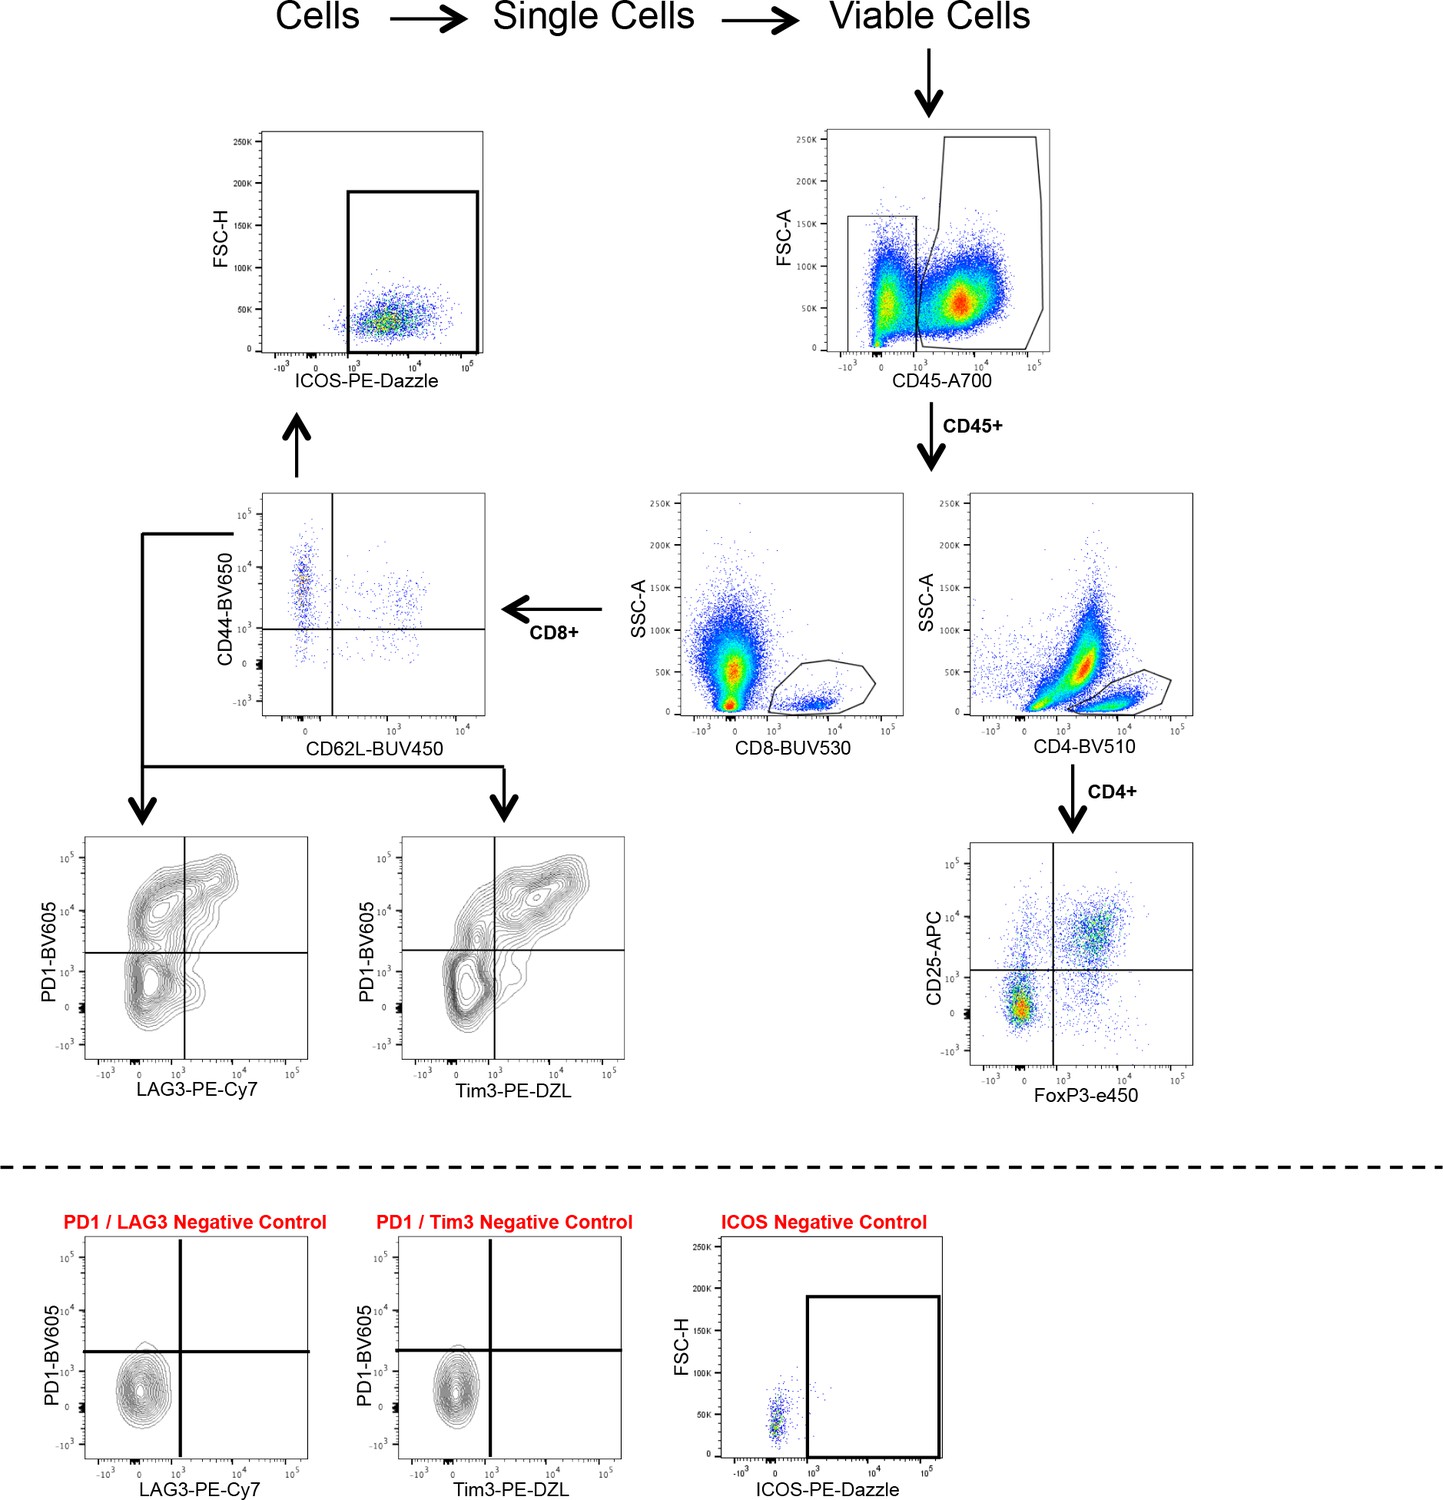
Flow cytometry T-cell gating strategy.
Figure 6—figure supplement 2
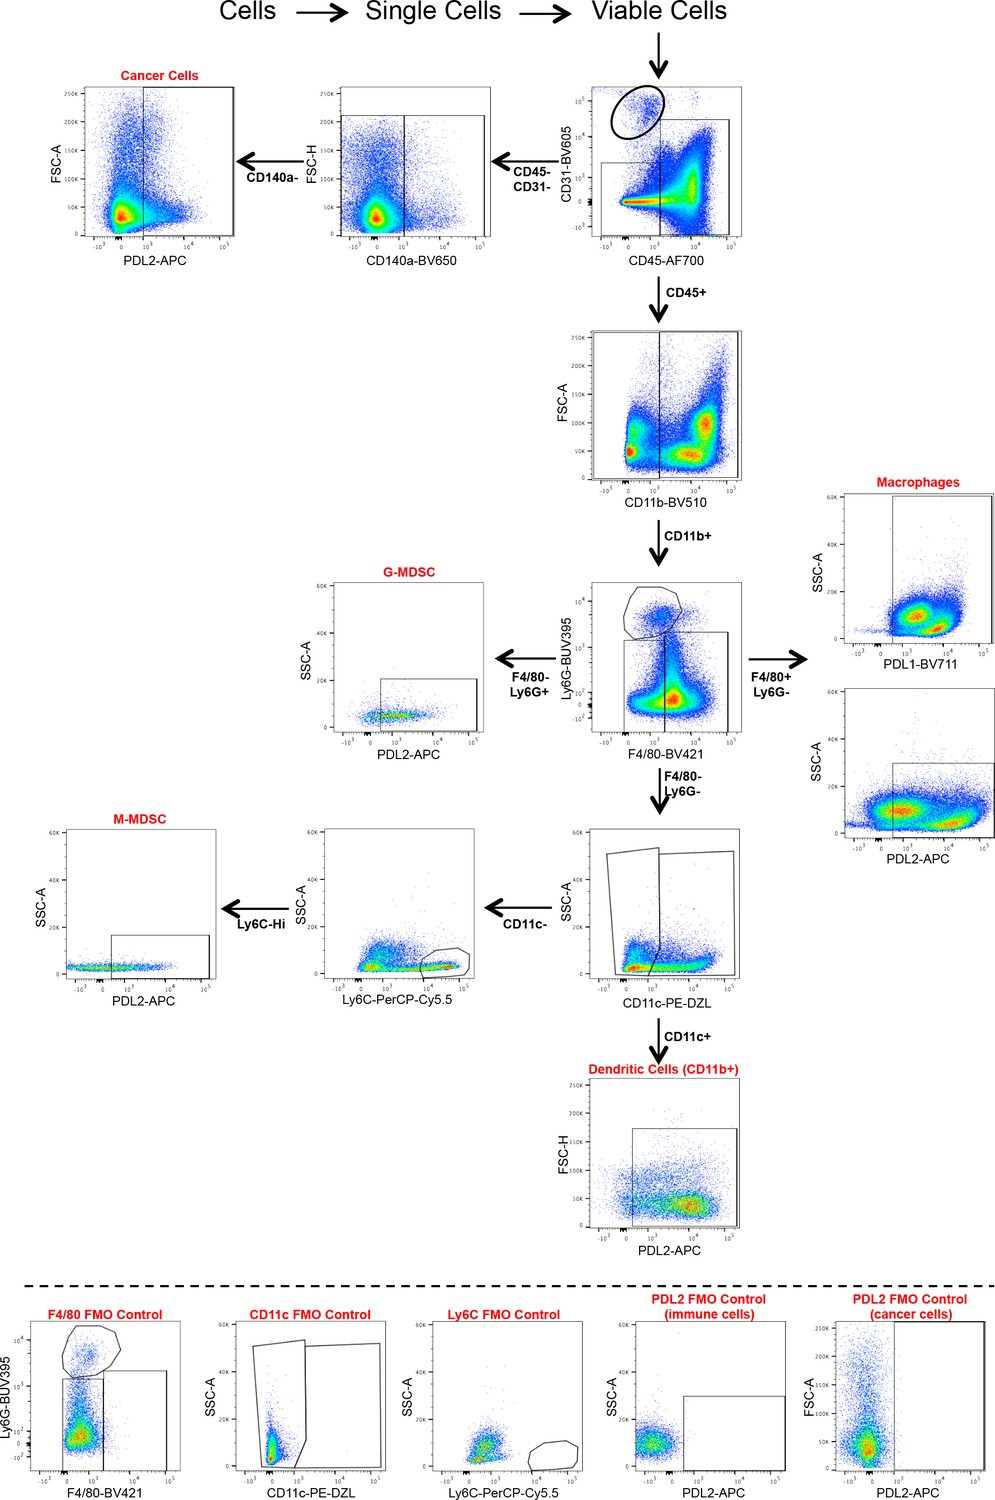
Flow cytometry myeloid cell gating strategy.
Figure 6—figure supplement 3
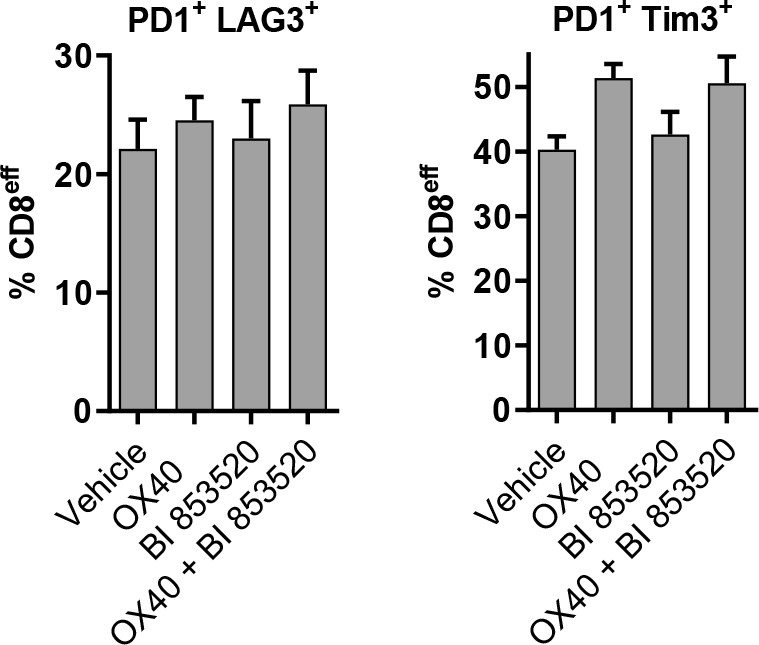
Expression of markers associated with T-cell exhaustion of CD8eff T-cells in SCC6.2 tumors treated with either Vehicle, OX40, BI 853520 or OX40 + BI 853520.
Flow cytometry quantification of the percentage of CD8eff T-cells positive for expression of PD-1/LAG3 (left) and PD-1/Tim3 (right).
Figure 6—figure supplement 4
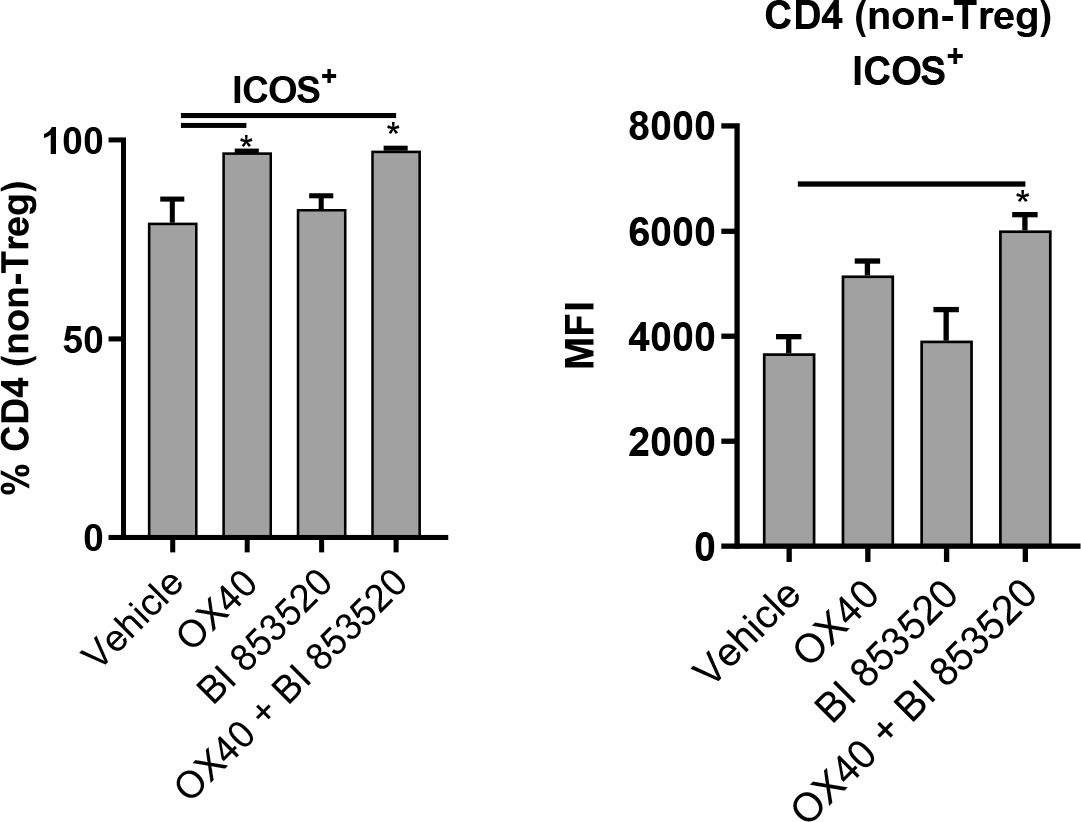
OX40 and OX40 + BI 853520 treatment enhances ICOS expression on CD4 non-Treg cells in SCC6.2 tumors.
Left – Flow cytometry quantification of the percentage of CD4+ non-Treg cells positive for expression of ICOS. Right – Flow cytometry quantification of the median fluorescent intensity (MFI) of ICOS expression on ICOS+ CD4+ non-Treg cells. Data represented as mean + /- s.e.m. *p≤0.01, ordinary one-way ANOVA with Tukeys multiple comparison. n = 3.
Figure 6—figure supplement 5
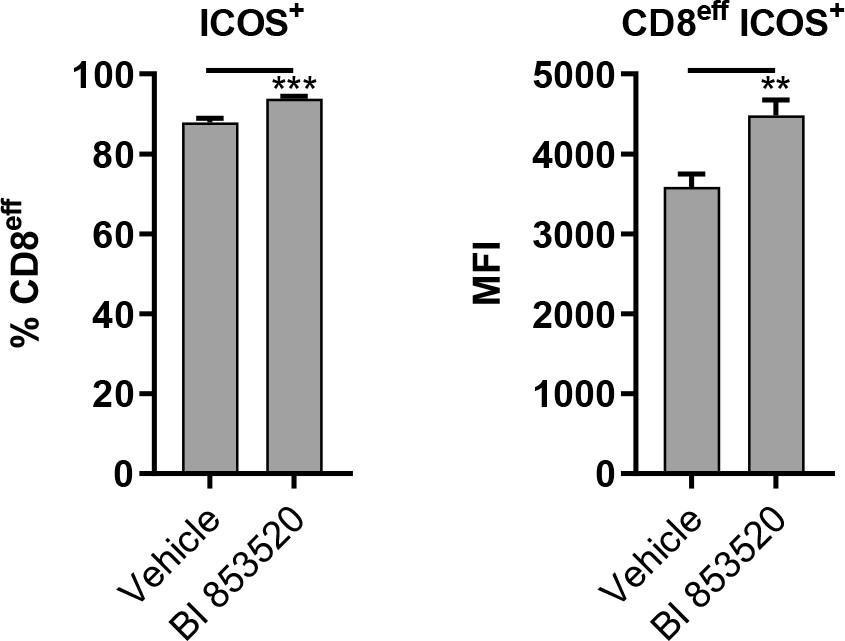
BI 853520 treatment enhances ICOS expression on CD8eff T-cells in SCC7.1 tumors.
Left – Flow cytometry quantification of the percentage of CD8eff T-cells positive for expression of ICOS. Right – Flow cytometry quantification of the median fluorescent intensity (MFI) of ICOS expression on ICOS+ CD8eff T-cells. Data represented as mean + /- s.e.m. *p≤0.01, ordinary one-way ANOVA with Tukeys multiple comparison. n = 3.
Figure 6—figure supplement 6
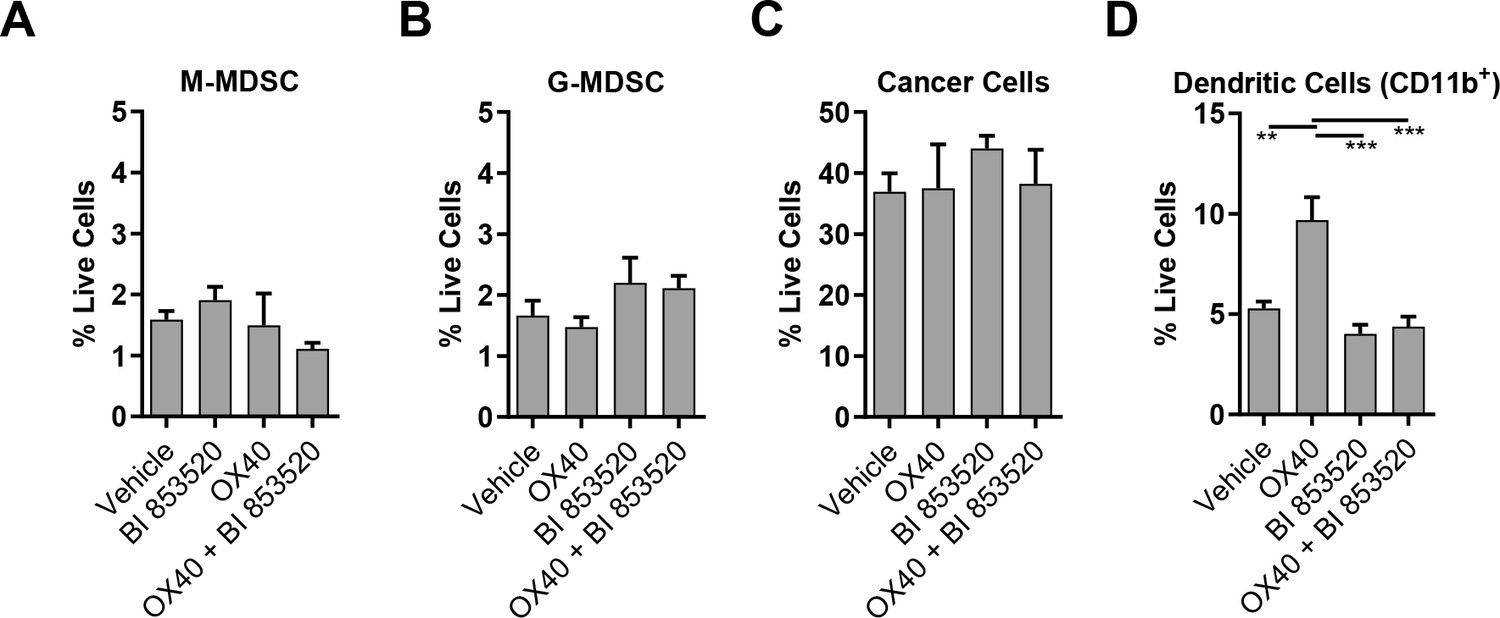
Frequency of immune cell populations in SCC6.2 tumors treated with either Vehicle, OX40, BI 853520 or OX40 + BI 853520.
(A – D) Flow cytometry quantification of tumor infiltrating M-MDSCs, G-MDSCs, Cancer cells, and CD11b+Dendritic Cells. Data represented as mean + /- s.e.m. **=p ≤ 0.01, ***=p ≤ 0.001, ordinary one-way ANOVA with Tukey’s multiple comparison. n = 4 tumors per condition.
Figure 6—figure supplement 7
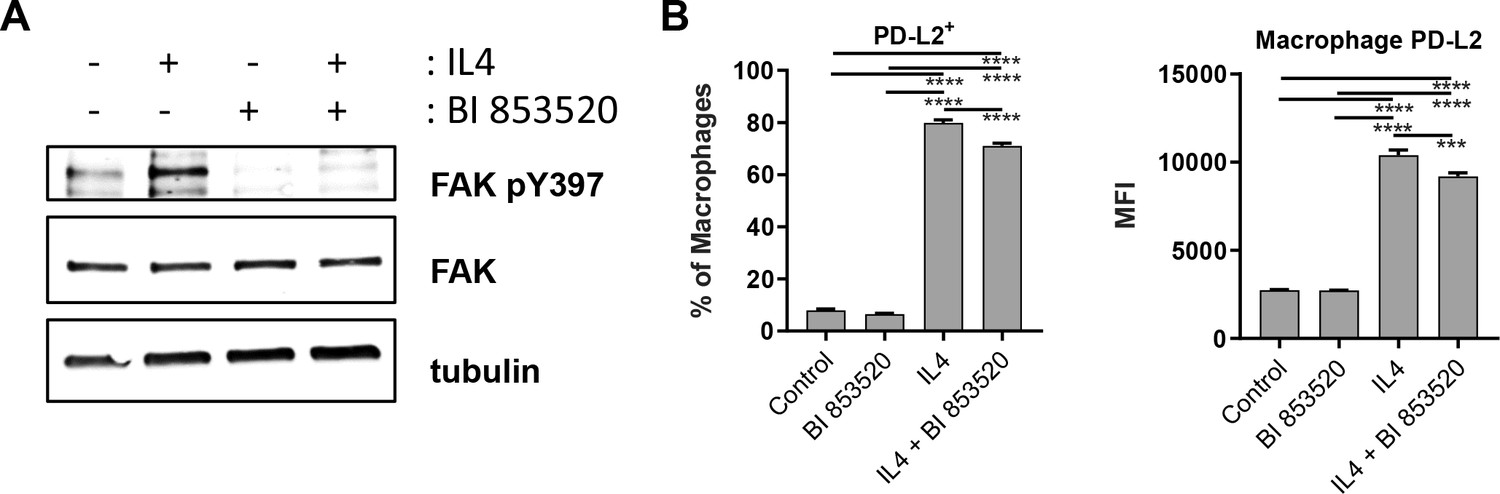
BI 853520 partially inhibits macrophage expression of PD-L2 following stimulation with IL4.
(A) Representative western blot of FAK pY397, total FAK, and tubulin levels in whole cell lysates prepared from bone marrow-derived macrophages treated with either 100 nM BI 853520, 1 ng/ml interleukin-4 (IL4), or 100 nM BI 853520 + 1 ng/ml IL4. (B) Left – flow cytometry quantification of the percentage of bone marrow-derived macrophages expressing PD-L2 following either treatment with 100 nM BI 853520, 1 ng/ml interleukin-4 (IL4), or 100 nM BI 853520 + 1 ng/ml IL4. Right – flow cytometry quantification of the median fluorescence intensity (MFI) of PD-L2 expression on bone marrow-derived macrophages following treatment with 100 nM BI 853520, 1 ng/ml interleukin-4 (IL4), or 100 nM BI 853520 + 1 ng/ml IL4. Data represented as mean + /- s.e.m. ***=p ≤ 0.001, ****=p ≤ 0.0001, ordinary one-way ANOVA with Tukey’s multiple comparison. n = 6 samples per condition.
Figure 7
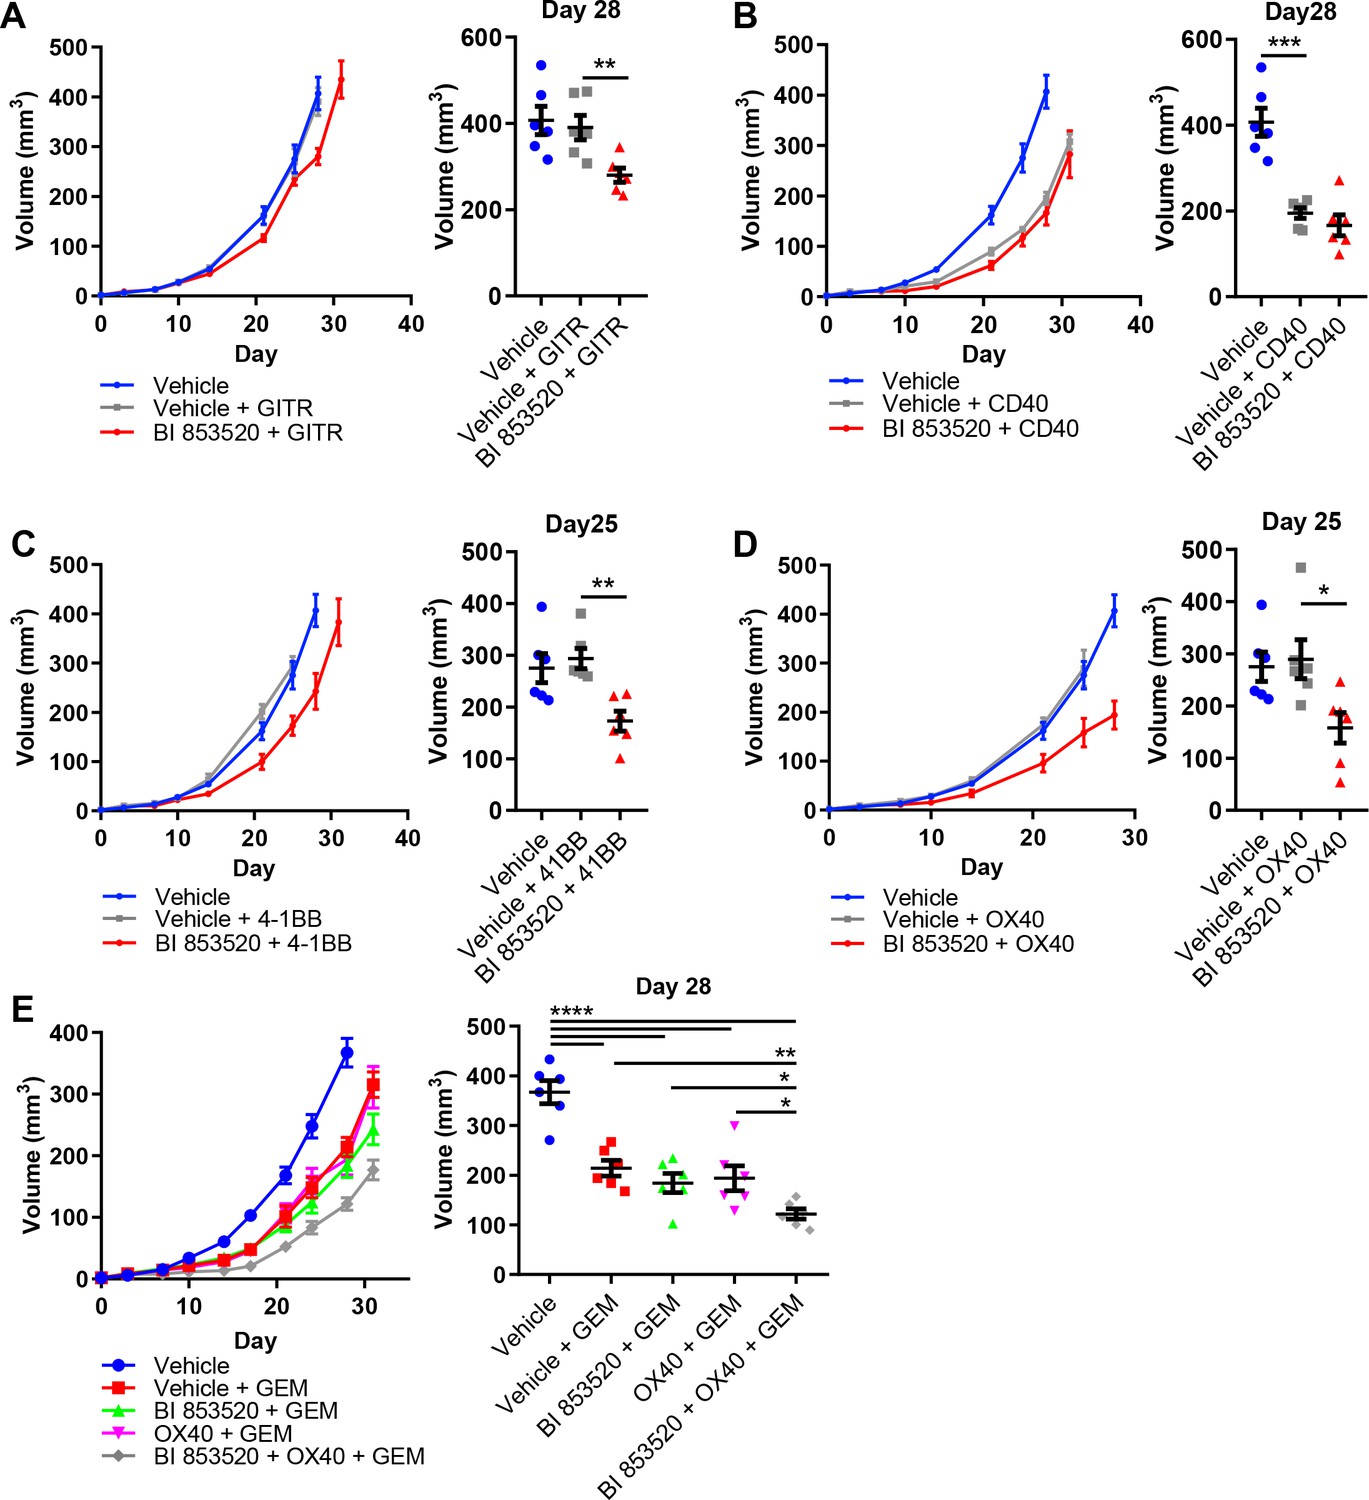
BI 853520 renders Panc47 tumors responsive to 4-1BB and OX40 agonistic antibodies.
(A – D) Left - Subcutaneous growth of Panc47 tumors treated with either Vehicle or 50 mg/kg BI 853520 in combination with either 100 µg GITR, CD40, 4-1BB, or OX40 agonistic antibodies. Right - Comparison of tumor volume on day 25/28 post-implantation of tumor cells. Graph represents individual tumor measurements together with the mean + /- s.e.m. Dosing schedule identical to Figure 5A. (E) Left - Subcutaneous growth of Panc47 tumors treated with either Vehicle, Vehicle + 100 mg/kg Gemcitabine (GEM), 50 mg/kg BI 853520 + GEM, OX40 + GEM, or BI 853520 + OX40 + GEM. Right - Comparison of tumor volume on day 28 post-implantation of tumor cells. Graph represents individual tumor measurements together with the mean + /- s.e.m. Dosing schedule identical to Figure 5A. GEM dosed twice weekly I.P. for the duration of the experiment starting 3 days post-implantation of cancer cells. *=p ≤ 0.05, **=p ≤ 0.01, ***=p ≤ 0.001, ****=p ≤ 0.0001, unpaired t-test. n = 6 tumors per group.
Additional files
-
Supplementary file 1
T-cell flow cytometry panel 1.
- https://cdn.elifesciences.org/articles/48092/elife-48092-supp1-v1.pptx
-
Supplementary file 2
T-cell flow cytometry panel 2.
- https://cdn.elifesciences.org/articles/48092/elife-48092-supp2-v1.pptx
-
Supplementary file 3
Non-T-cell flow cytometry panel.
- https://cdn.elifesciences.org/articles/48092/elife-48092-supp3-v1.pptx
-
Supplementary file 4
Markers used to identify tumor infiltrating cell populations.
- https://cdn.elifesciences.org/articles/48092/elife-48092-supp4-v1.pptx
-
Transparent reporting form
- https://cdn.elifesciences.org/articles/48092/elife-48092-transrepform-v1.pdf
Download links
A two-part list of links to download the article, or parts of the article, in various formats.
Downloads (link to download the article as PDF)
Open citations (links to open the citations from this article in various online reference manager services)
Cite this article (links to download the citations from this article in formats compatible with various reference manager tools)
T-cell co-stimulation in combination with targeting FAK drives enhanced anti-tumor immunity
eLife 9:e48092.
https://doi.org/10.7554/eLife.48092


