Cryo-EM structures of the human glutamine transporter SLC1A5 (ASCT2) in the outward-facing conformation
- Pfizer Inc, United States
- University of Oxford, United Kingdom
Figures
Figure 1 with 5 supplements
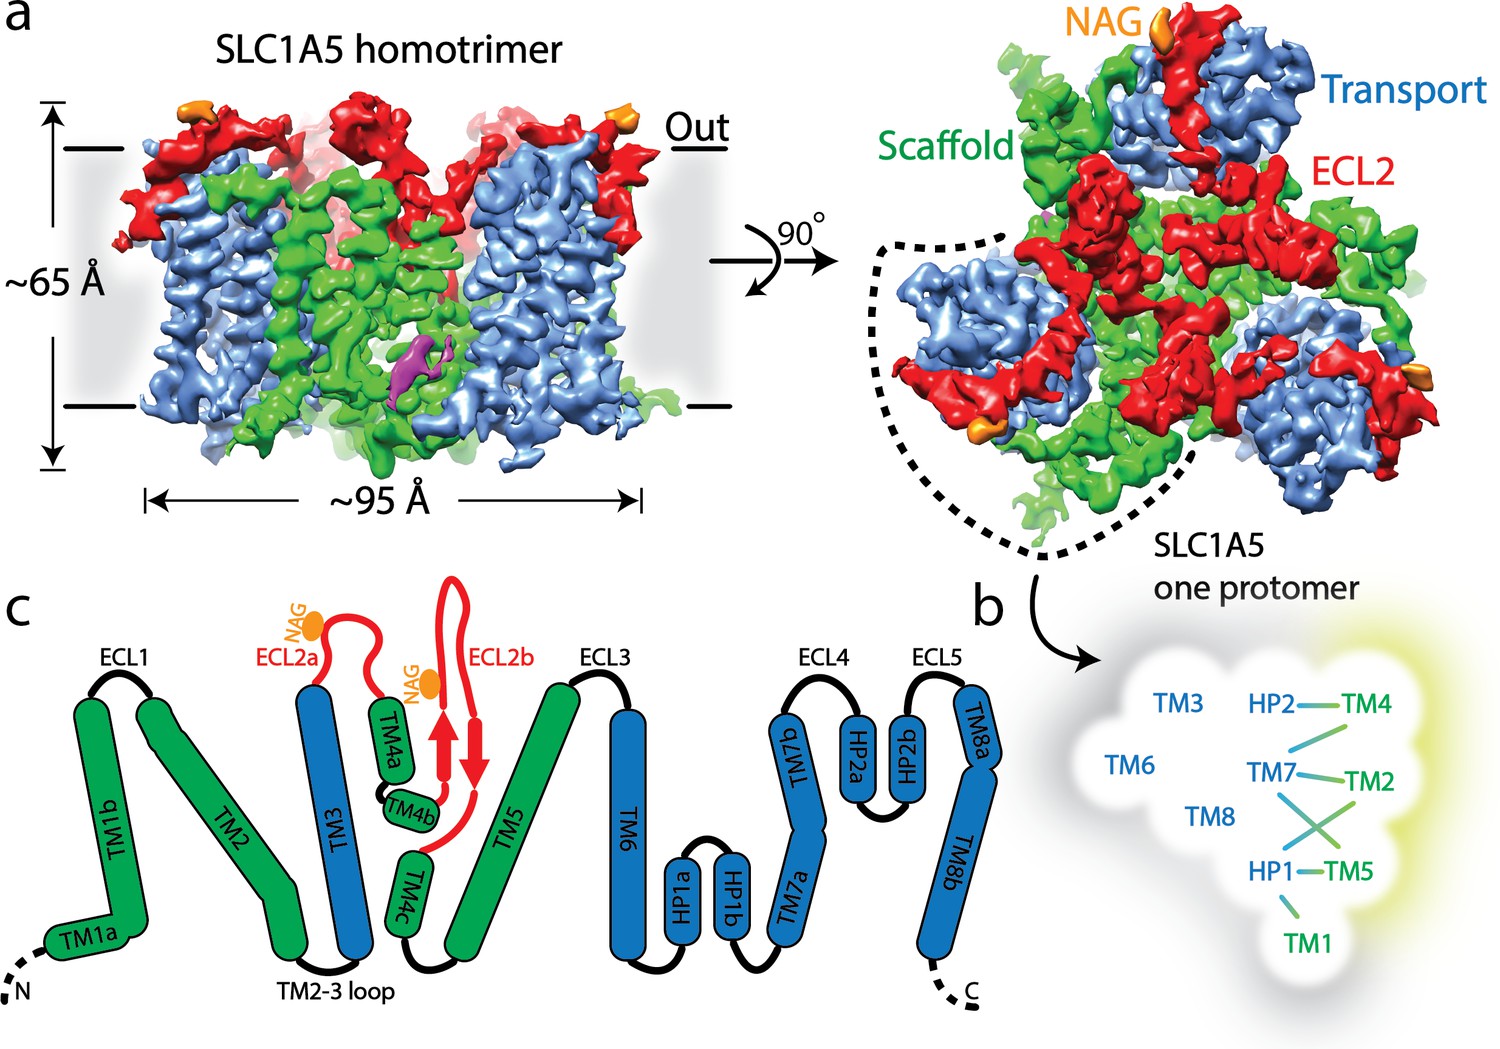
Cryo-EM structure of human SLC1A5.
(a) A density map of SLC1A5 homotrimer viewed from the side of the membrane (left) and the extracellular face (right) highlighting the scaffold domain (green), transport domain (navy), ECL2 (red) and N-acetyl-D-glucosamine (NAG, in orange). The density assigned to CHS is colored in magenta. (b) Micelle/membrane and trimerization interfaces are highlighted in gray and wheat, respectively. Interactions between transport and scaffold domains are illustrated with lines. (c) A schematic representation of the domains present in human SLC1A5. The N-linked glycosylation sites are indicated by orange circle. Dashed lines represent residues disordered in the structure.
Figure 1—figure supplement 1

SLC1A5 protein purification, functional assays in cells and proteoliposomes and negative staining.
(a) Uptake of [14C]-glutamine in HAP1 SLC1A5KO cells or SLC1A5KO cells transiently transfected with pcDNA3 vector containing the indicated sequence in the presence (solid bar) or absence (open bar) of sodium chloride. (b), (c) Uptake of [3H]-L-glutamine by purified SLC1A5 reconstituted in proteoliposomes. Transport was started by the addition of 50 μM L-glutamine/[3H]-L-glutamine (100 dpm/pmole) to SLC1A5 proteoliposomes in the presence (▪) or absence (□) of 100 mM external sodium chloride. (b) Internal proteoliposome buffer contained 10 mM glutamine and uptake was measured at the indicated times. The experiment was performed with triplicates at each time point; error bars represent standard deviation. (c) Internal buffer contained either low internal glutamine (0 mM or 0.1 mM) or 10 mM glutamine and uptake was measured at 90 min. The graphs are means of three independent experiments performed in triplicate. Error bars represent the s.e.m. Similarly prepared SLC1A5 in proteoliposomes showed [3H]-glutamine efflux in the presence of external (assay buffer) glutamate and NaCl (Oppedisano et al., 2007). (d), (e) Size-exclusion chromatography (Superose 6 10/300 Increase filtration column) of SLC1A5 and its complex with cKM4012 (Fab). The peak fraction was examined by SDS-polyacrylamide gel electrophoresis (SDS-PAGE). (f) Raw micrograph of SLC1A5-cKM4012 (Fab) complex by negative-stain electron microscopy. (g) 2D-class averages of particles from negative-stain electron microscopy of SLC1A5-cKM4012 (Fab) complex. Signals corresponding to the SLC1A5 and Fabs are highlighted.
Figure 1—figure supplement 2
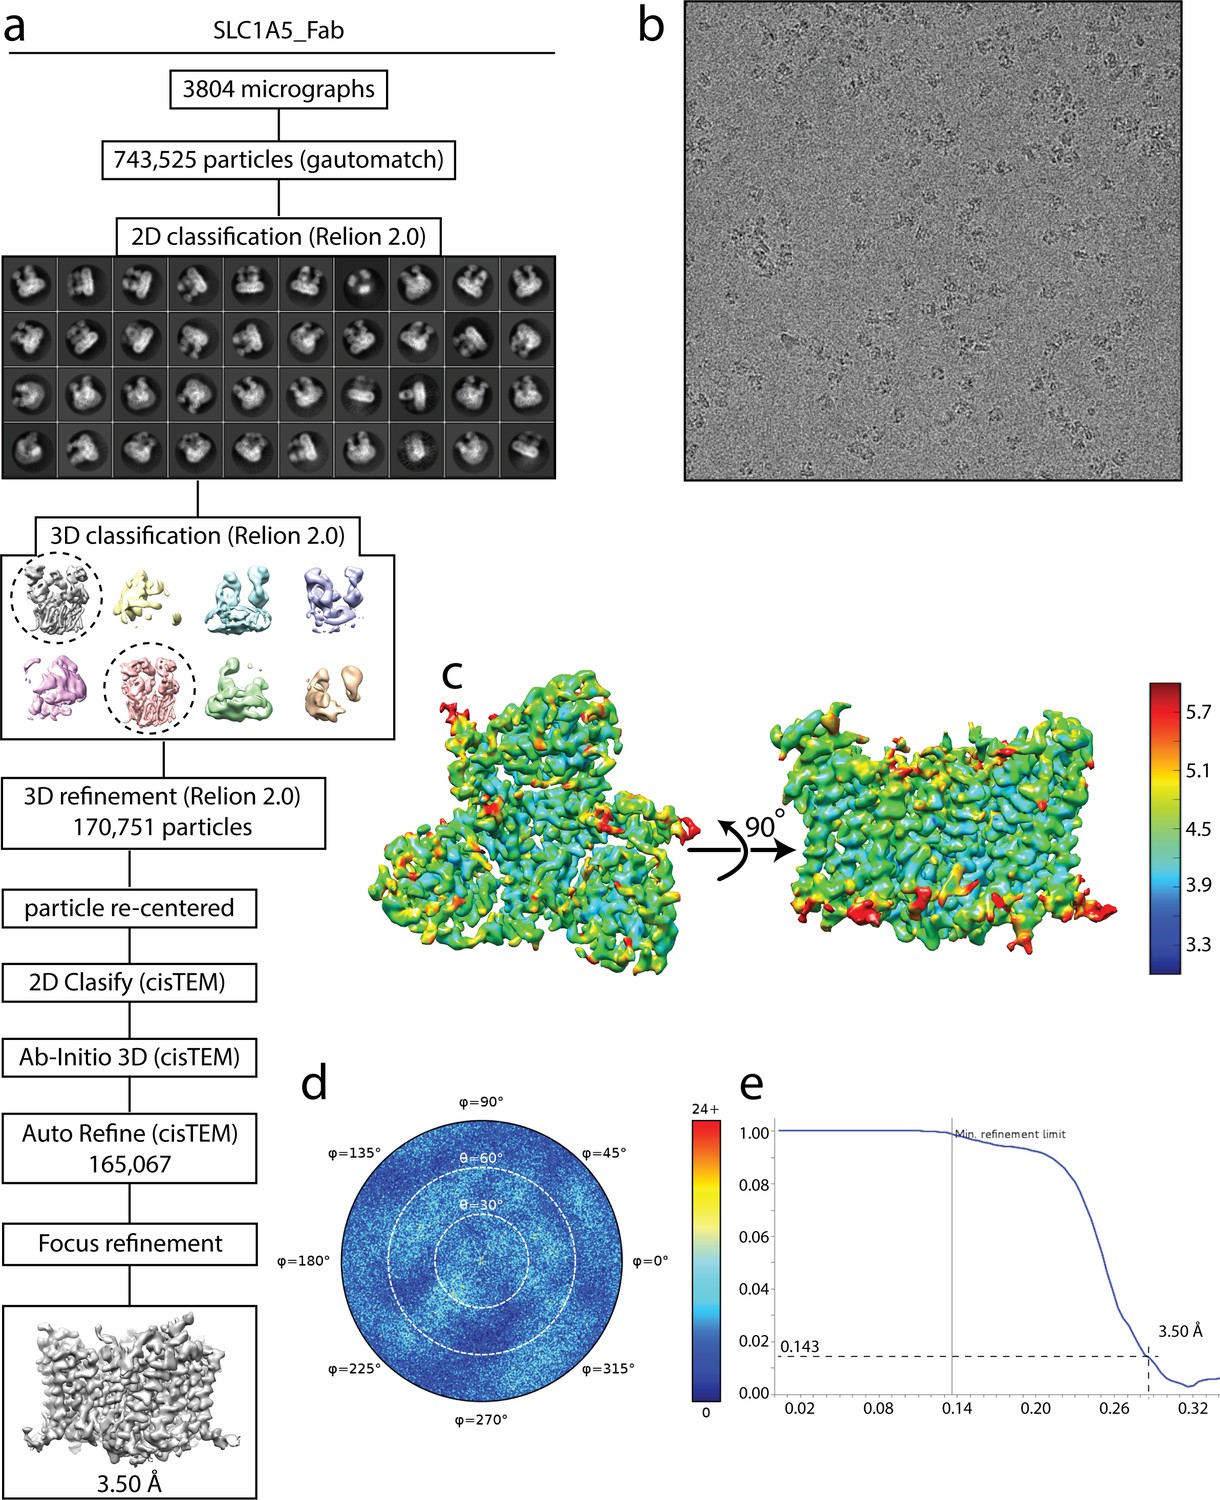
Cryo-EM analysis of SLC1A5-cKM4012 (Fab) complex.
(a) Flow chart of the cryo-EM data processing procedure. Details can be found in the Materials and methods. (b) A representative cryo-EM micrograph. (c) Local resolution of the map estimated using the ResMap program and colored as indicated. (d) Angular orientation distribution of the particles used in the final reconstruction. The particle distribution is indicated by different color shades. (e) Fourier shell correlation (FSC) curve of the structure with FSC as a function of resolution using cisTEM output. The resolution is ~3.5 Å at the FSC cutoff of 0.143. A thin vertical line indicates that only spatial frequencies to 1/ (7.8 Å) are used to determine particle alignment parameters during refinement in cisTEM.
Figure 1—figure supplement 3
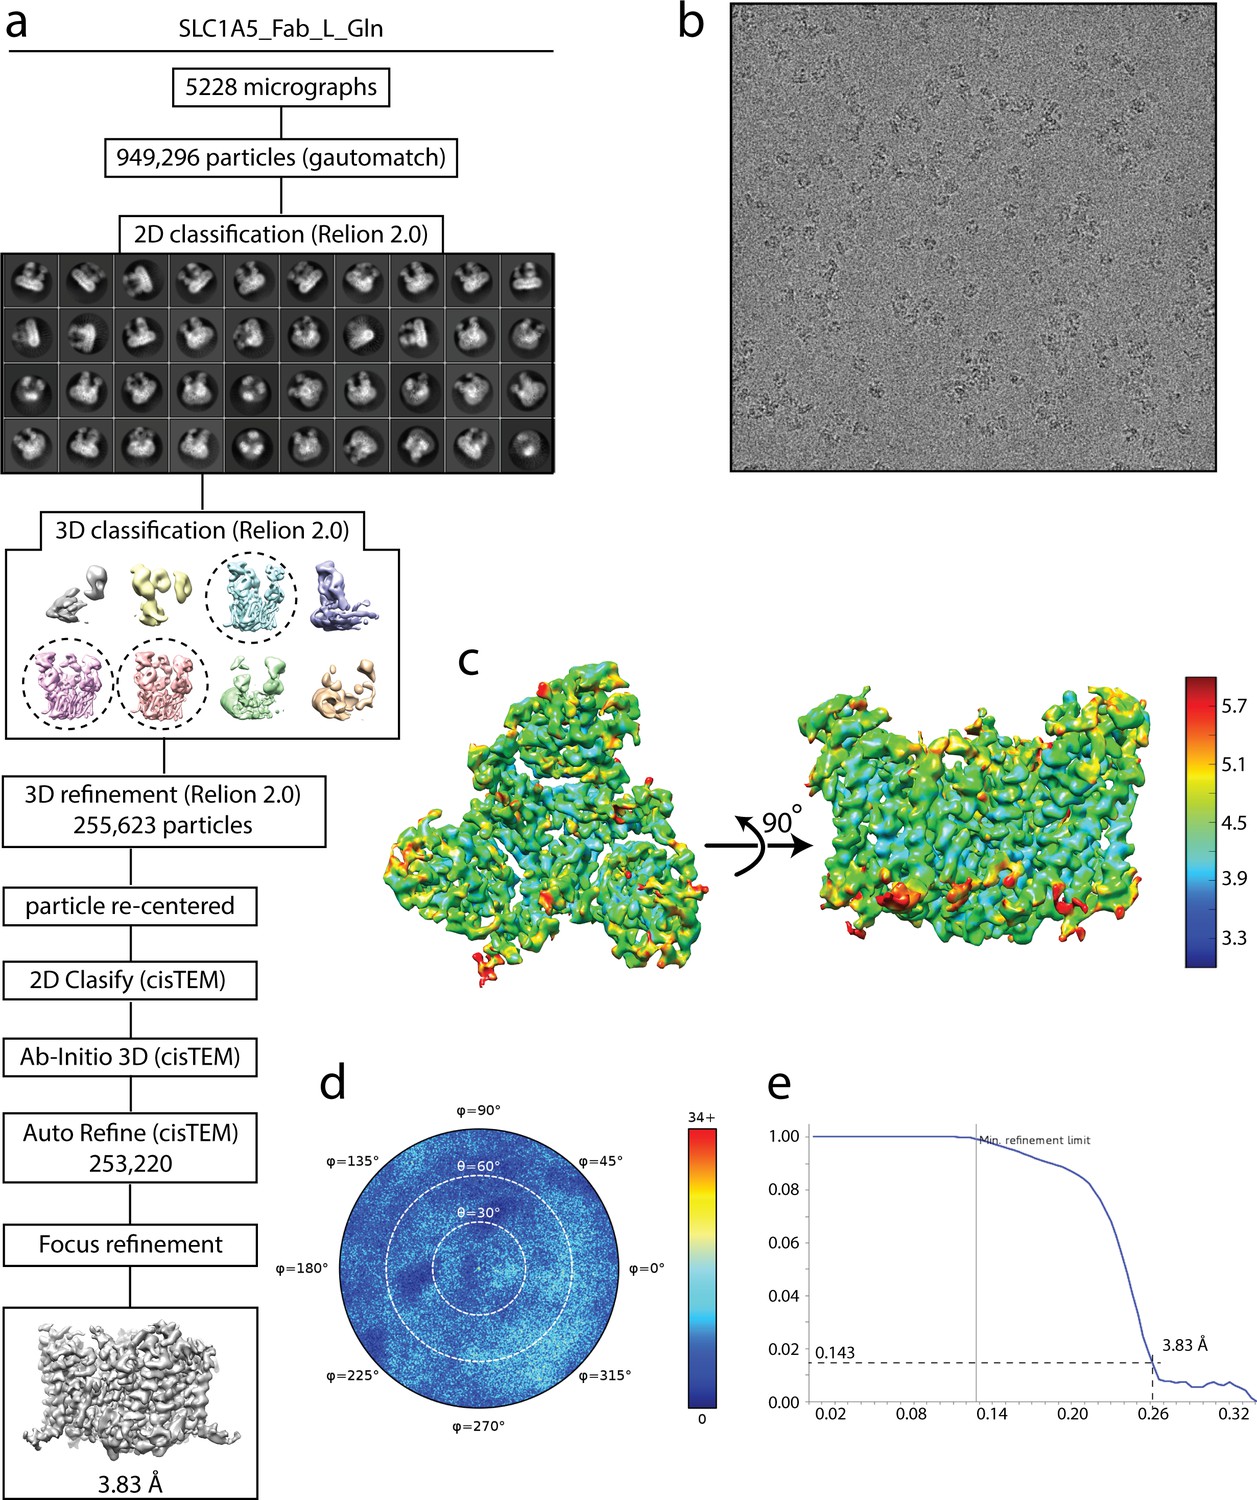
Cryo-EM analysis of SLC1A5-cKM4012 (Fab) complex in the presence of L-glutamine.
(a) Flow chart of the cryo-EM data processing procedure. Details can be found in the Materials and methods. (b) A representative cryo-EM micrograph. (c) Local resolution of the map estimated using the ResMap program and colored as indicated. (d) Angular orientation distribution of the particles used in the final reconstruction. The particle distribution is indicated by different color shades. (e) Fourier shell correlation (FSC) curve of the structure with FSC as a function of resolution using cisTEM output. The resolution is ~3.8 Å at the FSC cutoff of 0.143. A thin vertical line indicates that only spatial frequencies to 1/ (7.8 Å) are used to determine particle alignment parameters during refinement in cisTEM.
Figure 1—figure supplement 4
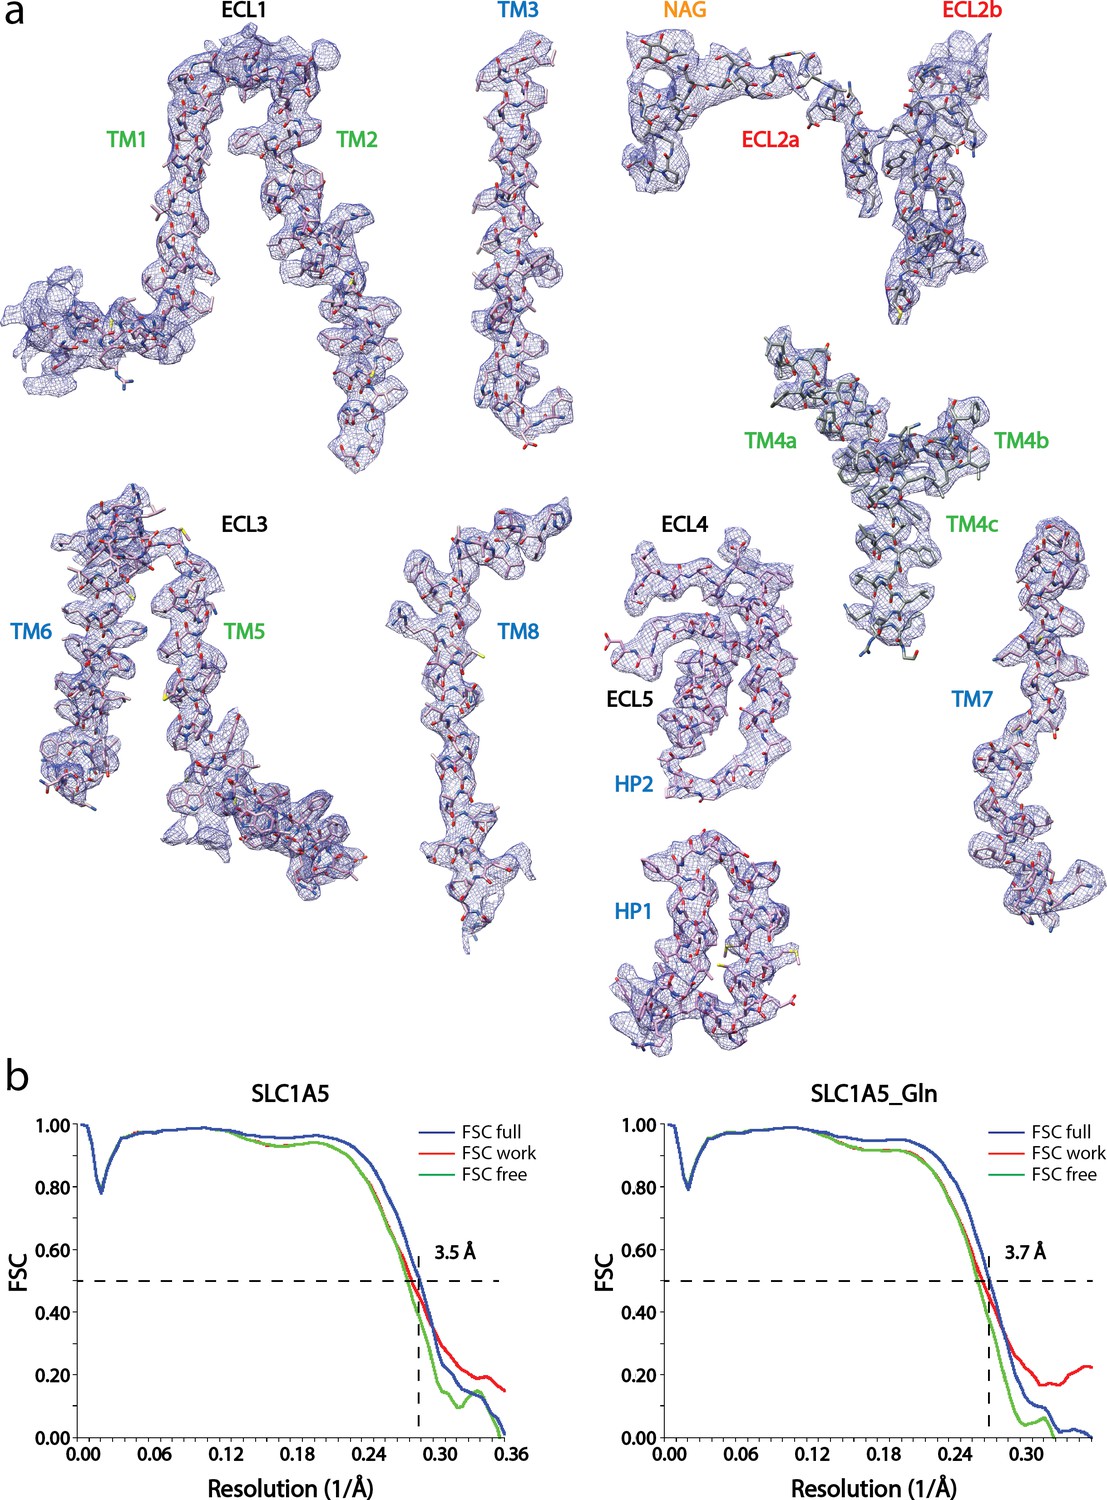
Cryo-EM densities of the eight transmembrane helices with ECL loops of SLC1A5-cKM4012 (Fab).
(a) Cryo-EM density is sharpened with a negative b-factor 15 Å2 and displayed at the contour level 8σ for the transmembrane helixes and loops regions, except for the ECL2a, and b regions at 5.6σ and 4σ respectively. The atomic model with side chains are shown as sticks. The segments are labeled and colored as in Figure 1c. (b) Model validation. Comparison of the FSC curves between model and half map 1 (work), model and half map 2 (free), and model and full map are plotted in red, green and blue, respectively.
Figure 1—figure supplement 5
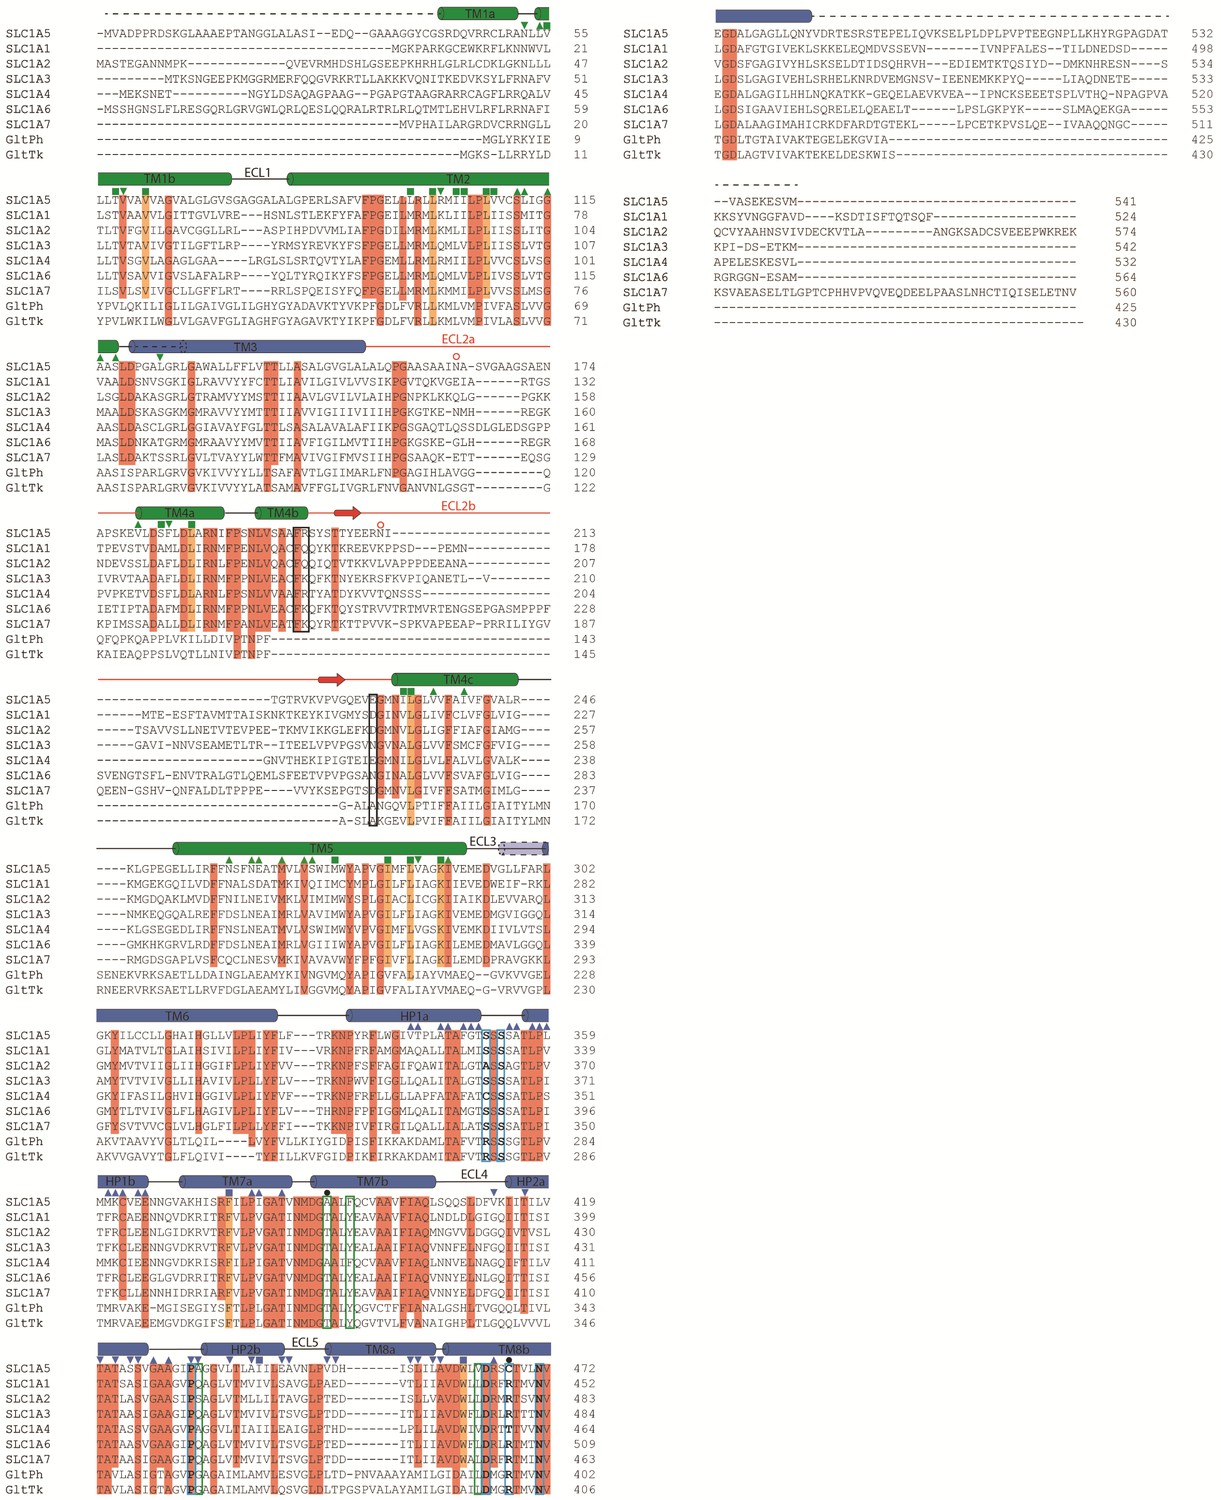
Sequence alignment of human SLC1 transporters and two prokaryotic homologues.
The secondary structural features are presented according to the human SLC1A5 cryo-EM structures in this study. The color-coding scheme is the same as in Figure 1d. The secondary element changes on TM3 and TM6 upon outward- and inward-transitions are indicated. Conserved residues are highlighted and filled in red. Residues involved in the substrate binding and the neighboring pocket for SLC1A5 are boxed in cyan and green, respectively. Key residues for substrate specificity are indicated by black filled circles. The residues involved in inter-protomer interactions are boxed in black. Residues from Zone two and their interacting residues from the scaffold domain in the inward-facing state are highlighted using blue and green ▼, respectively. Residues from Zone one and their interacting residues from the scaffold domain in the outward-facing state are highlighted using blue and green ▲, respectively. Shared residues from the transport and scaffold domains during conformational changes are highlighted using blue and green ■, respectively. The conserved residues are filled in orange. The N-linked glycosylation sites are indicated by orange open circles. Dashed lines represent the sequences which are not observed from cryo-EM density.
Figure 2
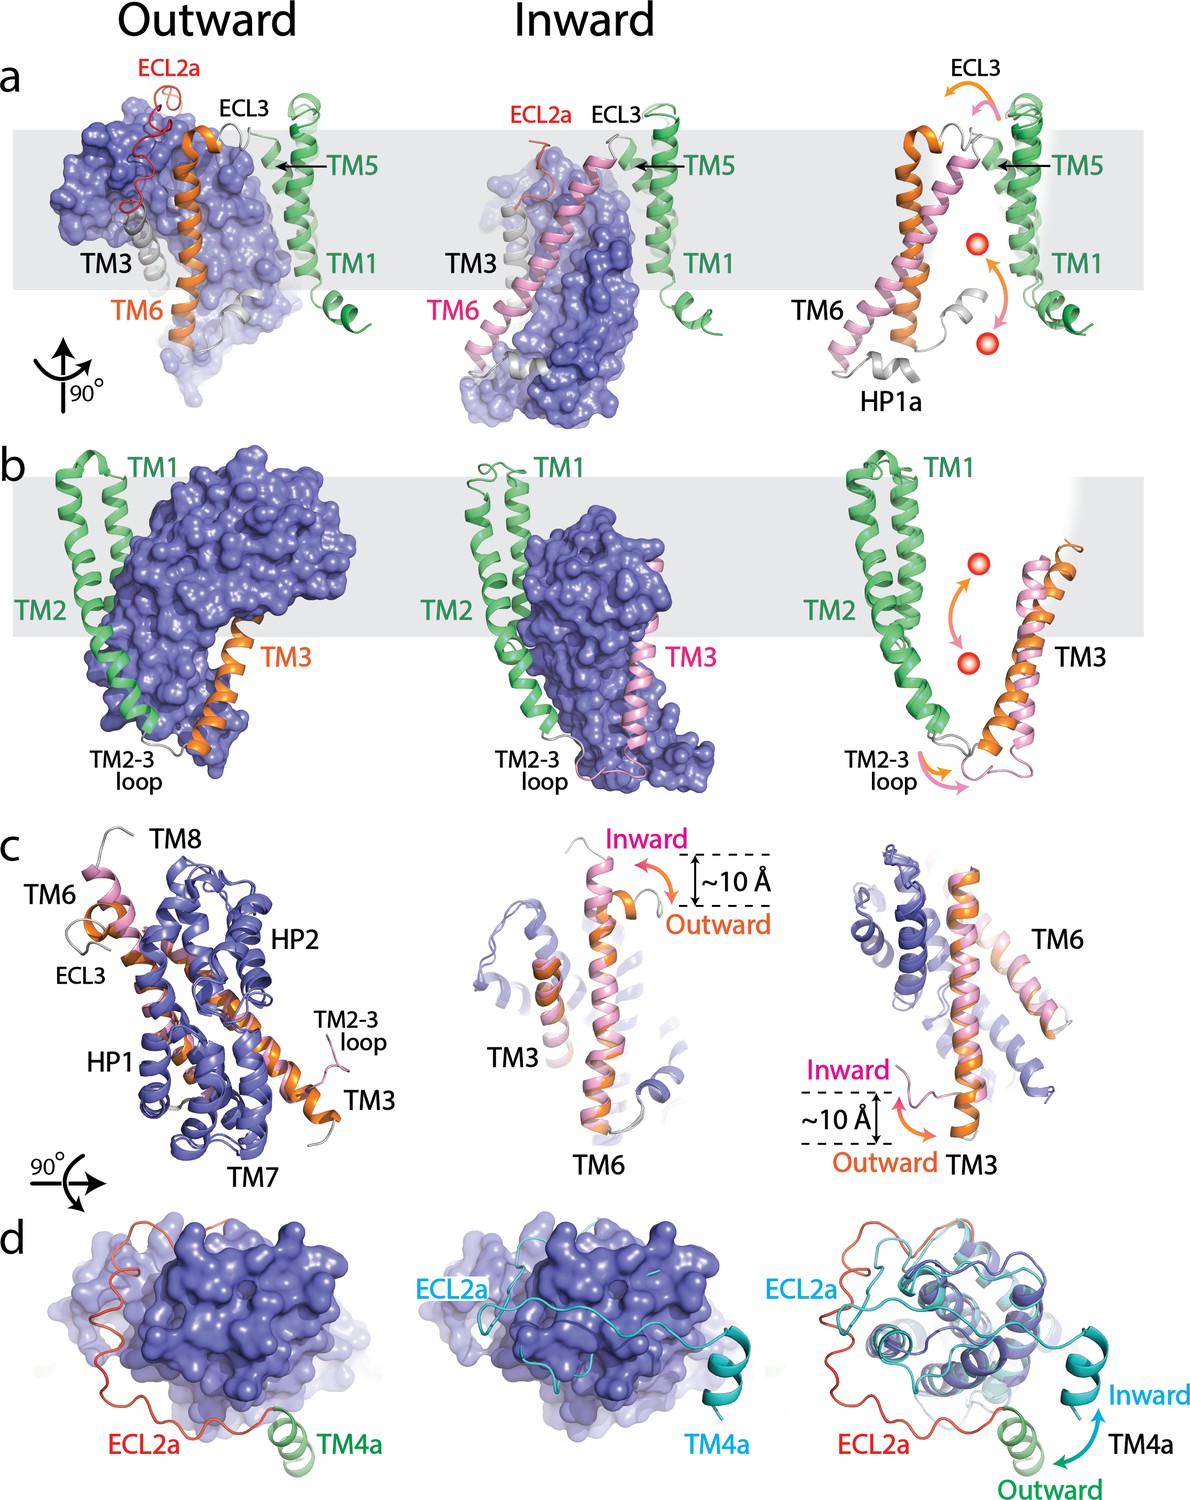
Structural comparison between outward- and inward-facing states of SLC1A5.
(a and b) Structure of the SLC1A5 monomer viewed from the side of the membrane highlighting TM6 and TM3, respectively. Transport domains are represented as molecular surfaces and colored in navy. Scaffold domains are in green. TM6 and TM3 are colored in orange in the outward-facing state (left) and pink in the inward-facing state (middle, PDB: 6GCT). Overlay of scaffold domains of inward- and outward-facing states highlighting TM3 and TM6 (right). The glutamine substrate is shown as a red ball. (c) Superposition of the transport domains of SLC1A5 in the outward- and inward-facing (PDB: 6GCT) states (left). The conformational changes of TM6 (middle) and TM3 (right) between the outward-facing and inward-facing states are highlighted. (d) Transport domains of SLC1A5 in an outward-facing state (left) and a cross-linked GltPH in inward-facing state (middle, PDB:3KBC) viewed from the extracellular face. The SLC1A5 transport domain in the outward-facing conformation serving as the reference is shown in molecular surface. The conformational changes of ECL2a between the outward- (in red) and inward-facing (in cyan) states are highlighted (right).
Figure 3 with 4 supplements
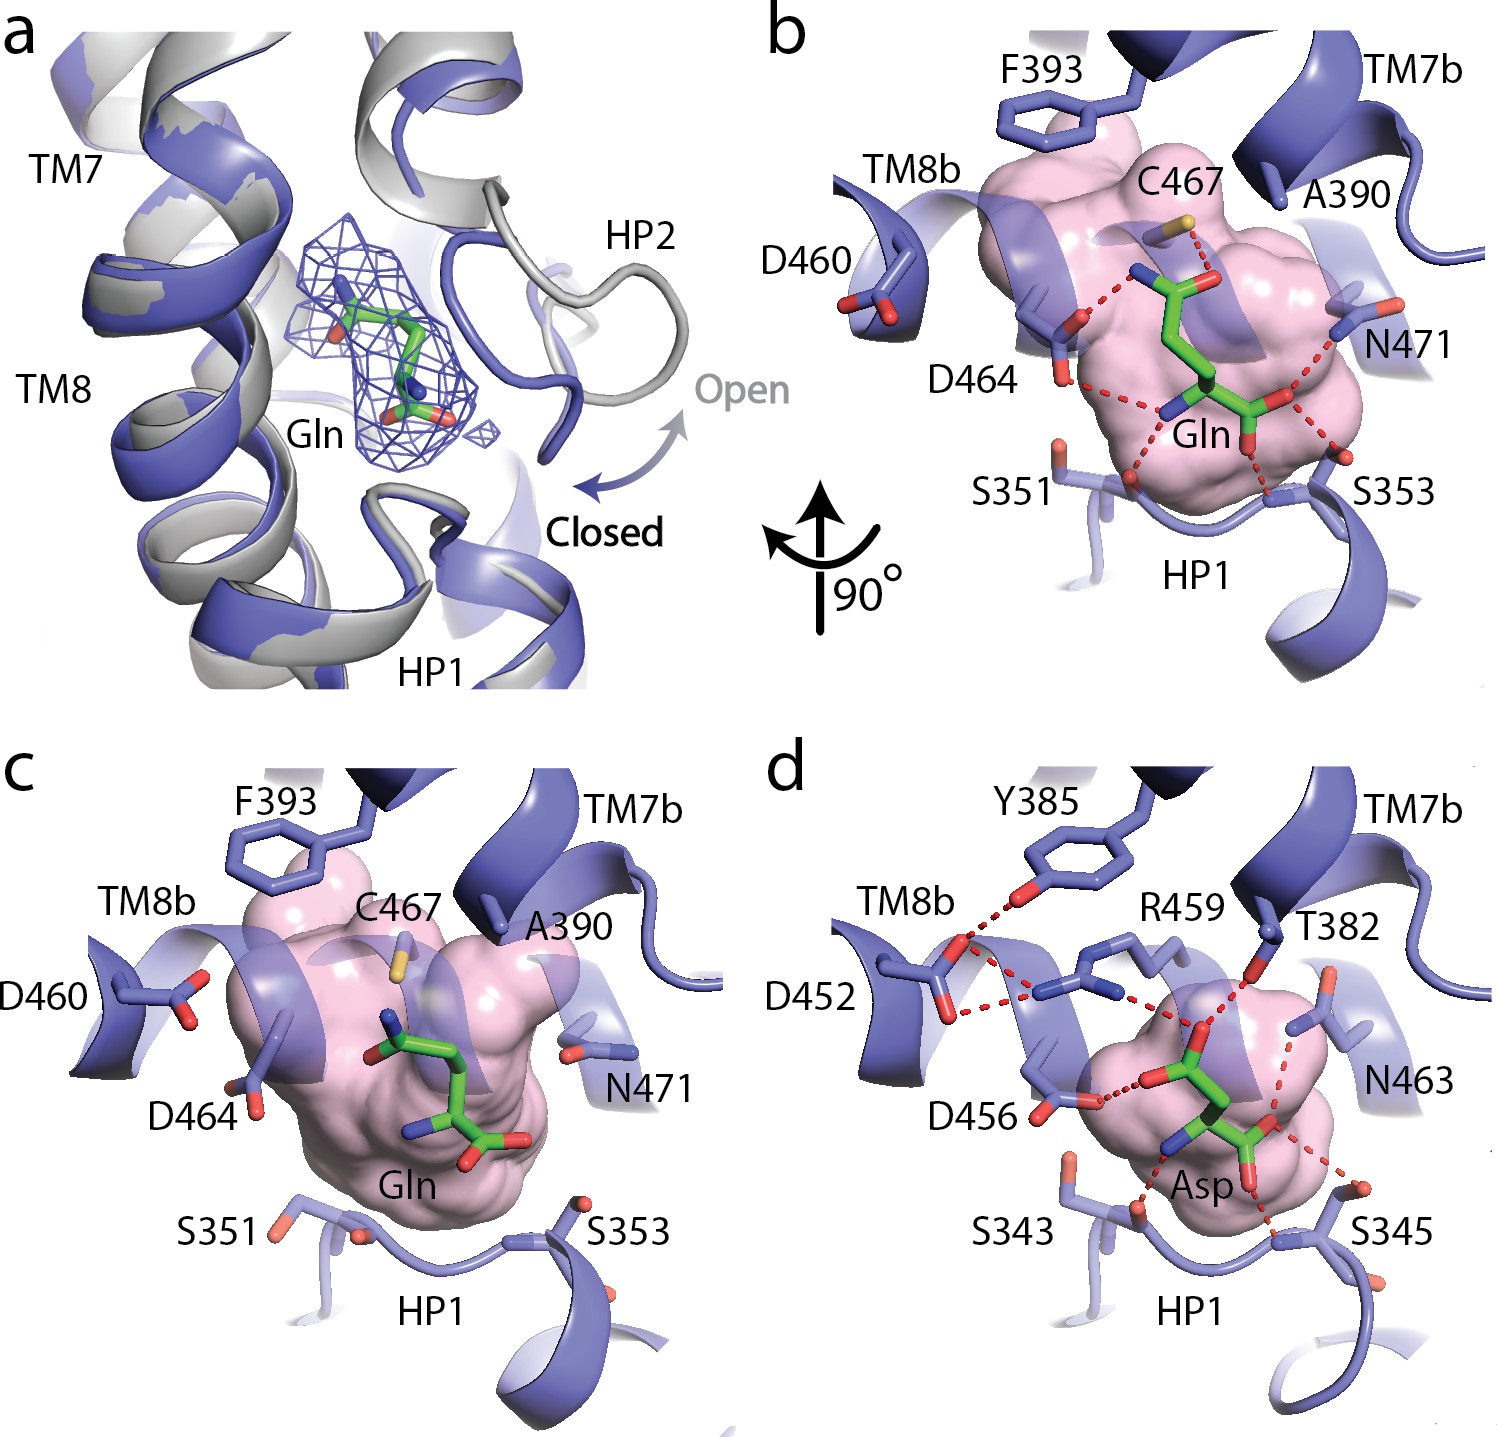
The substrate, L-glutamine-bound SLC1A5 structure.
(a) Conformational change for the HP2 upon binding of L-glutamine in the outward-facing state of SLC1A5. The unliganded structure is shown in gray and the L-glutamine-bound structure is in navy. EM density over the ligand is shown as a blue mesh. (b and c) Zoomed in views of the substrate binding sites of the outward-facing and inward-facing states (PDB:6GCT) of SLC1A5, respectively. (d) Interaction of L-Asp in the outward-facing state of SLC1A3 (PDB code: 5LLU). Critical side chains are labeled (stick representation) with hydrogen bonds (red dashed lines). Molecular surface in the substrate binding sites are in pink.
Figure 3—figure supplement 1
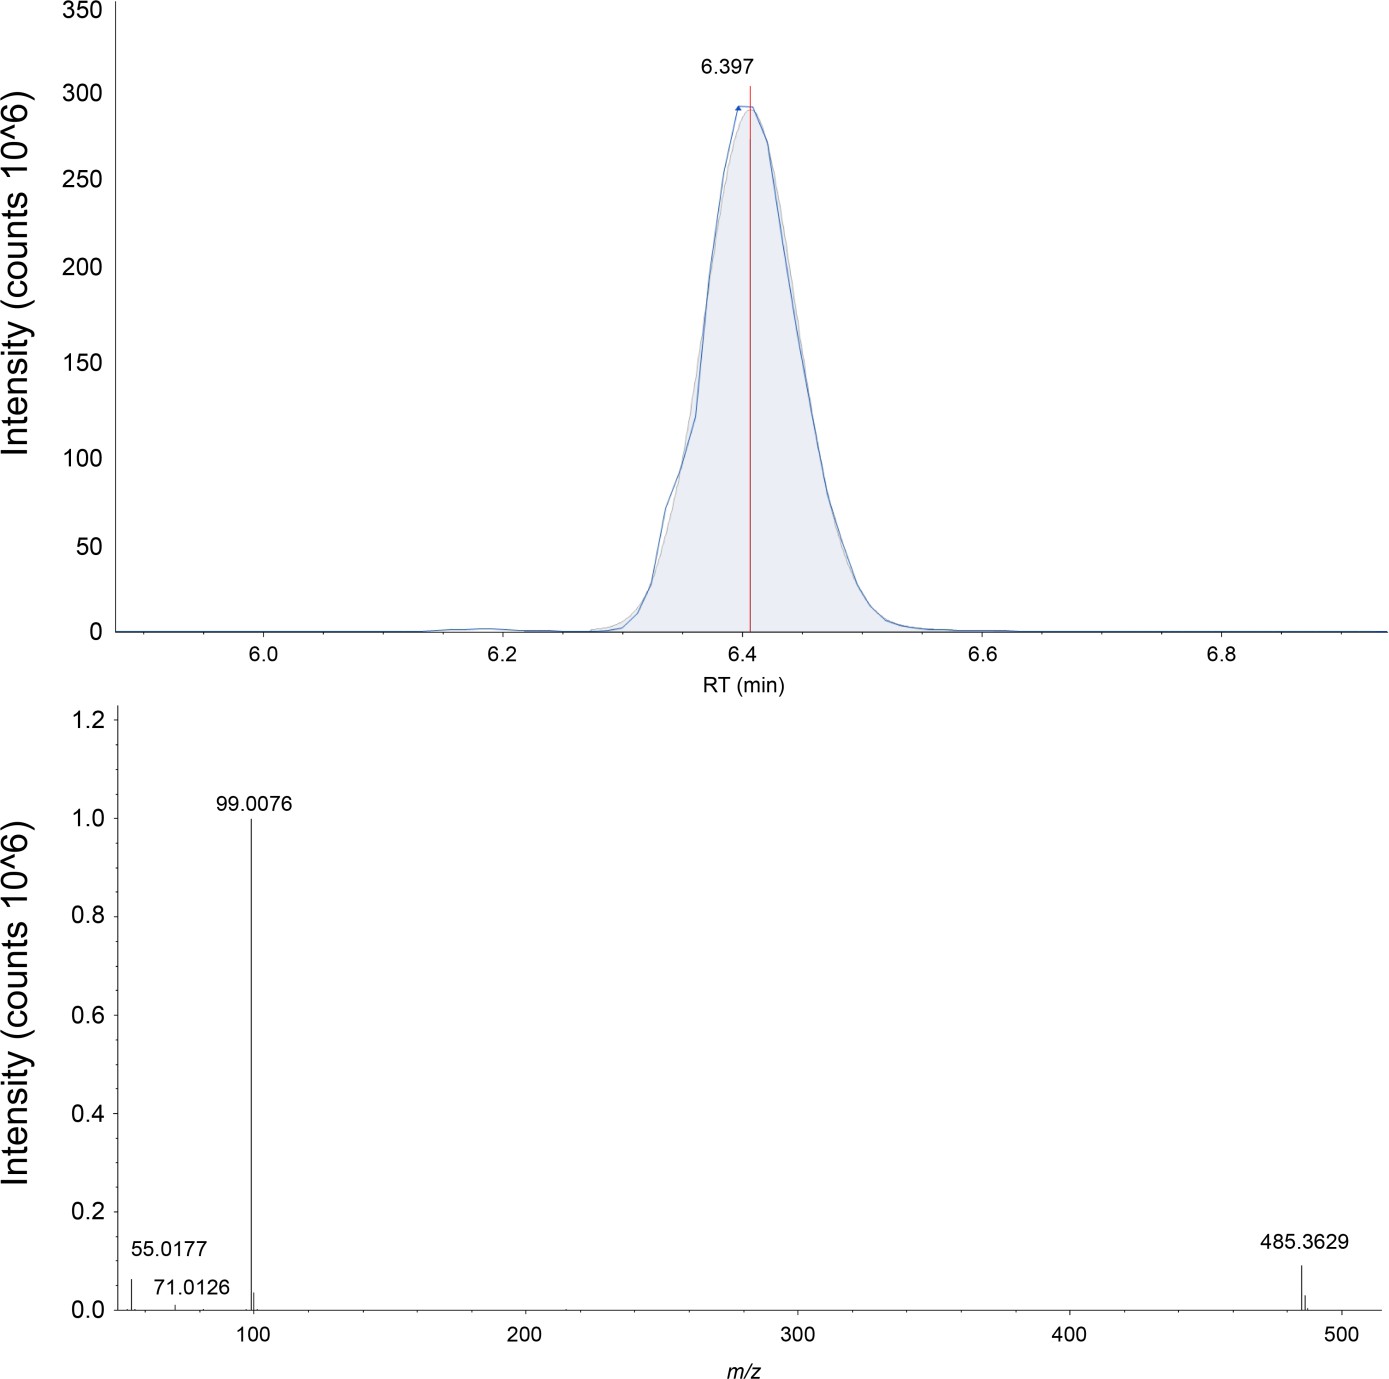
The extracted ion chromatograph (above) and the mass spectrum (below) for CHS is shown in negative ion mode.
CHS is measured with a three ppm accuracy in the SLC1A5 sample. The exact mass, elution time, and fragmentation pattern are validated against a commercially bought standard (Sigma-Aldrich, St. Louis).
Figure 3—figure supplement 2
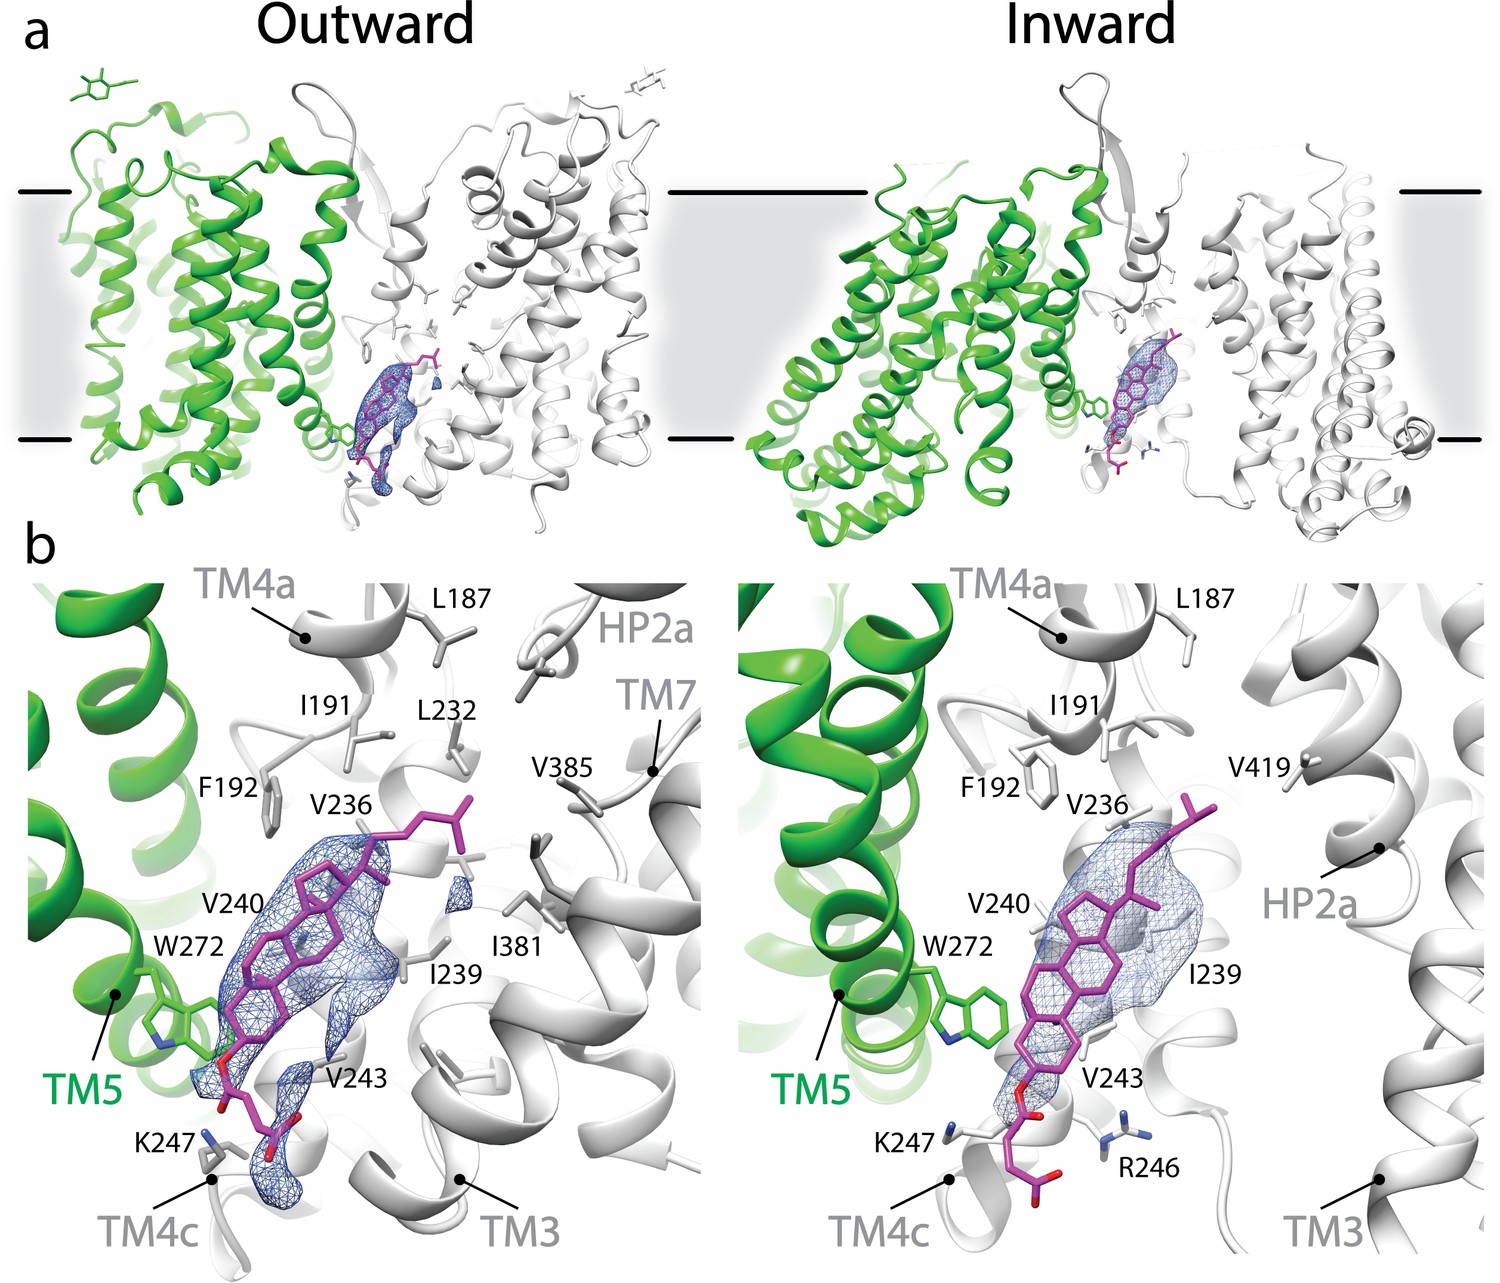
Potential CHS interaction in outward- and inward-facing conformation of SLC1A5.
(a) Elongated densities, shown as blue mesh (~6σ), are observed between two protomers of SLC1A5 trimer in both the outward- and inward-facing (PDB: 6GCT) cryo-EM structures. (b) A density is embedded in the cavity enclosed by two SLC1A5 protomers (one in green, and the other in gray). One CHS molecule, shown as magenta sticks, can be docked into this density. TM4a and TM4c provide the primary accommodation site for the CHS molecule. The contour and composition of the cavity define the orientation of the bound CHS. Note that a cholesterol molecule can be accommodated in the hydrophobic pocket the same as CHS.
Figure 3—figure supplement 3
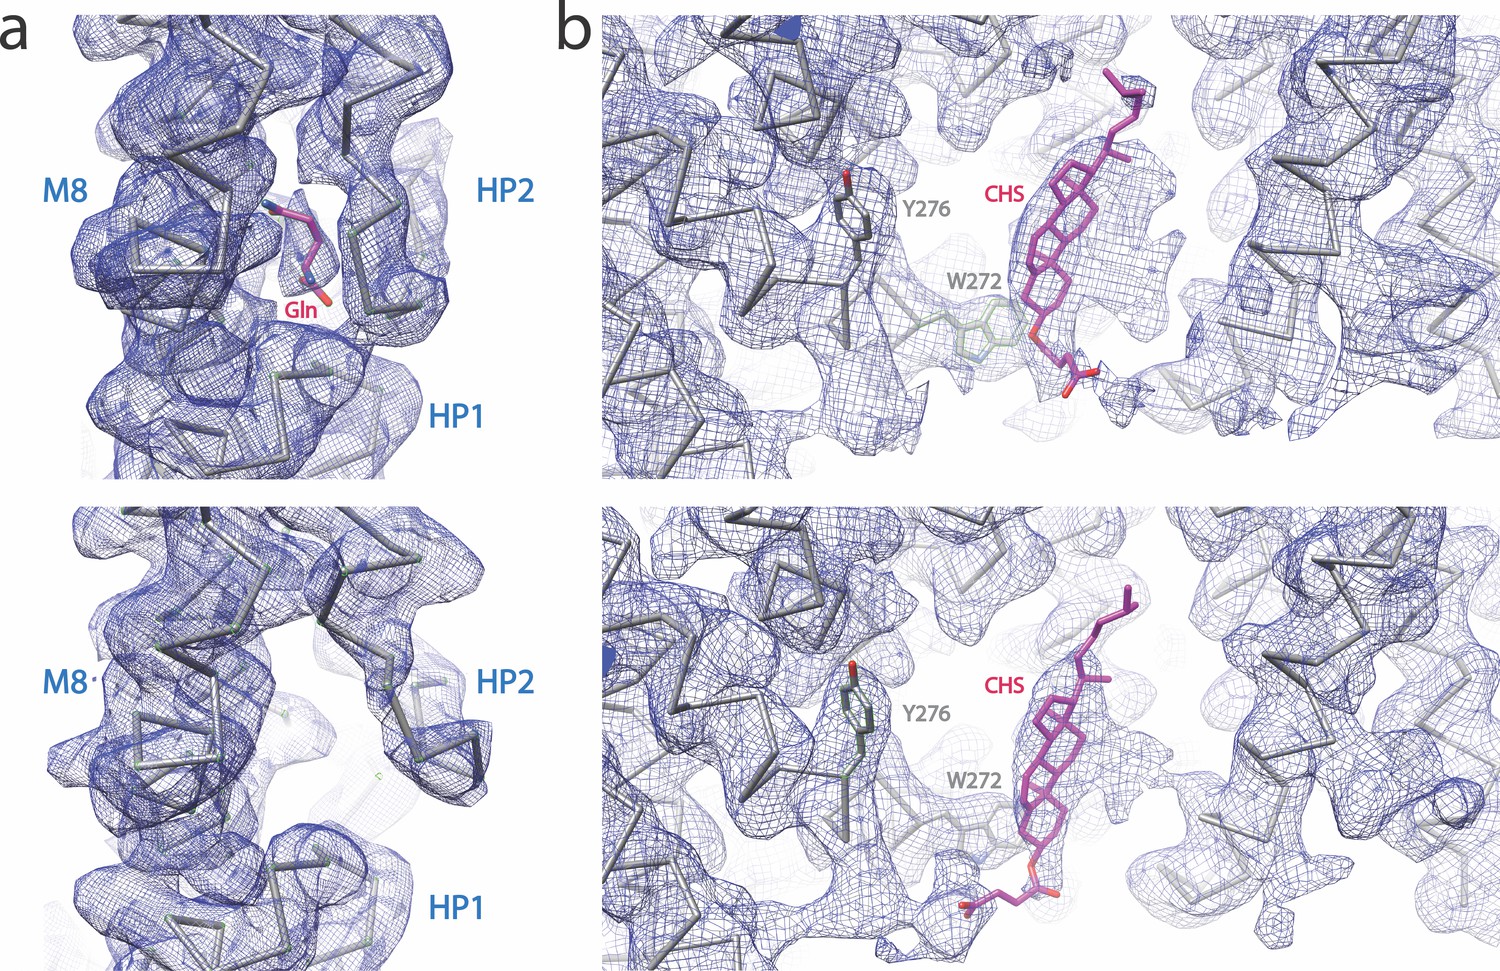
Cryo-EM densities of the substrate and putative CHS binding sites of SLC1A5, at the contour level 6σ.
(a) Cryo-EM densities of the substrate-binding site with (upper panel) or without (lower panel) Gln substrate. (b) Cryo-EM densities of the putative CHS binding site with (upper panel) or without (lower panel) Gln substrate. The backbone of the models is shown. The Gln substrate and CHS are shown as sticks. The side chains of Y276 and W272 are shown as a reference.
Figure 3—figure supplement 4
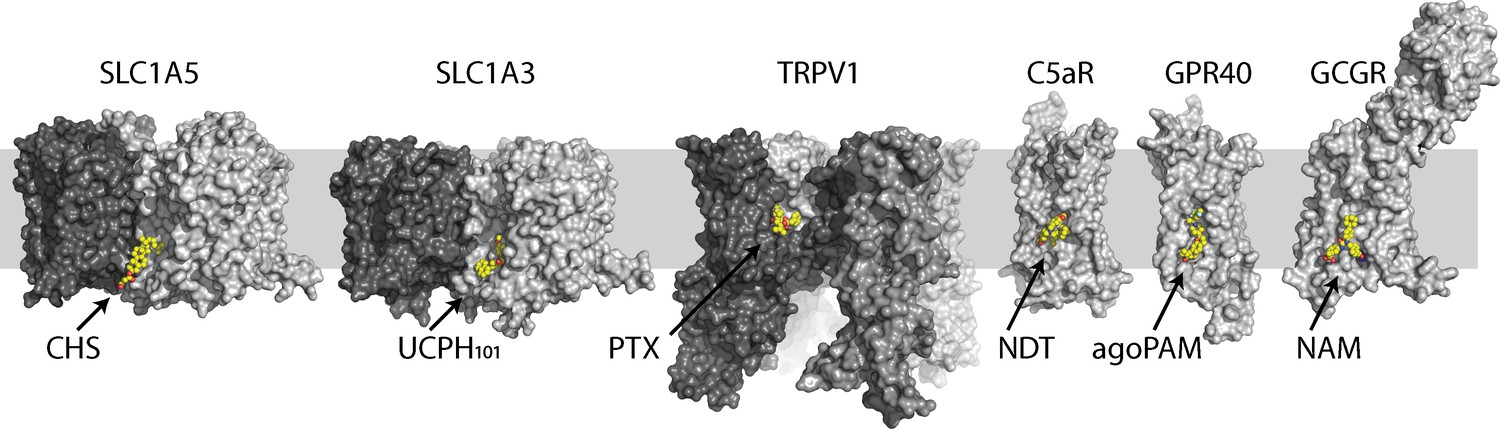
Selective examples of allosteric druggable pockets at the lipid-exposed surface near the intracellular part of membrane proteins.
Different protomers are shown in surface with different gray scale. Each ligand is colored in yellow ball-and-sticks. Examples of allosteric sites include the RTX agonist binding site in the capsaicin and heat-activated cation channel TRPV1 (Gao et al., 2016), the extra-helical NDT9513727 antagonist binding site in the complement C5a receptor (Robertson et al., 2018), the agoPAM binding site in the free fatty acid receptor GPR40 (Lu et al., 2017) and a negative allosteric modulator binding site in the glucagon receptor (Zhang et al., 2017).
Figure 4
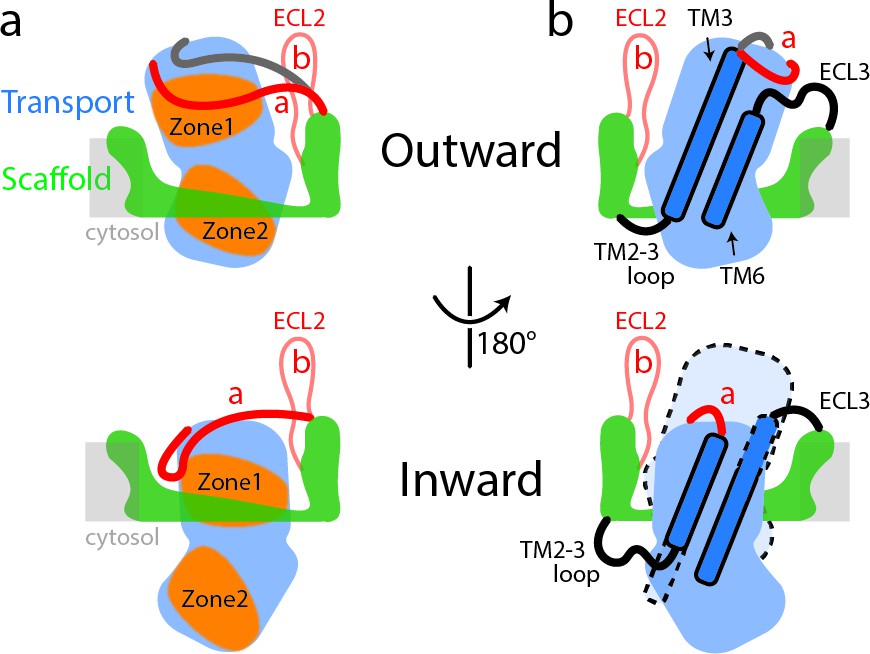
Schematic representation of conformational changes in SLC1A5 during substrate transport.
(a) In the outward-facing state (top), the Zone two from the transport domain interacts with the scaffold domain, with the Zone one partially occupied by the ECL2a. Two different poses of the ECL2a were observed (shown in red and dark gray lines): one is situated at the side of the transport domain (red line); the other is crossing over the crests of ECL4 and ECL5 (dark gray line). In the inward-facing state (bottom), the ECL2a has to be repositioned, releasing the Zone one to interact with the scaffold domain. Residues from Zone one and Zone two are highlighted (Figure 1—figure supplement 5). (b) The inherent plasticity around the TM2-3 loop, ECL3, TM3, and TM6 regions (highlighted in dash lines) allows the transitions between the outward-facing (top) and inward-facing states (bottom). The relative position of transport domain in the outward-facing state is highlighted in dash (bottom panel in b). The regions of SLC1A5 are colored based on the Figure 1a. The light gray line depicts membrane boundary.
Tables
Table 1
Data collection, reconstruction, and model refinement statistics
https://doi.org/10.7554/eLife.48120.002| SLC1A5_cKM4012 EMD-9187, PDB: 6MP6 | SLC1A5_cKM4012_L_Gln EMD-9188, PDB: 6MPB | |
|---|---|---|
| Data collection | ||
| Microscope | Titan Krios | Titan Krios |
| Voltage (keV) | 300 | 300 |
| Nominal magnification | 22,500 x | 22,500 x |
| Exposure navigation | Stage Position | Stage Position |
| Electron exposure (e /Å2) | 42 | 42 |
| Dose rate (e/pixel/sec) | 5 | 5 |
| Detector | K2 Summit | K2 Summit |
| Pixel size (Å)* | 0.543 | 0.543 |
| Defocus range (µm) | 1.2 to 2.5 | 1.2 to 2.5 |
| Micrographs Used | 3804 | 5228 |
| Final Refined particles (no.) | 165,067 | 253,220 |
| Reconstruction | ||
| Symmetry imposed | C1 | C1 |
| Resolution (global) | ||
| FSC 0.143 | 3.50 Å | 3.83 Å |
| Applied B-factor (Å2) | −15 | −15 |
| Refinement | ||
| Protein residues | 1341 (SLC1A5) | 1344 (SLC1A5_L_Gln) |
| Map Correlation Coefficient | 0.815 | 0.785 |
| R.m.s deviations | ||
| Bond lengths (Å) | 0.006 | 0.005 |
| Bond angles (°) | 1.085 | 1.062 |
| Ramachandran | ||
| Outliers | 0.00% | 0.00% |
| Allowed | 7.88% | 8.93% |
| Favored | 92.12% | 91.07% |
| Poor rotamers (%) | 0.00% | 0.00% |
| MolProbity score | 1.62 | 1.67 |
| EMRinger score | 2.59 | 1.99 |
| Clashscore (all atoms) | 3.44 | 3.67 |
-
*Calibrated pixel size at the detector
Key resources table
| Reagent type (species) or resource | Designation | Source or reference | Identifiers | Additional information |
|---|---|---|---|---|
| Antibody | Mouse monoclonal Anti-SLC1A5 | Creative Biolabs Inc | TAB-1010CLV | 1 ml, 1 mg/ml |
| Strain, strain background (Homo sapiens) | HEK293S GnTI- cells | ATCC | CRL-3022 RRID: CVCL_A785 | |
| Recombinant DNA reagent | pcDNA3.1+ | Life Technologies | V79020 | |
| Chemical compound, drug | Opti-MEM reduced serum media | Life Technologies | 31985062 | |
| Strain, strain background (Homo sapiens) | HAP1 SLC1A5 knock out cells | Horizon Discovery | HZGHC005452c002 | |
| Chemical compound, drug | Iscove’s modified Dulbecco’s medium | Gibco | 12440 | |
| Chemical compound, drug | Cell dissociation buffer | Gibco | 13151 | |
| Chemical compound, drug | Fetal bovine serum | Gibco | 16000044 | |
| Software, algorithm | MotionCorr2 1.1.0 | Zheng et al., 2017 | http://msg.ucsf.edu/em/software/motioncor2.html | |
| Software, algorithm | Relion v 2.0 | Kimanius et al., 2016 | https://www2.mrc-lmb.cam.ac.uk/relion/ | |
| Software, algorithm | Phenix 1.14 | Adams et al., 2010 | http://phenix-online.org/ | |
| Software, algorithm | Coot 0.8.9.1 | Emsley and Cowtan, 2004 | https://www2.mrc-lmb.cam.ac.uk/personal/pemsley/coot/ | |
| Software, algorithm | Pymol 2.0 | Schrodinger LLC | https://pymol.org/2/ | |
| Software, algorithm | Chimera 1.12 | Pettersen et al., 2004 | https://www.cgl.ucsf.edu/chimera/ | |
| Software, algorithm | Gctf | Zhang, 2016 | https://www.mrc-lmb.cam.ac.uk/kzhang/ | |
| Software, algorithm | cisTem | Grant et al., 2018 | https://cistem.org/ |
Additional files
-
Transparent reporting form
- https://doi.org/10.7554/eLife.48120.016
Download links
A two-part list of links to download the article, or parts of the article, in various formats.
Downloads (link to download the article as PDF)
Open citations (links to open the citations from this article in various online reference manager services)
Cite this article (links to download the citations from this article in formats compatible with various reference manager tools)
Cryo-EM structures of the human glutamine transporter SLC1A5 (ASCT2) in the outward-facing conformation
eLife 8:e48120.
https://doi.org/10.7554/eLife.48120


