Age-dependent deterioration of nuclear pore assembly in mitotic cells decreases transport dynamics
- University of Groningen, University Medical Center Groningen, Netherlands
- University of Washington, United States
- Yale School of Medicine, United States
- University of Groningen, Netherlands
Figures
Figure 1 with 3 supplements
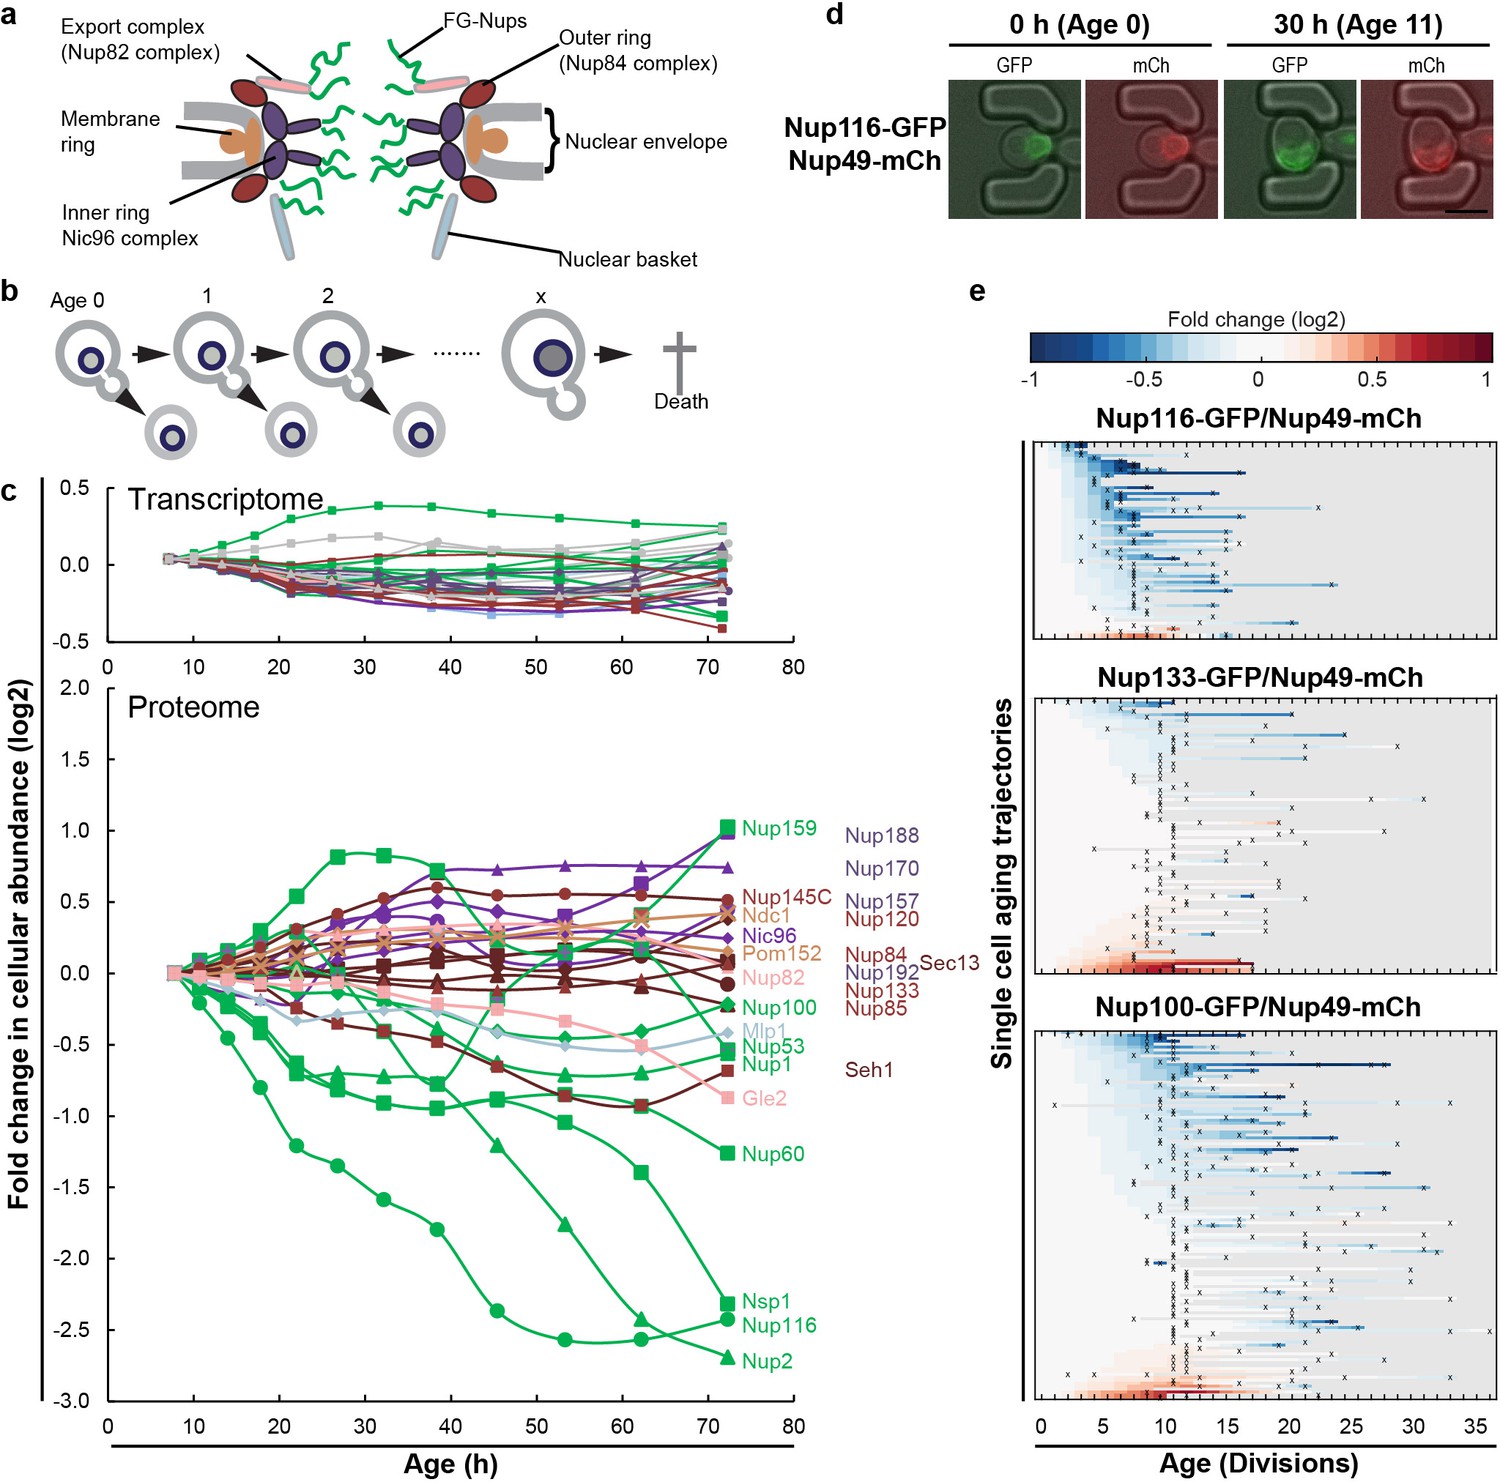
The cellular abundance of some NPC components changes in replicative aging.
(a) Cartoon representation of the NPC illustrates different structural regions of the NPC, all FG-Nups are shown in green independently of their localization, the membrane rings in light brown, the inner rings in purple, the outer rings in brown, the mRNA export complex in pink, and the nuclear basket structure in light blue. Adapted with permission from Springer Nature Customer Service Centre GmbH: Springer Nature, Nature, Integrative structure and functional anatomy of a nuclear pore complex, Kim et al. (2018). (b) Schematic presentation of replicative aging yeast cells. (c) Transcript and protein abundance of NPC components (color coded as in Figure 1a) as measured in whole cell extracts of yeast cells of increasing replicative age; after 68 hr of cultivation the average replicative age of the cells is 24. Cells were aged under controlled and constant conditions (Janssens et al., 2015). See also Figure 1—figure supplement 1a. (d) Young cells are trapped in the microfluidic device and bright field images are taken every 20 min to define the cells age and fluorescent images are taken once every 15 hr to detect the protein localization and abundance. Representative images of cells expressing indicated fluorescent protein fusions imaged at the start of the experiment and after 30 hr; their replicative age is indicated. Scale bar represents 5 µm. (e) Heat map representation of the changes in the levels of the indicated GFP- and mCh-tagged Nups at the NE in each yeast cell at increasing age. Each line represents a single cell’s life history showing the change in the ratio of the fluorescence from the GFP-tagged Nup over the fluorescence from the mCh-tagged Nup and normalized to their ratio at time zero. Measurement of the fluorescence ratios are marked with ‘x’; in between two measurements the data was linearly interpolated. The fold changes are color coded on a log 2 scale from −1 to + 1; blue colors indicate decreasing levels of the GFP-fusion relative to mCh. Number of cells in the heatmaps are Nup116-GFP/Nup49-mCh = 67, Nup133-GFP/Nup49-mCh = 94 and Nup100-GFP/Nup49-mCh = 126.
© 2018 Springer Nature. Figure 1A adapted with permission from Kim et al. (2018).
Figure 1—figure supplement 1
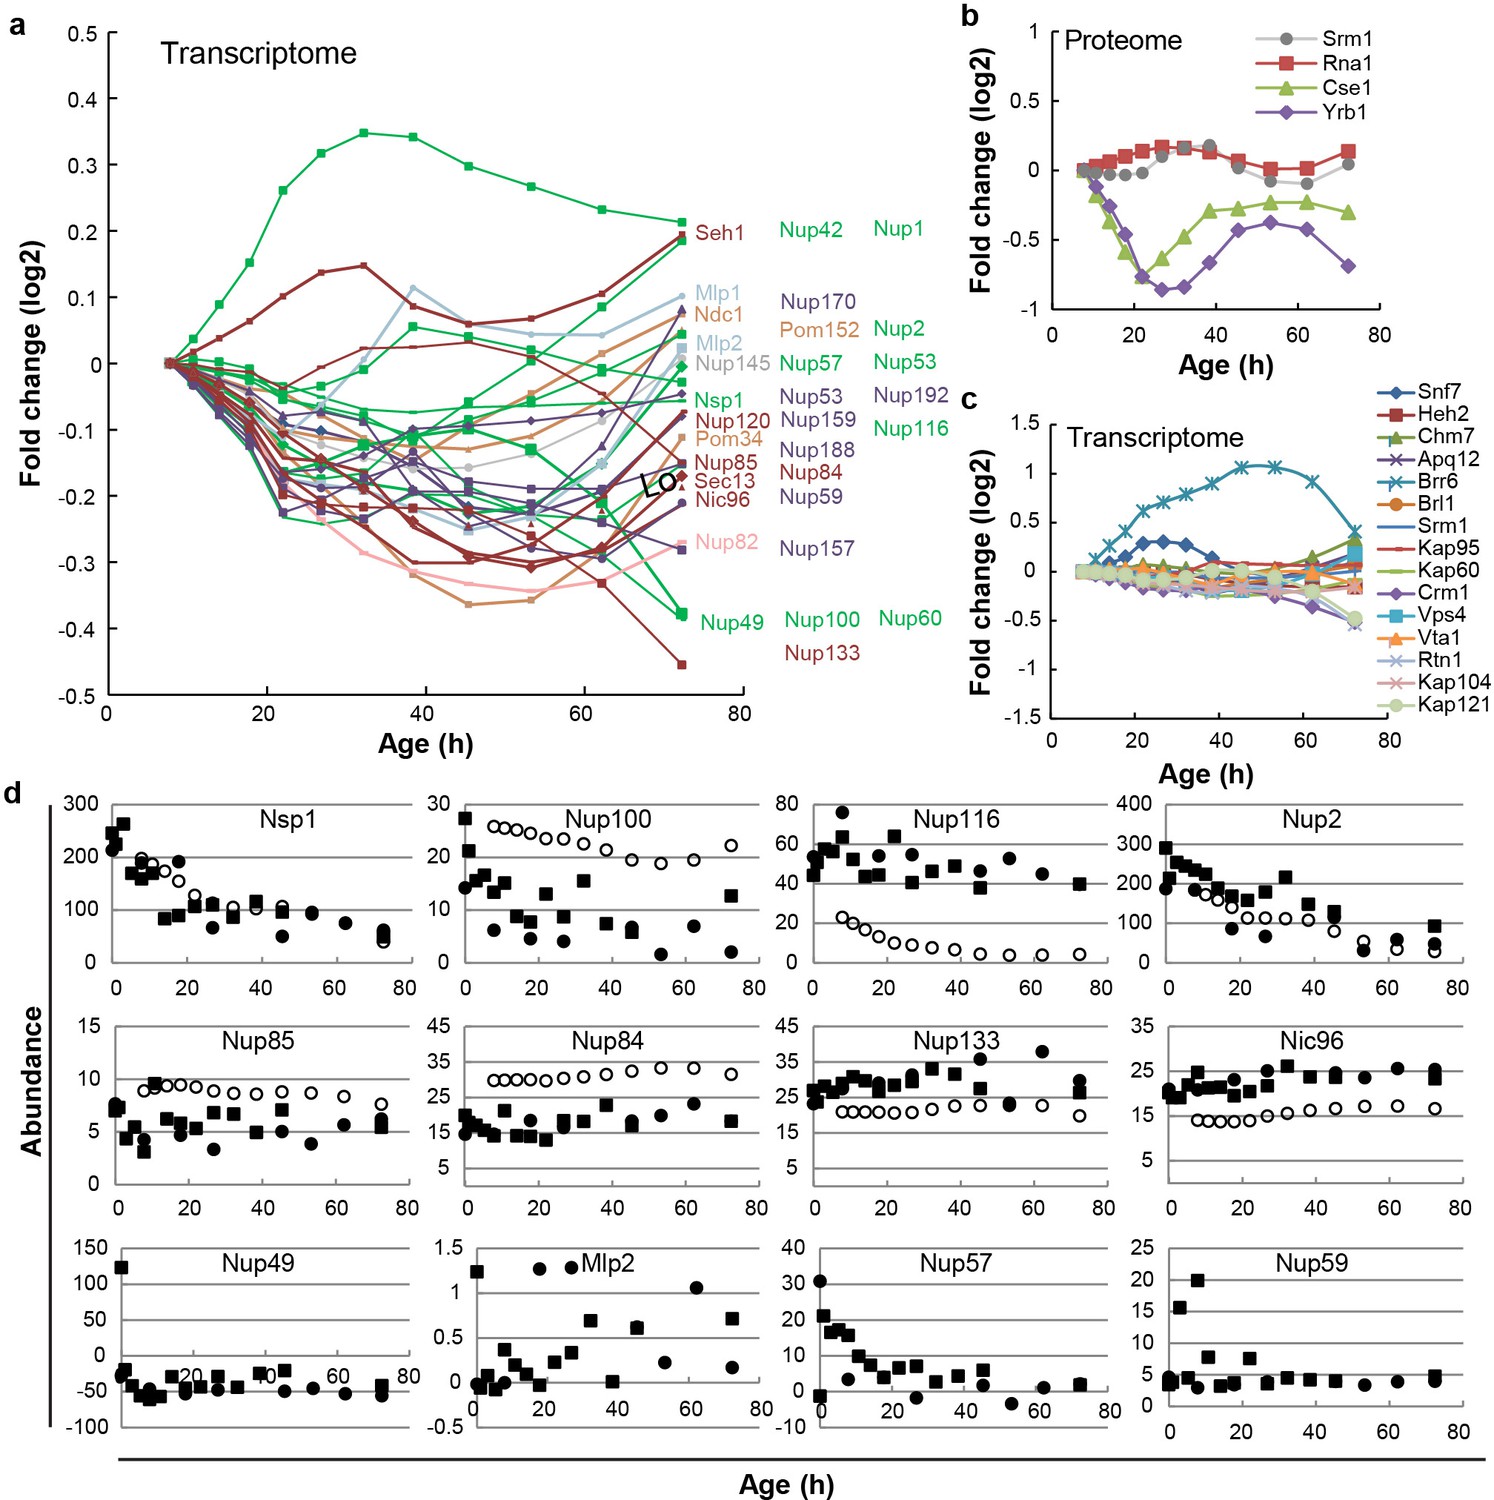
Cellular protein and mRNA abundance of Nups, NTRs and assembly factors in replicative aging.
(a) mRNA abundance of NPC components in replicative aging; a zoom-in of Figure 1A. Changes in abundance are plotted as fold change. Replicative age increases in time. Transcriptome data from Janssens et al. (2015). (b) Protein abundance of the RanGEF Srm1, the RanGap Rna1, the RanBP1 Yrb1, and the transport receptor Cse1 as measured in whole cell extracts of yeast cells of increasing replicative age. Data from Janssens et al. (2015). (c) mRNA abundance of NPC assembly components and NTRs tested in this study in replicative aging. Changes in abundance are plotted as fold change. Replicative age increases in time. Transcriptome data from Janssens et al. (2015). (d) Protein abundances of Nups in extracts of aging yeast cells after first two data processing steps (black squares and circles from two biological replicates) and after final data processing (white circles) (data from Janssens et al., 2015). Black squares and circles represent the abundances of Nups in whole cell extracts of mixed cell samples enriched for replicative aging mother cells (referred to as mix two in Janssens et al., 2015) after the first two data processing steps. These first two data processing steps involve the normalization of the raw abundances to 1 million and the protein-specific correction for bead-related protein losses. The open circles reflect abundances of the Nups after the additional data processing steps of the deconvolution of the mother-cell-specific abundances. Nup49, Mlp2, Nup57 and Nup59 (bottom row) were missing in the final datasets reported in Janssens et al. (2015) as the third data processing step failed. For Nup49 specifically the problem was that the protein specific correction for bead related protein losses yielded negative values as the losses were estimated too high.
Figure 1—figure supplement 2
The abundance and localization of NPC components in replicative aging.
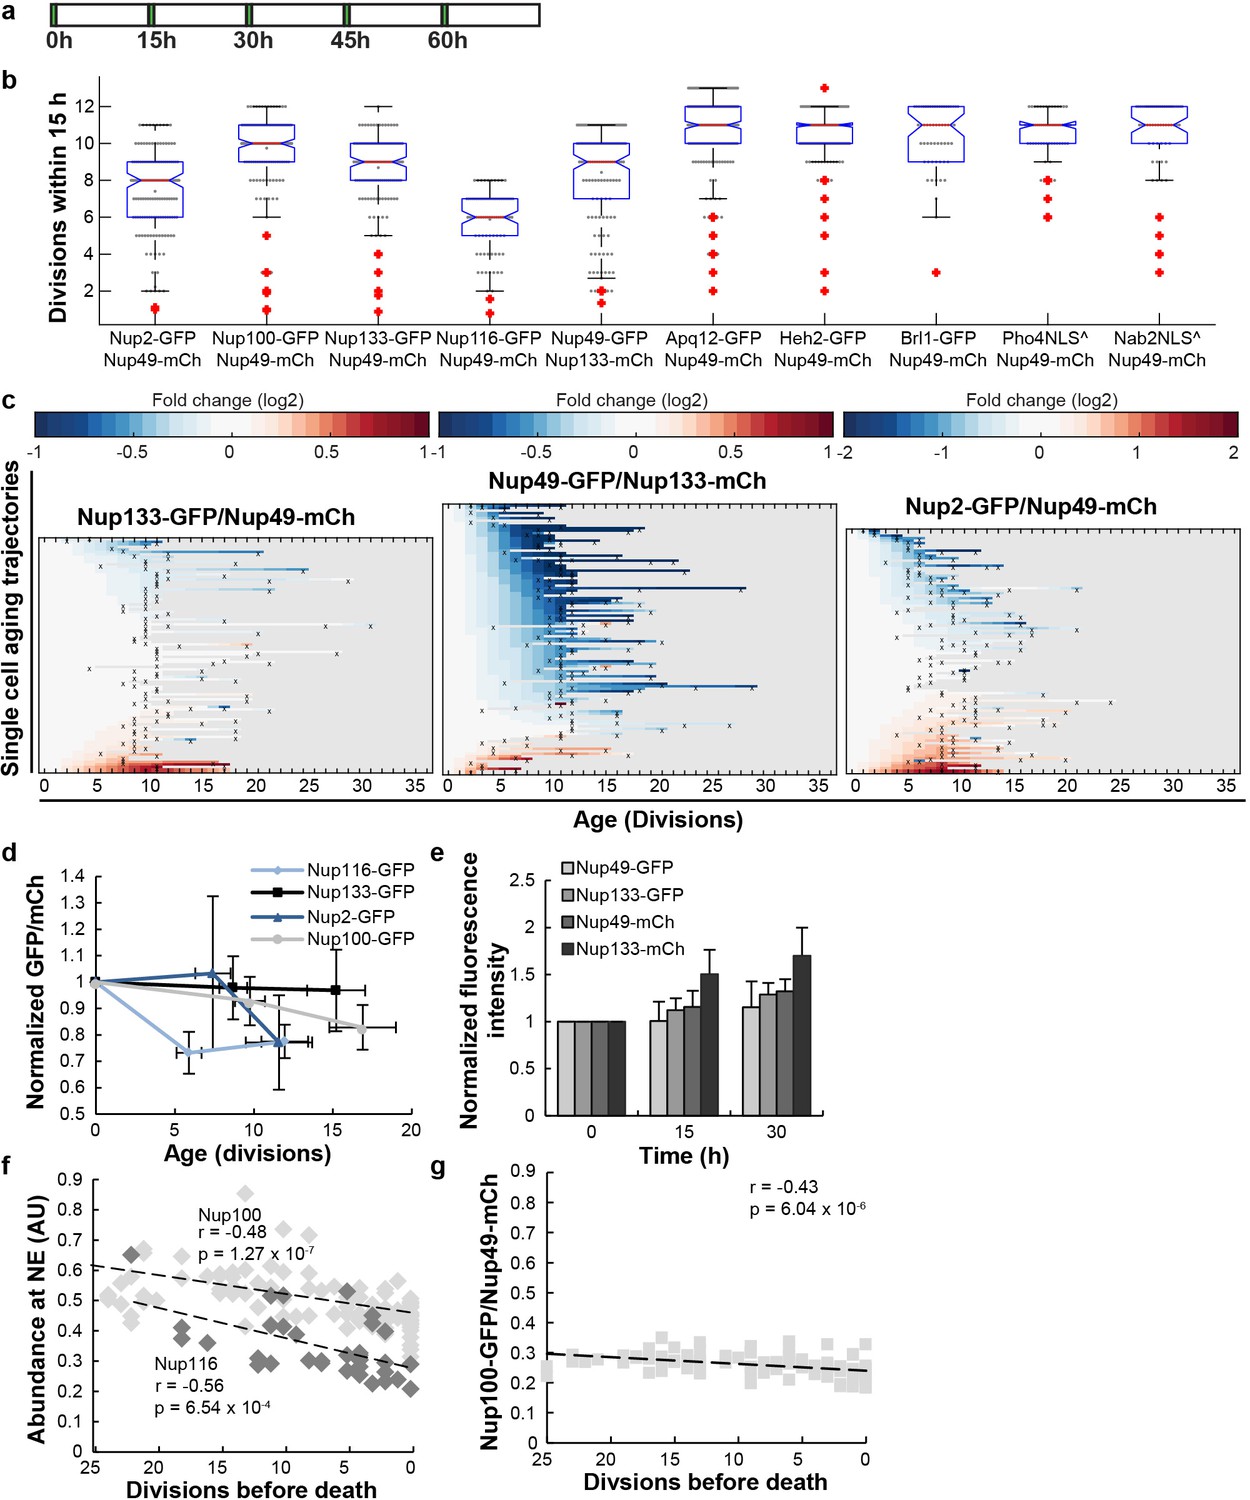
(a) The experimental timeline where young cells are trapped in the microfluidic device and bright-field images are taken every 20 min to define the cell’s age and fluorescent images are taken once every 15 hr to detect the protein localization and abundance. (b) The median number of completed divisions during the first 15 hr in the microfluidic chip of different strains used in this study and grown on glucose. Please see Figure 4—figure supplement 3 for three strains grown on galactose. ^ Pho4NLS and Nab2NLS are reporter strains, where the NLS is fused to a GFP under the control of the conditional TPI1 promotor. The tagging of Nups with GFP reduces the fitness of the cells to various extends. (c) Heat map representation of the changes in the levels of the indicated GFP- and mCh-tagged Nups at the NE in each yeast cell at increasing age. Each line represents a single cell’s life history showing the change in the ratio of the fluorescence from the GFP-tagged Nup over the fluorescence from the mCh-tagged Nup and normalized to their ratio at time zero. Measurement of the fluorescence ratios are marked with ‘x’; in between two measurements, the data was linearly interpolated. The fold changes are color coded on a log 2 scale from −1 to + 1, except for Nup2 where the changes were larger and the scale runs from −2 to 2; blue colors indicate decreasing levels of the GFP-fusion relative to mCh. Number of cells in the heatmaps are Nup133-GFP/Nup49-mCh = 94, Nup49-GFP/Nup133-mCh = 108, Nup2-GFP/Nup49-mCh = 98. Data from Nup133-GFP/Nup49-mCh is repeated from Figure 1b middle panel for easy comparison with the tag-swapped strain Nup49-GFP/Nup133-mCh and illustration of the systematic changes in the fluorescence from GFP and mCh in aging; see also panel e. (d) Normalized GFP/Nup49-mCh ratio representing the average from cells shown in panel b and Figure 1e. The indicated age is the average number of divisions at time points 0 hr, 15 hr, 30 hr. Error bars are SD of the mean. For Nup116-GFP the change in abundance becomes significant after 15 hr, with p<0.001. For Nup2-GFP and Nup100-GFP the change in abundance is significant with p<0.005 after 30 hr. The number of all measurements contributing to the means (N) at the time points 0 hr, 15 hr and 30 hr were for Nup116 = 76, 70 and 32; for Nup100 = 139, 137 and 86; for Nup2 = 112, 116 and 58; and for Nup133 = 102, 109 and 45, respectively. (e) The average fluorescence intensities from GFP and mCh in Nup133-GFP/Nup49-mCh and the tag-swapped strain Nup49-GFP/Nup133-mCh increase in time during replicative aging experiments, but more so for mCh than for GFP. The systematic changes in the fluorescence from GFP and mCh in aging is likely caused by differences in the maturation times of both fluorophores and/or their pH sensitivity. For the strain expressing Nup49-GFP and Nup133-mCh, N = 113, 104 and 50, and for the strains expressing Nup133-GFP and Nup49-mCh, N = 102, 85 and 27 at time points 0 hr, 15 hr and 30 hr, respectively. Error bars are SD of the mean. (f) The abundance of Nup116-GFP (gray) and Nup100 (black) at the NE relative to Nup49-mCh as a function of remaining lifespan. The dotted lines indicate the best linear fit. Total number of cells analysed are Nup116 = 15 and Nup100 = 35 and the total number of measurements are Nup116 = 34 and Nup100 = 108. (g) Additional independent replicate (coming from a different microscope) for Nup100-GFP/Nup49-mCh abundance correlation to lifespan. The cells in f and g were imaged with different filter settings explaining the different ratios. Number of cells analysed are N = 62 and number of measurements are N = 101.
Figure 1—figure supplement 3
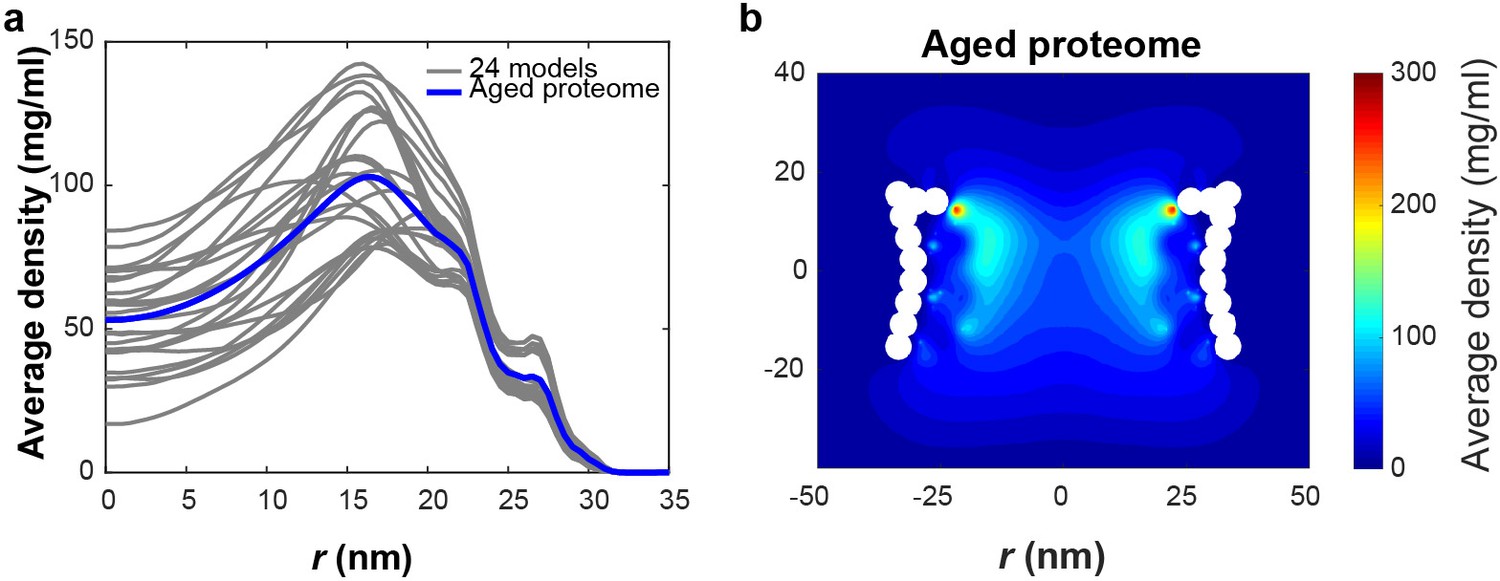
Models of NPCs with altered stoichiometry.
(a) The time averaged radial density distribution of the 24 constructed models (gray) (see Table 1) based on the FG-Nup abundance data from Figure 1c with the average of the 24 models plotted in blue denoted as ‘Aged proteome’. Each curve in gray represents the radial density averaged over the NPC height that is |z| < 15.4 nm for one of the 24 different models. (b) Time-averaged r-z density of FG-Nups in the ‘Aged proteome’ NPC. .
Figure 2 with 2 supplements
Mitotic aging is associated with problems in NPC assembly rather than oxidative damage.
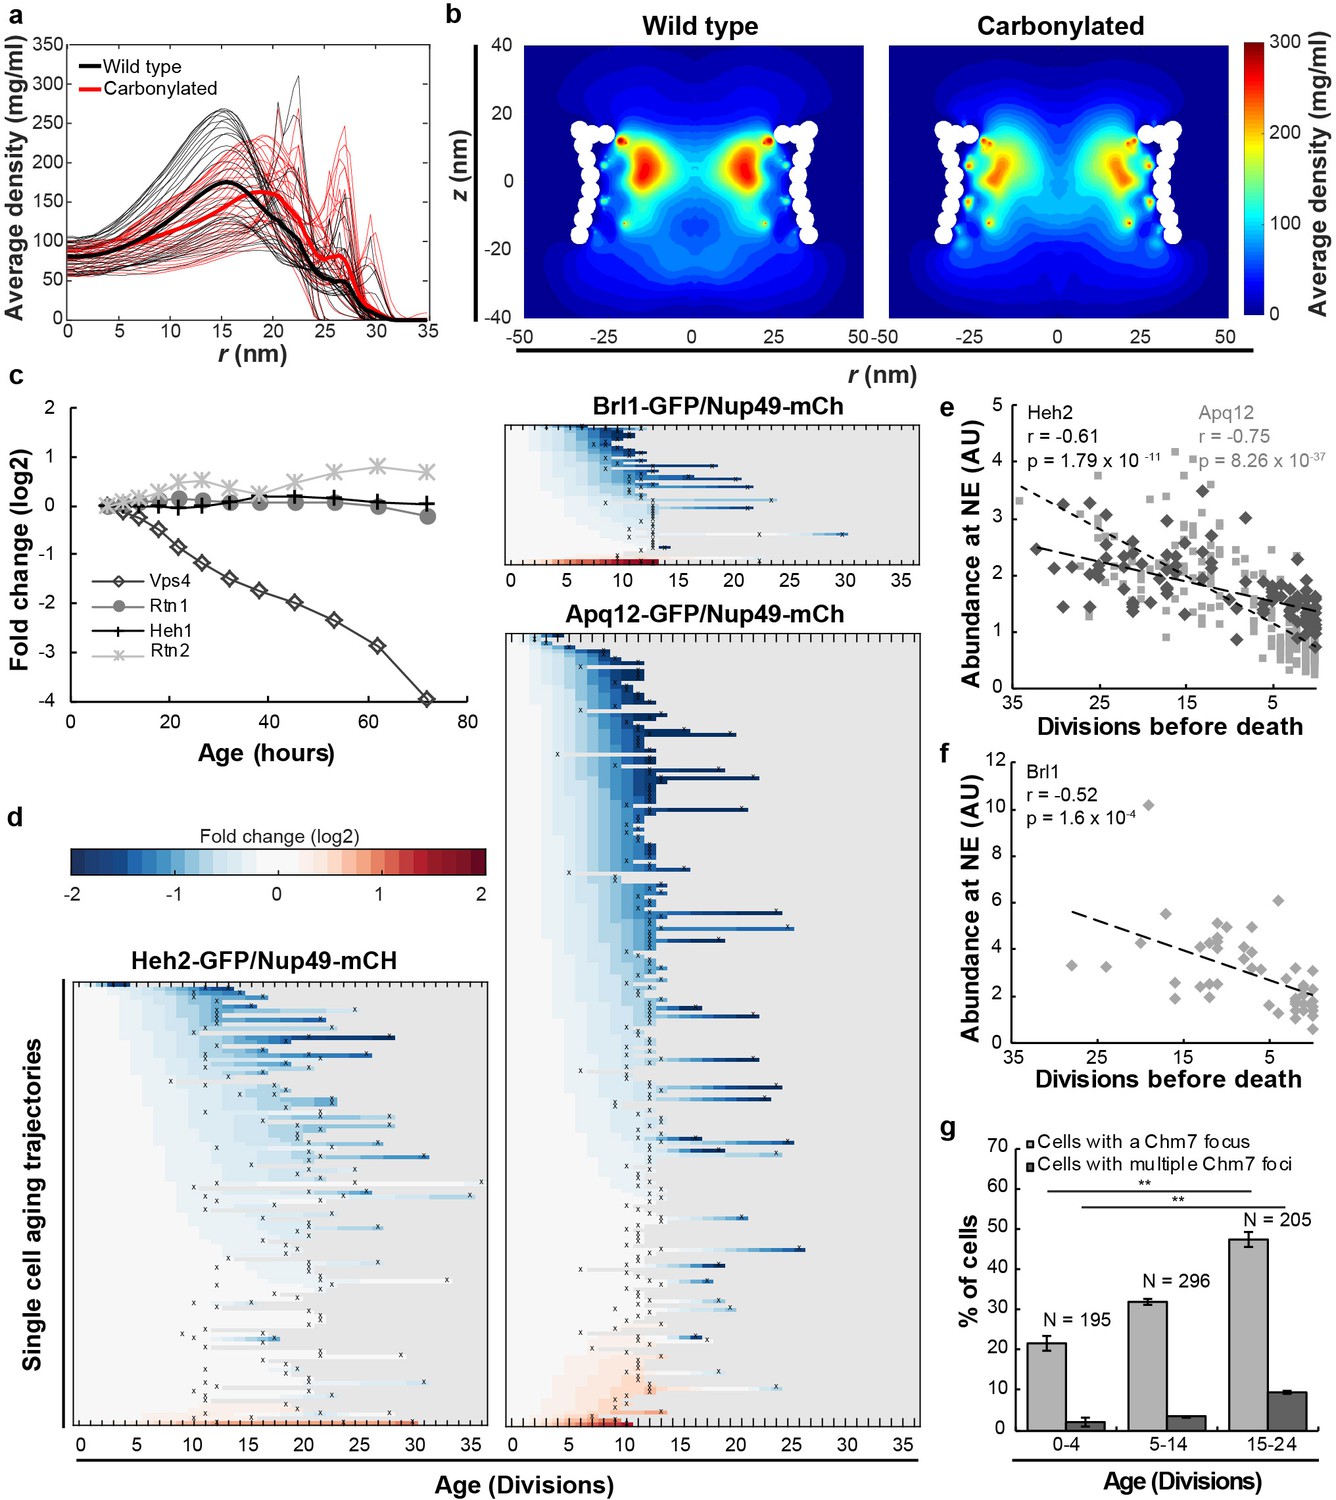
(a) Time-averaged radial density distribution of FG-Nups for different positions along the z-axis separated by 1 nm, in the range −15.4 < z < 15.4 nm, plotted for the wild type (black), the maximally carbonylated NPC (red) (See also Figure 2—figure supplement 1d,e). The dark colored lines represent the density averaged over the range −15.4 < z < 15.4 nm. (b) Time-averaged r-z density of FG-Nups in the wild type NPC (left panel), the oxidized NPC (right panel). (c) Protein abundance of Heh1, Vps4, Rtn1 and Rtn2 as measured in whole cell extracts of yeast cells of increasing replicative age. Data from Janssens et al. (2015). (d) Heatmaps showing single-cell abundance of Heh2-GFP (N = 100), Brl1-GFP (N = 53) and Apq12 (N = 200) at the NE, relative to Nup49-mCh in replicative aging. (e) Heh2-GFP and Apq12-GFP abundance at the NE, relative to Nup49-mCh, as a function of remaining lifespan. The dotted lines indicate best linear fit; Pearson correlations are indicated. Number of cells analyzed are Apq12 = 82, Heh2 = 51 and number of measuring points analyzed are Apq12 = 193 and Heh2 = 102. Data represents single replicates, a second replicate is shown in Figure 2—figure supplement 2. (f) Brl1 abundance at the NE, relative to Nup49-mCh, as a function of remaining lifespan. The dotted lines indicate best linear fit; Pearson correlations are indicated. Number of cells analyzed are 20 and number of measuring points analyzed are 47. (g) Percentage of cells with a Chm7 focus reflecting faulty NPCs at the NE at different ages. Buds were excluded from the analysis. Error bars are weighted SD from the mean, from three independent replicates. p-Values from Student’s t-test **p≤0.01. N = Total number of cells.
Figure 2—figure supplement 1
In vitro oxidation and models of NPCs with oxidative damage.
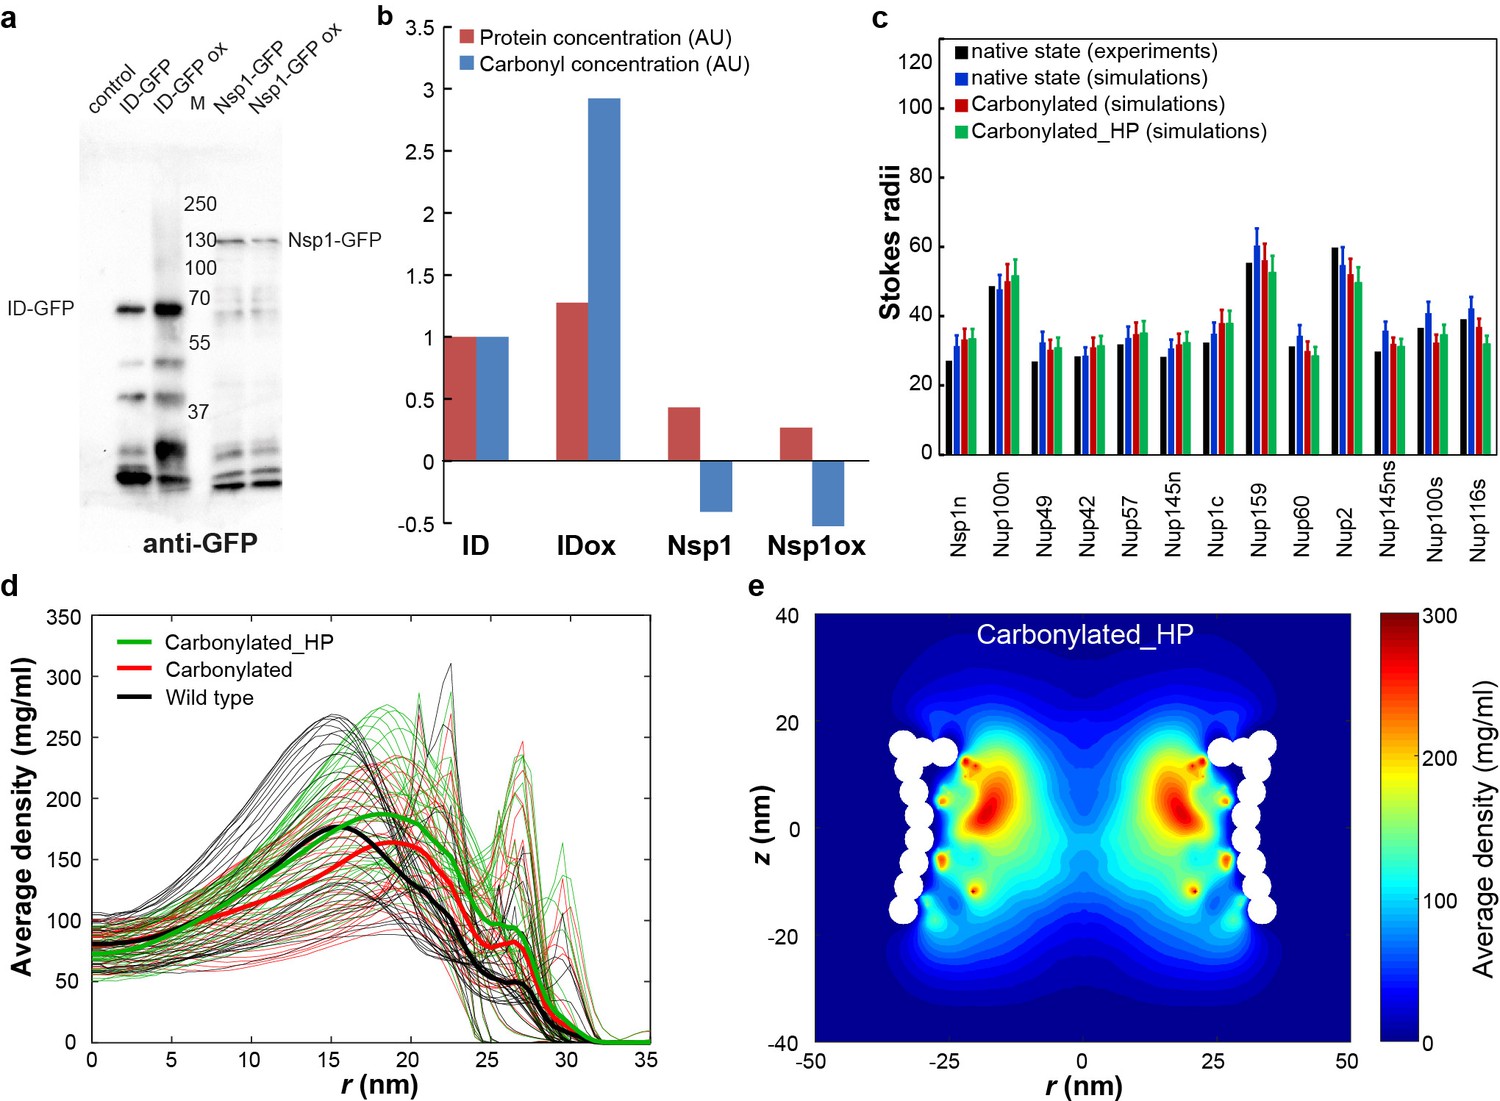
(a) Anti-GFP western blot of Nsp1-GFP immunoprecipitated from extracts of exponentially growing BY4741 cell expressing Nsp1-GFP from the native promoter and treated without or with 1 mM menadione for 90 min to induce high ROS levels (Nsp1-GFP, Nsp1-GFP ox). As positive control in vitro oxidized purified ID protein (namely the ID linker of Heh2 fused to GFP, ID-GFPox) was added to the BY4741 cell extracts before immunoprecipitation. BY4741 cell extract with and without additions of non-oxidized ID-GFP serve as negative controls (ID-GFP and control). (b) Carbonyl detection with ELISA. The immunoprecipitated samples were cleaned from detergents, and serial dilutions were bound to Nunc MaxiSorp ELISA plates and an ELISA with GFP antibodies as well as an oxi-ELISA, essentially as described by Alamdari et al. (2005), were performed. The read outs of both ELISAs represent the amount of protein (anti-GFP, red bars) or carbonyls (oxi-ELISA with anti-DNP, blue bars) on ID-GFP and Nsp1; carbonyl levels on Nsp1-GFP are below the detection level even under these strongly oxidizing conditions. (c) The Stokes radii for FG-Nups and FG-Nup segments for the native and carbonylated state (in Angstrom). The black bar represents the experimental (native) Stokes radii from Yamada et al. (2010), the blue bar represents the prediction for these native FG Nups (Ghavami et al., 2014), the prediction for the carbonylated FG Nups is plotted in red and the results for the carbonylated_HP (see Materials and methods for details) variant is shown in green. The error bar for the simulations represents the standard deviation in time. (d) Time averaged radial density plot for a carbonylated_HP NPC compared with the wild type and carbonylated NPCs at different positions along the z-axis separated by 1 nm in the z-range of −15.4 to 15.4 nm. In the carbonylated_HP NPC only the effect of carbonylation on the hydrophobicity is accounted for. The average over the different z-values is plotted as thick lines for all three cases. (e) Two-dimensional (rz) density map for the carbonylated_HP NPC.
Figure 2—figure supplement 2
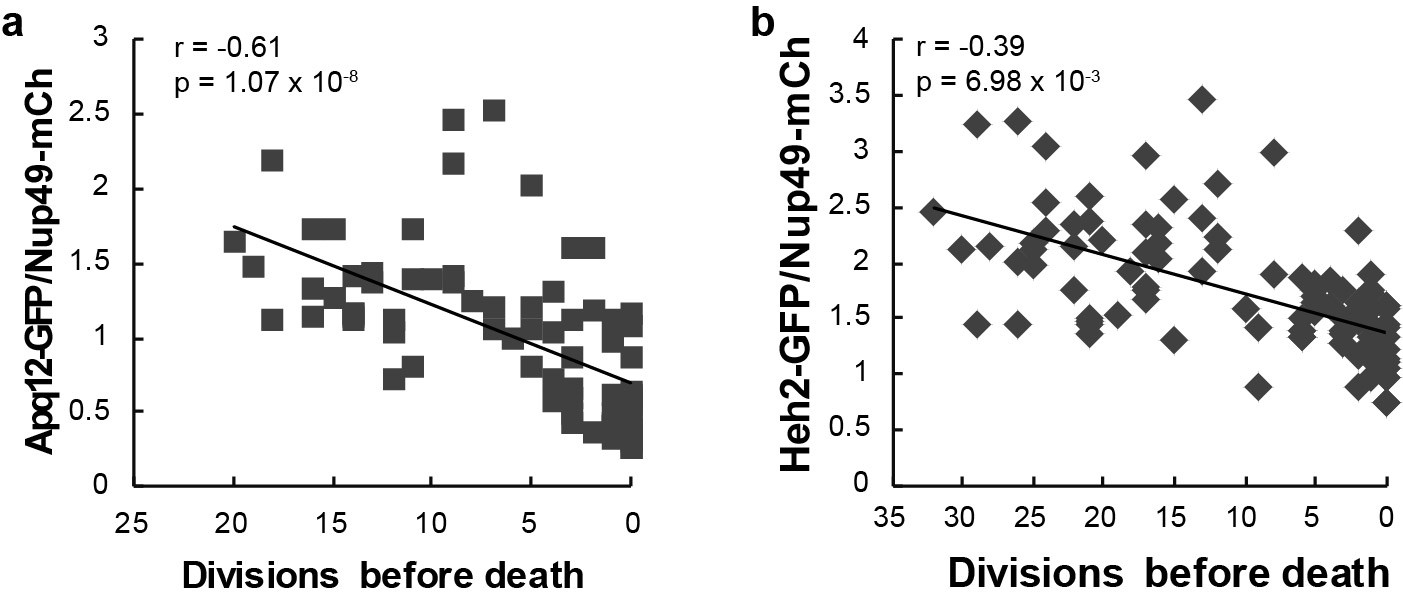
Heh2-GFP and Apq12-GFP abundance at the NE as a function of remaining lifespan.
Additional independent replicates (coming from a different microscope) for Apq12-GFP and Heh2-GFP abundance at the NE, relative to Nup49-mCh, as a function of remaining lifespan. The dotted lines indicate best linear fit; Pearson correlations are indicated. Number of cells analysed are Apq12 = 34, Heh2 = 14 and number of measuring points analyzed are Apq12 = 74 and Heh2 = 46.
Figure 3
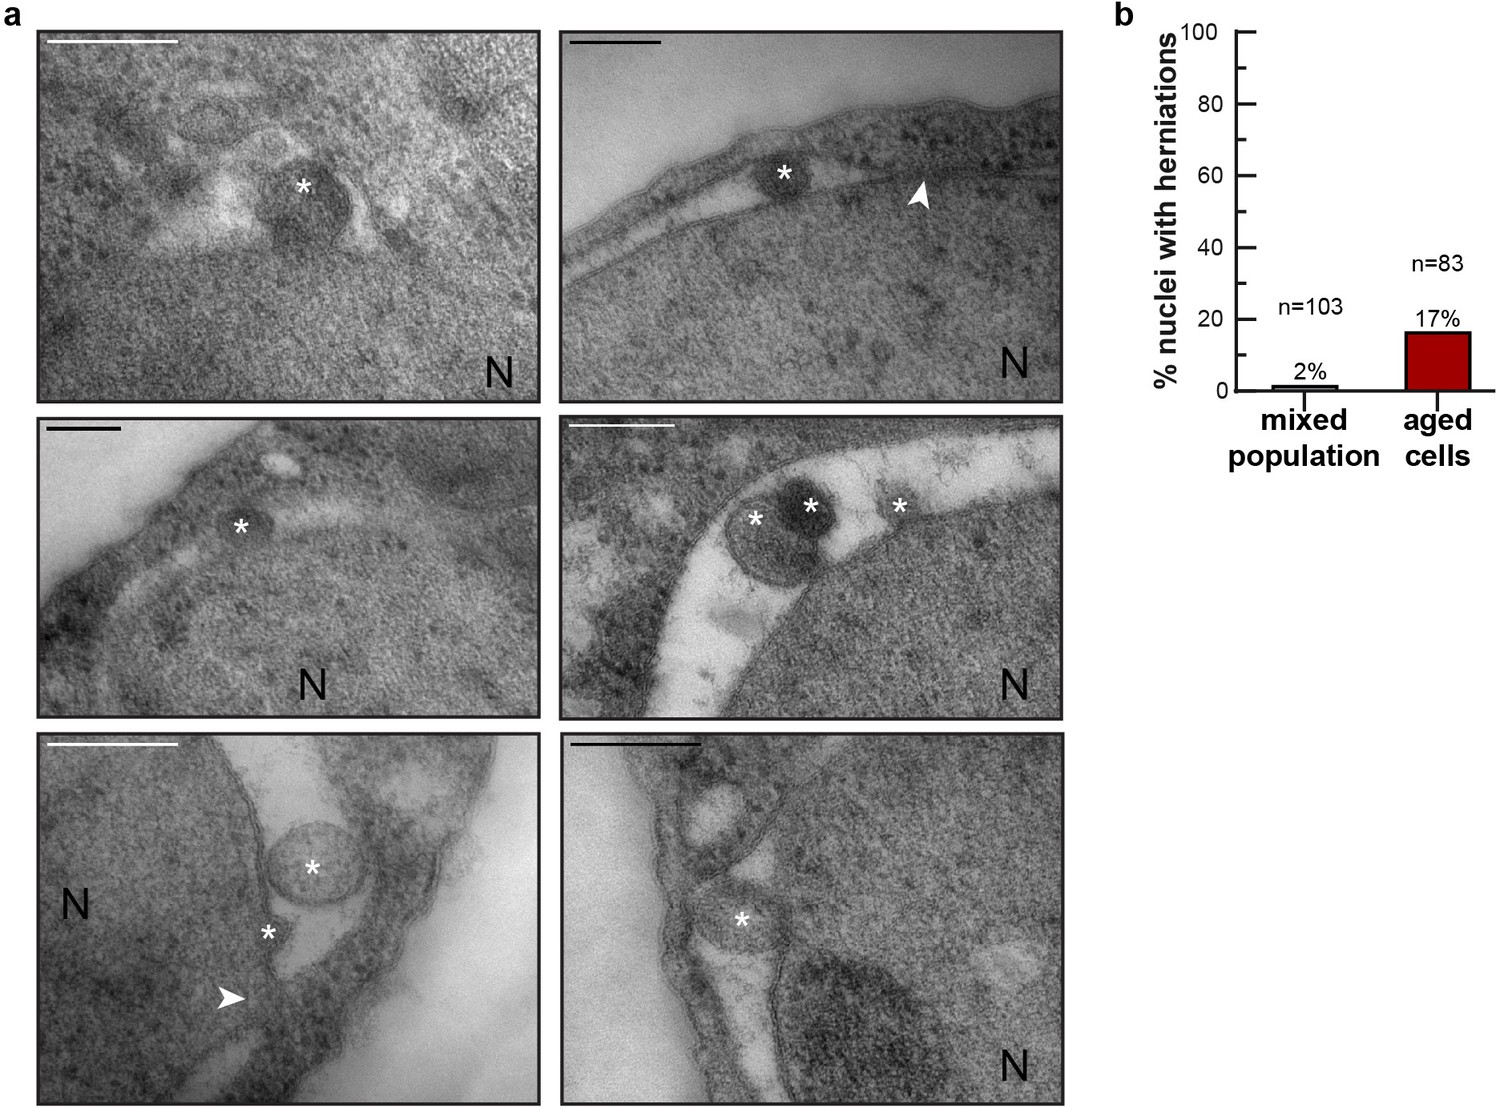
NE herniations are more prevalent in aged cells.
(a) Examples of NE herniations found in replicatively aged cells. NPCs are indicated by an arrowhead, asterisks indicate herniation lumens and the nucleus is marked with N. Scale bars are 200 nm. (b) Quantification of nuclei with herniations in thin sections. n indicates the number of cells with a visible nucleus analyzed.
Figure 4 with 4 supplements
Increased steady state nuclear compartmentalization in aging is mimicked in NPC assembly mutants.
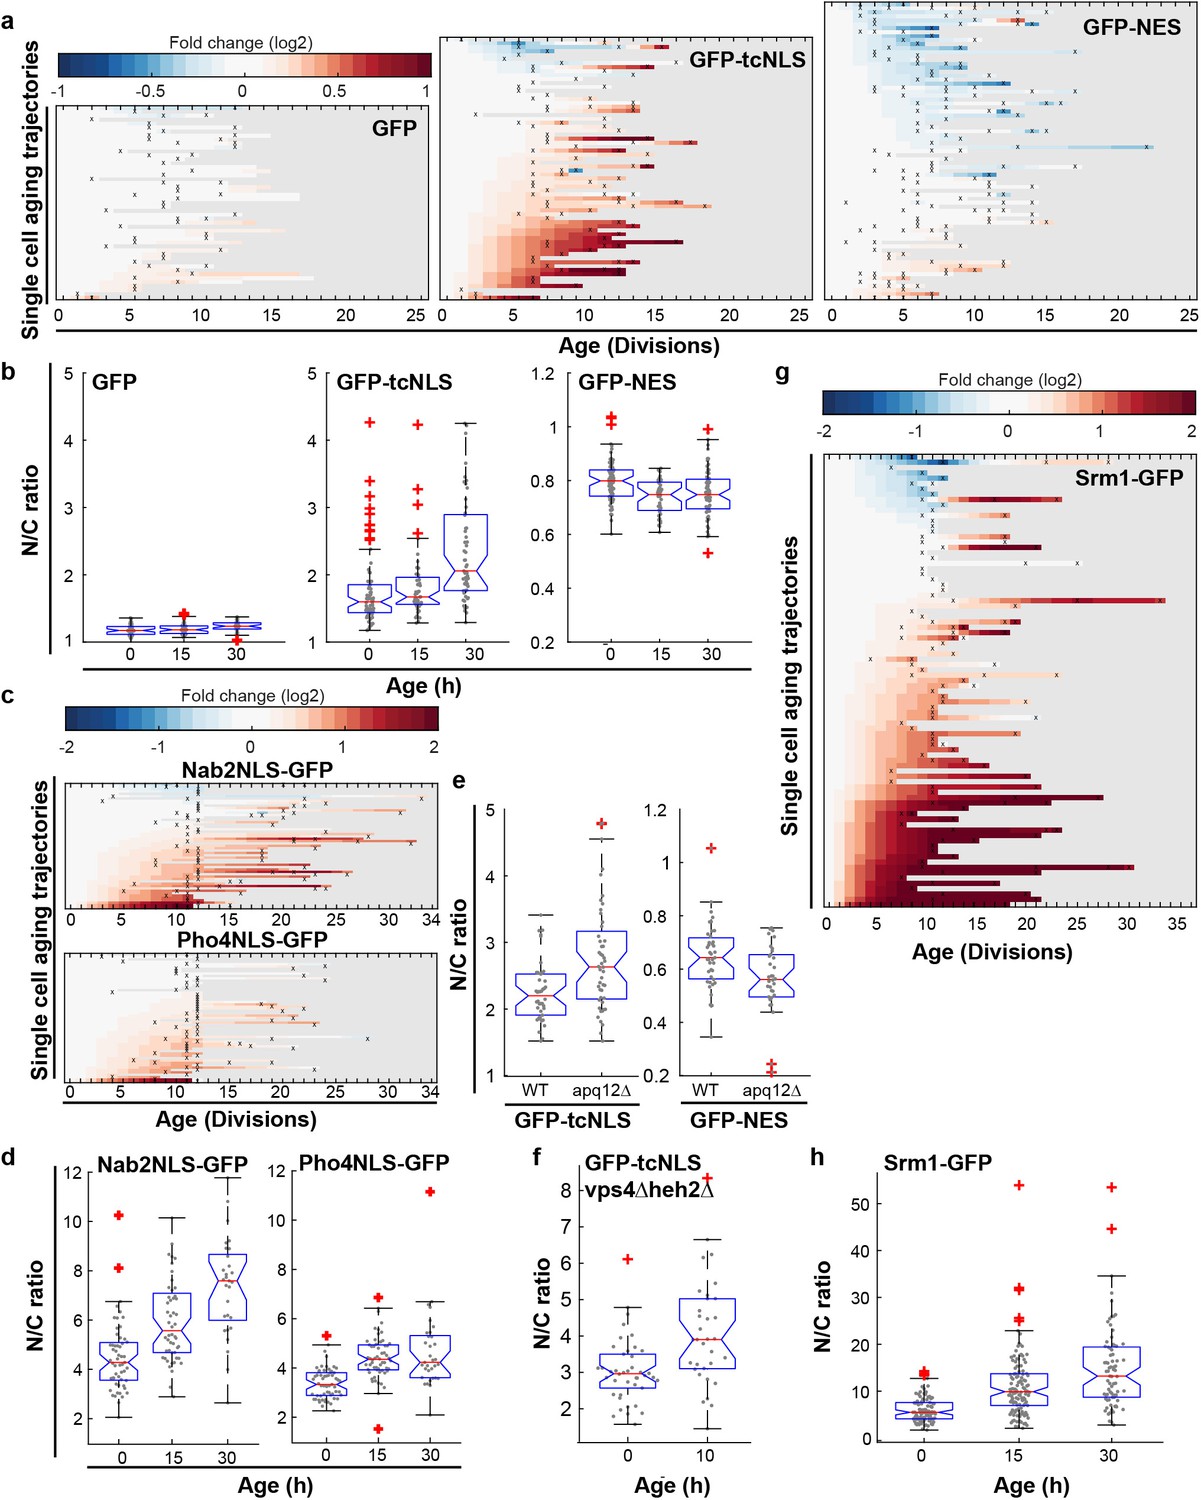
(a) Heatmaps showing single-cell changes in localization (N/C ratios) of GFP (N = 49), GFP-NES (N = 75) and GFP-NLS (N = 66) reporter proteins during replicative aging. (b) N/C ratios of GFP-tcNLS, GFP-NES and GFP as the cells age. The line indicates the median, and the bottom and top edges of the box indicate the 25th and 75th percentiles, respectively. The whiskers extend to the data points, which are closest to 1.5 times above below the inter quartile range, data points above or below this region are plotted individually. Non-overlapping notches indicate that the samples are different with 95% confidence. The number of cells analyzed are GFP = 54, 51, 34; GFP-NLS = 74, 48, 57 and GFP-NES = 75, 41, 66 at time points 0 hr, 15 hr and 30 hr, respectively. (c) Heatmaps showing single-cell changes in localization (N/C ratios) of Nab2NLS-GFP (N = 53) and Pho4NLS-GFP (N = 56) reporter proteins during replicative aging. (d) Median N/C ratios of Nab2NLS-GFP and Pho4NLS-GFP as the cells age. The number of cells analyzed are Nab2NLS-GFP = 55, 52, 29 and Pho4NLS-GFP = 59, 58, 33 at time points 0 hr, 15 hr and 30 hr, respectively. (e) Deletion of apq12 increases nuclear compartmentalization of GFP-NLS and GFP-NES. The number of cells analyzed are GFP-NLS = 42, 48 and GFP-NES = 39, 34 for WT and Δapq12, respectively (f) Increased nuclear compartmentalization of GFP-NLS during early aging (10 hr of aging, median age of 2 divisions) in a Δvps4Δheh2 background. The number of cells analysed are 42 and 33, respectively. (g) Heatmap showing single-cell changes in localization (N/C ratios) of Srm1-GFP (N = 85) during replicative aging. (h) N/C ratios of Srm1-GFP increases as cells age. Numbers of cells analysed are N = 103, 125, 77 at time points 0 hr, 15 hr and 30 hr, respectively.
Figure 4—figure supplement 1
Efflux rate constants in aging.
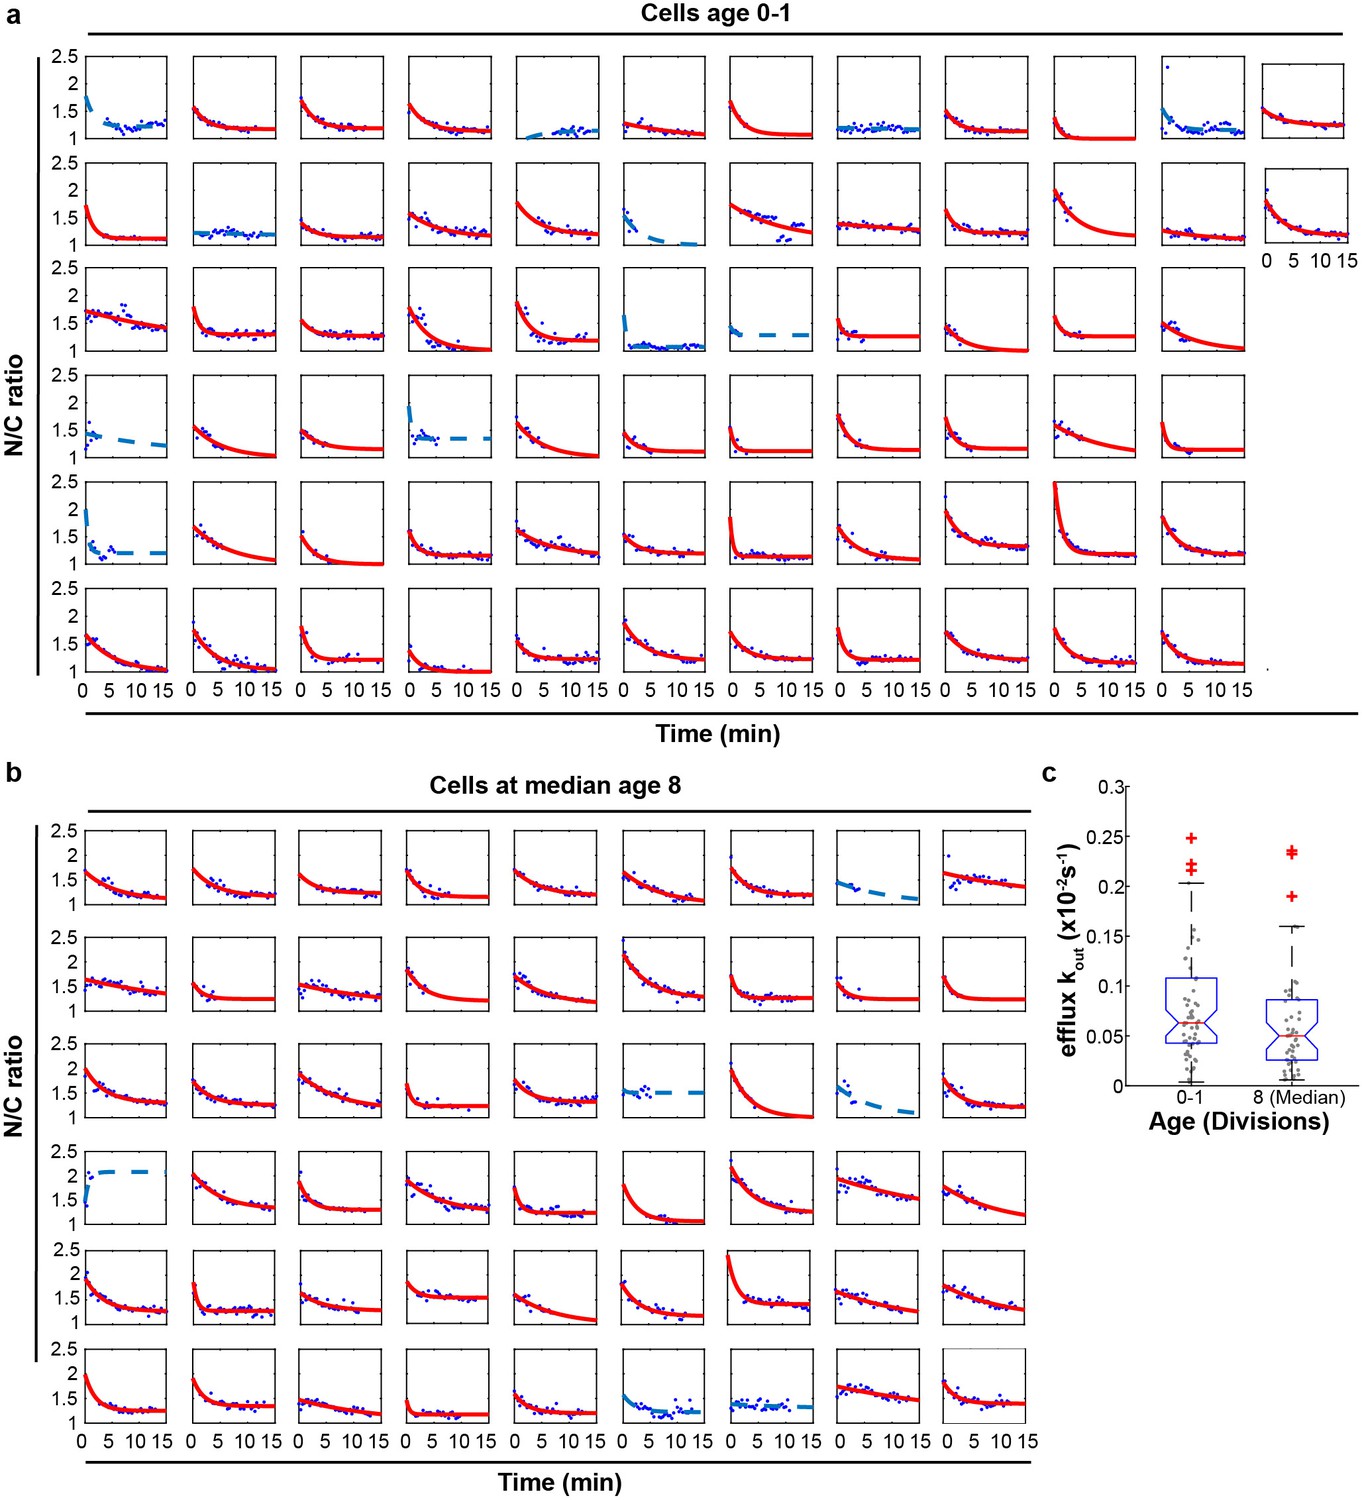
(a), (b) Singe-cell measurements of the kinetics of loss of nuclear accumulation of GFP-NLS from young cell and cell with median replicative age 8. Time zero is the time point at which the red colored medium (ponceau red) containing Na-azide and 2-Deoxy-D-glucose reached the cells that are trapped in the device. The measurements are fitted to an exponential decay function and yield the efflux rate constant (kout). Only cells with p<0.05 and R2 > 0.2 (plotted in red) are represented in panel c; poor fits (blue lines) are excluded from the analysis. (c) Efflux rate constant of cells age 0 and cells age 8. The average Kout of old cells is lower than for young cells, but changes are not significant. Number of cells included in the analysis are Age 0–1 = 57 and 8 (Median) = 48.
Figure 4—figure supplement 2
The abundance of transport factors and NTR cargos does not change in aging.
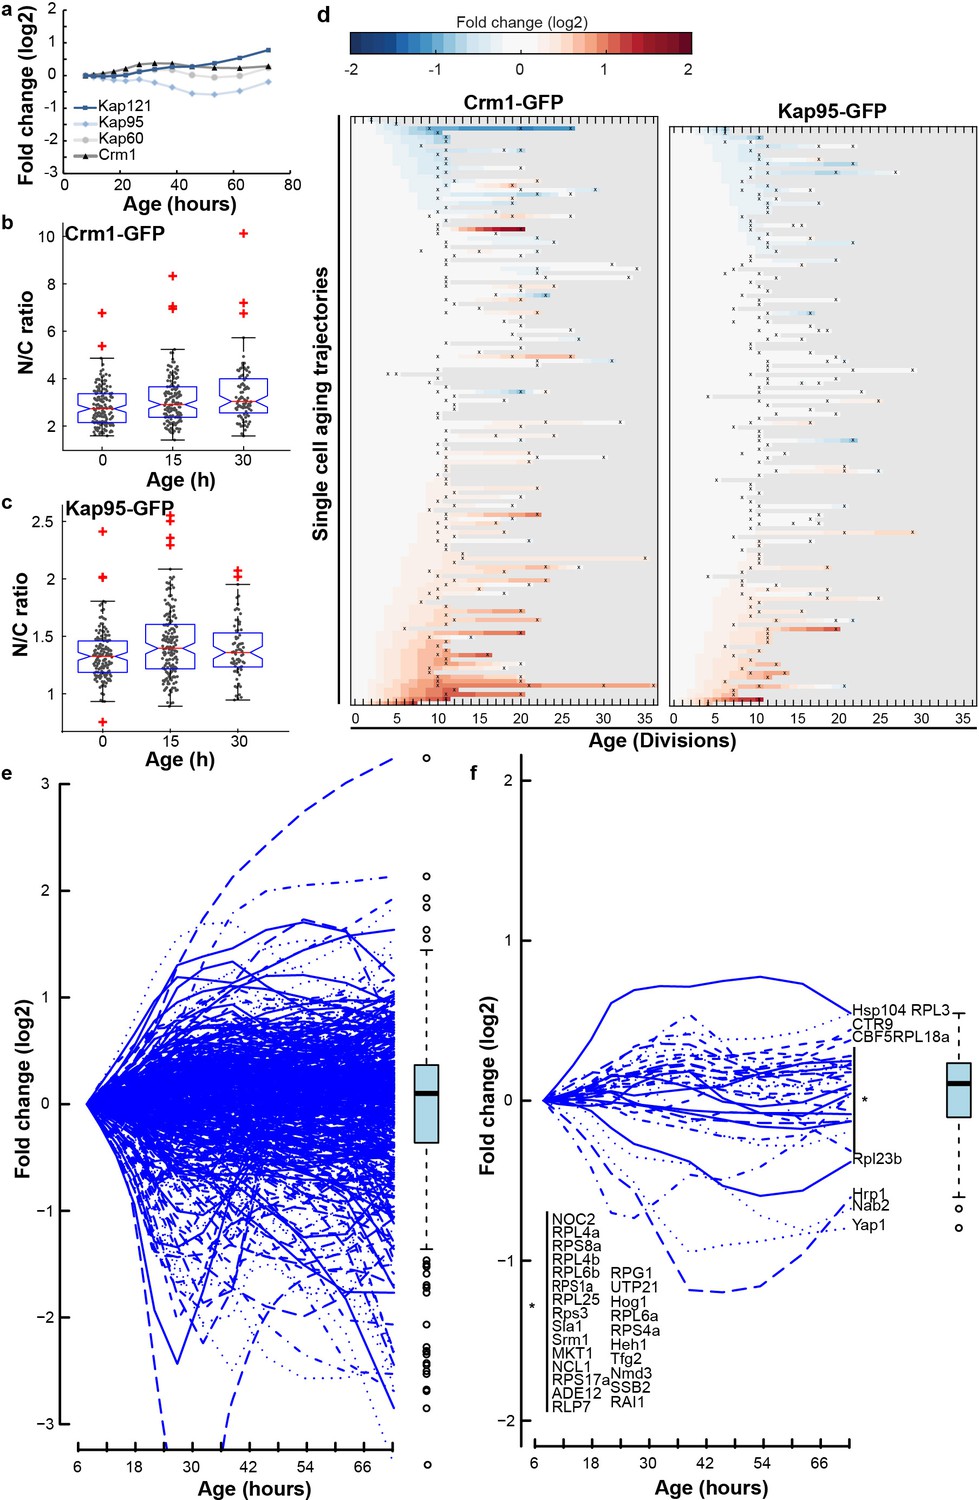
(a) Protein abundance of Crm1, Kap95, Kap60, Kap104 and Kap121 as measured in whole cell extracts of yeast cells of increasing replicative age. Data from Janssens et al. (2015). (b) (c) Localization of Crm1 (b) and Kap95 (c) during replicative aging to the nucleus relative to the cytosol (N/C ratio). The line indicates the median, and the bottom and top edges of the box indicate the 25th and 75th percentiles, respectively. The whiskers extend to the most extreme data points not considered outliers, and the outliers are plotted individually. Non-overlapping notches indicate that the samples are different with 95% confidence. The overall changes were thus not significant, although we note that based on a two-tailed Student’s T-test the N/C ratio for Kap95 is significantly increased after 15 hr (p=8.7×10⁻⁴). No significant correlation was found with age (Crm1: r = 0.15, p=0.09 and Kap95: r = 0.07, p=0.39), or lifespan (Crm1: r = 0.04, p=0.63 and Kap95: r = 0.11, p=0.16). Number of cells analysed at time points 0 hr, 15 hr, and 30 hr were for Kap95 = 155, 165, 72 and for Crm1 = 156, 138, 87. (d) Heatmap representation of changes in N/C ratio of Crm1-GFP (N = 134) and Kap95-GFP (N = 132). (e) Protein abundance of 507 proteins with the Gene Ontology term ‘nucleus’ as measured in whole cell extracts of yeast cells of increasing replicative age. Data from Janssens et al. (2015). This set of proteins provides an unbiased proxy of changes in total import. The median, average or summed abundance of these nuclear proteins does not change in aging. (f) Protein abundance of 13 known cargos of Kap60, Kap121, Kap104 and Crm1 and 17 additional proteins interacting with Kap121/Kap123 (based on Timney et al., 2006) as measured in whole cell extracts of yeast cells of increasing replicative age. Data from Janssens et al. (2015).
Figure 4—figure supplement 3
Replicative lifespan curves.
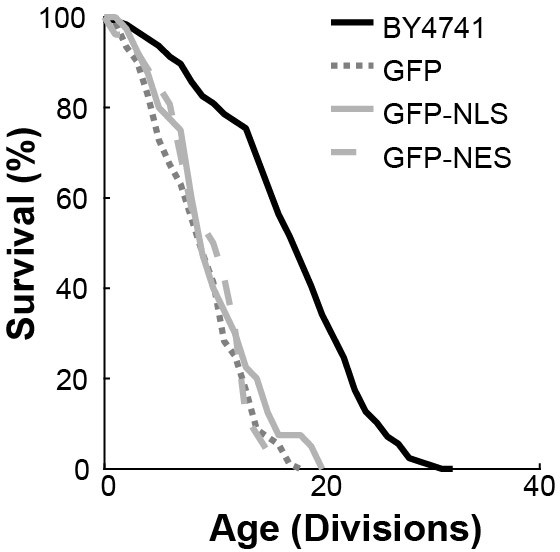
Replicative lifespan curves of strains expressing reporter proteins, in comparison to BY4741; all grown on medium supplemented with raffinose and galactose. The overexpression of GFP alone did not result in any observable growth defect in young cells, but did impact the lifespan of the yeast cells. This impact on lifespan is likely related to a general stress resulting from the additional protein synthesis and is unlikely to be related to nuclear transport. To enable comparison of the three reporter proteins, GFP, GFP-NLS and GFP-NES, in aging, we tuned their expression such that the impact on lifespan was similar for all three. Total number of cells analysed per strain were GFP = 89, GFP-NLS = 96, GFP-NES = 75, BY4741 = 126.
Figure 4—figure supplement 4
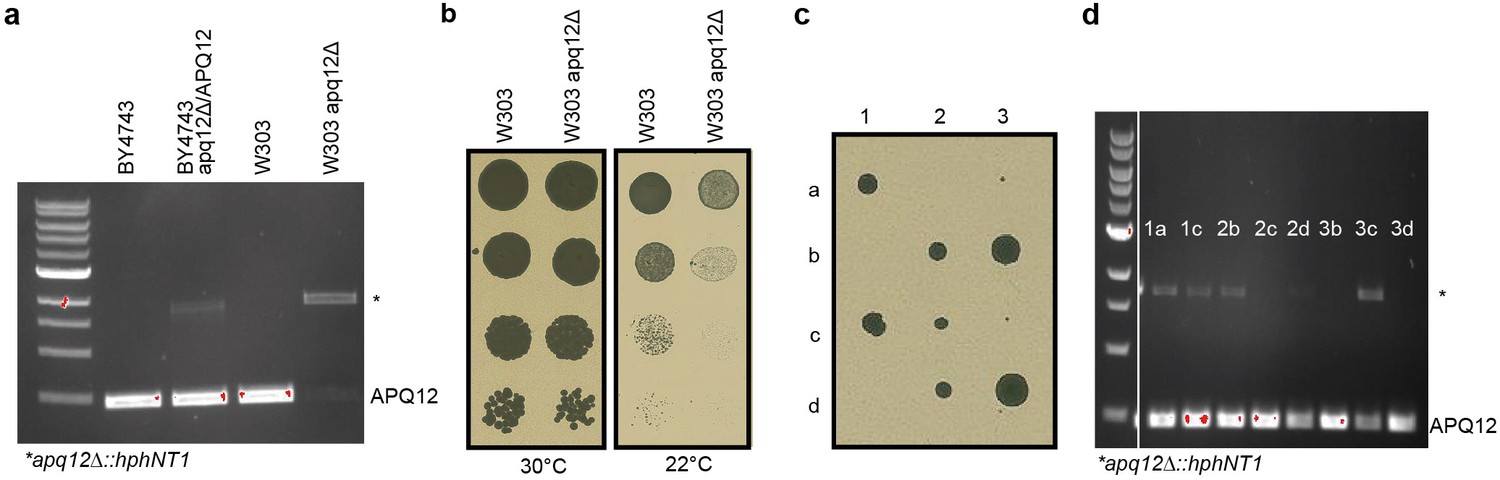
Apq12 is an essential gene in BY4741, but not in W303.
(a) PCR analysis of apq12 mutants confirming the genotype of the heterozygous diploid BY4743 apq12Δ/APQ12 and the haploid W303 apq12Δ. Strains were generated using the PCR toolbox (Janke et al., 2004) replacing the apq12 gene with a hygromycin resistance cassette (hphNT1) and the genotype was confirmed by PCR analysis using primers flanking the apq12 locus. We were not able to obtain transformants of haploid BY4741 with the hphNT1 in the apq12 locus. (b) Haploid W303 apq12Δ is sensitive to growth at 22°C, confirming the phenotype described by Scarcelli et al. (2007). (c) Tetrad dissection of spores generated from BY4743 apq12Δ/APQ12. Spores from the tetrads grew out in colonies with varying sizes, or often did not grow out at all. (d) Genotype of the resulting clones from the tetrad dissection was determined by PCR with primers flanking the apq12 locus, as described above for panel a). The clones that carry the hphNT1 in the apq12 locus also still carry a wildtype copy of APQ12 (clones 1a, 1 c, 2b and 3 c). The heterozygous diploid BY4743 apq12Δ/APQ12 shows genome instability, possibly resulting in an incorrect number of chromosomes after meiosis, enabling spores to carry a WT copy of APQ12 as well as the apq12 deletion.
Figure 5 with 1 supplement
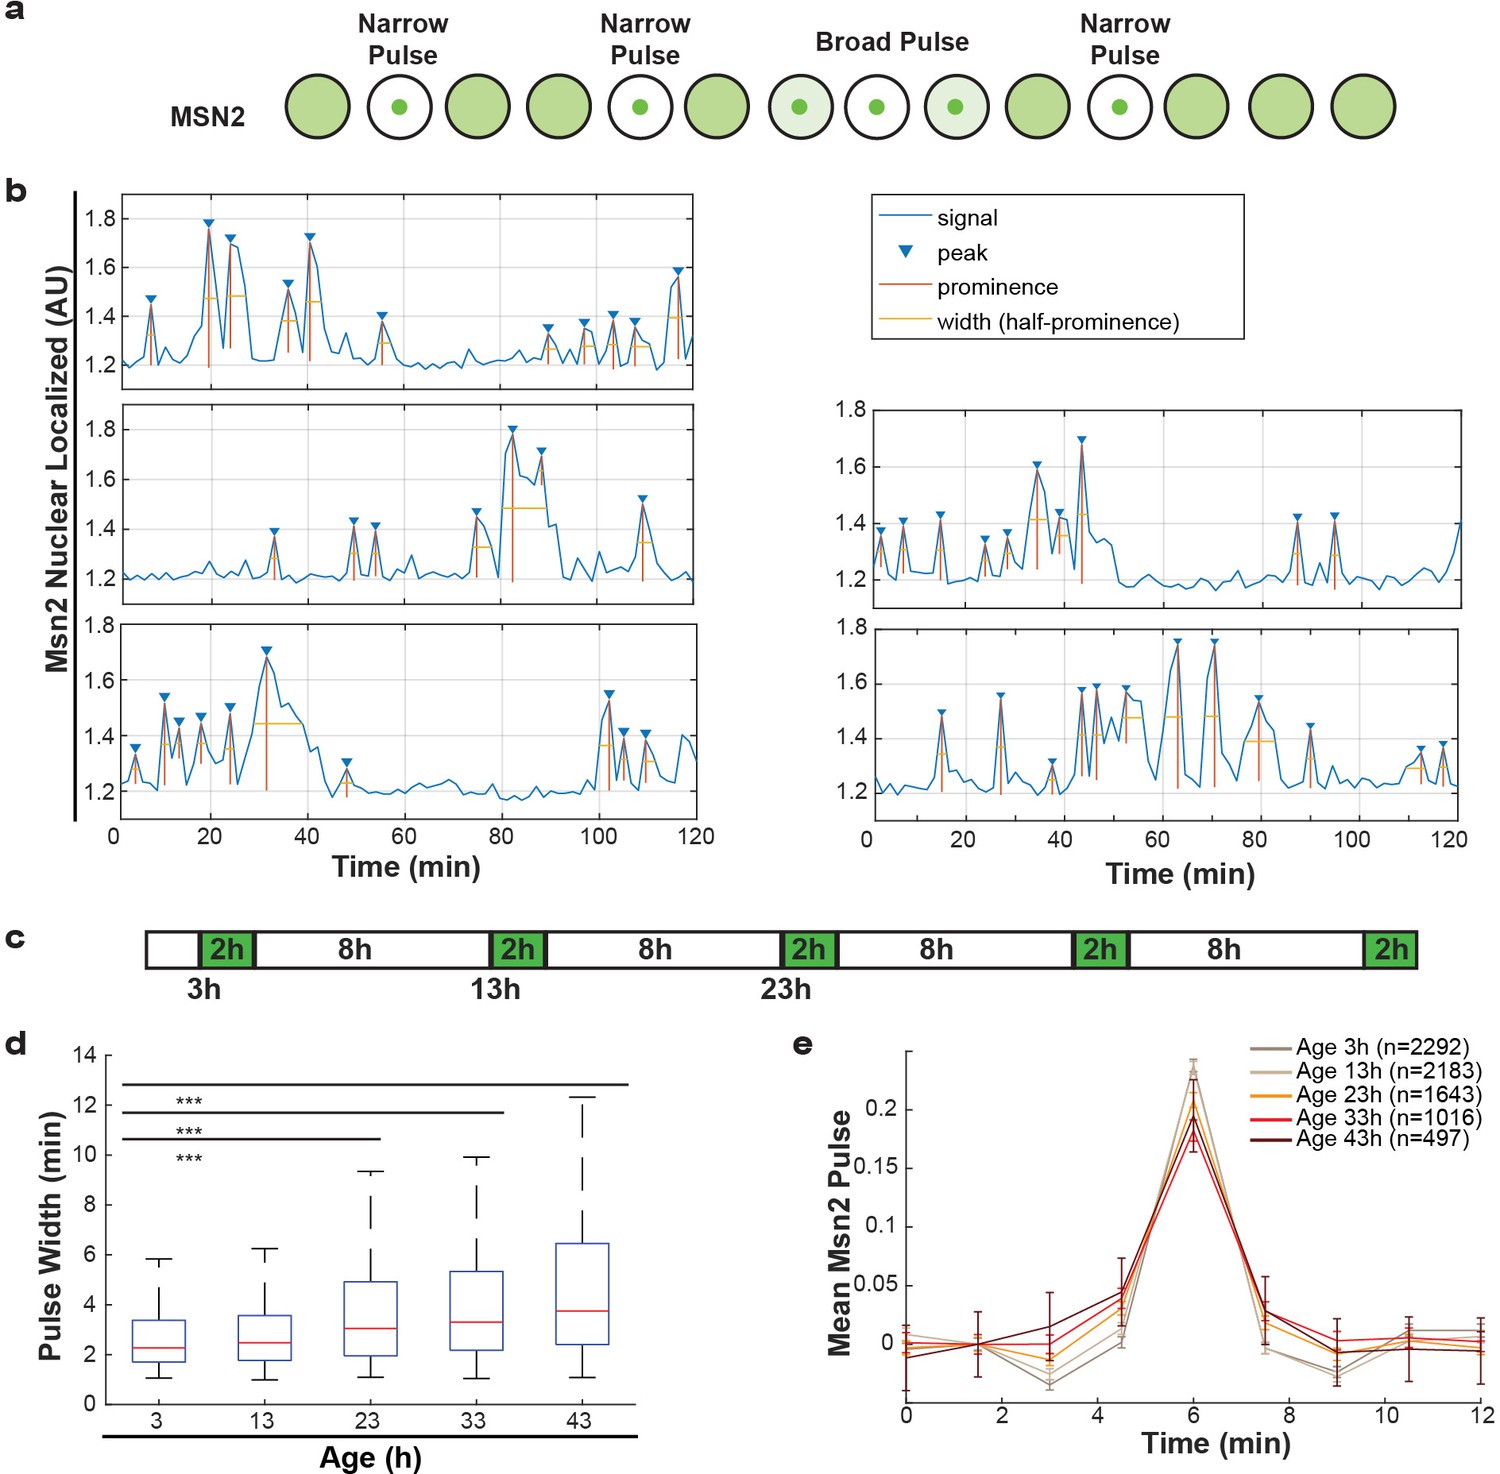
Alterations of nuclear envelope permeability during aging affects transcription factor dynamics.
(a) Schematic showing pulses of Msn2 translocation to the nucleus and movement back to the cytoplasm. (b) Five randomly selected single cell traces showing Msn2 dynamics. Low values indicate the majority of Msn2 is cytoplasmic, and high values indicate the majority of Msn2 is nuclear localized. Pulses are annotated showing peaks, prominence and the width of the pulse. (c) Experimental protocol for the aging experiment. White boxes indicate brightfield imaging only, and green boxes indicate fluorescence imaging. (d) As cells age, the width of the Msn2 pulses increases reliably. (*** indicates p<0.0001 two-tailed t-test). (e) Msn2 pulses were identified at each age, and then all pulses were averaged together at each age. To correct for changes in baseline localization with age, the mean pre-pulse level was subtracted at each age. Error bars are standard error.
Figure 5—figure supplement 1
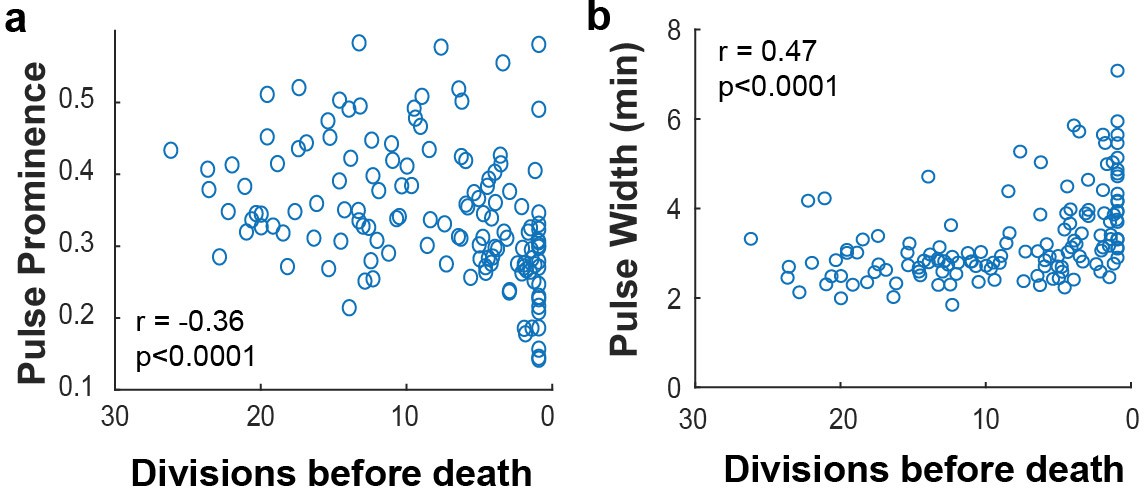
Msn2 pulse prominence and width correlate to remaining lifespan.
(a) The Msn2 pulse prominence is positively correlated with remaining lifespan. (b) The remaining lifespan is negatively correlated with increasing Msn2 pulse width. N value cells = 48, N value for scatter plot = 138.
Figure 6

Graphical summary.
(a) Summary of the measured changes. (b) Schematic representation of NPC assembly and nuclear transport dynamics in young cells. (c) Model: In old cells, the decrease in abundance of several proteins that assist in NPC assembly, and possibly the NPC components themselves, causes the accumulation of misassembled NPCs in aged mother cells. Misassembled NPCs are covered with membrane and do not participate in nucleocytoplasmic exchange, reducing the effective density of transport competent NPCs over time and leading to an increase in steady-state compartmentalization and concomitant decrease in transport dynamics.
Tables
Table 1
Details of the FG-Nup stoichiometry for the 24 constructed models to represent the aged NPC. 0 and 1 represent absence and presence, respectively, of the FG-Nup in 8-fold symmetry.
https://doi.org/10.7554/eLife.48186.018| NSP1 | NSP1 | NSP1 | NSP1 | Nup1 | Nup42 | Nup49 | Nup49 | Nup57 | Nup57 | Nup60 | Nup100 | Nup145 | Nup145 | Nup159 | Nup116 | |
| Model 1 | 0 | 0 | 1 | 1 | 1 | 1 | 1 | 1 | 1 | 1 | 1 | 1 | 1 | 1 | 1 | 0 |
| Model 2 | 0 | 0 | 1 | 1 | 1 | 1 | 1 | 1 | 1 | 1 | 1 | 0 | 1 | 1 | 1 | 0 |
| Model 3 | 0 | 0 | 1 | 1 | 1 | 1 | 1 | 1 | 1 | 1 | 0 | 1 | 1 | 1 | 1 | 0 |
| Model 4 | 0 | 0 | 1 | 1 | 1 | 1 | 1 | 1 | 1 | 1 | 0 | 0 | 1 | 1 | 1 | 0 |
| Model 5 | 0 | 0 | 1 | 1 | 0 | 1 | 1 | 1 | 1 | 1 | 1 | 1 | 1 | 1 | 1 | 0 |
| Model 6 | 0 | 0 | 1 | 1 | 0 | 1 | 1 | 1 | 1 | 1 | 1 | 0 | 1 | 1 | 1 | 0 |
| Model 7 | 0 | 0 | 1 | 1 | 0 | 1 | 1 | 1 | 1 | 1 | 0 | 1 | 1 | 1 | 1 | 0 |
| Model 8 | 0 | 0 | 1 | 1 | 0 | 1 | 1 | 1 | 1 | 1 | 0 | 0 | 1 | 1 | 1 | 0 |
| Model 9 | 0 | 0 | 1 | 0 | 1 | 1 | 0 | 1 | 0 | 1 | 1 | 1 | 1 | 1 | 1 | 0 |
| Model 10 | 0 | 0 | 1 | 0 | 1 | 1 | 0 | 1 | 0 | 1 | 1 | 0 | 1 | 1 | 1 | 0 |
| Model 11 | 0 | 0 | 1 | 0 | 1 | 1 | 0 | 1 | 0 | 1 | 0 | 1 | 1 | 1 | 1 | 0 |
| Model 12 | 0 | 0 | 1 | 0 | 1 | 1 | 0 | 1 | 0 | 1 | 0 | 0 | 1 | 1 | 1 | 0 |
| Model 13 | 0 | 0 | 1 | 0 | 0 | 1 | 0 | 1 | 0 | 1 | 1 | 1 | 1 | 1 | 1 | 0 |
| Model 14 | 0 | 0 | 1 | 0 | 0 | 1 | 0 | 1 | 0 | 1 | 1 | 0 | 1 | 1 | 1 | 0 |
| Model 15 | 0 | 0 | 1 | 0 | 0 | 1 | 0 | 1 | 0 | 1 | 0 | 1 | 1 | 1 | 1 | 0 |
| Model 16 | 0 | 0 | 1 | 0 | 0 | 1 | 0 | 1 | 0 | 1 | 0 | 0 | 1 | 1 | 1 | 0 |
| Model 17 | 0 | 0 | 0 | 1 | 1 | 1 | 1 | 0 | 1 | 0 | 1 | 1 | 1 | 1 | 1 | 0 |
| Model 18 | 0 | 0 | 0 | 1 | 1 | 1 | 1 | 0 | 1 | 0 | 1 | 0 | 1 | 1 | 1 | 0 |
| Model 19 | 0 | 0 | 0 | 1 | 1 | 1 | 1 | 0 | 1 | 0 | 0 | 1 | 1 | 1 | 1 | 0 |
| Model 20 | 0 | 0 | 0 | 1 | 1 | 1 | 1 | 0 | 1 | 0 | 0 | 0 | 1 | 1 | 1 | 0 |
| Model 21 | 0 | 0 | 0 | 1 | 0 | 1 | 1 | 0 | 1 | 0 | 1 | 1 | 1 | 1 | 1 | 0 |
| Model 22 | 0 | 0 | 0 | 1 | 0 | 1 | 1 | 0 | 1 | 0 | 1 | 0 | 1 | 1 | 1 | 0 |
| Model 23 | 0 | 0 | 0 | 1 | 0 | 1 | 1 | 0 | 1 | 0 | 0 | 1 | 1 | 1 | 1 | 0 |
| Model 24 | 0 | 0 | 0 | 1 | 0 | 1 | 1 | 0 | 1 | 0 | 0 | 0 | 1 | 1 | 1 | 0 |
Table 2
Force field parameters for carbonylated amino acids.
Here, and represent the hydrophobicity of amino acids in their native condition according to Ghavami et al. (2014) and the weighted average scheme, respectively. denotes the hydrophobicity derived from the weighted average scheme and stands for the charge modification from the native to the carbonylated state.
| AA | ||||
|---|---|---|---|---|
| T | 0.51 | 0.52 | 0.34 | 0 −>0 |
| K | 0.00 | 0.00 | 0.59 | 1 −>0 |
| P | 0.65 | 0.63 | 0.43 | 0 −>0 |
| R | 0.00 | 0.07 | 0.43 | 1 −>0 |
Table 3
Physical properties of the wild type, carbonylated and carbonylated_HP NPCs.
In the carbonylated_HP NPC only the effect of carbonylation on the hydrophobicity is accounted for. For the net hydrophobicity, we added the hydrophobicity values ε of all the residues inside the NPC.
| Force field | +ve Charged AA | -ve Charged AA | Net charge | Net hydrophobicity |
|---|---|---|---|---|
| Wild type | 8072 | 7560 | +512 | 43373.7 |
| Carbonylated | 0 | 7560 | −7560 | 45549.7 |
| Carbonylated_HP | 8072 | 7560 | +512 | 45549.7 |
Table 4
Strains and plasmids
https://doi.org/10.7554/eLife.48186.021| Yeast strains | Source |
|---|---|
| BY4741 yeast (MATa his3Δ1 leu2Δ0 met15Δ0 ura3Δ0) | Invitrogen |
| BY4742 yeast (MATα his3Δ1 leu2Δ0 lys2Δ0 ura3Δ0) | Invitrogen |
| Apq12Δ; Y01433 (MATa; ura3Δ0; leu2Δ0; his3Δ1; met15Δ0; YIL040w::kanMX4) | This study |
| W303 Apq12Δ apq12::hphNTI leu2-3,112 trp1-1 can1-100 ura3-1 ade2-1 his3-11,15 | This study |
| Nup116-GFPboundary MKY227 (W303, ADE2+) | Mattheyses et al., 2010 |
| Nup116-GFPboundary BY4741 | This study |
| Apq12-GFP yeast (MATa his3Δ1 leu2Δ0 met15Δ0 ura3Δ0 Apq12-GFP::His3M × 6) | ThermoFisher (Huh et al., 2003) |
| Nup2-GFP yeast (MATa his3Δ1 leu2Δ0 met15Δ0 ura3Δ0 Nup2-GFP::His3M × 6) | ThermoFisher |
| Nup49-GFP yeast (MATa his3Δ1 leu2Δ0 met15Δ0 ura3Δ0 Nup49-GFP::His3M × 6) | ThermoFisher |
| Nup100-GFP yeast (MATa his3Δ1 leu2Δ0 met15Δ0 ura3Δ0 Nup100-GFP::His3M × 6) | ThermoFisher |
| Nup133-GFP yeast (MATa his3Δ1 leu2Δ0 met15Δ0 ura3Δ0 Nup133-GFP::His3M × 6) | ThermoFisher |
| Heh2-GFP yeast (MATa his3 leu2 met15 ura3Δ0 Heh2-GFP::His3M × 6) | ThermoFisher |
| Srm1-GFP yeast (MATa his3Δ1 leu2Δ0 met15Δ0 ura3Δ0 Srm1-GFP::His3M × 6) | ThermoFisher |
| Kap95-GFP yeast (MATa his3Δ1 leu2Δ0 met15Δ0 ura3Δ0 Kap95-GFP::His3M × 6) | ThermoFisher |
| Crm1-GFP yeast (MATa his3Δ1 leu2Δ0 met15Δ0 ura3Δ0 Crm1-GFP::His3M × 6) | ThermoFisher |
| Msn2-GFP yeast (MATa his3 leu2 met15 ura3Δ0 Msn2-GFP::His3M × 6) | ThermoFisher |
| JTY7; Nup49-mCh (MATα Nup49-mCh::CaURA3 can1Δ::STE2pr-LEU2 ura3Δ0 lyp1Δ leu2Δ0 his3Δ1 met15Δ0) | Tkach et al., 2012 |
| yIS010; Nup2-GFP Nup49-mCh (MATa his3Δ1 leu2Δ0 met15Δ0 ura3Δ0 Nup2-GFP::His3M × 6 Nup49-mCh::URA) | This study |
| yIS011; Nup100-GFP Nup49-mCh (MATa his3Δ1 leu2Δ0 met15Δ0 ura3Δ0 Nup100-GFP::Hi3M × 6 s Nup49-mCh::URA) | This study |
| yIS012; Nup116-GFP Nup49-mCh (MATa his3Δ1 leu2Δ0 met15Δ0 ura3Δ0 Nup116-GFPboundary Nup49-mCh::URA) | This study |
| yIS013; Nup133-GFP Nup49-mCh (MATa his3Δ1 leu2Δ0 met15Δ0 ura3Δ0 Nup133-GFP::His Nup49-mCh::URA) | This study |
| yIS014; Nup49-GFP Nup133-mCh (MATa his3Δ1 leu2Δ0 met15Δ0 ura3Δ0 Nup49-GFP::His3M × 6 Nup133-mCh::URA) | This study |
| yIS018; Apq12-GFP Nup49-mCh (MATa his3Δ1 leu2Δ0 met15Δ0 ura3Δ0 Apq12-GFP::His3M × 6 Nup49-mCh::URA) | This study |
| yIS021; Srm1-GFP Nup49-mCh (MATa his3Δ1 leu2Δ0 met15Δ0 ura3Δ0 Srm1-GFP::His3M × 6 Nup49-mCh::URA) | This study |
| yIS022; Kap95-GFP Nup49-mCh (MATa his3Δ1 leu2Δ0 met15Δ0 ura3Δ0 Kap95-GFP::His3M × 6 Nup49-mCh::URA) | This study |
| yIS023; Crm1-GFP Nup49-mCh (MATa his3Δ1 leu2Δ0 met15Δ0 ura3Δ0 Crm1-GFP::His3M × 6 Nup49-mCh::URA) | This study |
| yIS027; Apq12Δ Nup49-mCh GFP-NLS (MATa; ura3Δ0; leu2Δ0; his3Δ1; met15Δ0; YIL040wΔ::kanMX4; GFP-tcNLS(pGal1)::His Nup49-mCH::URA) | This study |
| yIS028; Apq12Δ Nup49-mCh GFP-NES (MATa; ura3Δ0; leu2Δ0; his3Δ1; met15Δ0; YIL040wΔ::kanMX4; GFP-NES(pGal1)::His Nup49-mCH::URA) | This study |
| yIS032; Chm7-yeGFP Nup49-mCh (MATa his3Δ1 leu2Δ0 met15Δ0 ura3Δ0 Chm7-yeGFP::His Nup49-mCh::URA) | This study |
| yIS035; Heh2-GFP Nup49-mCh (MATa his3Δ1 leu2Δ0 met15Δ0 ura3Δ0 Heh2-GFP::His3M × 6 Nup49-mCh::URA) | This study |
| yPP008; GFP-tcNLS Nup49-mCh (MATa his3Δ1 leu2Δ0 met15Δ0 ura3Δ0 GFP-tcNLS(pGal1)::His Nup49-mCh::URA) | This study |
| yPP009; GFP Nup49-mCh (MATa his3Δ1 leu2Δ0 met15Δ0 ura3Δ0 GFP(pGal1)::His Nup49-mCh::URA) | This study |
| yPP011; GFP-NES Nup49-mCh (MATa his3Δ1 leu2Δ0 met15Δ0 ura3Δ0 GFP-NES(pGal1)::His Nup49-mCh::URA) | This study |
| yAA001; Nab2NLS-GFP Nup49-mCh (MATα Nup49-mCh::CaURA3 can1Δ::STE2pr-LEU2 ura3Δ0 lyp1Δ leu2Δ0 his3Δ1:: Nab2NLS(pTpi1)::His met15Δ0) | This study |
| yAA002; Pho4NLS-GFP Nup49-mCh (MATα Nup49-mCh::CaURA3 can1Δ::STE2pr-LEU2 ura3Δ0 lyp1Δ leu2Δ0 his3Δ1:: Pho4NLS(pTpi1)::His met15Δ0) | This study |
| Oligonucleotides | |
| Chm7-GFP-S3 fw (GAAAACCACGATAATGAGATAAGAAAAATCATGATGGAAGAACAACCACGTCGTACGCTGCAGGTCGAC) | This study |
| Chm7-GFP-S2 rv (CATATTTATTTTTTATTTATACATATATATTTATTTATTAGTCACTCAGTTCGATCGATGAATTCGAGCTCG) | This study |
| Plasmids | |
| Plasmid: pYM44 yeGFP-tag | Janke et al., 2004 |
| Plasmid: pYM28 EGFP-tag | Janke et al., 2004 |
| Plasmid: pNZ-h2NLS-L-GFP (ID-GFP) | Meinema et al., 2011 |
| Plasmid: pBT016 pYX242-NAB2NLS-GFP-PRA | Timney et al., 2006 |
| Plasmid: pBT018 pYX242-PHO4NLS-GFP-PRA | Timney et al., 2006 |
| Plasmid: pPP014 mCh-Ura-Cassette | This study |
| Plasmid: pPP042 pRS303-GFP-tcNLS | This study |
| Plasmid: pPP043 pRS303-GFP | This study |
| Plasmid: pPP046 pRS303-GFP-NES | This study |
| Plasmid: pAA8 pRS303-Nab2NLS-GFP | This study |
| Plasmid: pAA9 pRS303-Pho4NLS-GFP | This study |
Additional files
-
Transparent reporting form
- https://doi.org/10.7554/eLife.48186.022
Download links
A two-part list of links to download the article, or parts of the article, in various formats.
Downloads (link to download the article as PDF)
Open citations (links to open the citations from this article in various online reference manager services)
Cite this article (links to download the citations from this article in formats compatible with various reference manager tools)
Age-dependent deterioration of nuclear pore assembly in mitotic cells decreases transport dynamics
eLife 8:e48186.
https://doi.org/10.7554/eLife.48186


