Cis-regulatory basis of sister cell type divergence in the vertebrate retina
- Washington University School of Medicine, United States
Figures
Figure 1 with 2 supplements

Isolation of bipolar cell populations from adult mouse retina.
(A) Left, Histological section of adult mouse retina stained with 4′,6-diamidino-2-phenylindole (DAPI), to highlight nuclei. ONL = outer nuclear layer, INL = inner nuclear layer, GCL = ganglion cell layer. Right, Schematic depiction of the location and relative abundance of photoreceptor and bipolar cell types. Percentage representation for each cell population in the mouse retina is shown, based on Jeon et al. (1998). (B) Left, Histologic sections of retina from transgenic mice expressing fluorescent marker proteins. In Otx2-GFP mice, GFP is strongly expressed in all bipolar cells, and weakly in photoreceptors. In Grm6-YFP mice, YFP is expressed exclusively in ON bipolar cells. Bipolar cell populations in the INL are linked to their position on FACS scatterplots with arrows (FSC = Forward Scatter). (Top). All bipolar cells from Otx2-GFP+ mice are boxed in green. Bottom: in Otx2-GFP+;Grm6-YFP+ mice, ON bipolar cells (purple box) are separable from OFF bipolar cells (gold box) based on intensity of fluorescence. (C) RT-qPCR analysis of retinal cell class markers (Macosko et al., 2015) in sorted ON (purple) and OFF (gold) bipolar cells normalized to expression in whole retina (blue). Vsx2 = bipolar cells; Gnat1 = rod photoreceptors; Lhx1 = horizontal cells; Pax6 = amacrine, ganglion, horizontal cells; Rlbp1 = Müller glia; Slc17a6 = ganglion cells; Grm6 = ON bipolar cells; Tacr3 = OFF bipolar cells (Types 1A, 1B, and 2).
Figure 1—figure supplement 1

Reproducibility of ATAC-seq and RNA-seq datasets.
(A) Pairwise comparison between biological replicates of RNA-seq from purified photoreceptor and bipolar cell populations. For each sample, normalized read counts from one biological replicate are plotted against normalized read counts of another biological replicate. (B) Pairwise comparison between biological replicates of ATAC-seq from purified photoreceptor and bipolar cell populations as in A. PCC: Pearson Correlation Coefficient. SCC: Spearman Correlation Coefficient.
Figure 1—figure supplement 2
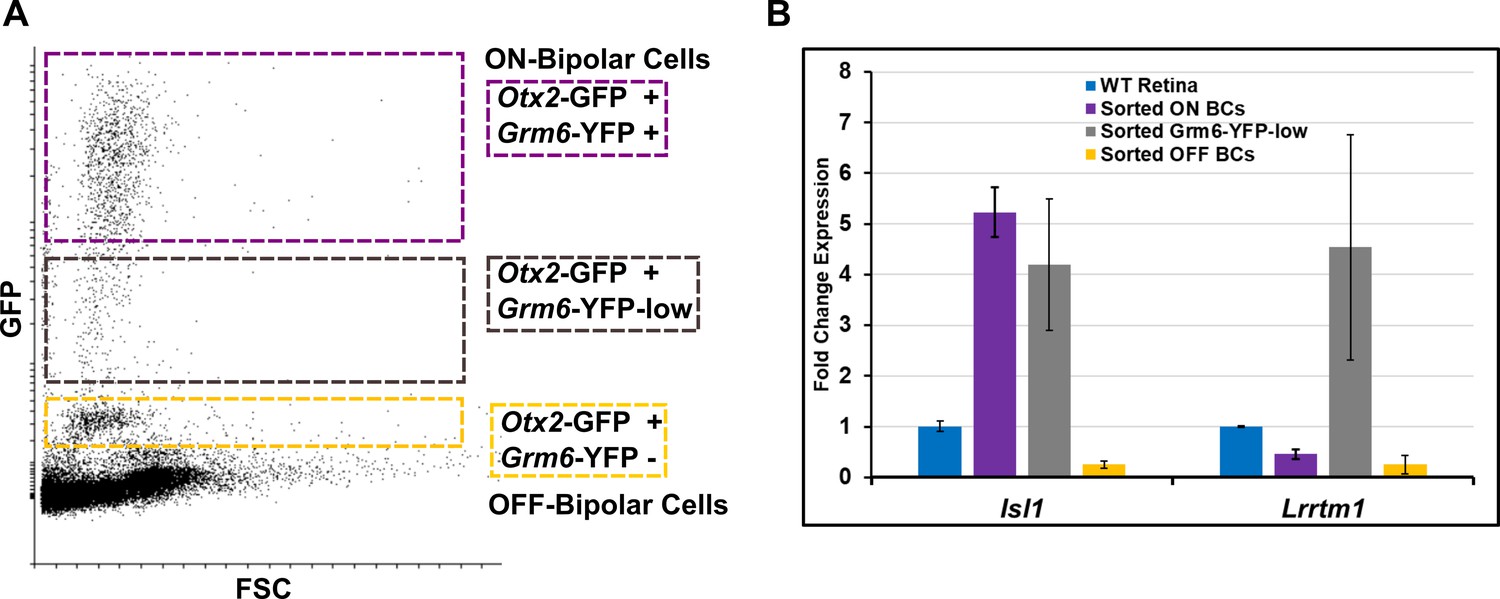
BC5D is likely excluded from both ON and OFF populations.
(A) FACS scatterplot showing the range of GFP/YFP fluorescence in Otx2-GFP; Grm6-YFP mouse, as in Figure 1B. An additional population (YFP-low, boxed in gray) between the ON and OFF populations was collected for analysis by RT-qPCR. (B) RT-qPCR analysis as in Figure 1C in sorted ON, OFF, and YFP-low populations. The YFP-low population expresses the ON bipolar cell marker Isl1, and is enriched for Lrrtm1, a marker for ON bipolar cell type 5D.
Figure 2 with 1 supplement
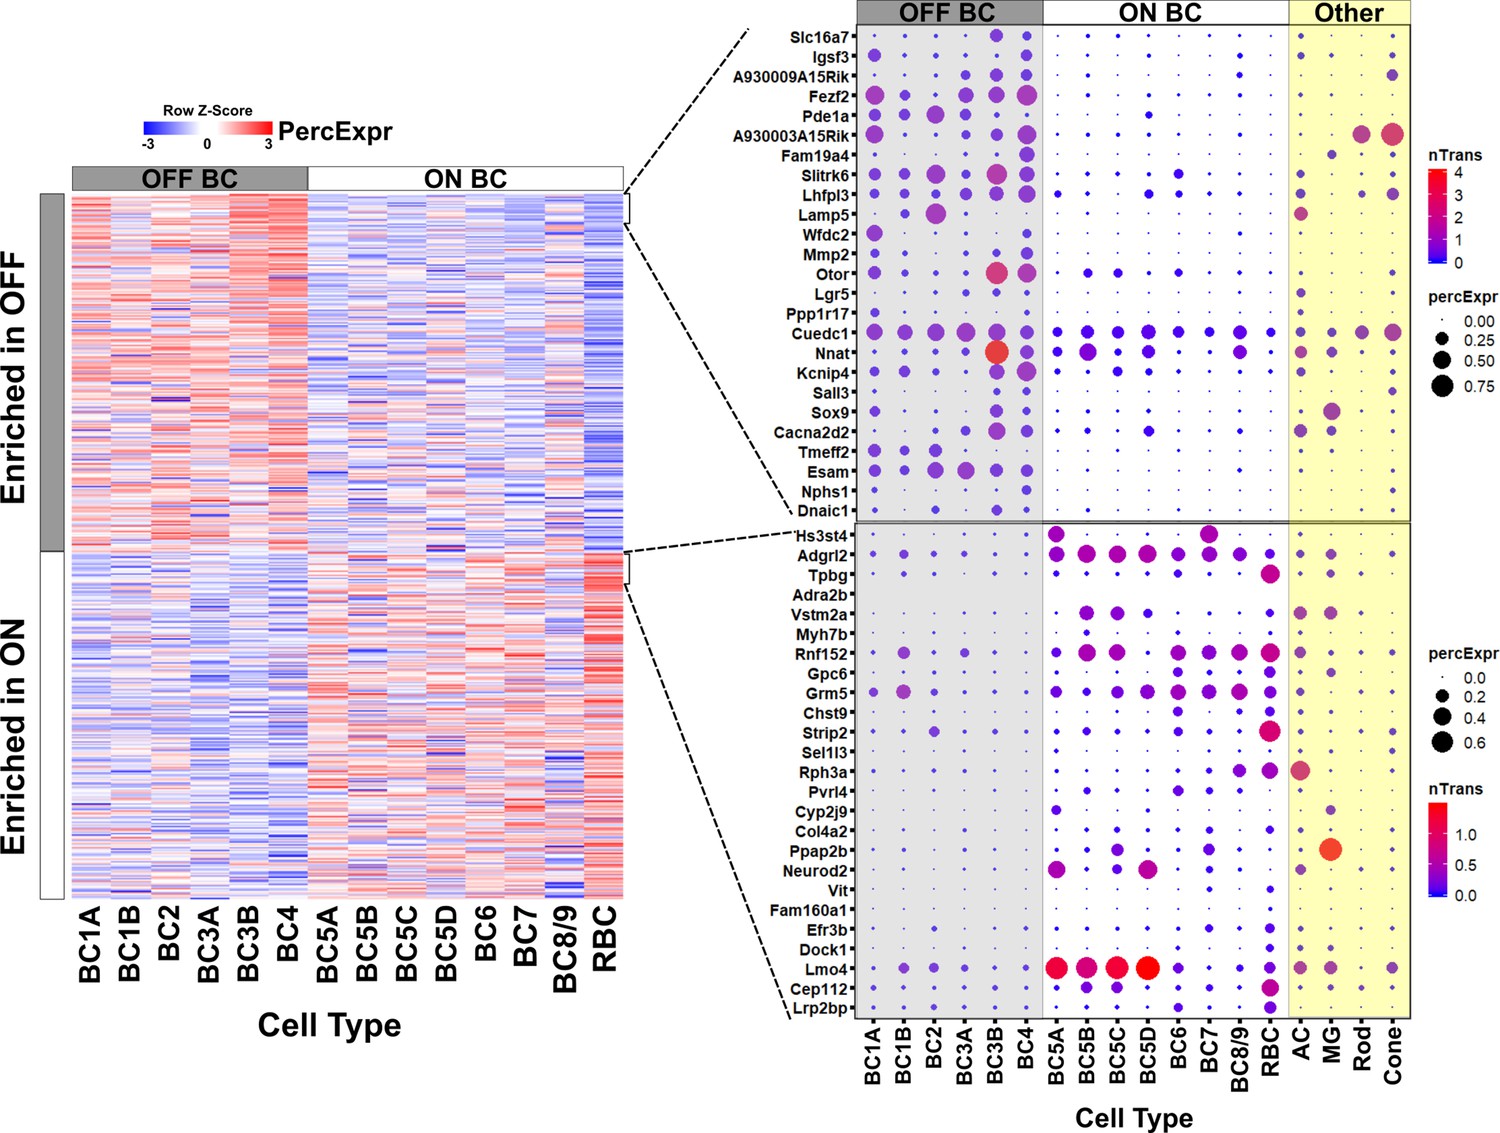
Gene expression in ON and OFF bipolar cells.
Left, heatmap displaying 680 genes identified by bulk RNA-seq as differentially expressed between FACS-purified ON and OFF bipolar cell populations (current study) mapped onto single cell expression profiles for bipolar cell types identified by Drop-seq (Shekhar et al., 2016). Overall, genes identified as ON- or OFF-specific by bulk RNA-seq showed corresponding differential expression between ON and OFF bipolar types identified by Drop-seq. Right, Expression of the top 25 most differentially enriched genes (ranked by p-value) in OFF (top) and ON (bottom) bipolar populations presented as dot plots as in Shekhar et al. nTrans = mean number of transcripts expressed per cell in each cluster identified as a bipolar cell type; PercExpr = percentage of cells within each cluster found to express the indicated gene. Dot plots for all 680 differentially expressed genes are presented in Figure 2—source data 1.
-
Figure 2—source data 1
Single-cell expression profiles of genes differentially expressed between ON and OFF bipolar cells.
Dot plots present single cell expression data obtained by Shekhar et al. (2016) using Drop-seq for genes identified in this study by bulk RNA-seq as differentially enriched in ON or OFF bipolar cells. Drop-seq data was available for 630 of the 680 genes, which are sorted by lowest adjusted p-value. (A-H) Genes enriched in OFF bipolar cells. (I-O) Genes enriched in ON bipolar cells. nTrans = mean number of transcripts expressed per cell in each cluster identified as a bipolar cell type. PercExpr = percentage of cells within each cluster found to express the indicated gene.
- https://doi.org/10.7554/eLife.48216.008
Figure 2—figure supplement 1
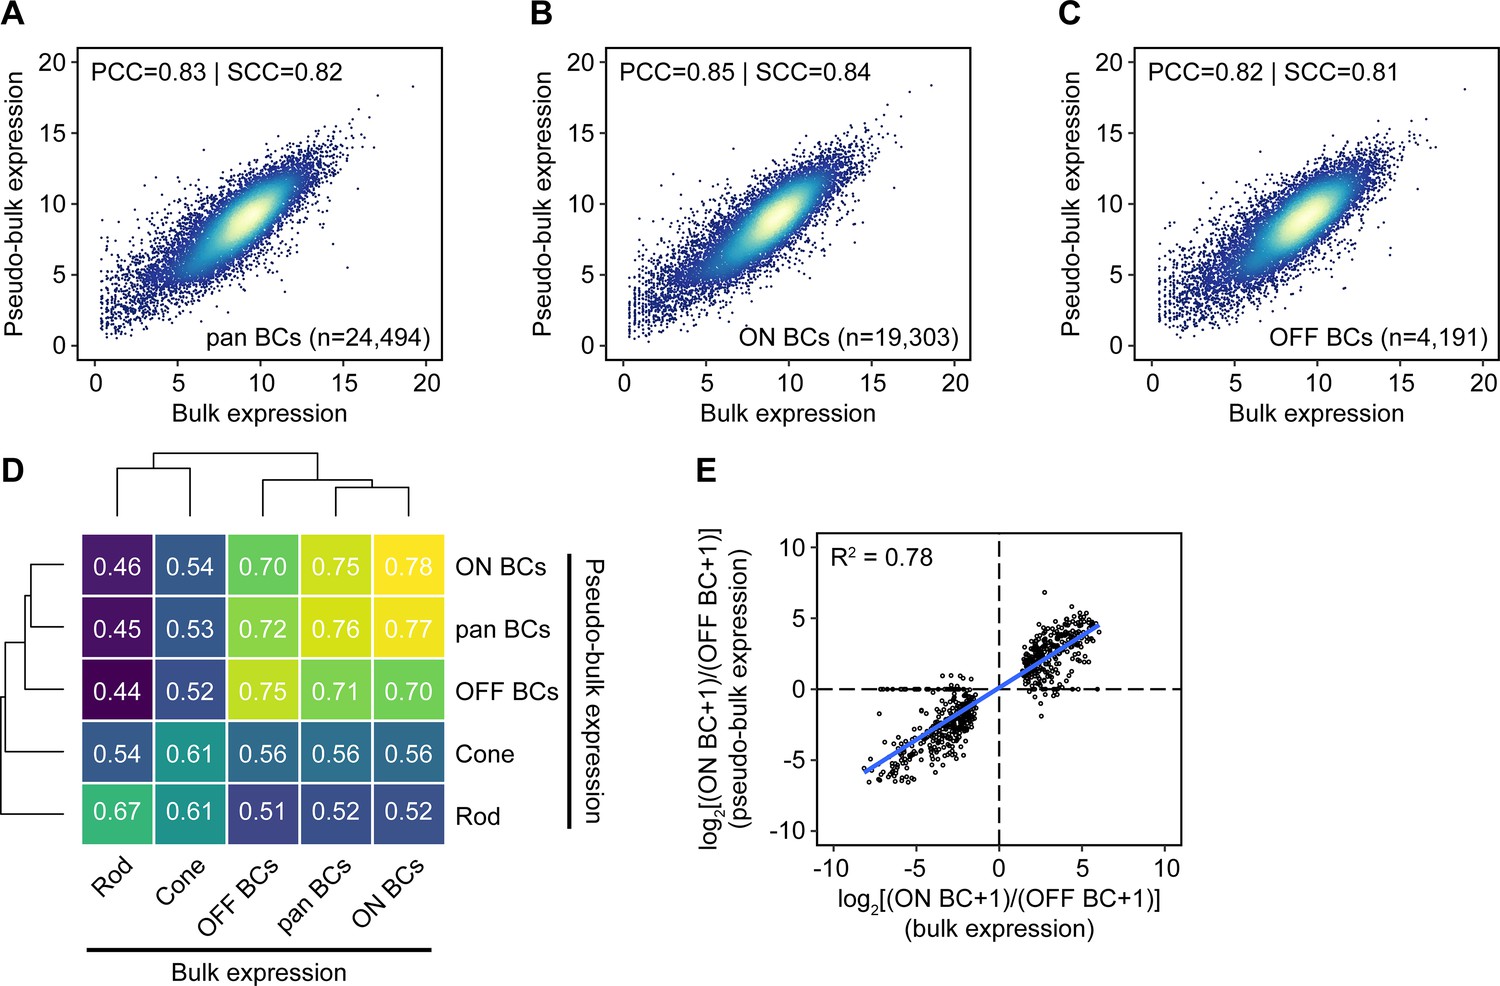
Comparison of gene expression measured by bulk RNA-seq and single-cell RNA-seq.
(A–C) Gene expression for all, ON, and OFF BCs by bulk RNA-seq (x-axis) or aggregated from single-cell RNA-seq data from Shekhar et al. (2016) from clustered cells corresponding to the same populations (‘pseudo-bulk’, y-axis). Units are log2(normalized counts+1). The number of cells in each pseudo-bulk population (n) is shown. Genes with counts of 0 in bulk, pseudo-bulk, or both datasets are not shown (6,915, 11,916, and 6,851 for all BCs; 7,059, 11,920, and 7,002 for ON BCs; 6,985, 11,984, and 6,922 for OFF BCs). PCC: Pearson correlation coefficient. SCC: Spearman correlation coefficient. (D) Heat map of Spearman correlation coefficients between bulk and pseudo-bulk expression data (after filtering for genes with normalized counts ≥ 100 in≥1 cell type). Rows and columns are clustered hierarchically with average linkage. (E) Estimated log2 fold change calculated from bulk RNA-seq (x-axis) vs. single-cell RNA-seq (y-axis) for genes identified as differentially expressed in ON and OFF BCs by bulk sequencing.
Figure 3
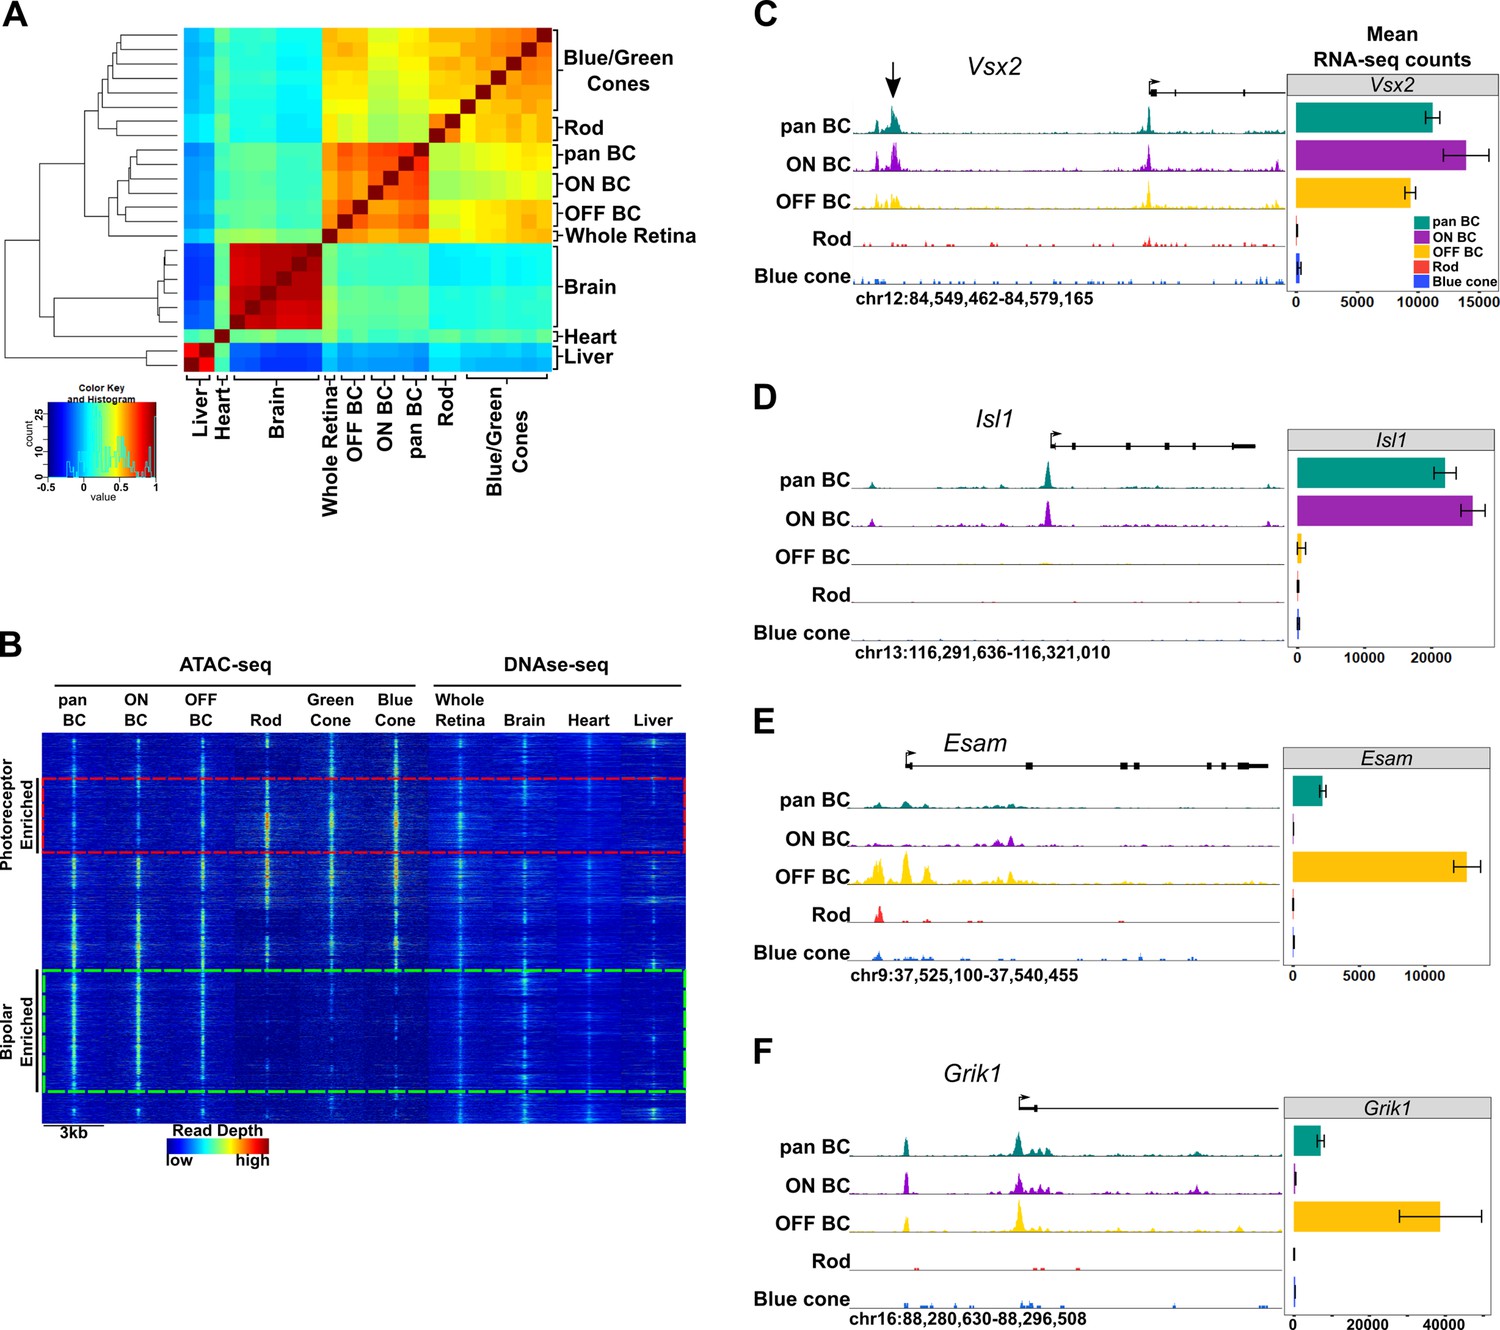
Genome-wide open chromatin profiles of ON and OFF bipolar cells.
(A) Heatmap showing pairwise correlation between ATAC-seq data from photoreceptor and bipolar cell populations as well as DNase-seq data from whole retina, brain, heart and liver. Multiple biological replicates are shown for most tissues. Peaks from each sample were combined to generate a set of 302,518 enhancer peaks, and replicates were clustered based on read counts at each peak. Bipolar cells and photoreceptors form separate clusters. Whole retina DNase-seq clusters with bipolar cells. Photoreceptors, bipolar cells and whole retina cluster separately from other tissues. (B) Genome-wide profiles of chromatin accessibility in isolated photoreceptor and bipolar cell ATAC-seq datasets as well as DNase-seq datasets from additional control tissues. Rows show accessibility as indicated by read depth in 3 kb windows centered on peak summits sampled from photoreceptor, bipolar, and whole retina datasets (10,000 peaks randomly sampled from a total of 99,684 enhancer peaks are shown). Hierarchical clustering reveals peak sets enriched in photoreceptors (red box) or bipolar cells (green box). (C–F) Screenshots of UCSC genome browser tracks show regions of accessible chromatin in bipolar and photoreceptor populations at loci that exhibit shared or cell class-specific expression patterns. Black arrow in panel C indicates a known enhancer of Vsx2 (Kim et al., 2008). There is an imperfect correlation between chromatin accessibility and gene expression. Bar graphs aligned with browser tracks indicate mean RNA-seq counts of each gene for the indicated populations.
Figure 4 with 2 supplements
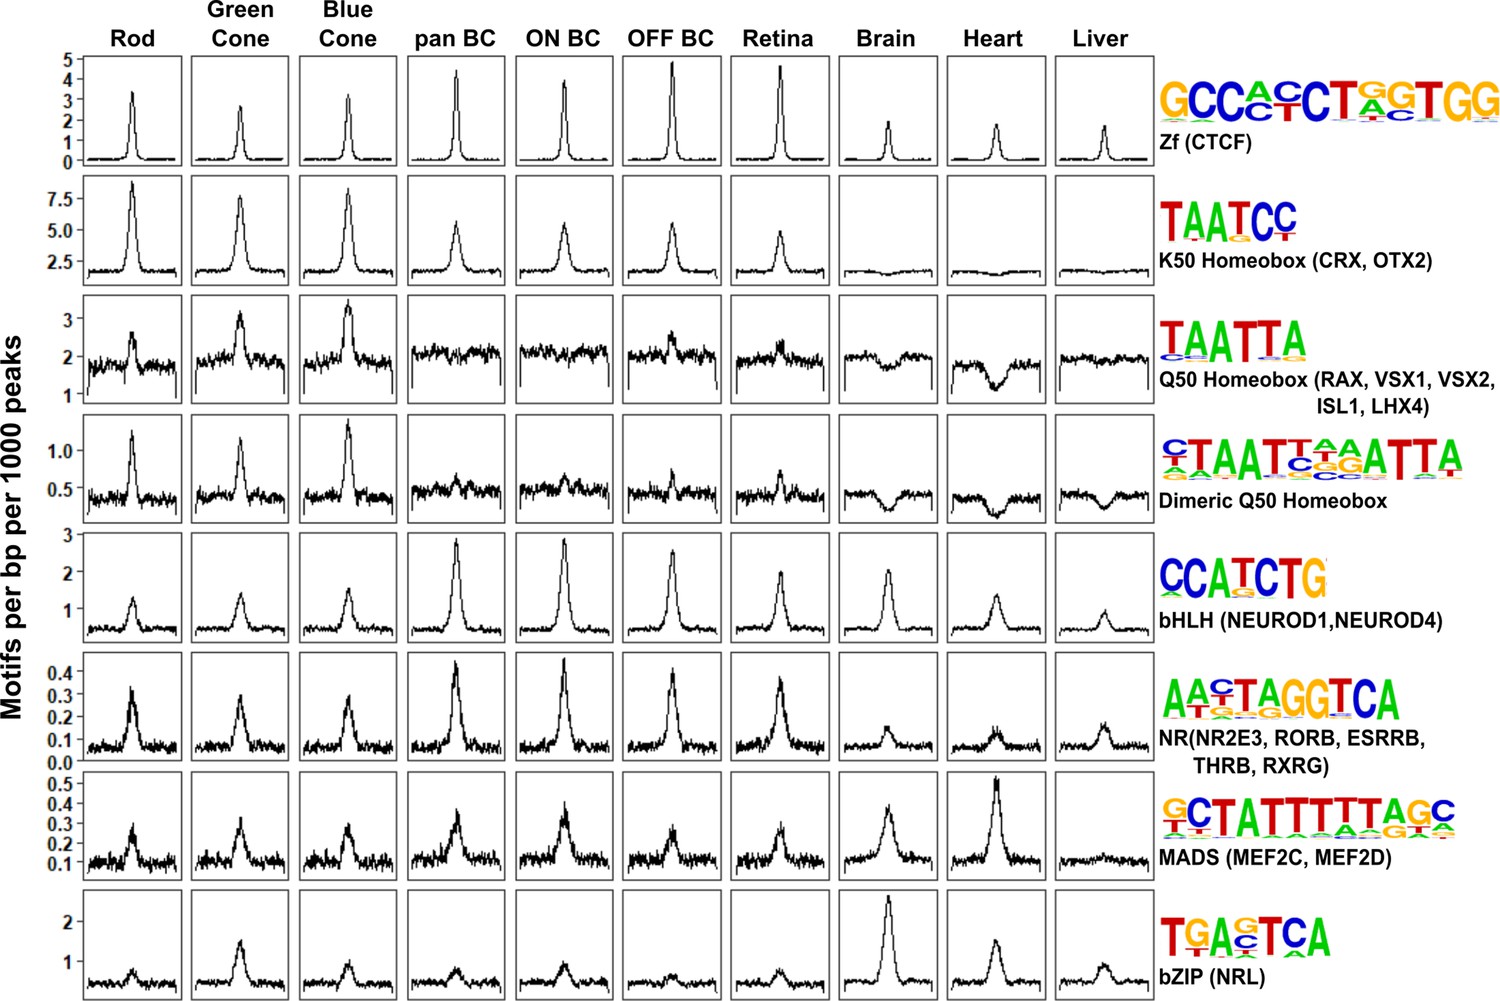
Patterns of TF binding site enrichment across retinal cell classes.
Motif enrichment patterns identified in bipolar and photoreceptor ATAC-seq datasets as well as in DNase-seq datasets from adult mouse whole retina, brain, heart, and liver. This analysis included all enhancer (i.e., TSS-distal) open chromatin peaks from each cell class or tissue. Each panel is centered on a 1 kb window around peaks from the indicated dataset. Motif density (motifs per base pair per 1000 peaks) is shown on the Y-axis. Consensus sequences for each motif class and example TFs (in parentheses) expressed in photoreceptors and bipolar cells are shown on the right. Photoreceptor and bipolar cell populations share enrichment for K50 HD motifs, while only photoreceptors show enrichment for Q50 HD motifs.
Figure 4—figure supplement 1
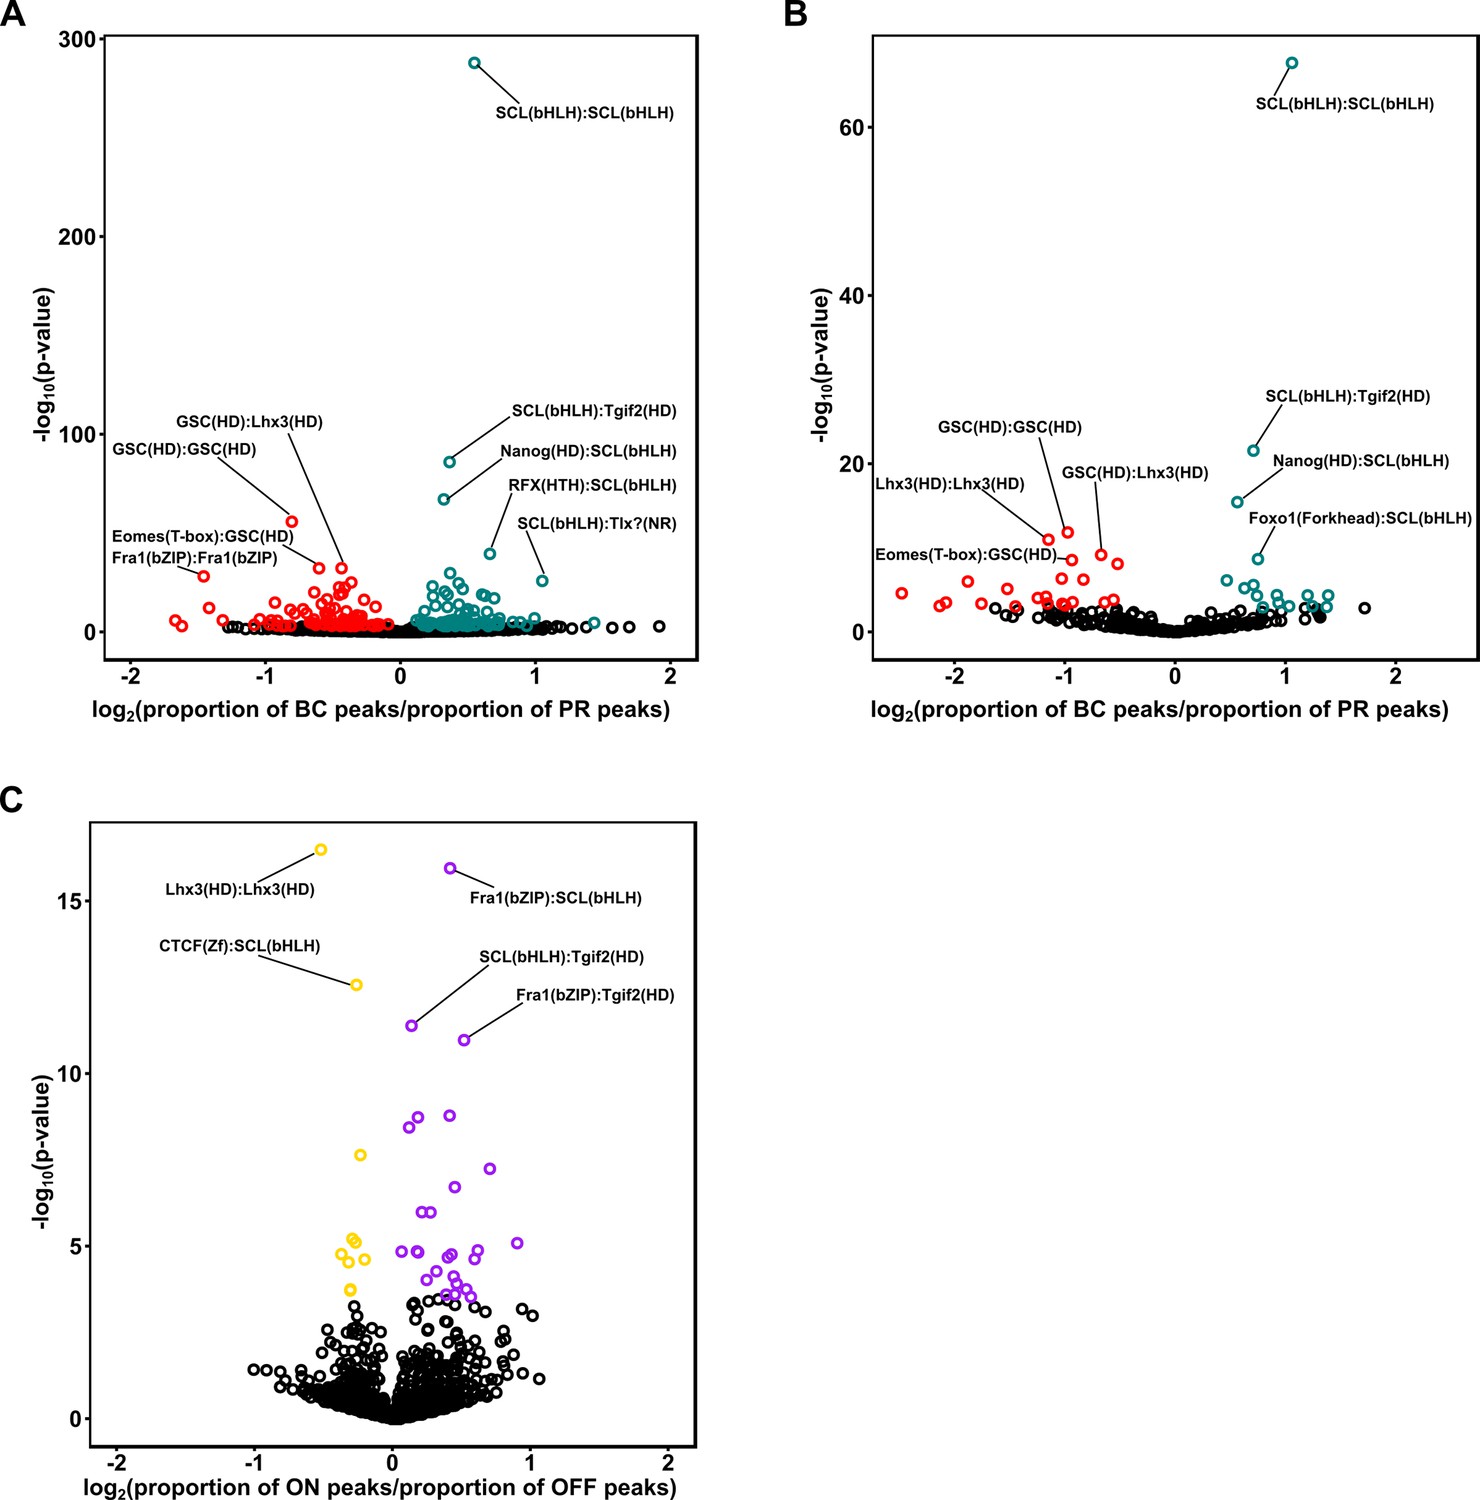
Enrichment of motif pairs in photoreceptors and bipolar cells.
(A) Scatterplot comparing the difference in proportion of enhancer peaks containing motif pairs in photoreceptors and bipolar cells. Each point corresponds to a distinct motif pair generated by taking all pairs from a list of 67 non-redundant motifs from the HOMER database (see Materials and methods). Statistically significant differences in the proportion of peaks harboring each pair are indicated in red (greater proportion in photoreceptors) or green (greater proportion in bipolar cells) (Fisher's exact test, FDR < 0.01). Motif pairs with the most significant difference in proportion (by p-value) are indicated and include individual motifs which are highly differentially enriched between the two cell classes, including K50 HD (GSC), Q50 HD (LHX3), and E-box (SCL). (B) Scatterplot as in A, showing the proportion of motif pairs within photoreceptor or bipolar cell-enriched peak sets (as defined in Figure 5A). (C) Scatterplot as in A and B, comparing the difference in proportion of motif pairs between enhancer peaks in ON and OFF bipolar cells. Motif pairs with statistically significant differences in proportion are indicated in purple (greater proportion in ON BC) or gold (greater proportion in OFF BC) (Fisher's exact test, FDR < 0.01).
Figure 4—figure supplement 2
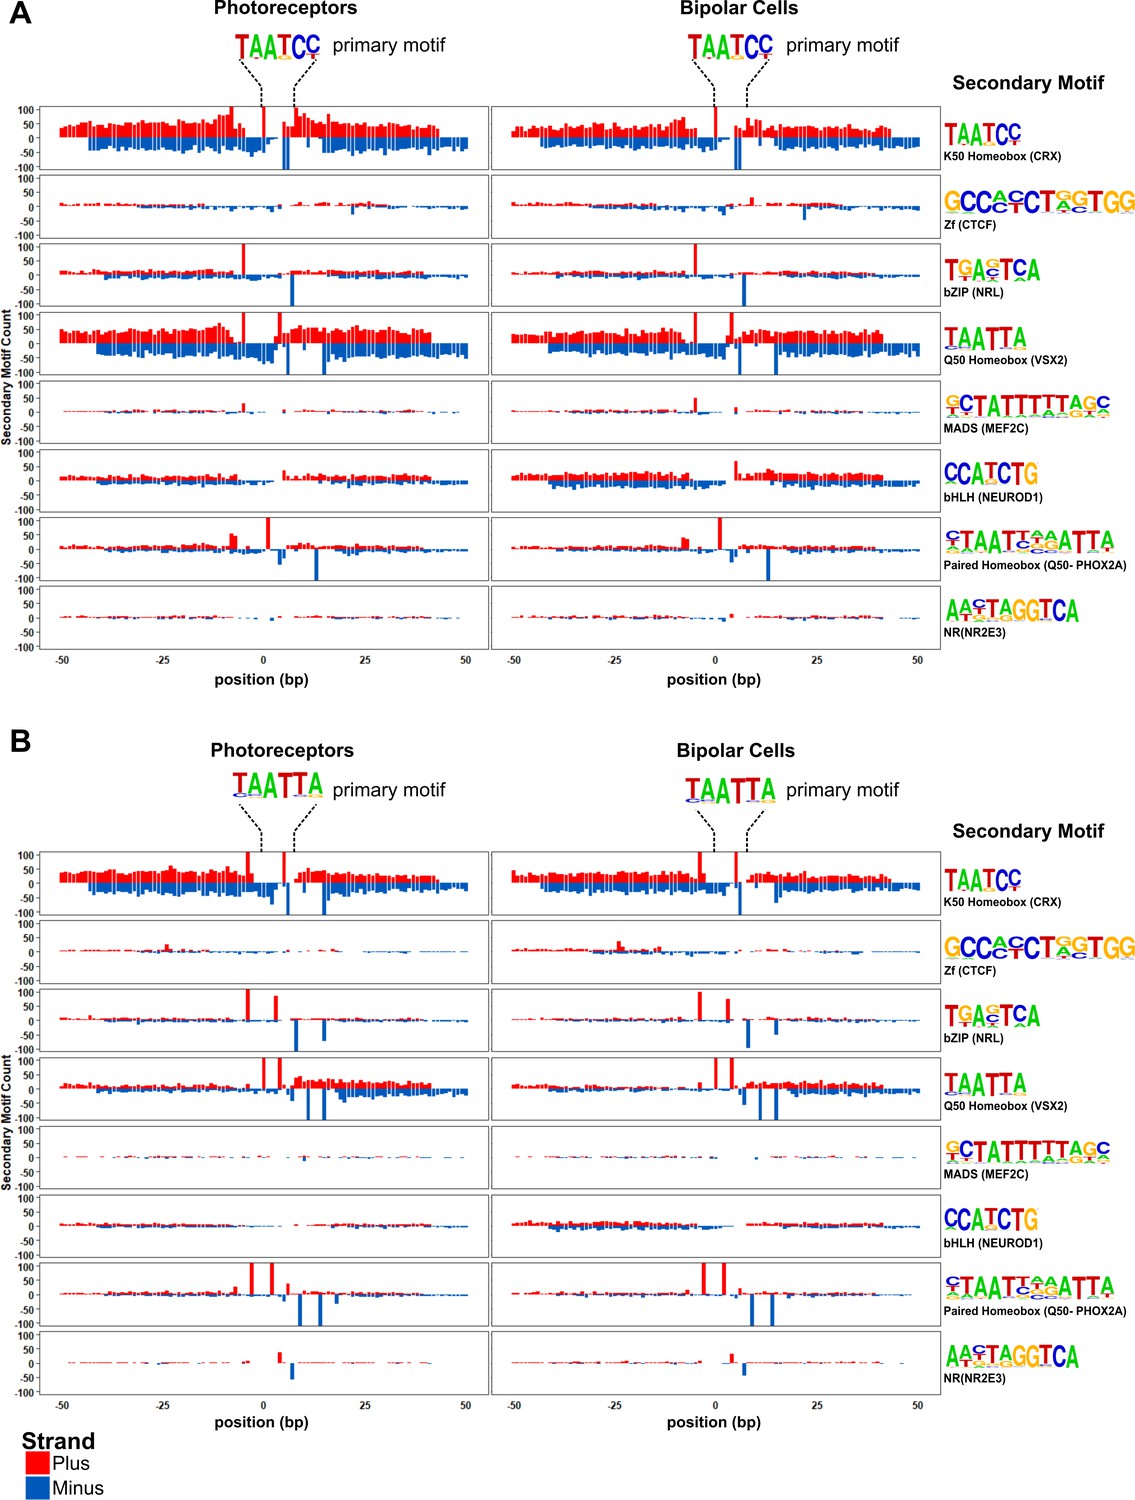
Motif spacing and orientation in photoreceptor and bipolar cells.
Peaks from photoreceptors (left) and bipolar cells (right) are centered on K50 HD (A) or Q50 HD motifs (B). Per base-pair counts for secondary motifs (PWM and example TFs shown at the far right) are plotted in a 100 bp window surrounding the primary motif, with counts on the plus strand shown in red, and the minus strand shown in blue. The y-axis was limited to ± 100.
Figure 5 with 2 supplements
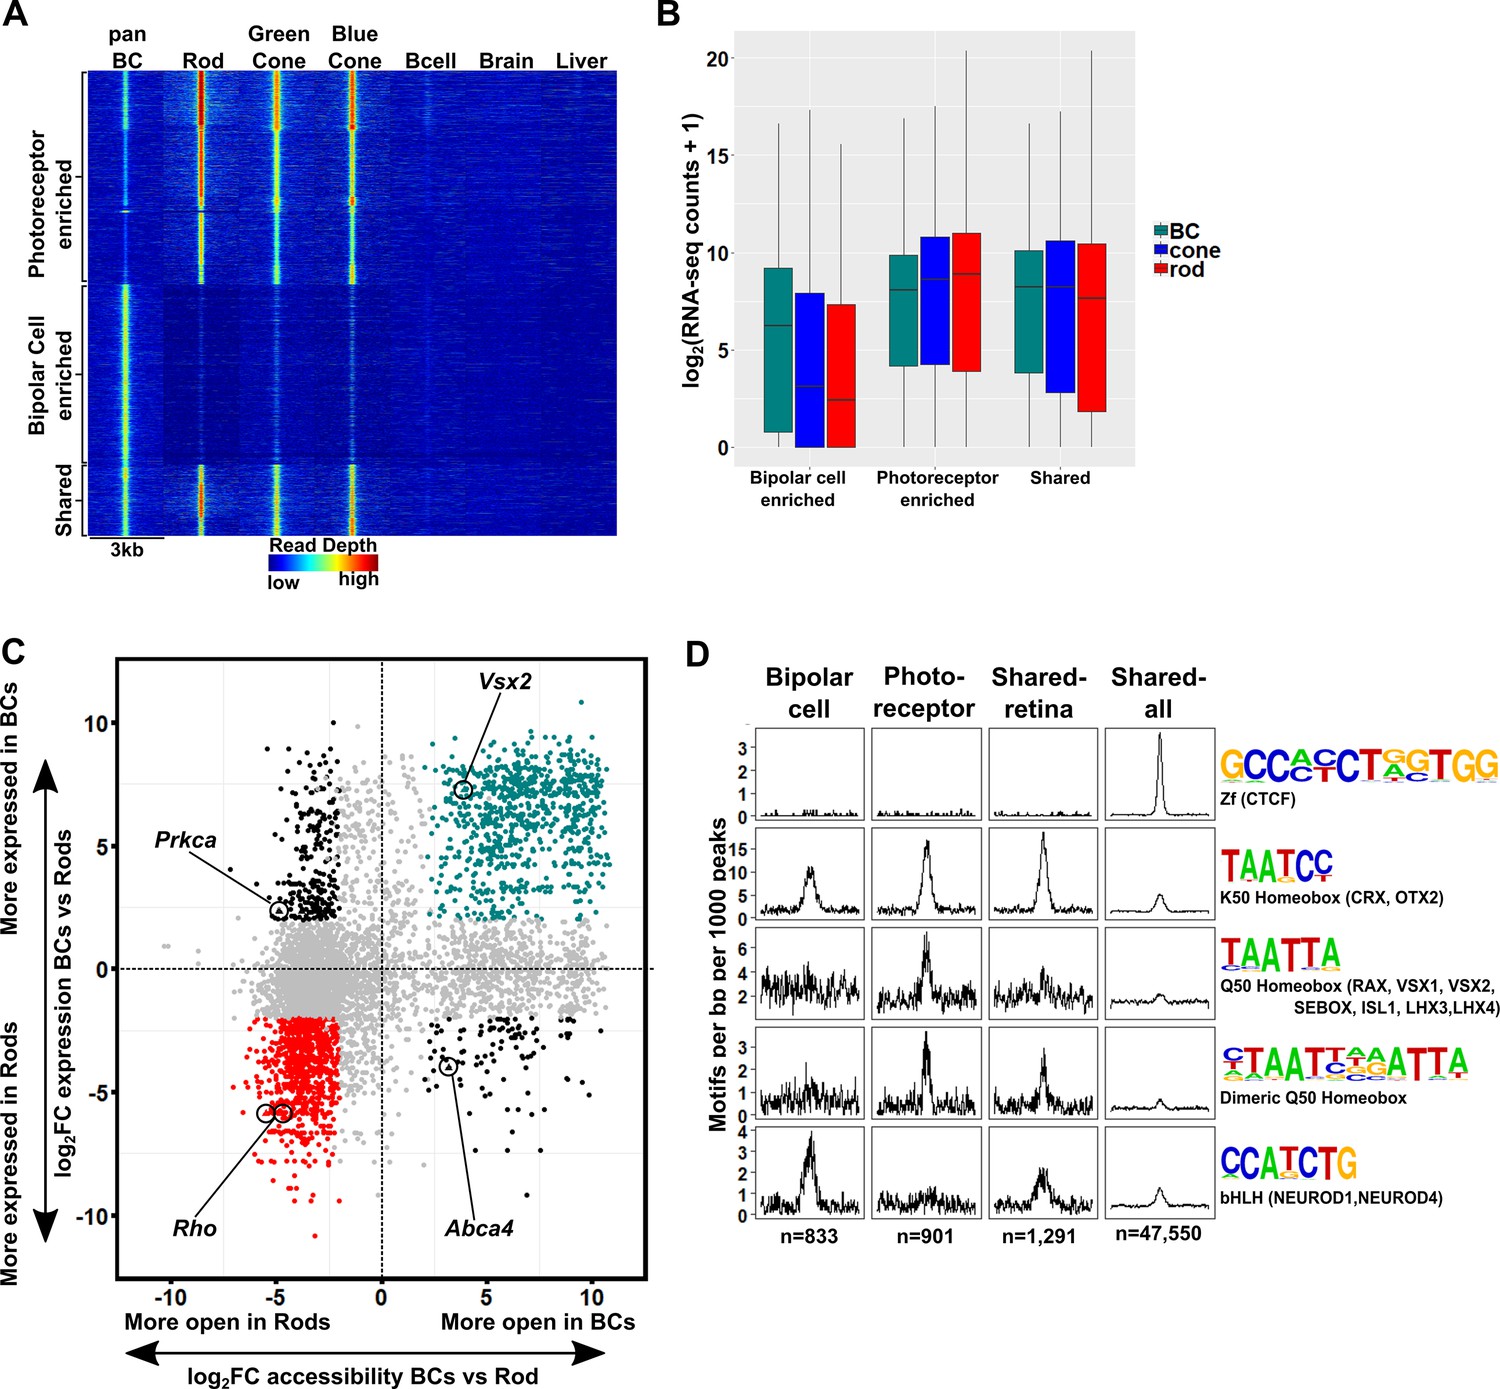
The cis-regulatory grammar of genomic regions associated with differential chromatin accessibility and gene expression in bipolar cells and photoreceptors.
(A) Heatmap depicting 8,435 genomic regions determined by pairwise comparison to be differentially accessible in photoreceptors, bipolar cells, or both cell classes, compared to adult mouse B cells, brain and liver. Photoreceptor-enriched (n = 3,874), bipolar cell-enriched (n = 3,270), shared (n = 1,291). (B) Expression of genes to which classes of peaks defined in A were assigned by proximity to nearest TSS. There is a moderate correlation between chromatin accessibility and gene expression in each cell class. (C) Peaks identified in panel A are plotted according to chromatin accessibility (x-axis) and associated gene expression (y-axis) in bipolar cells versus rods. Peaks with four-fold greater chromatin accessibility and associated gene expression in bipolar cells are shown in green (FDR < 0.05 for both accessibility and expression), while those peaks with greater accessibility and associated gene expression in rods are shown in red. Shared peaks and those associated with modest (less than four-fold) differences in expression are in gray. Peaks with discordant chromatin accessibility and associated gene expression are shown in black. Peaks assigned to genes expressed specifically in photoreceptors (Rho, Abca4) or bipolar cells (Vsx2, Prkca) are indicated. (D) Motif enrichment within peaks displaying correlated chromatin accessibility and associated gene expression in bipolar cells and photoreceptors as well as within peaks displaying shared accessibility, including those shown in panel A (shared-retina) and shared peaks which were not filtered to remove those accessible in non-retinal tissues (shared-all). Both photoreceptor and bipolar cell peaks show enrichment for K50 HD motifs. Bipolar cell peaks (n = 833) are also highly enriched for E-box motifs but lack enrichment of Q50 HD motifs. In contrast, photoreceptor peaks (n = 901) show enrichment for Q50 HD motifs but almost entirely lack E-box enrichment. Shared retina-specific peaks (n = 1,291) show a hybrid pattern of motif enrichment. Only the shared-all peak set exhibits enrichment for CTCF motifs, underscoring a key difference between cell-class specific open chromatin regions (which show no enrichment of CTCF motif) and ubiquitously open chromatin regions, which show strong enrichment.
Figure 5—figure supplement 1

Correlation between chromatin accessibility and expression of associated genes.
(A–C) Differentially accessible ATAC-seq peaks defined as promoters (left) or enhancers (right) were mapped to genes based on proximity to the nearest TSS. Boxplots show RNA-seq expression data for genes associated with peaks that are differentially accessible in (A) pan BC vs rod, (B) pan BC vs blue cone, and (C) ON bipolar cells vs OFF bipolar cells. (D–E) Scatterplots as in Figure 5C comparing chromatin accessibility and associated gene expression of ATAC-seq peaks in bipolar cells versus blue cones (D), and in ON versus OFF bipolar cells (E). Peaks with four-fold greater chromatin accessibility and associated gene expression (FDR < 0.05) are colored for each tissue: bipolar cells in green (n = 542), blue cones in blue (n = 505), ON-bipolar cells in purple (n = 203), and OFF-bipolar cells in gold (n = 34). Shared peaks and those with less than four-fold differences in associated gene expression are shown in gray, while those with discordant accessibility and associated gene expression are shown in black. Peaks in panel D are those identified in Figure 5A, while those in panel E are the sum of peaks identified in ON and OFF bipolar cells. Individual peaks and their assigned genes are indicated for reference.
Figure 5—figure supplement 2
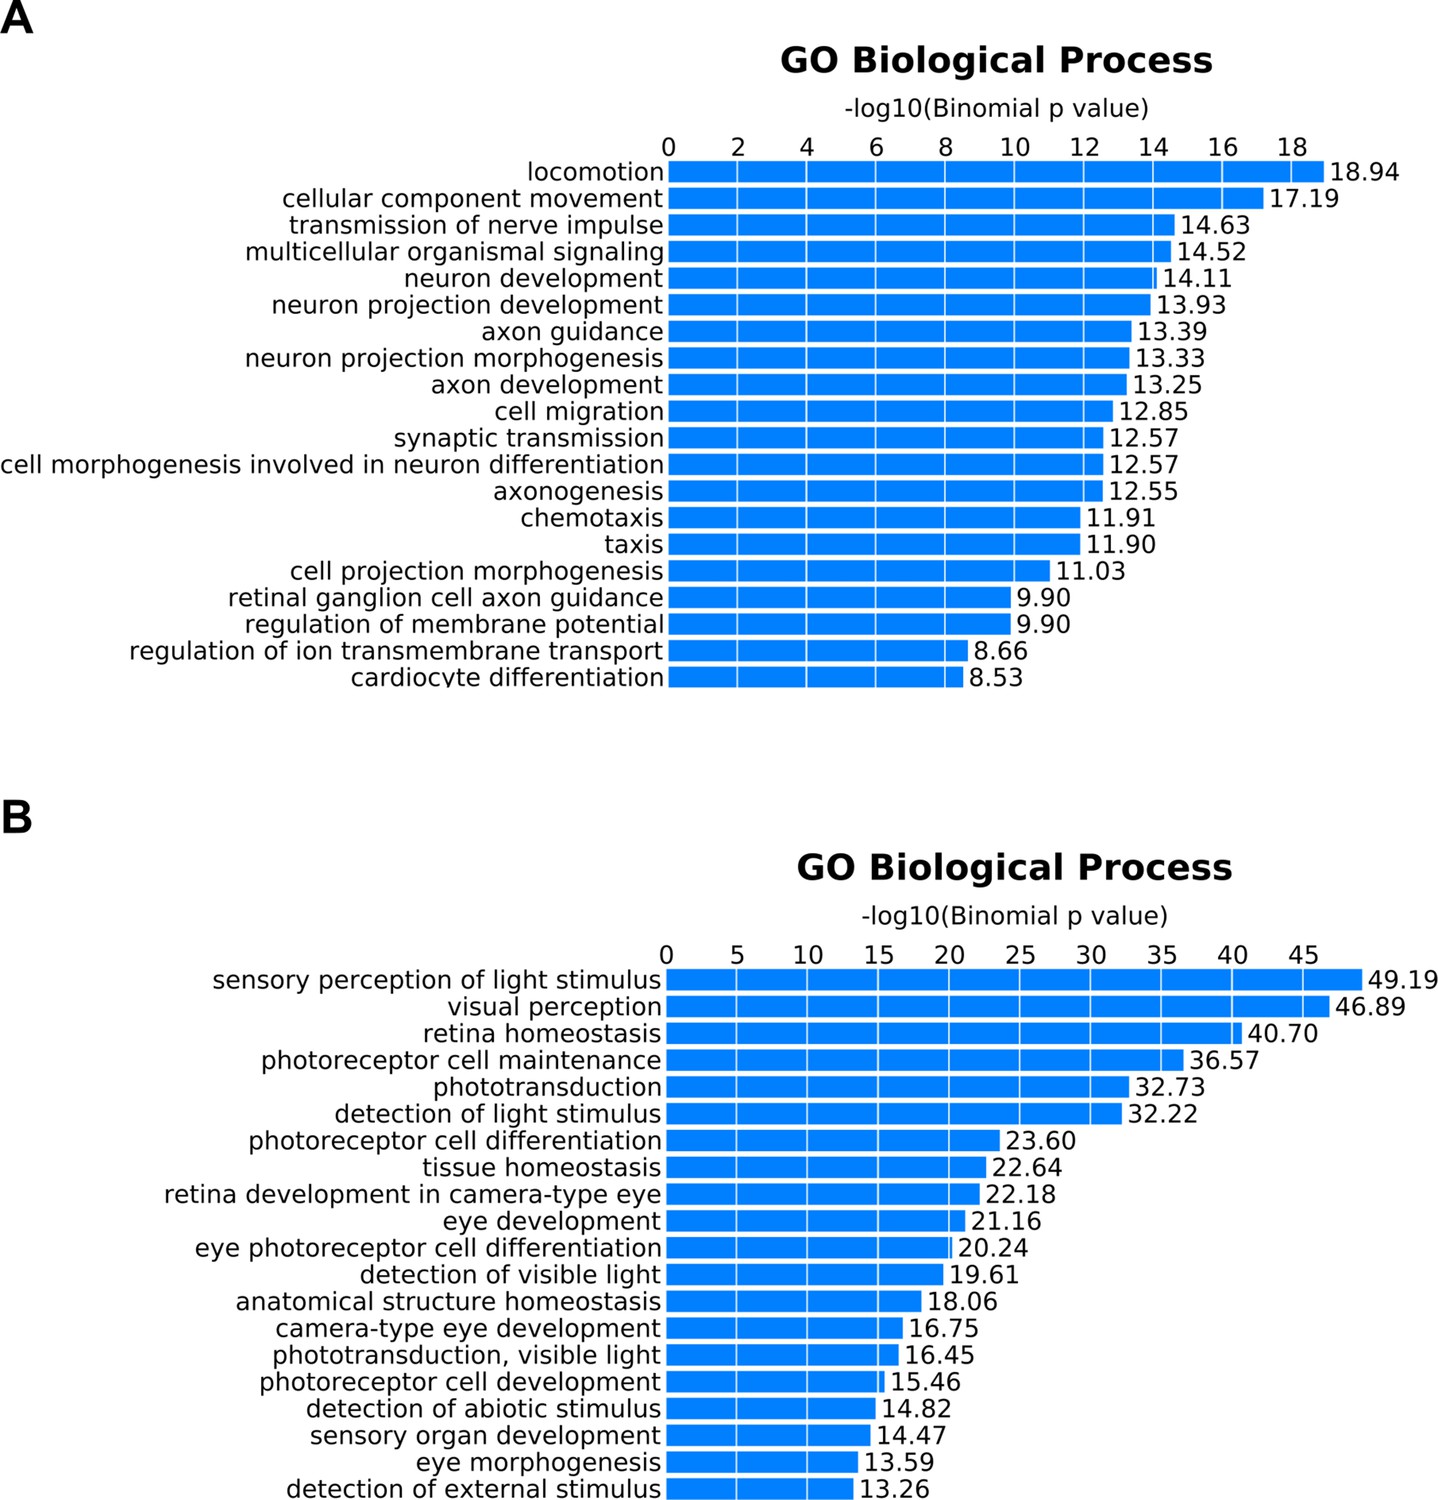
Gene Ontology (GO) annotation of peaks exhibiting correlated chromatin accessibility and associated gene expression.
GO terms enriched in peaks that show positive correlations between chromatin accessibility and assigned gene expression in (A) bipolar cells or (B) photoreceptors. Peaks identified in Figure 5B and Figure 5—figure supplement 1D as bipolar-enriched (green) or photoreceptor-enriched (red or blue for rods or blue cones, respectively) were combined to create unique lists for bipolar cells (n = 833) and photoreceptors (n = 901) which were analyzed using GREAT (McLean et al., 2010).
Figure 6
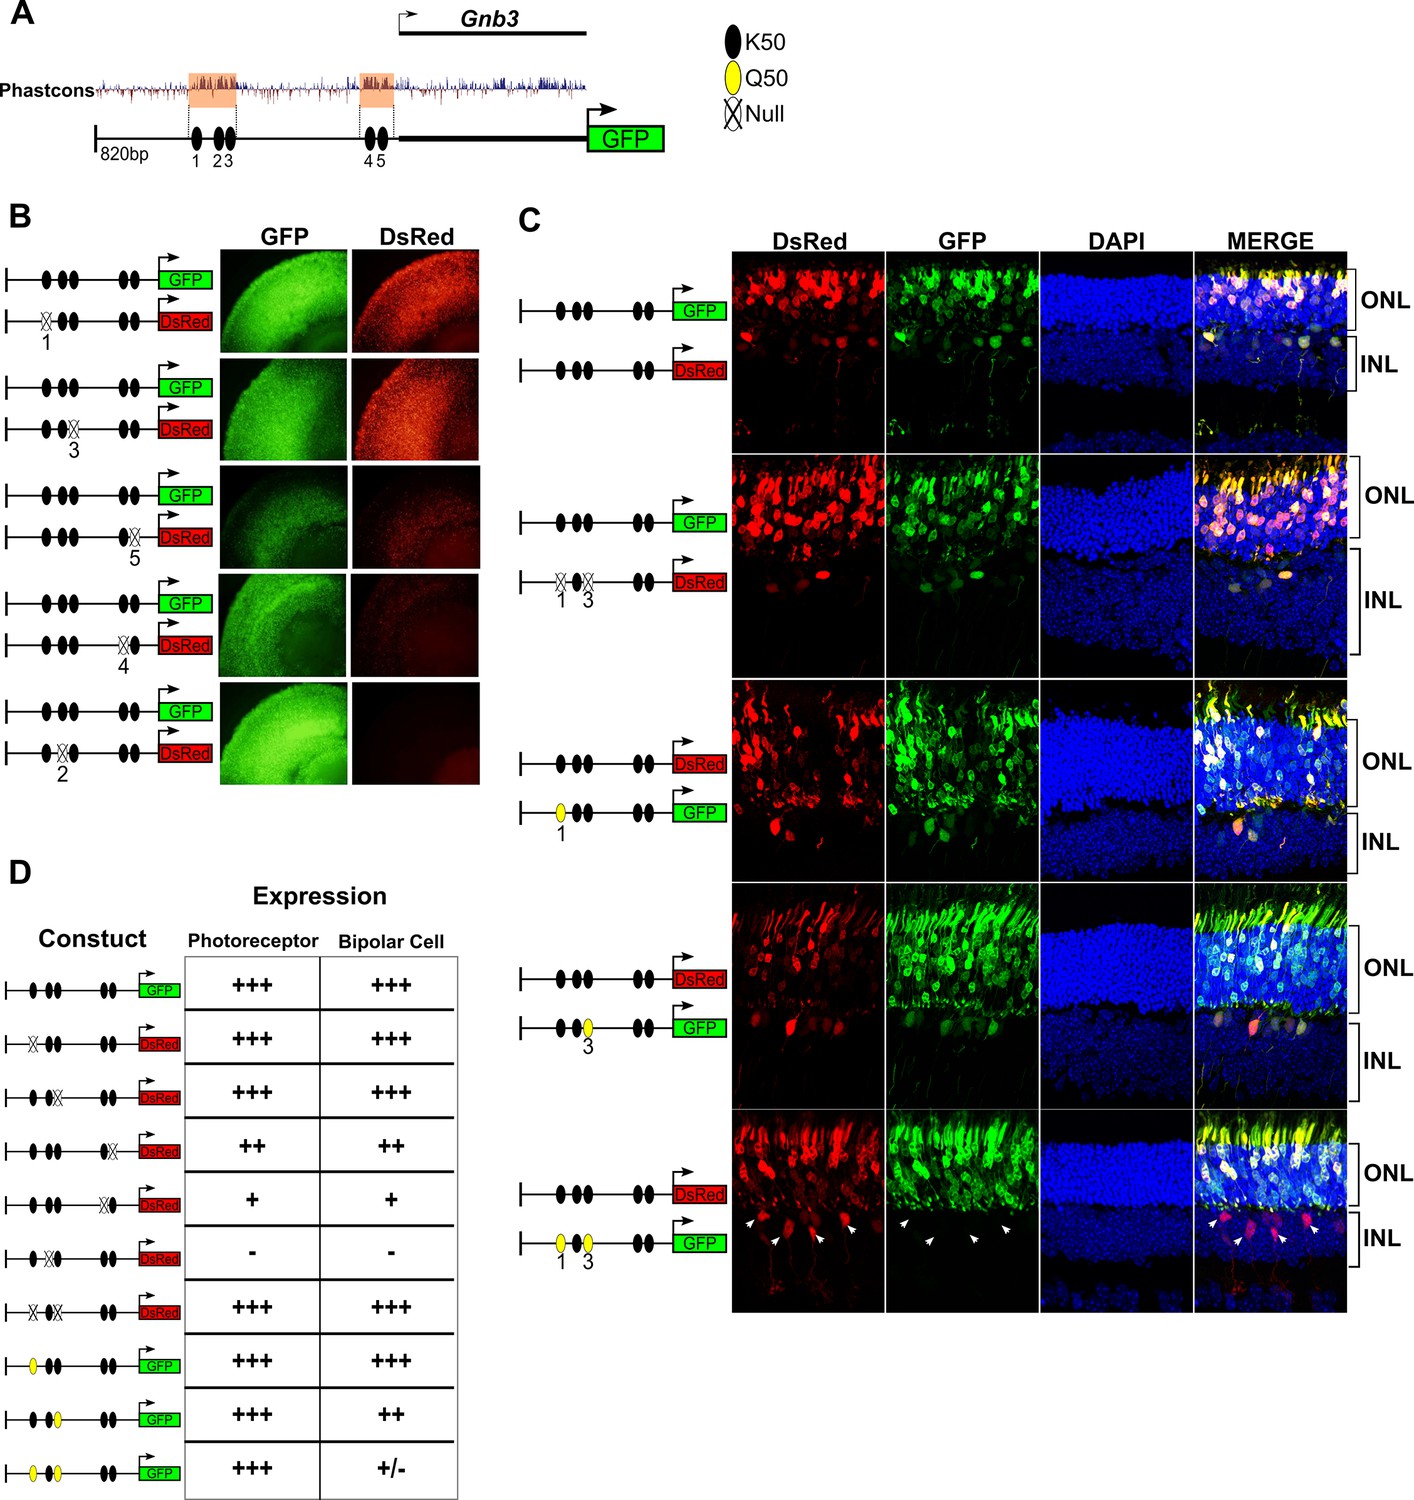
K50 motifs are required for expression in both photoreceptors and bipolar cells, while Q50 motifs mediate repression of reporter expression specifically in bipolar cells.
(A) Schematic of reporter construct containing 820 bp from the promoter region and 5’ untranslated region (UTR) of mouse Gnb3. This region contains two phylogenetically conserved blocks harboring a total of five K50 motifs (black ellipses). (B) Left, Schematics of reporter pairs containing wild-type (WT; black) and inactivated (crossed out) K50 motifs. Right, Each pair of reporters was electroporated into explanted newborn mouse retina, which were subsequently harvested after eight days in culture and photographed in a flat mount preparation. While K50 sites 2, 4 and 5 are required for reporter expression, sites 1 and 3 are dispensable. (C) Left, Pairs of reporters containing WT, inactivated K50, or novel Q50 (TAATTA; yellow) motifs were electroporated into newborn mouse retina in vivo. After 20 days, the retinas of electroporated mice were harvested and photographed in vertical cross-sections. (C) Right, Representative cross-sections of retinas injected with the indicated pair of reporters. Loss of both K50 motifs 1 and 3 has no effect on expression in either photoreceptors or bipolar cells, while converting these same sites to Q50 motifs abrogates expression specifically in bipolar cells (n = 2–7 depending on reporter pair, Figure 6—source data 1). White arrowheads indicate bipolar cells expressing the WT reporter, but not the mutated one. (D) Table summarizing the results of reporter analysis presented in (B) and (C).
-
Figure 6—source data 1
Additional images of Gnb3 reporter injections.
Additional replicates from in vivo subretinal injection and electroporation of reporter pairs shown in Figure 6C. Schematics of each reporter pair are shown at the right of each panel, with WT (black), inactivated K50 (crossed out), and novel Q50 (yellow) motif sites shown as ellipses.
- https://doi.org/10.7554/eLife.48216.017
Figure 7
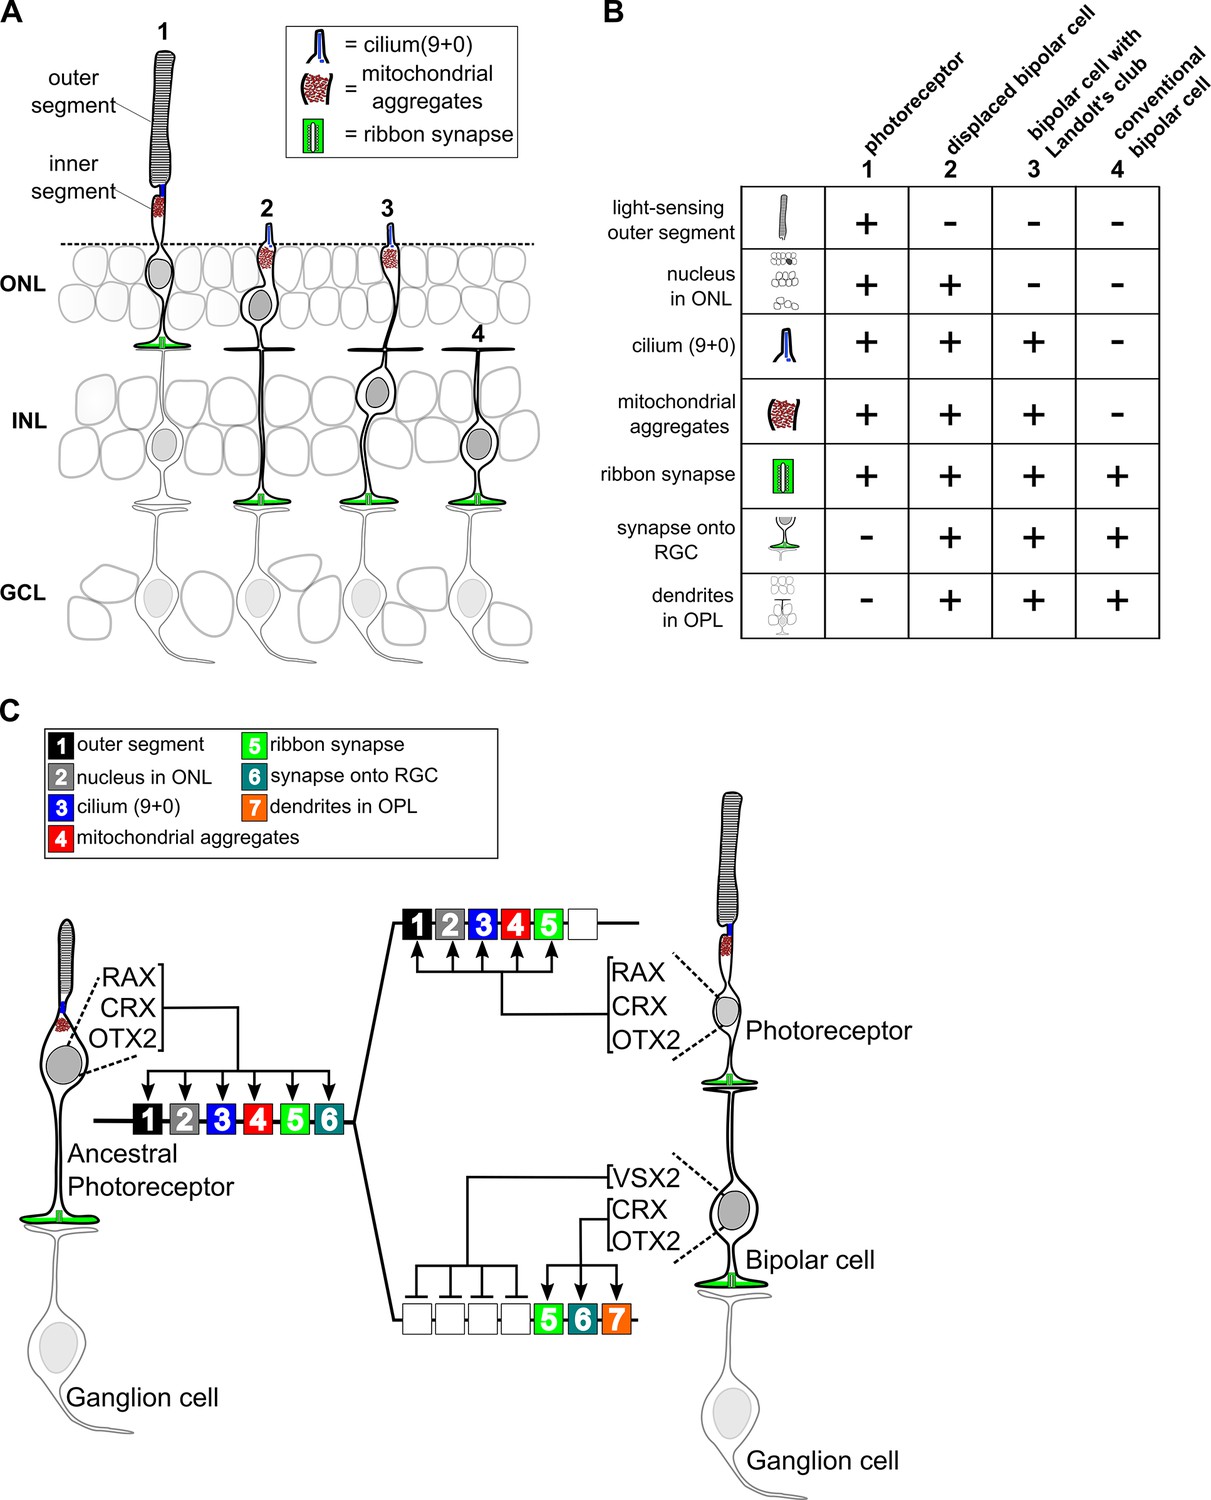
Evolutionary model for the divergence of bipolar cells from photoreceptors.
(A) Schematic depiction of photoreceptors (1), conventional bipolar cells (4), and two ‘transitional’ cell types with cellular features intermediate between those of photoreceptors and conventional bipolar cells: displaced bipolar cells (2) and bipolar cells with Landolt’s club (3). (B) Table of individual cellular features (referred to in Arendt et al. as ‘apomeres’) possessed by photoreceptors, bipolar cells, or both cell classes. (C) Evolutionary model for the divergence of present-day photoreceptors and bipolar cells from a common ancestral photoreceptor type. We propose that the ancestral photoreceptor (possibly present in a hagfish-like ancestor) expressed cell type-specific genes via both K50 HD TFs (CRX and OTX2) and a possibly weakly activating Q50 HD TF (RAX). The emergent expression of a strongly repressive Q50 HD TF (VSX2) in bipolar cells then permitted silencing of selected photoreceptor gene modules underlying the formation of defined photoreceptor apomeres (e.g., outer segment). Selective expression of activating Q50 HD TFs in ‘transitional’ bipolar cell types may have allowed the derepression of specific photoreceptor apomeres (e.g., cilium formation, mitochondrial aggregates). Novel bipolar-specific apomeres (e.g., dendrites in the outer plexiform layer [OPL]) may have evolved via co-option of other gene expression programs.
Tables
Key resources table
| Reagent type (species) or resource | Designation | Source or reference | Identifiers | Additional information |
|---|---|---|---|---|
| Gene (Mus musculus) | Vsx2 | Ensembl: ENSMUSG00000021239 | ||
| Strain, strain background (Mus musculus. male and female) | CD-1 | Charles River | Strain code 022 | |
| Genetic reagent (Mus musculus) | Otx2-GFP | Fossat et al., 2007 | ||
| Genetic reagent (Mus musculus) | Grm6-YFP | Morgan et al., 2011 | ||
| Genetic reagent (Mus musculus) | Otx2-GFP;Grm6-YFP | This paper | Cross between Otx2-GFP and Grm6-YFP | |
| Recombinant DNA reagent | pCAGGS | Hsiau et al., 2007 | Plasmid used to create Gnb3 reporters. | |
| Recombinant DNA reagent | Gnb3-WT-DsRed | This paper | Gnb3 promoter region driving DsRed | |
| Recombinant DNA reagent | Gnb3-WT-EGFP | This paper | Gnb3 promoter region driving EGFP | |
| Recombinant DNA reagent | Gnb3- K50 #1-null-DsRed- | This paper | ||
| Recombinant DNA reagent | Gnb3- K50 #2-null-DsRed- | This paper | ||
| Recombinant DNA reagent | Gnb3- K50 #3-null-DsRed- | This paper | ||
| Recombinant DNA reagent | Gnb3- K50 #4-null-DsRed- | This paper | ||
| Recombinant DNA reagent | Gnb3- K50 #5-null-DsRed- | This paper | ||
| Recombinant DNA reagent | Gnb3- K50 #3 and #5-null-DsRed- | This paper | ||
| Recombinant DNA reagent | Gnb3- Q50 #1-EGFP | This paper | ||
| Recombinant DNA reagent | Gnb3- Q50 #3-EGFP | This paper | ||
| Recombinant DNA reagent | Gnb3- Q50 #1 and #3-EGFP | This paper | ||
| Commercial assay or kit | Qiagen Mini-elute PCR Purification kit | Qiagen | Cat no. 28004 | |
| Commercial assay or kit | KAPA Library Quantification Kit | Roche | Cat no. 07960140001 | |
| Commercial assay or kit | SMARTer Ultra Low RNA kit for Illumina Sequencing-HV | Clonetech | Cat. Nos. 634820, 634823, 634826, 634828 and 634830) | Utilized by Washington University Genome Technology Access Core (GTAC) |
| Sequence-based reagent | Primers | IDT | Listed in Supplementary file 2 | |
| Software, algorithm | R | http://rstudio.com | R programming language | |
| Software, algorithm | DESeq2 | https://bioconductor.org/packages/release/bioc/html/DESeq2.html | Differential gene expression analysis based on the negative binomial distribution | |
| Software, algorithm | HOMER | http://homer.ucsd.edu/homer/index.html | Hypergeometric Optimization of Motif EnRichment | |
| Software, algorithm | SAMtools | http://www.htslib.org | Samtools | |
| Software, algorithm | Bowtie2 | http://bowtie-bio.sourceforge.net/bowtie2/index.shtml | Bowtie2 | |
| Software, algorithm | Picard | https://broadinstitute.github.io/picard/ | Picard | |
| Software, algorithm | MACS2 | https://pypi.org/project/MACS2/2.1.1.20160309/ | Model-based Analysis of ChIP-Seq | |
| Software, algorithm | STAR | https://github.com/alexdobin/STAR | Spliced Transcripts Alignment to a Reference | |
| Software, algorithm | HTSeq | https://pypi.org/project/HTSeq/ | HTSeq |
Additional files
-
Supplementary file 1
Biological replicate and sequencing metrics for ATAC-seq and RNA-seq.
‘Raw sequencing reads’ are the number of paired reads for each sample. ‘Processed reads’ are those reads remaining after filtering out those that are improperly paired, have poor mapping quality, align to the mitochondrial genome, align to ENCODE blacklisted regions, or arise from PCR duplicates. RIN = RNA integrity number.
- https://doi.org/10.7554/eLife.48216.019
-
Supplementary file 2
Primers used in this work.
Primers used in creation of Gnb3 promoter constructs and in RT-qPCR experiments are listed.
- https://doi.org/10.7554/eLife.48216.020
-
Supplementary file 3
Datasets and accessions.
- https://doi.org/10.7554/eLife.48216.021
-
Supplementary file 4
Annotated ATAC-seq peaks and counts.
Raw count data for all ATAC-seq peaks identified in photoreceptor and bipolar cell populations. Peaks identified in individual replicates from each cell type are shown on separate sheets.
- https://doi.org/10.7554/eLife.48216.022
-
Supplementary file 5
Differentially expressed genes.
Genes identified as differentially expressed between aggregate bipolar cells and either rod or blue cone, and between ON and OFF bipolar cell populations are shown on separate sheets. ‘Specificity’ indicates which cell type expressed the gene more highly. For pan BC vs rod and cone, genes identified as putative transcription factors are identified by their TF family. Genes absent from the Drop-seq data shown in Figure 2—source data 1 are indicated among those that are differentially expressed between ON and OFF bipolar cells.
- https://doi.org/10.7554/eLife.48216.023
-
Supplementary file 6
GO analysis of differentially expressed genes.
Enriched GO terms for biological processes obtained from geneontology.org. Outputs for genes enriched in photoreceptor and bipolar cells are shown on separate sheets. Input gene lists were filtered based on fold-change in expression and minimum read counts to identify those most highly enriched in photoreceptor (n = 818) and bipolar cells (n = 832). A list of all genes identified by RNA-seq in either cell class was used as a reference.
- https://doi.org/10.7554/eLife.48216.024
-
Supplementary file 7
Differentially accessible regions.
ATAC-seq peaks, normalized read counts, fold-change values, adjusted p-values and assigned genes are listed on separate sheets for each comparison. ‘Specificity’ indicates the cell type in which the peak is more highly accessible. ‘Shared-unfiltered’ peaks are those that are not differentially accessible when comparing bipolar cells versus photoreceptors (fold-change values < 2 and >-2). ‘Retina’ peaks are those shown in Figure 5A; they have been filtered to remove those accessible in B cells, brain and liver. Peaks with correlated gene expression identified in Figure 5C and Figure 5—figure supplement 1D are indicated.
- https://doi.org/10.7554/eLife.48216.025
-
Supplementary file 8
Known motifs enriched in enhancers of bipolar cell populations.
Enrichment of all 319 motifs in the HOMER database for all, ON-, and OFF-bipolar cells, each on separate sheets. A comparison of the proportional enrichment for each motif between aggregate bipolar cells and rod, blue and green cones is included on a separate sheet. A complete list of sequence logos and position weight matrices for individual motifs is available online in the HOMER motif database: http://homer.salk.edu/homer/motif/HomerMotifDB/homerResults.html.
- https://doi.org/10.7554/eLife.48216.026
-
Transparent reporting form
- https://doi.org/10.7554/eLife.48216.027
Download links
A two-part list of links to download the article, or parts of the article, in various formats.
Downloads (link to download the article as PDF)
Open citations (links to open the citations from this article in various online reference manager services)
Cite this article (links to download the citations from this article in formats compatible with various reference manager tools)
Cis-regulatory basis of sister cell type divergence in the vertebrate retina
eLife 8:e48216.
https://doi.org/10.7554/eLife.48216


