Sustained expression of HeyL is critical for the proliferation of muscle stem cells in overloaded muscle
- Osaka University, Japan
- Japan Tobacco Inc, Japan
- Hiroshima University, Japan
- Tokyo Metropolitan Institute of Gerontology, Japan
- Kyushu University, Japan
Figures
Figure 1 with 1 supplement
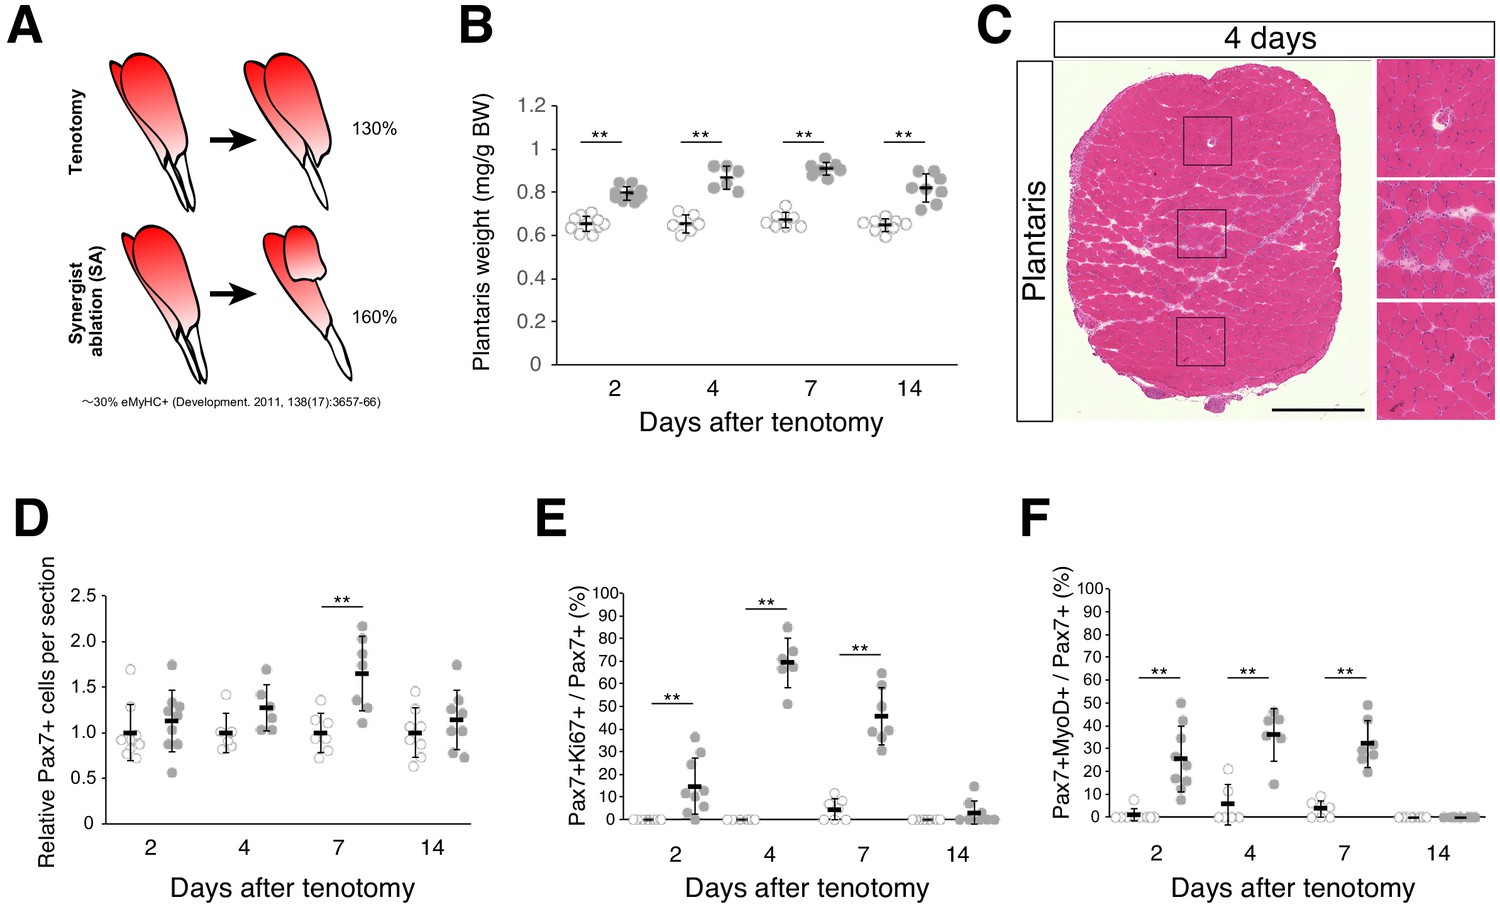
Tenotomy induces activation and proliferation of muscle stem cells in the absence of substantial muscle damage.
(A) Two mouse models that induce muscle hypertrophy. (B) Plantaris muscle weight relative to body weight (mg/g) after tenotomy (gray circle) or the weight of contralateral sham-operated muscle (open circle). **p<0.01. (C) H and E staining of plantaris muscle sections at 4 days after tenotomy. Scale bar: 500 µm. Right three images in squares represent magnifications of the left image. (D) Relative number of MuSCs in plantaris muscle sections after tenotomy (gray circle) or in contralateral sham muscle sections (open circle). **p<0.01. (E) Percentage of Ki67+ cells among Pax7+ cells in contralateral sham (open circle) or tenotomy induced plantaris muscle (gray circle). **p<0.01. (F) Percentage of MyoD+ cells among Pax7+ cells in contralateral sham (open circle) or tenotomy induced plantaris muscle (gray circle). **p<0.01. Data represent the means ± standard deviation. A two-sided Student’s t test or Welch’s t test was performed.
-
Figure 1—source data 1
Numerical data for making the graphs in Figure 1.
Experiment number corresponds to all results.
- https://doi.org/10.7554/eLife.48284.004
Figure 1—figure supplement 1
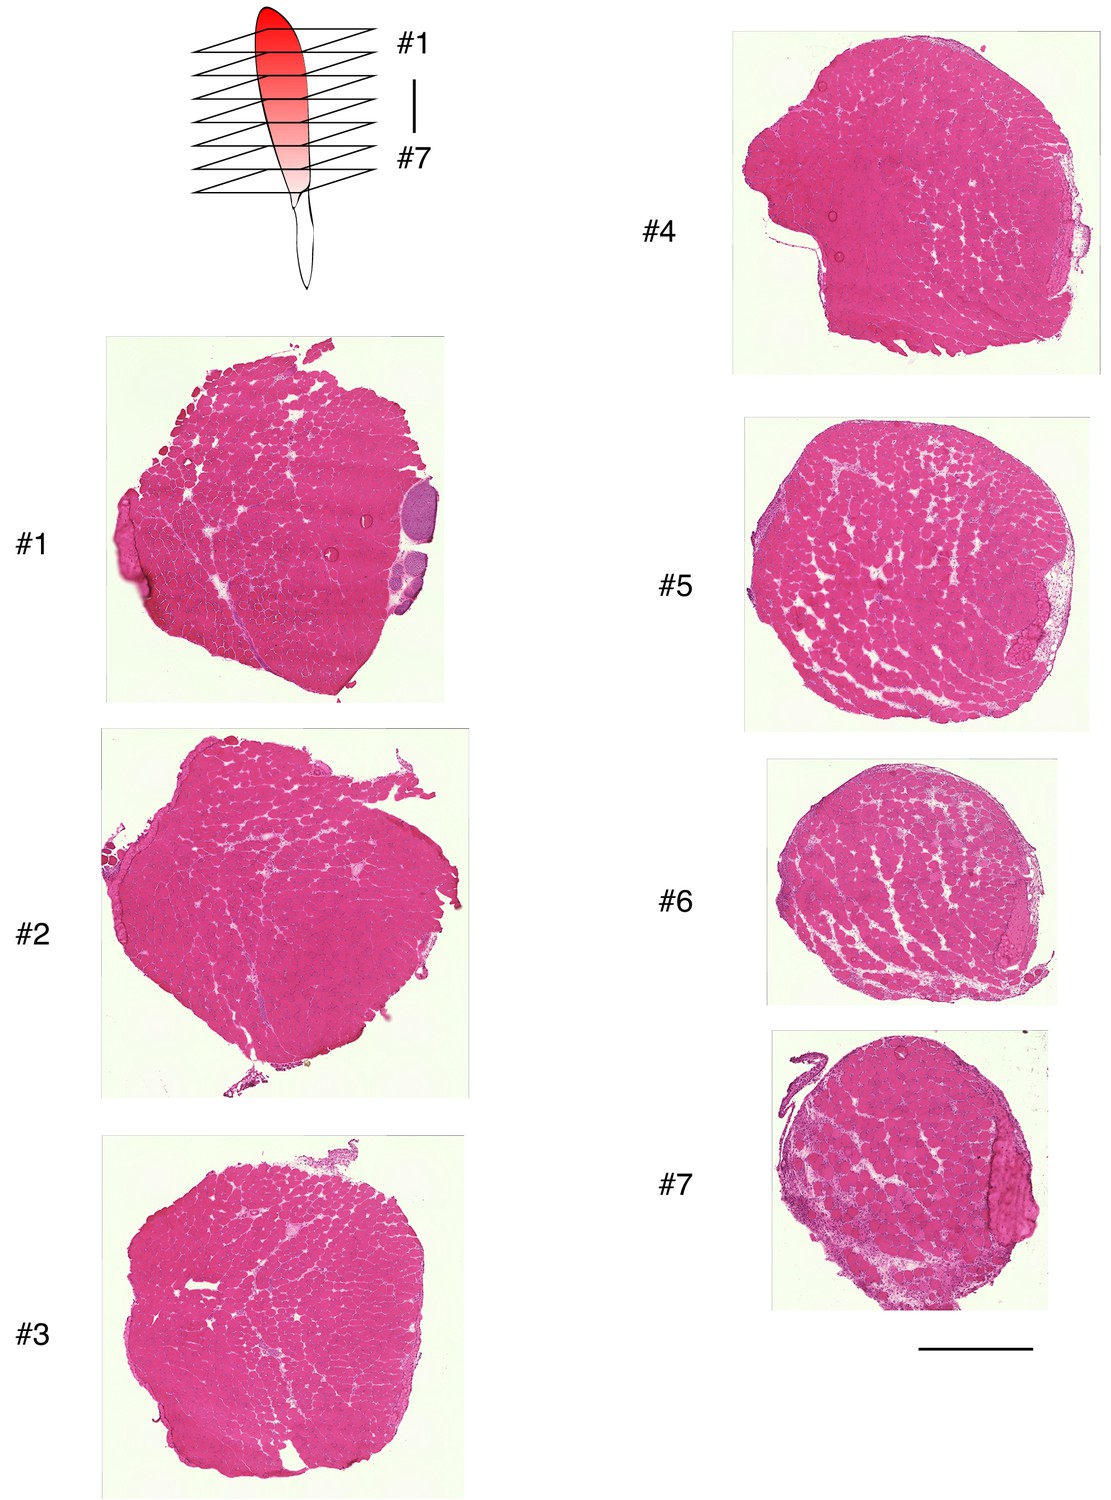
Relative absence of damaged myofibers in plantaris muscle after tenotomy.
H and E staining of plantaris muscle sections at 4 days after tenotomy. Seven sections were prepared from the cranial to the caudal region of plantaris muscle. Scale bar: 500 μm.
Figure 2
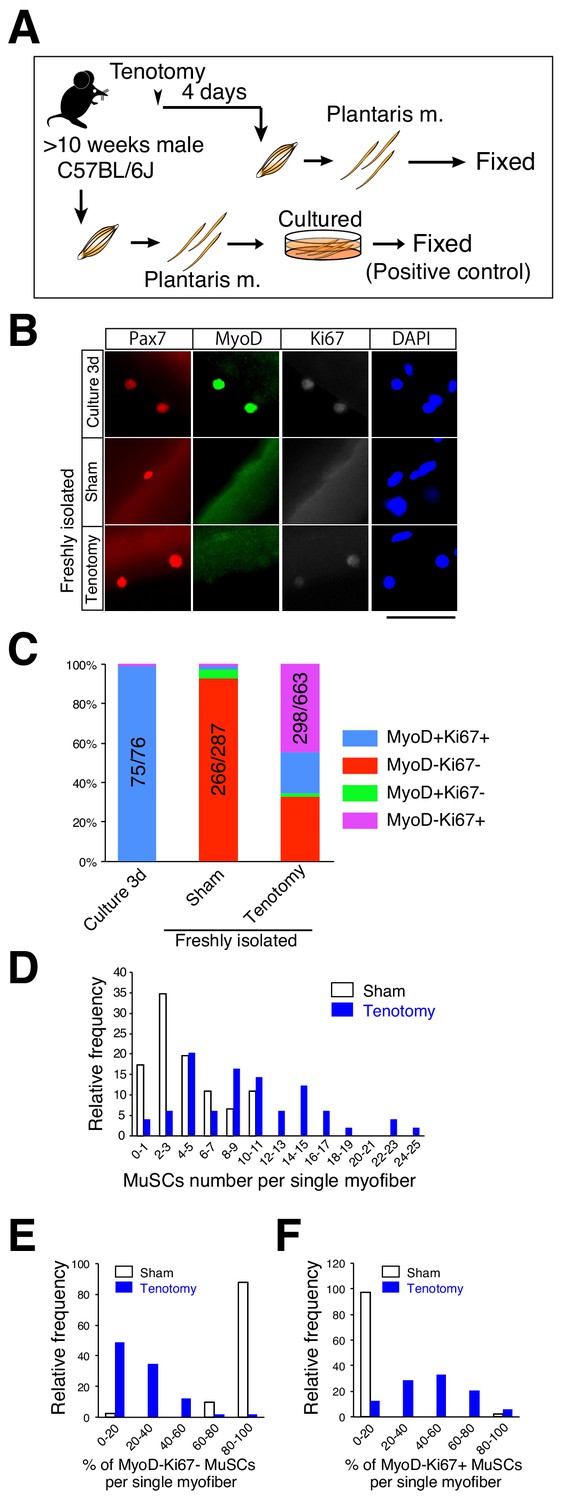
Majority of muscle stem cells proliferate on undamaged overloaded myofibers in the absence of MyoD expression.
(A) Experimental scheme for analyzing the number and properties of MuSCs on isolated single myofibers. At 4 days after tenotomy, single myofibers were isolated and immediately fixed. Single myofibers cultured for 3 days were used as positive controls for immunostaining. (B) Immunostaining of Pax7 (red), MyoD (green), and Ki67 (white) in MuSCs on 3 day cultured myofibers (Culture 3d; positive control), freshly isolated myofibers of sham muscle (Sham), or freshly isolated myofibers at 4 days after tenotomy (Tenotomy). Nuclei were counterstained with DAPI. Scale bar: 50 μm. (C) Bar graph showing frequencies of MyoD+Ki67+ (blue column), MyoD−Ki67− (red column), MyoD+Ki67− (green column), and MyoD−Ki67+ (purple column) cells on 3 day cultured myofibers, sham myofibers, or myofibers at 4 days after tenotomy. The number associated with the majority phenotype in Pax7+ cells is indicated in the numerator of each bar. Total number of Pax7+ cells is indicated in the denominator of each bar. (D) Histogram showing the frequency of the listed number of MuSCs per myofiber in the case of sham myofibers (white bar, n = 46) or myofibers at 4 days after tenotomy (blue bar, n = 49). The X-axis indicates the number of MuSCs per myofiber, and the Y-axis shows the frequency of myofibers harboring the indicated number of MuSCs. (E, F) Frequency of MyoD−Ki67− (E) or MyoD−Ki67+ (F) MuSCs on single myofibers: sham control (white bar, n = 41) versus 4 days after tenotomy (blue bar, n = 49). The X-axis indicates the percentage of MyoD−Ki67− or MyoD−Ki67+ MuSCs per myofiber. The Y-axis shows the frequency of myofibers with the indicated percentage of MyoD−Ki67− (E) or MyoD−Ki67+ (F) MuSCs per myofiber.
-
Figure 2—source data 1
Numerical data for making the graphs in Figure 2.
Experiment number corresponds to all results (Figure 2C). Data in Figure 2-D-F marked by gray color are used for analyses in Figure 2-D-F marked by yellow color.
- https://doi.org/10.7554/eLife.48284.006
Figure 3 with 1 supplement
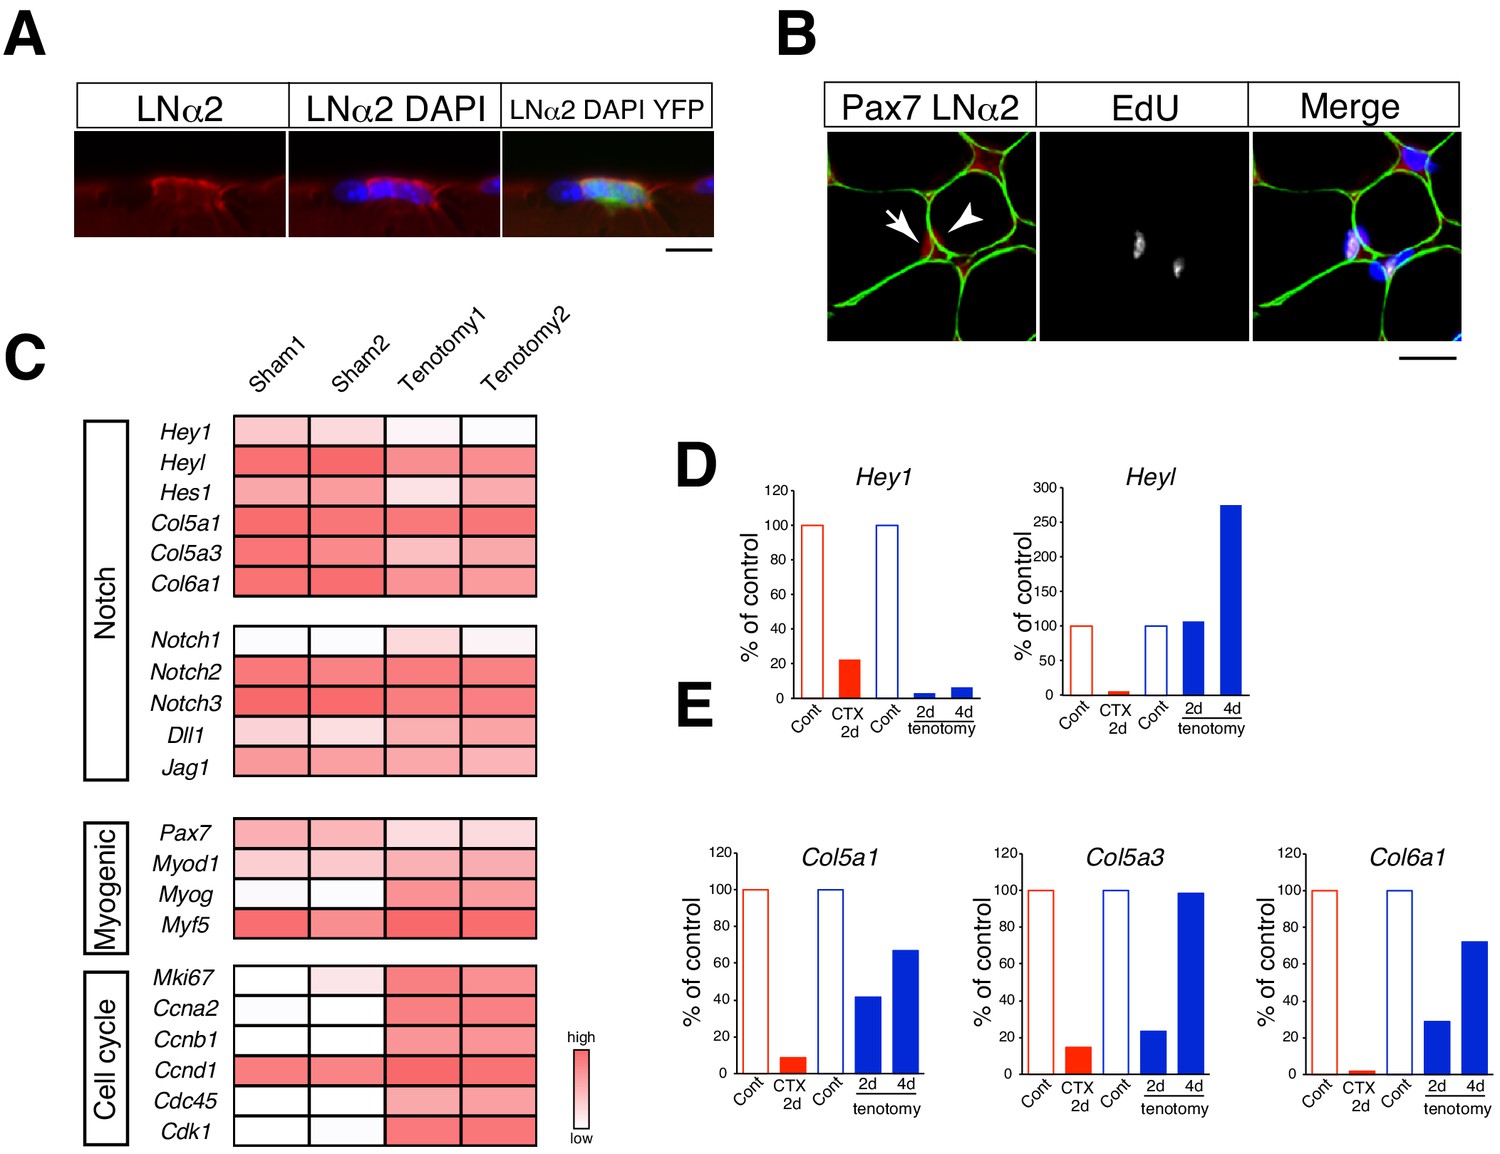
Relative mRNA expression of Notch target genes in muscle stem cells in regenerating versus overloaded muscle.
(A) Immunostaining of laminin α2 (LNα2; red) and YFP (green) in isolated myofibers derived from Pax7CreERT2+::RosaYFP (Rosa-YFP) mice at 4 days after tenotomy. Nuclei were counterstained with DAPI. Scale bar: 10 µm. (B) Immunostaining of Pax7 (red), laminin α2 (LNα2; green), and EdU (white) in sections from C57BL/6 mice at 4 days after tenotomy. Nuclei were counterstained with DAPI. Arrow or arrowhead indicate EdU+ or EdU− Pax7+ cells. Scale bar: 20 µm. (C) RNA-seq analyses of Notch, myogenic, and cell-proliferation-related genes in MuSCs from sham or overloaded plantaris muscle of Rosa-YFP at 4 days after tenotomy. (D, E) Mononuclear myogenic cells were isolated from intact muscle (Cont; red), damaged muscle at 2 days after cardiotoxin injection (CTX 2d), sham-operated muscle (Cont; blue), or overloaded plantaris muscle of C57BL/6. Relative expression of Hey1 and Heyl (D) and three other canonical Notch target genes (Col5a1, Col5a3, and Col6a1) were compared between Cont and CTX/tenotomy samples (E).
Figure 3—figure supplement 1
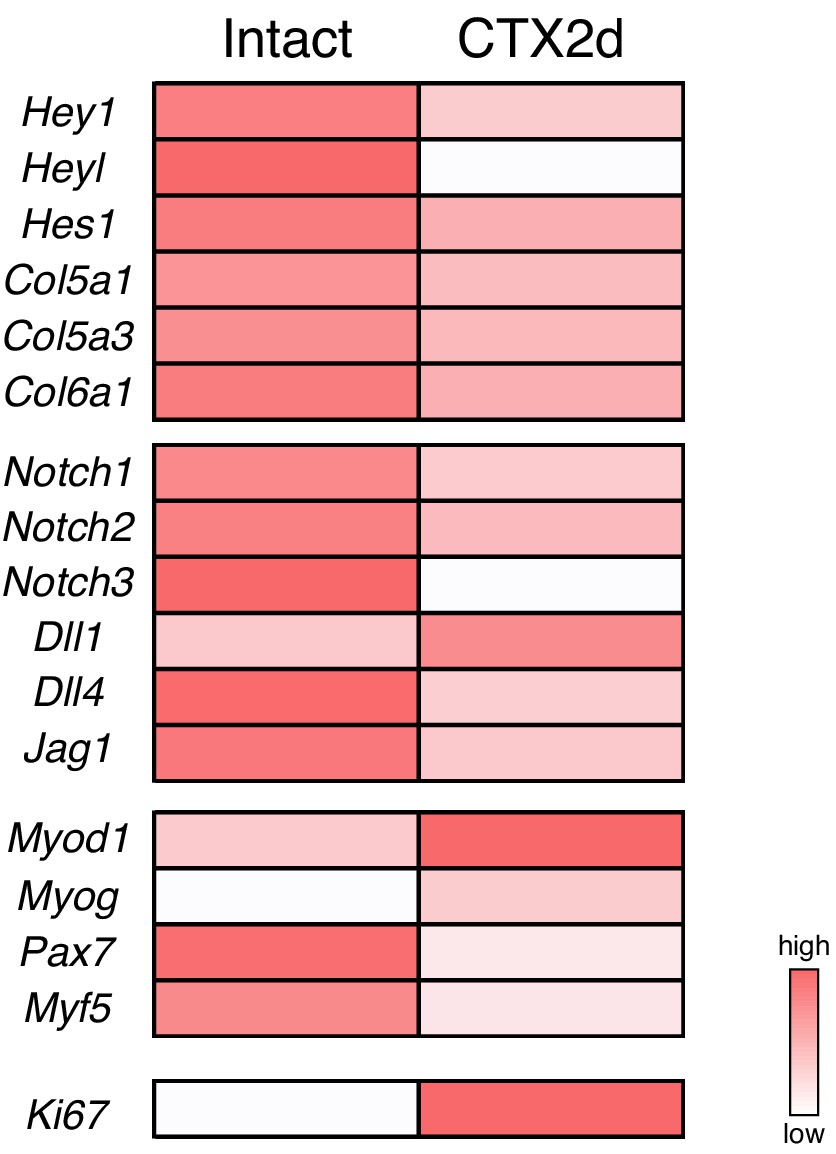
Expression of Notch, myogenic, and cell-proliferation-related genes in MuSCs from intact or damaged muscles.
MuSCs were prepared from intact or damaged hindlimb muscles at 2 days after CTX injection. The heat map shows the gene-expression profile obtained using microarray data (accession number: GSE56903).
Figure 4 with 3 supplements

Increased ratio of MyoD-expressing myogenic cells and decreased cell number in overloaded HeyL-KO mice.
(A) Experimental scheme for analyzing Pax7+ cells on plantaris myofibers derived from control (Cont), Hey1-KO (1KO), or HeyL-KO (LKO) mice at 4 days after tenotomy (Ope). (B) Immunostaining of Pax7 (red), MyoD (green), and Ki67 (white) in MuSCs on freshly isolated myofibers at 4 days after tenotomy from Cont, 1KO, or LKO mice. Nuclei were counterstained with DAPI. Scale bar: 20 μm. (C) Frequency of MyoD−Ki67+ (left) or MyoD+Ki67+ (right) cells among Pax7+ cells on myofibers: sham (open circle) versus 4 days after tenotomy (closed circle), derived from Cont (light gray, n = 5), 1KO (black, n = 4), or LKO (blue, n = 5) mice. **p<0.01. N.S.: not significant. (D) Ratio of MyoD+ to MyoD− cells among Ki67+Pax7+ cells on myofibers at 4 days after tenotomy, derived from Cont (light gray, n = 5), 1KO (black, n = 4), or LKO (blue, n = 5) mice. **p<0.01. N.S.: not significant. (E) Number of Pax7+ cells on myofibers: sham (open circle) versus 4 days after tenotomy (closed circle), derived from Cont (light gray, n = 5), 1KO (black, n = 4), or LKO (blue, n = 5) mice. **p<0.01. N.S.: not significant. Data represent the mean ± standard deviation. One-way ANOVA, followed by the Tukey–Kramer test, was used for statistical analyses.
-
Figure 4—source data 1
Numerical data for making the graphs in Figure 4.
Experiment number corresponds to all results.
- https://doi.org/10.7554/eLife.48284.016
Figure 4—figure supplement 1
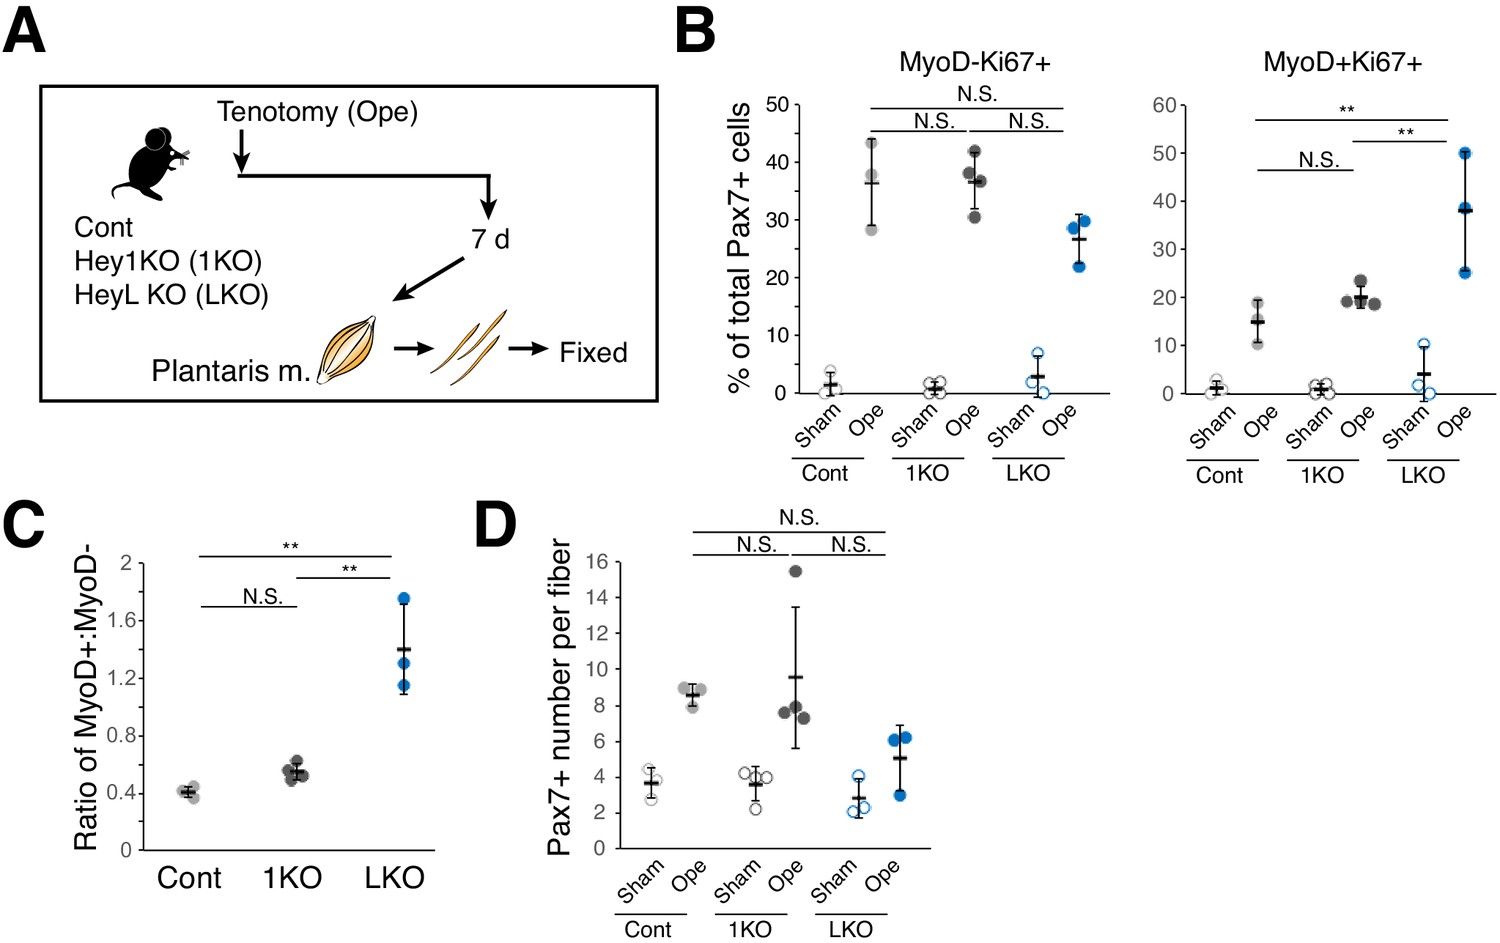
Increased ratio of MyoD-expressing myogenic cells and decreased cell number in overloaded HeyL-KO mice at 7 days after tenotomy.
(A) Experimental scheme for analyzing Pax7+ cells on plantaris myofibers derived from control (Cont), Hey1-KO (1KO), or HeyL-KO (LKO) mice at 7 days after tenotomy (Ope) or derived from corresponding contralateral control muscles (Sham). (B) Frequency of MyoD−Ki67+ (left) or MyoD+Ki67+ (right) cells among Pax7+ cells on myofibers: sham (open circle) versus 7 days after tenotomy (closed circle) and derived from Cont (light gray, n = 3), 1KO (black, n = 4), or LKO (blue, n = 3) mice. **p<0.01. N.S.: not significant. (C) Ratio of MyoD+ to MyoD− cells among Ki67+Pax7+ cells on myofibers at 7 days after tenotomy and derived from Cont (light gray, n = 3), 1KO (black, n = 4), or LKO (blue, n = 3) mice. **p<0.01. N.S.: not significant. (D) Number of Pax7+ cells on myofibers: sham (open circle) versus 7 days after tenotomy (closed circle) and derived from Cont (light gray, n = 3), 1KO (black, n = 4), or LKO (blue, n = 3) mice. N.S.: not significant. Data represent the mean ± standard deviation. One-way ANOVA, followed by the Tukey–Kramer test, was used for statistical analyses.
-
Figure 4—figure supplement 1—source data 1
Numerical data for making the graphs in Figure 4—figure supplement 1.
Experiment number corresponds to all results.
- https://doi.org/10.7554/eLife.48284.011
Figure 4—figure supplement 2

Normal muscle-regenerative ability in HeyL-KO mice.
(A) Immunostaining of M-cadherin (M-cad; red) and laminin α2 (LNα2; green) in sections of regenerating tibialis anterior muscle at 3 days after CTX injection (CTX-3d). Scale bar: 100 μm. Bar graph shows the frequency of M-cadherin+ cells per field in wild-type (Cont; n = 3) and HeyL-KO (LKO; n = 4) mice. N.S.: not significant. (B) Immunostaining of embryonic myosin heavy chain (eMyHC; red) in sections of regenerating tibialis anterior muscle at 4 days after CTX injection (CTX-4d). Scale bar: 200 μm. Bar graph shows percentages of eMyHC+ area in wild-type (Cont; n = 4) and LKO (n = 6) mice. N.S.: not significant. Data represent the mean ± standard deviation. A two-sided Student’s t test was performed.
-
Figure 4—figure supplement 2—source data 1
Numerical data for making the graphs in Figure 4—figure supplement 2.
- https://doi.org/10.7554/eLife.48284.013
Figure 4—figure supplement 3
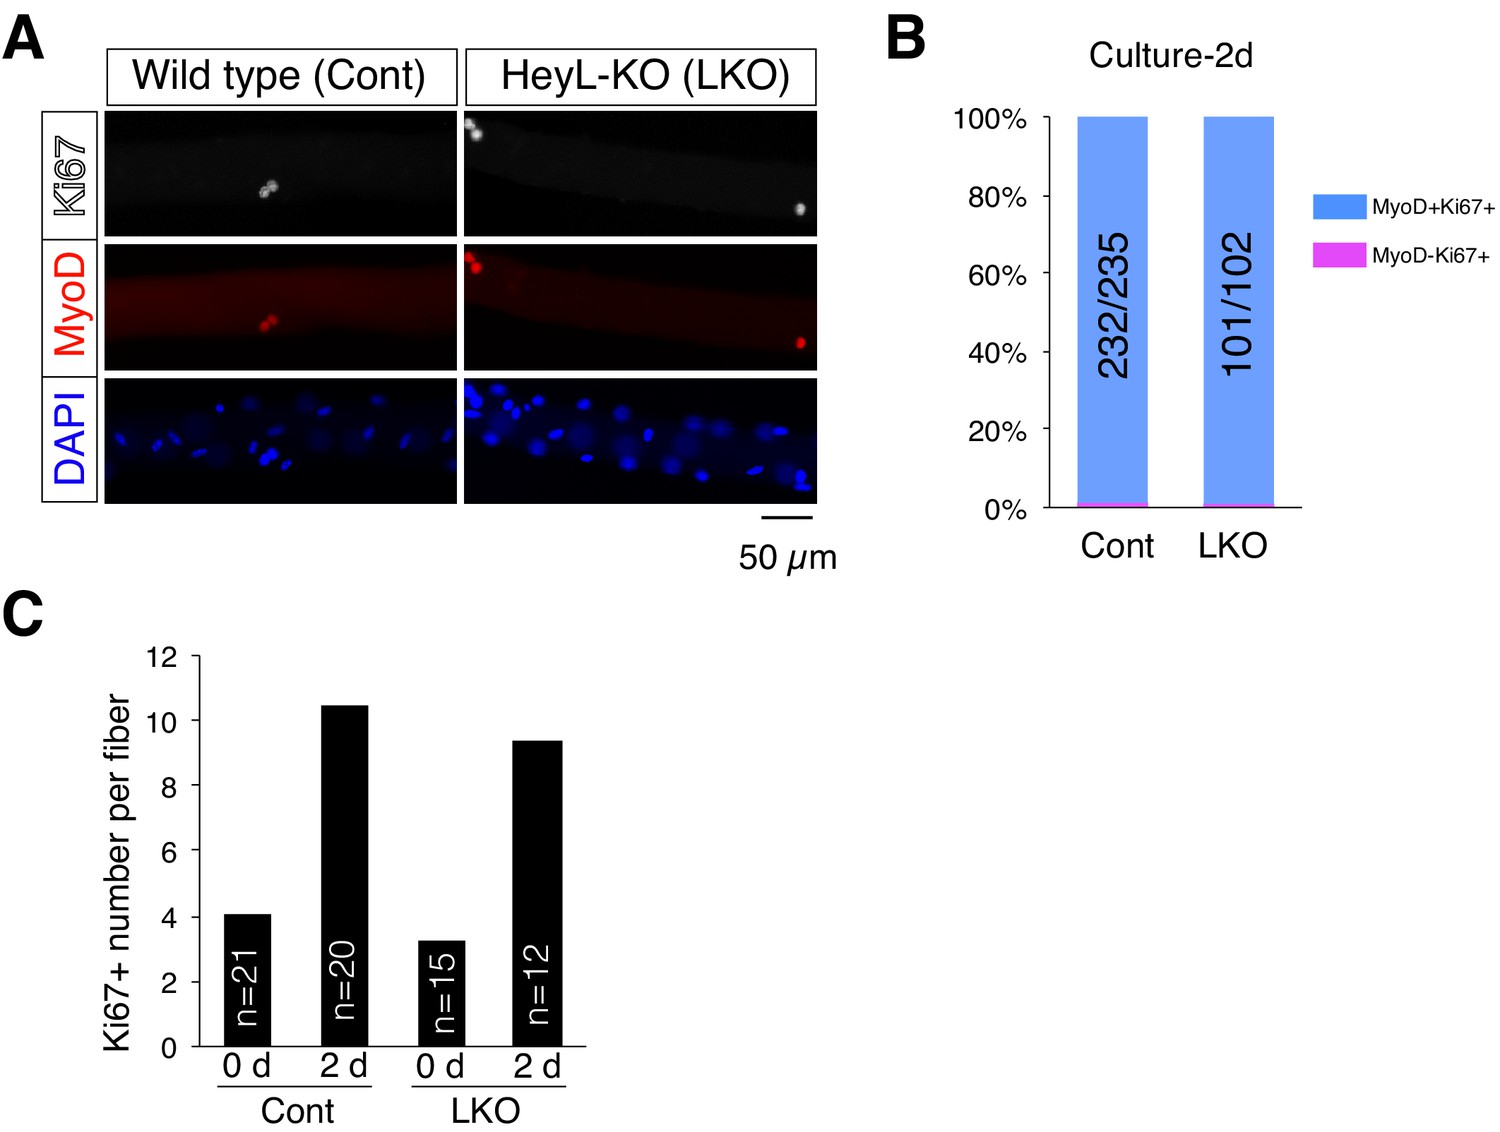
Normal activation and proliferation ability of HeyL-KO MuSCs on cultured myofibers.
(A) Immunostaining of 2 day cultured myofibers from wild-type (Cont) and HeyL-KO (LKO) mice using Ki67 (white) and MyoD (red) antibodies. Nuclei were stained with DAPI (blue). Scale bar: 50 μm. (B) Bar graph showing the percentage of MyoD+ or MyoD− cells among Ki67+ cells on 2 day cultured myofibers from wild-type (Cont) and LKO mice. The number of MyoD+ cells among Ki67+ cells is indicated in the numerator of each bar, and the number of Ki67+ cells is indicated in the denominator of each bar. (C) Bar graph showing the average number of Ki67+ cells per freshly isolated (0 d) or 2 day cultured (2 d) myofibers. The numbers in the graphs indicate the counted myofibers.
-
Figure 4—figure supplement 3—source data 1
Numerical data for making the graphs in Figure 4—figure supplement 3.
- https://doi.org/10.7554/eLife.48284.015
Figure 5 with 1 supplement
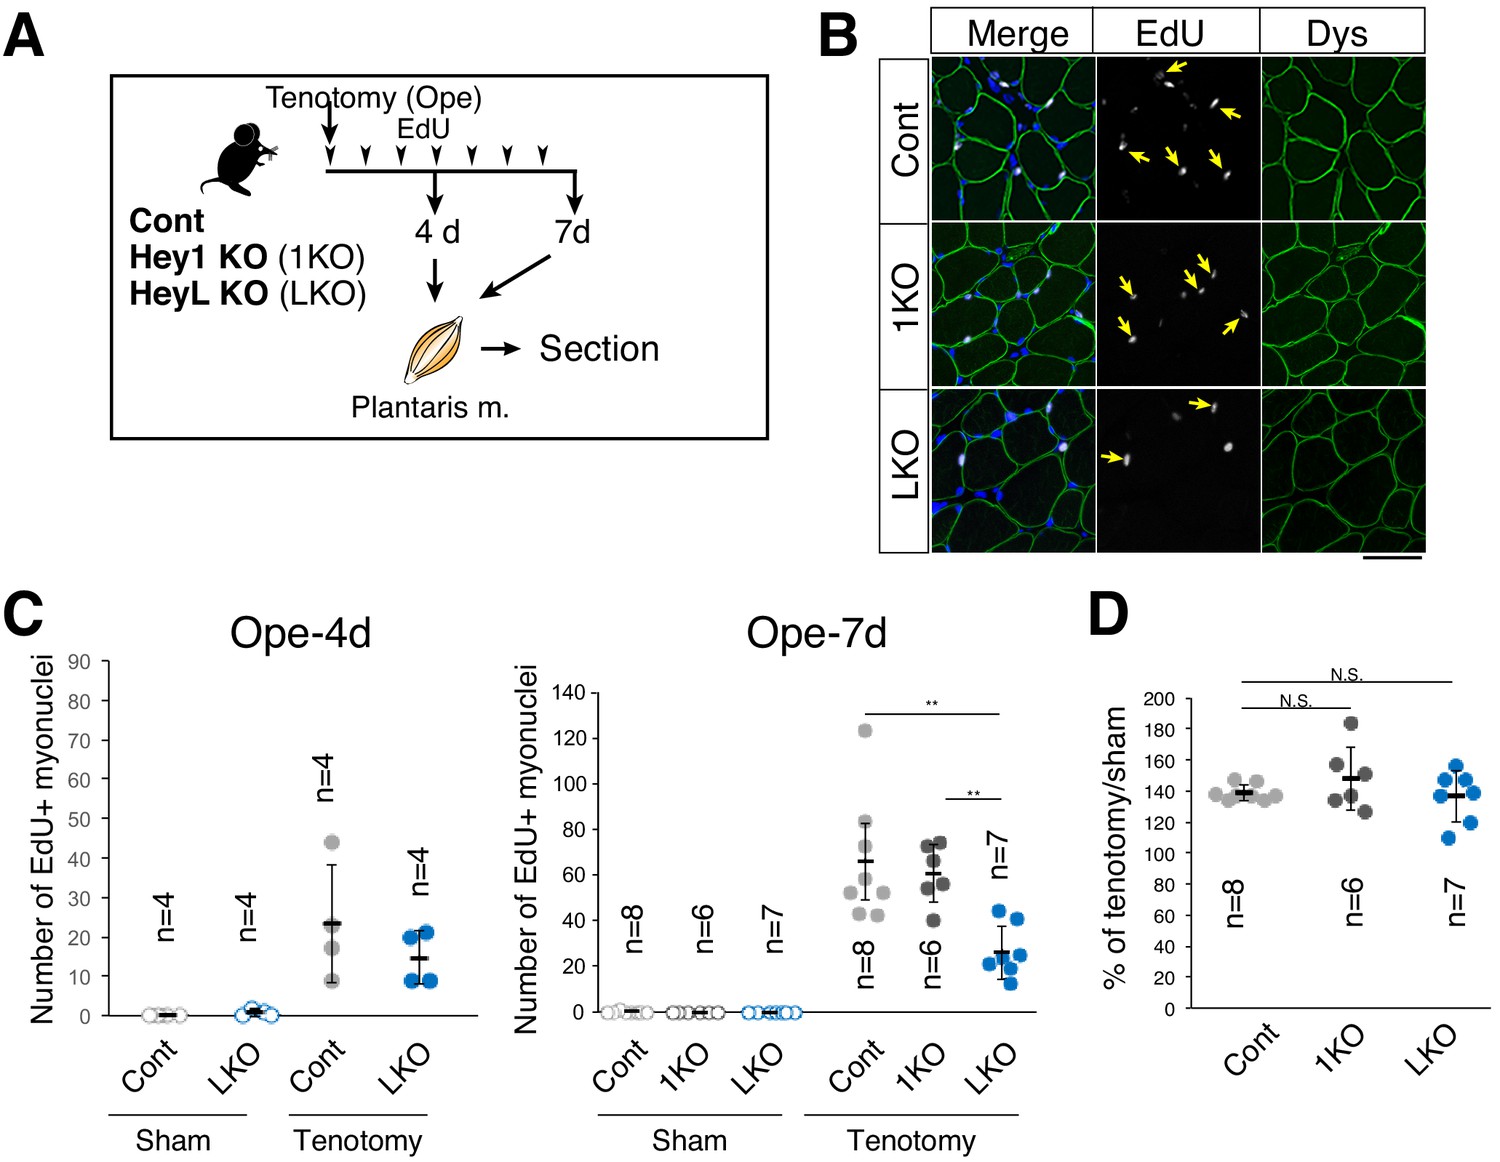
Decreased number of new myonuclei supplied by muscle stem cells in overloaded HeyL-KO muscle.
(A) Experimental scheme for analyzing new MuSC-derived myonuclei in plantaris muscle of control (Cont), Hey1-KO (1KO), or HeyL-KO (LKO) mice at 4 or 7 days after tenotomy. Arrowheads indicate the day of EdU injection. (B) Arrows indicate new myonuclei supplied by MuSCs in overloaded muscle of Cont, 1KO, or LKO mice. MuSC-derived myonuclei were labeled with EdU (white) and located inside the staining for dystrophin (Dys; green). Nuclei were counterstained with DAPI. Scale bar: 50 μm. (C) Number of EdU+ myonuclei in muscle: sham (open circle) versus tenotomy (closed circle). Left graph: results at 4 days after tenotomy (Ope-4d) (Cont: light gray, n = 4; LKO: blue, n = 4). Right graph: results at 7 days after tenotomy (Cont: light gray, n = 8; 1KO: black, n = 6; LKO: blue, n = 7). **p<0.01. N.S.: not significant. (D) Ratio of overloaded muscle weight to sham muscle weight in Cont (light gray, n = 8), 1KO (black, n = 6), or LKO (blue, n = 8) mice at 7 days after tenotomy. N.S.: not significant. Data represent the mean ± standard deviation. One-way ANOVA, followed by the Tukey–Kramer or Bonferroni test, was used for statistical analyses.
-
Figure 5—source data 1
Numerical data for making the graphs in Figure 5.
Experiment number corresponds to all results.
- https://doi.org/10.7554/eLife.48284.020
Figure 5—figure supplement 1
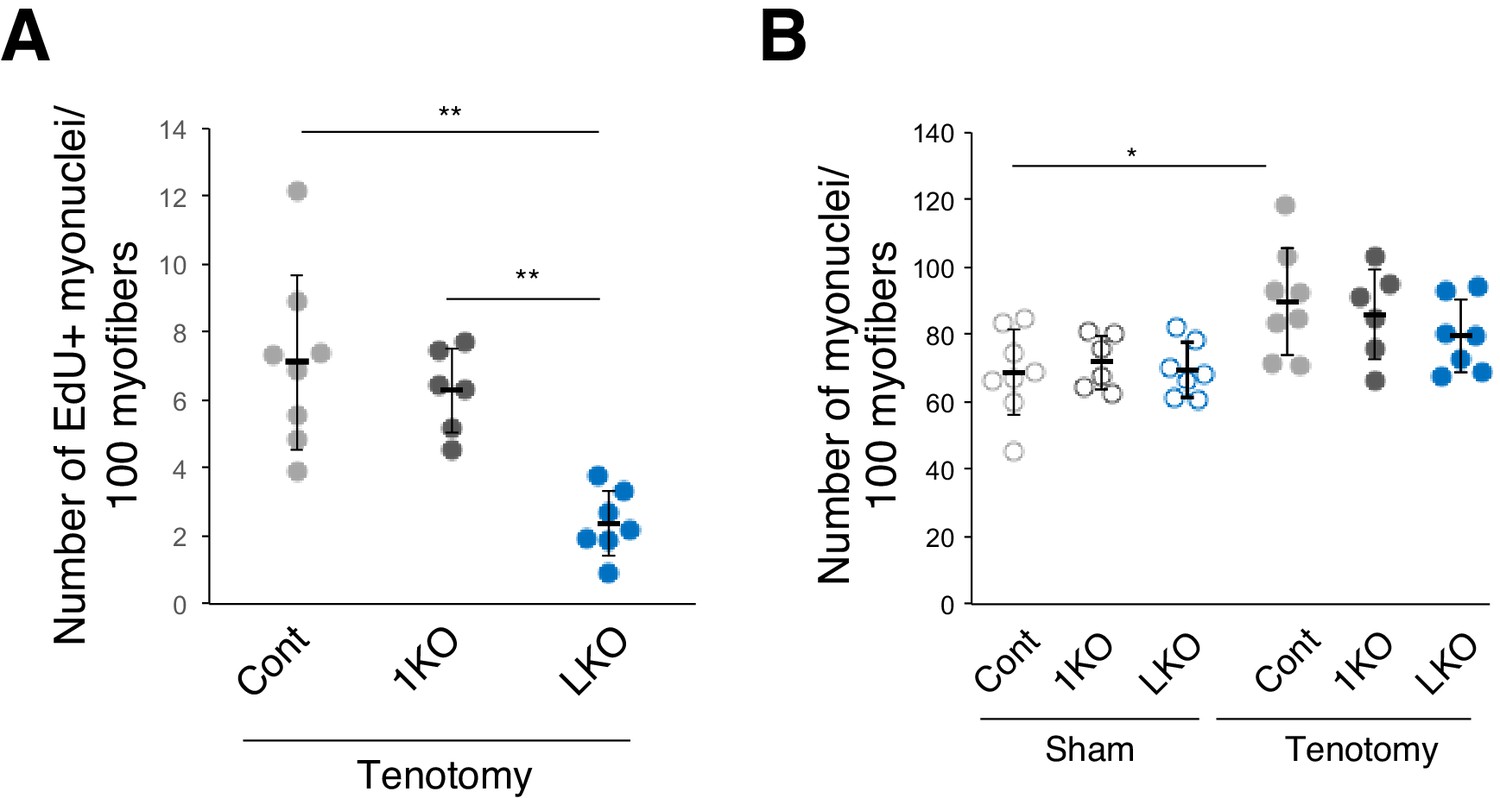
Number of EdU+ or total myonuclei per 100 myofibers.
(A) The number of EdU+ myonuclei per 100 myofibers at 1 week after tenotomy (Cont: light gray, n = 8; 1KO: black, n = 6; LKO: blue, n = 7). The number of EdU+ located beneath dystrophin staining was counted. **p<0.01. (B) The number of total myonuclei per 100 myofibers from sham (open circle) or 1 week after tenotomy (closed circle) (Cont: light gray, n = 8; 1KO: black, n = 6; LKO: blue, n = 7). The number of nuclei (DAPI) located beneath dystrophin staining was counted. *p<0.05.
-
Figure 5—figure supplement 1—source data 1
Numerical data for making the graphs in Figure 5—figure supplement 1.
Experiment number corresponds to all results.
- https://doi.org/10.7554/eLife.48284.019
Figure 6 with 1 supplement
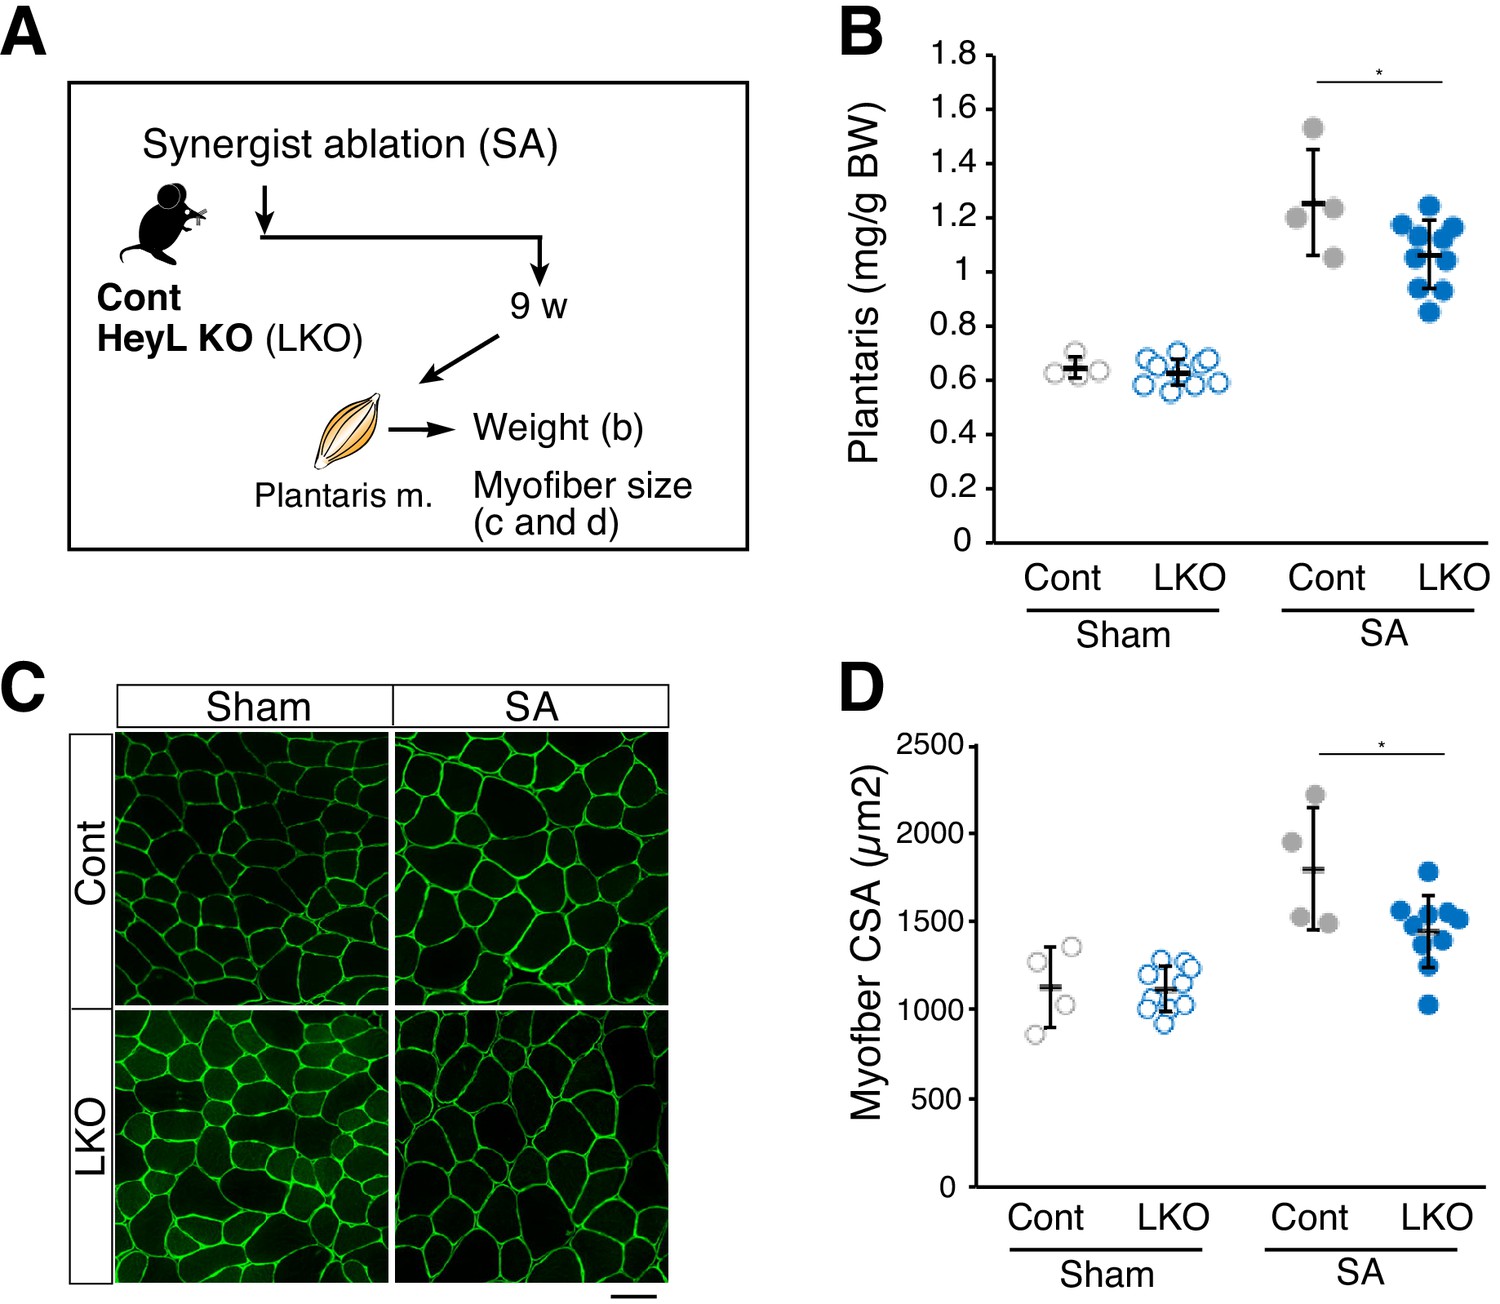
Blunted hypertrophy in HeyL-KO mice at 9 weeks after synergist ablation (SA).
(A) Experimental scheme for analyzing the influence of HeyL-KO (LKO) on overloaded plantaris muscle at 9 weeks after SA. (B) Normalized plantaris muscle weight [muscle weight/body weight (BW)] from sham (open circle) or SA (closed circle) muscle derived from Cont (light gray, n = 4) or LKO mice (blue, n = 10). *p<0.05. N.S.: not significant. (C) Immunostaining of laminin α2 (green) in sham or SA plantaris muscle derived from Cont or LKO mice. Scale bar: 50 μm. (D) Average myofiber cross-sectional area (CSA) values from sham (open circle) or SA (closed circle) plantaris muscle derived from Cont (light gray, n = 4) or LKO mice (blue, n = 10). *p<0.05. N.S.: not significant. Data represent the mean ± standard deviation. One-way ANOVA, followed by the Tukey–Kramer test, was used for statistical analyses.
-
Figure 6—source data 1
Numerical data for making the graphs in Figure 6.
Experiment number corresponds to all results.
- https://doi.org/10.7554/eLife.48284.024
Figure 6—figure supplement 1
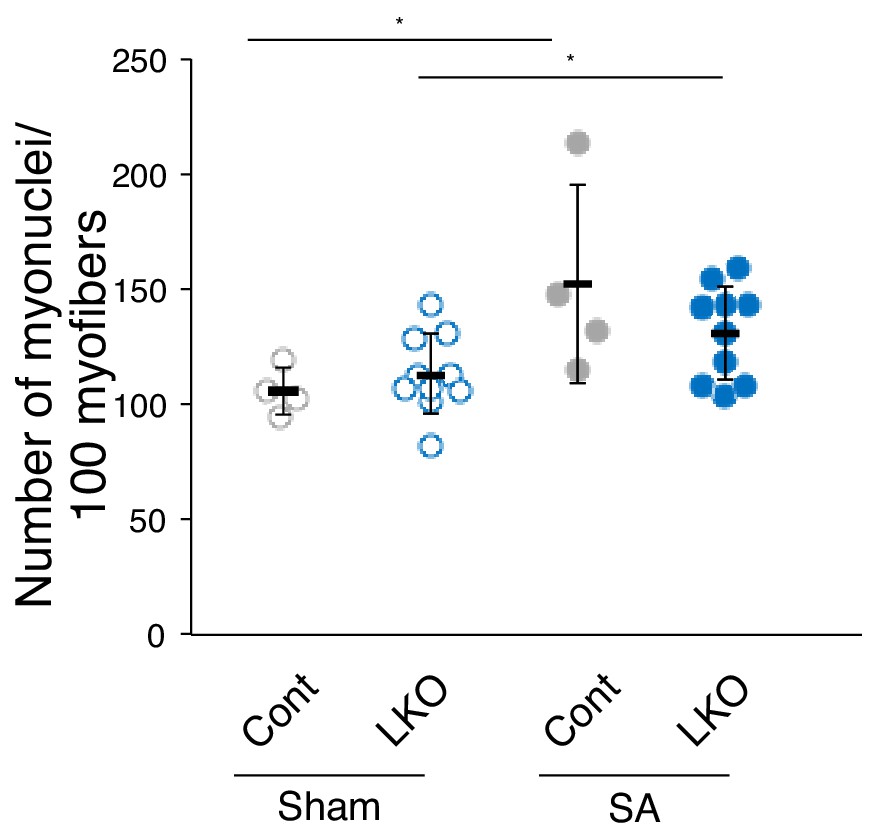
Number of total myonuclei per 100 myofibers 9 weeks after SA.
The number of total myonuclei per 100 myofibers from sham (open circle) or 9 weeks after SA (closed circle) (Cont: light gray, n = 4; LKO: blue, n = 10). The number of nuclei (DAPI) located beneath dystrophin staining was counted. *p<0.05.
-
Figure 6—figure supplement 1—source data 1
Numerical data for making the graph in Figure 6—figure supplement 1.
Experiment number corresponds to Figure 6—source data 1.
- https://doi.org/10.7554/eLife.48284.023
Figure 7 with 1 supplement

Model of MuSC behavior in overloaded muscle.
(A) Distinct environments for MuSC proliferation between regenerating and overloaded muscle. (B) Essential roles of HeyL in MuSC proliferation in overloaded muscle.
Figure 7—figure supplement 1
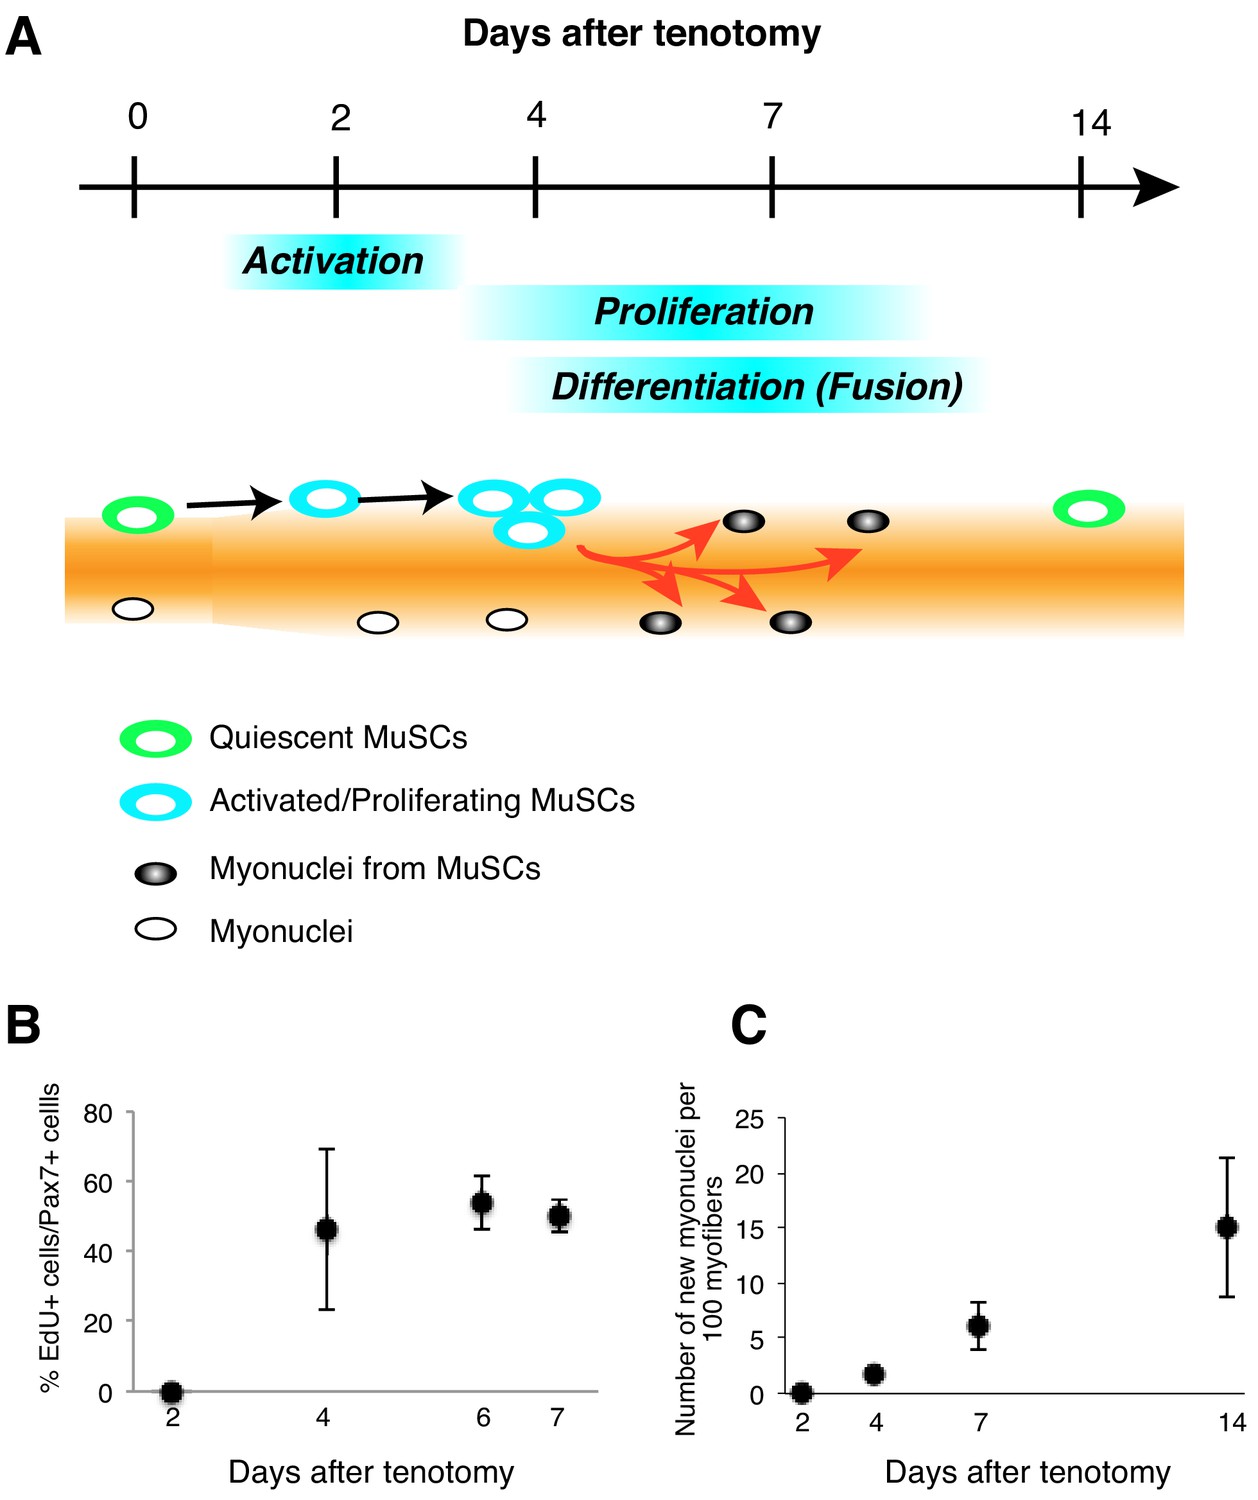
Kinetics of MuSC behavior in overloaded muscle.
(A) MuSC behavior in overloaded muscle. (B) Frequency of EdU+Pax7+ cells among Pax7+ cells. After tenotomy, EdU was injected until mice were sacrificed. (C) Gradual increases in the number of new MuSC-derived myonuclei up to 14 days after tenotomy. After tenotomy, EdU was injected until mice were sacrificed.
-
Figure 7—figure supplement 1—source data 1
Raw data in Figure 7—figure supplement 1.
- https://doi.org/10.7554/eLife.48284.027
Tables
Key resources table
| Reagent type (species) or resource | Designation | Source or reference | Identifiers | Additional information |
|---|---|---|---|---|
| Strain, strain background (Mus musculus) | Hey1-KO | PMID: 15680351 | MGI:3574059 | Kokubo et al., 2005 |
| Strain, strain background (Mus musculus) | Heyl-KO | PMID: 21989910 | MGI:5302514 | Fukada et al., 2011 |
| Strain, strain background (Mus musculus) | Pax7CreERT2/+ | The Jackson Laboratory PMID: 19554048 | JAX:# 012476 RRID:IMSR_JAX:012476 | |
| Strain, strain background (Mus musculus) | Rosa26EYFP | The Jackson Laboratory PMID: 19554048 | JAX:# 006148 RRID:IMSR_JAX:006148 | |
| Antibody | anti-CD31-FITC (rat monoclonal) | BD Biosciences | Cat# 558738 RRID:AB_397097 | 1:400 |
| Antibody | anti-CD45-FITC (rat monoclonal) | eBioscience | Cat# 11-0451-82 RRID:AB_465050 | 1:800 |
| Antibody | anti-Sca1-PE (rat monoclonal) | BD Biosciences | Cat# 553336 RRID:AB_394792 | 1:400 |
| Antibody | anti-Satellite cells (rat monoclonal) | Fukada et al., 2004 ECR 296, 245–255. | 1:200 | |
| Antibody | anti-Dystrophin (rabbit polyclonal) | Abcam | Cat# ab15277, RRID:AB_301813 | 1:800 |
| Antibody | anti-eMyHC (mouse monoclonal) | DSHB | Cat# F1.652 RRID:AB_528358 | 1:2 (Supernatant) |
| Antibody | anti-GFP (YFP) (goat polyclonal) | SICGEN | Cat# AB0020-200, RRID:AB_2333099 | 1:1000 |
| Antibody | anti-GFP (YFP) (rabbit polyclonal) | MBL | Cat# 598S, RRID:AB_591816 | 1:1000 |
| Antibody | anti-Ki67 (rat monoclonal) | Thermo Fisher Scientific | Cat# 14-5698-82 RRID:AB_10854564 | 1:200 |
| Antibody | anti-Laminin a2 (rat monoclonal) | Enzo Life Sciences | Cat#ALX-804–190 C100, RRID:AB_2051764 | 1:200 |
| Antibody | anti-M-cadherin (rabbit polyclonal) | Ojima et al., 2004 | 1:1000 | |
| Antibody | anti-MyoD (rabbit polyclonal) | Santa Cruz | Cat# sc-760 RRID:AB_2148870 | 1:200 |
| Antibody | anti-MyoD (mouse monoclonal) | BD Biosciences | Cat# 554130 RRID:AB_395255 | 1:200 |
| Antibody | anti-Pax7 (mouse monoclonal) | DSHB | Cat# PAX7 RRID:AB_528428 | 1:2 (Supernatant) |
| Commercial assay or kit | Click-iT EdU Cell Proliferation Kit for Imaging, Alexa Fluor 647 dye | Thermo Fisher Scientific | #C10340 | |
| Chemical compound, drug | EdU | Thermo Fisher Scientific | #A10044 | |
| Chemical compound, drug | Cardiotoxin | Latoxan | Cat# L8102 | 10 µM |
| Chemical compound, drug | Tamoxifen | Sigma-Aldrich | Cat# T5648-1G | |
| Others | DAPI | Vector Laboratories | Cat# H-1200 | |
| Others | MOM blocking | Vector Laboratories | Cat# BMK-2202 | |
| Sequence-based reagent | 5’-TGTGGATCACCTGAAAATGC | Eurofins | N/A | qPCR Hey1 (Forward primer) |
| Sequence-based reagent | 5’-ACCCCAAACTCCGATAGTCC | Eurofins | N/A | qPCR Hey1 (Reverse primer) |
| Sequence-based reagent | 5’-CAGCCCTTCGCAGATGCAA | Eurofins | N/A | qPCR Heyl (Forward primer) |
| Sequence-based reagent | 5’-CCAATCGTCGCAATTCAGAAAG | Eurofins | N/A | qPCR Heyl (Reverse primer) |
| Sequence-based reagent | 5’-GCTACTCCTGTTCCTGCTGC | Eurofins | N/A | qPCR Col5a1 (Forward primer) |
| Sequence-based reagent | 5’-TGAGGGCAAATTGTGAAAATC | Eurofins | N/A | qPCR Col5a1 (Reverse primer) |
| Sequence-based reagent | 5’-CCGGAGACTGGATCAGCTT | Eurofins | N/A | qPCR Col5a3 (Forward primer) |
| Sequence-based reagent | 5’-GCTTCCAGTACGTCCACAGG | Eurofins | N/A | qPCR Col5a3 (Reverse primer) |
| Sequence-based reagent | 5’-TACTTCGGGAAAGGCACCTA | Eurofins | N/A | qPCR Col6a1 (Forward primer) |
| Sequence-based reagent | 5’-TCGGTCACCACGATCAAGT | Eurofins | N/A | qPCR Col6a1 (Reverse primer) |
| Chemical compound, drug | Trizol LS reagent | Thermo Fisher Scientific | Cat# 10296028 | |
| Chemical compound, drug | RNeasy mini kit | QIAGEN | Cat# 74104 | |
| Software, algorithm | Photophop CC | https://www.adobe.com/products/photoshop.html | RRID:SCR_014199 | |
| Software, algorithm | Hybrid Cell count | https://www.keyence.com/ss/products/microscope/bz-x/products-info/quantify.jsp | ||
| Software, algorithm | UMI-tools | https://github.com/CGATOxford/UMI-tools | v.1.1.0 | |
| Software, algorithm | HISAT2 | https://ccb.jhu.edu/software/hisat2/index.shtml | v.2.1.0 | |
| Software, algorithm | featureCounts | http://subread.sourceforge.net/ | v.1.6.4 | |
| Software, algorithm | DESeq2 | https://bioconductor.org/packages/release/bioc/html/DESeq2.html | DOI: 10.18129/B9.bioc.DESeq2 | v.1.22.2 |
Additional files
-
Transparent reporting form
- https://doi.org/10.7554/eLife.48284.028
Download links
A two-part list of links to download the article, or parts of the article, in various formats.
Downloads (link to download the article as PDF)
Open citations (links to open the citations from this article in various online reference manager services)
Cite this article (links to download the citations from this article in formats compatible with various reference manager tools)
Sustained expression of HeyL is critical for the proliferation of muscle stem cells in overloaded muscle
eLife 8:e48284.
https://doi.org/10.7554/eLife.48284


