Implementation of an antibody characterization procedure and application to the major ALS/FTD disease gene C9ORF72
- McGill University, Canada
- University of Toronto, Canada
- University of Oxford, United Kingdom
Figures
Figure 1
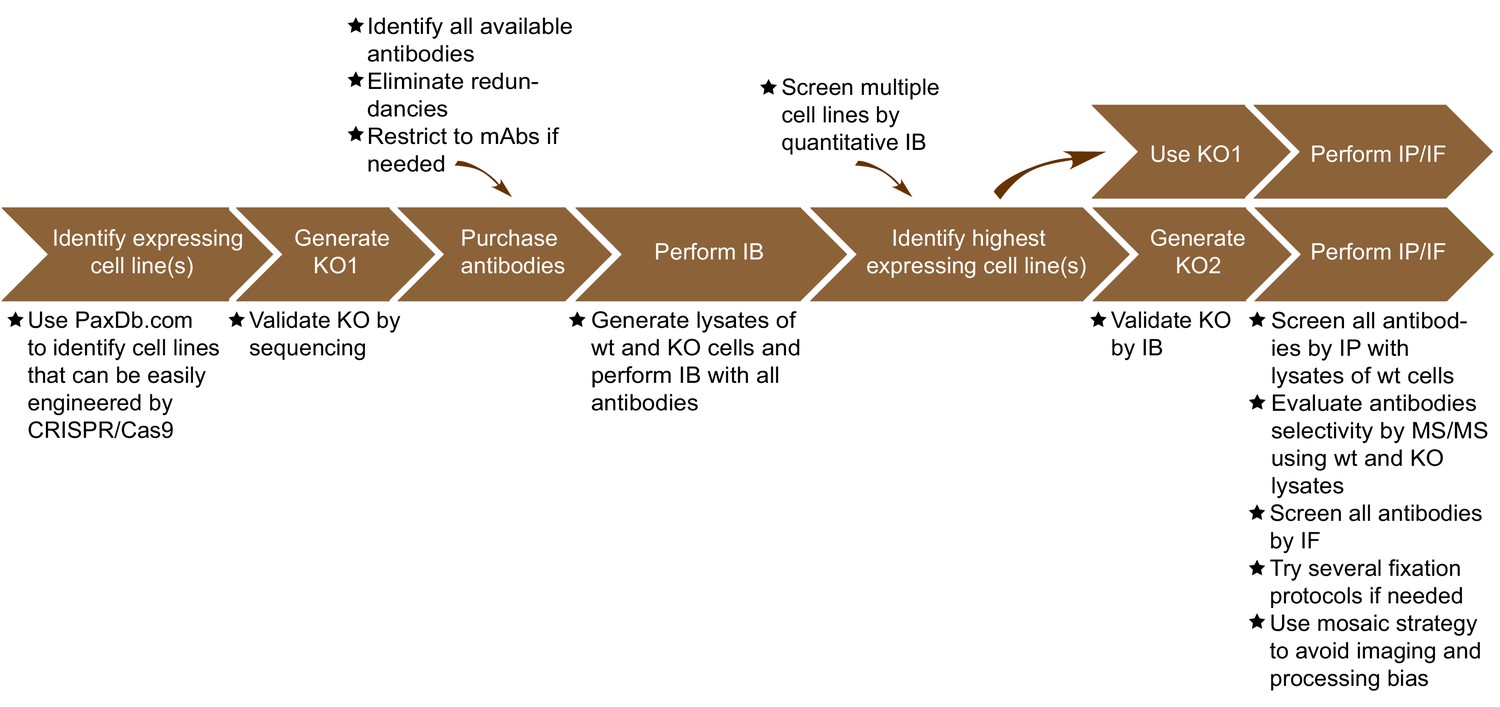
Summary of the antibody validation pipeline.
IB = immunoblot; IP = immunoprecipitation; IF = immunofluorescence; KO = knockout.
Figure 2 with 1 supplement

Analysis of 16 C9ORF72 antibodies by immunoblot.
Cell lysates from HEK-293 parental, heterozygous (+/-) or two individual C9ORF72 KO clones (KOA, KOB) were prepared and processed for immunoblot with the indicated C9ORF72 antibodies. The arrows point to positive C9ORF72 signals. The Ponceau stained transfers associated with each blot are shown as a protein loading control.
Figure 2—figure supplement 1
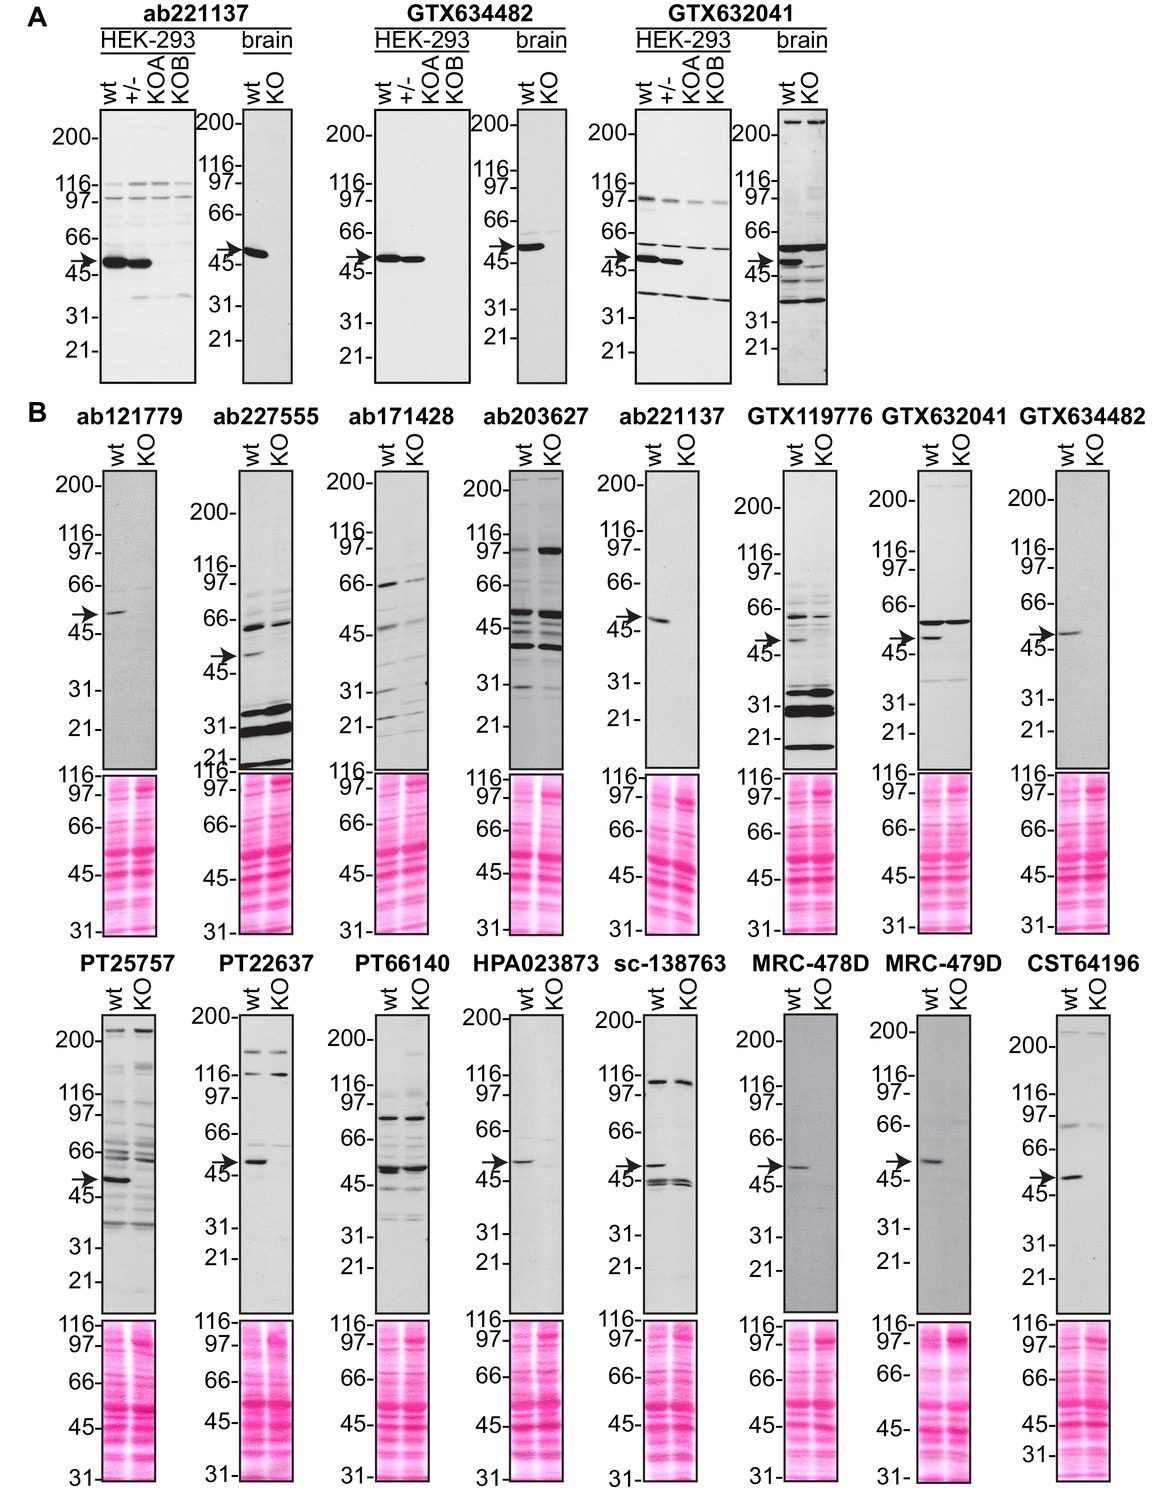
Analysis of 16 C9ORF72 antibodies by immunoblot.
(A) Selected immunoblots on HEK-293 cell lysates from Figure 2 or on mouse brain samples from part (B) of this supplement are shown with longer exposure. (B) Brain lysates from WT and C9ORF72 KO mice were prepared and processed for immunoblot with the indicated C9ORF72 antibodies. The arrows point to positive C9ORF72 signals.
Figure 3 with 1 supplement
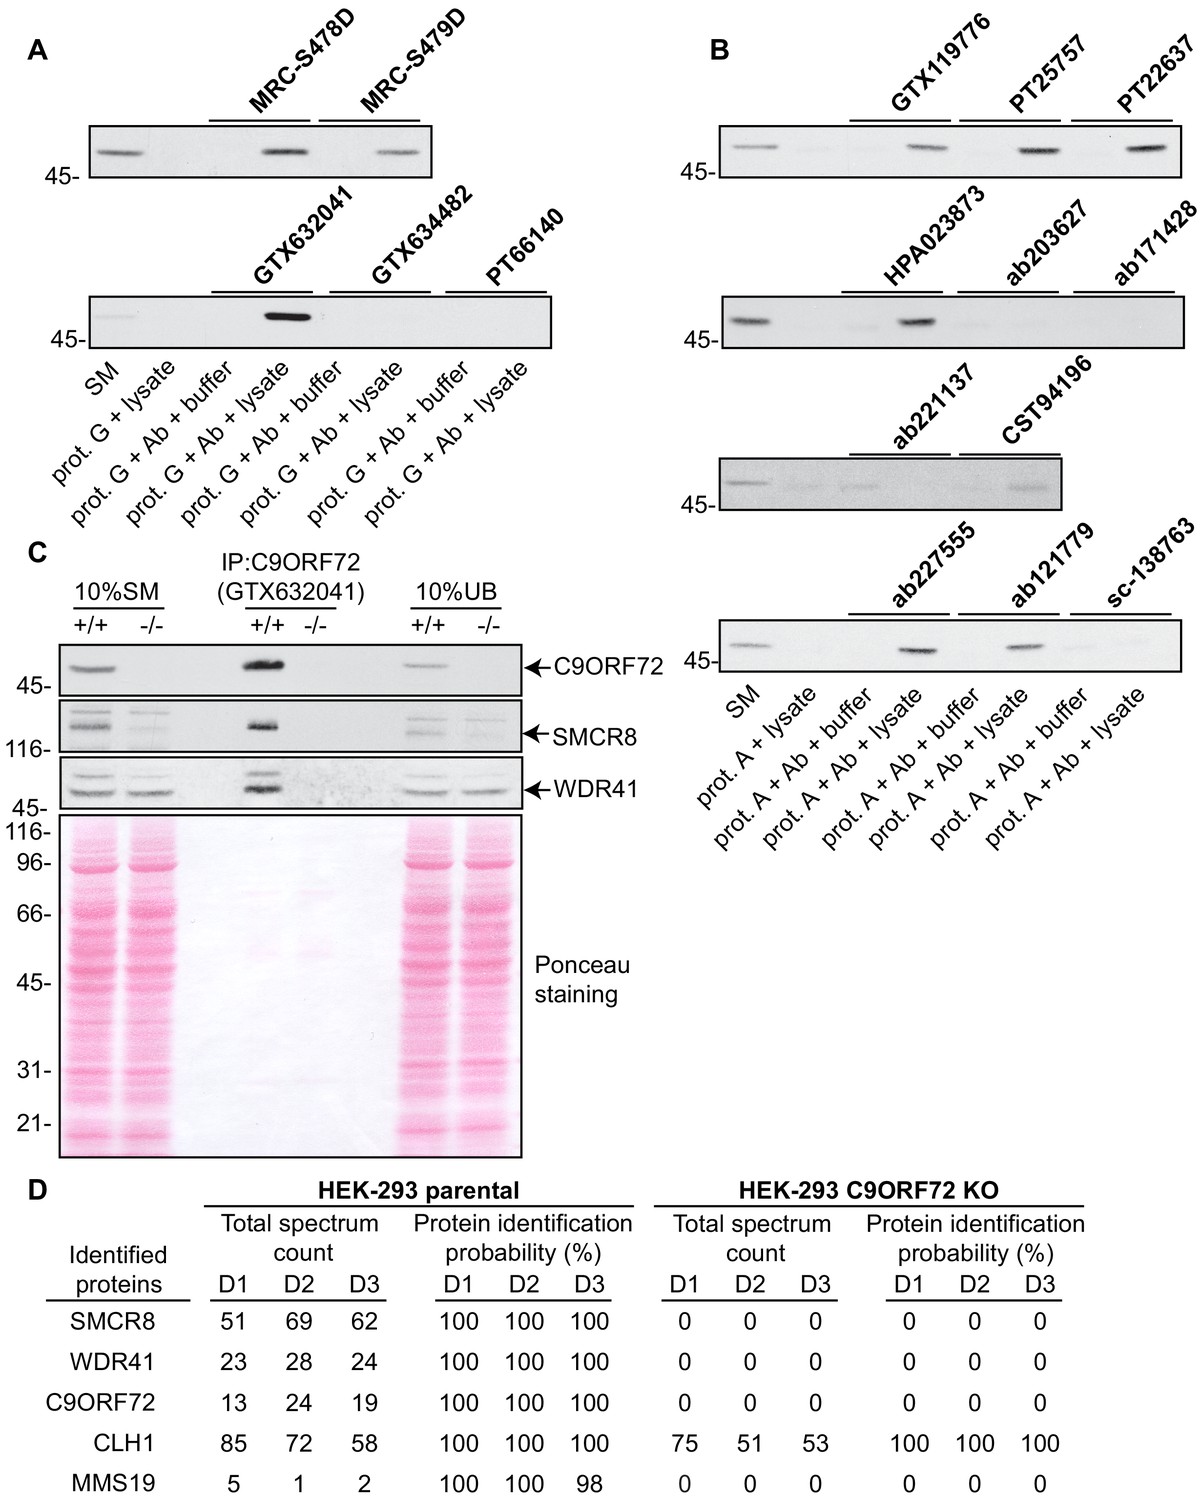
Analysis of 16 C9ORF72 antibodies by immunoprecipitation.
(A) HEK-293 cell lysates were prepared and immunoprecipitation was performed using the indicated C9ORF72 antibodies pre-coupled to protein G-Sepharose (prot. G). Controls included the Protein G-Sepharose alone incubated with cell lysate or protein G-Sepharose pre-coupled with the antibodies but incubated with lysis buffer. Samples were washed and processed for immunoblot with C9ORF72 antibody PT22637. (B) HEK-293 cell lysates were prepared and immunoprecipitation was performed using the indicated C9ORF72 antibodies pre-coupled to protein A-Sepharose (prot. (A). Controls included the Protein S-Sepharose alone incubated with cell lysate or protein A-Sepharose pre-coupled with the antibodies but incubated with lysis buffer. Samples were washed and processed for immunoblot with C9ORF72 antibody GTX634482. (C) Lysates were prepared from HEK-293 cells, parental (+/+) and KO (-/-) and immunoprecipitation was performed using C9ORF72 antibody GTX632041 pre-coupled to protein G-Sepharose. Samples were washed and processed for immunoblot with C9ORF72 antibody PT22637. Blots were also performed for SMCR8 and WDR41. The Ponceau stained transfer of the blot is shown as a protein loading control. Aliquots (10%) of the cell lysates before (starting material, SM) and after incubation with the antibody-coupled beads (unbound, UB) were processed in parallel. (D) Table indicating the total spectrum count and protein identification probabilities for the indicated gene products proteins obtained by mass spectrometry analysis of the immunoprecipitated samples from three independent experiments (D1–D2–D3).
Figure 3—figure supplement 1
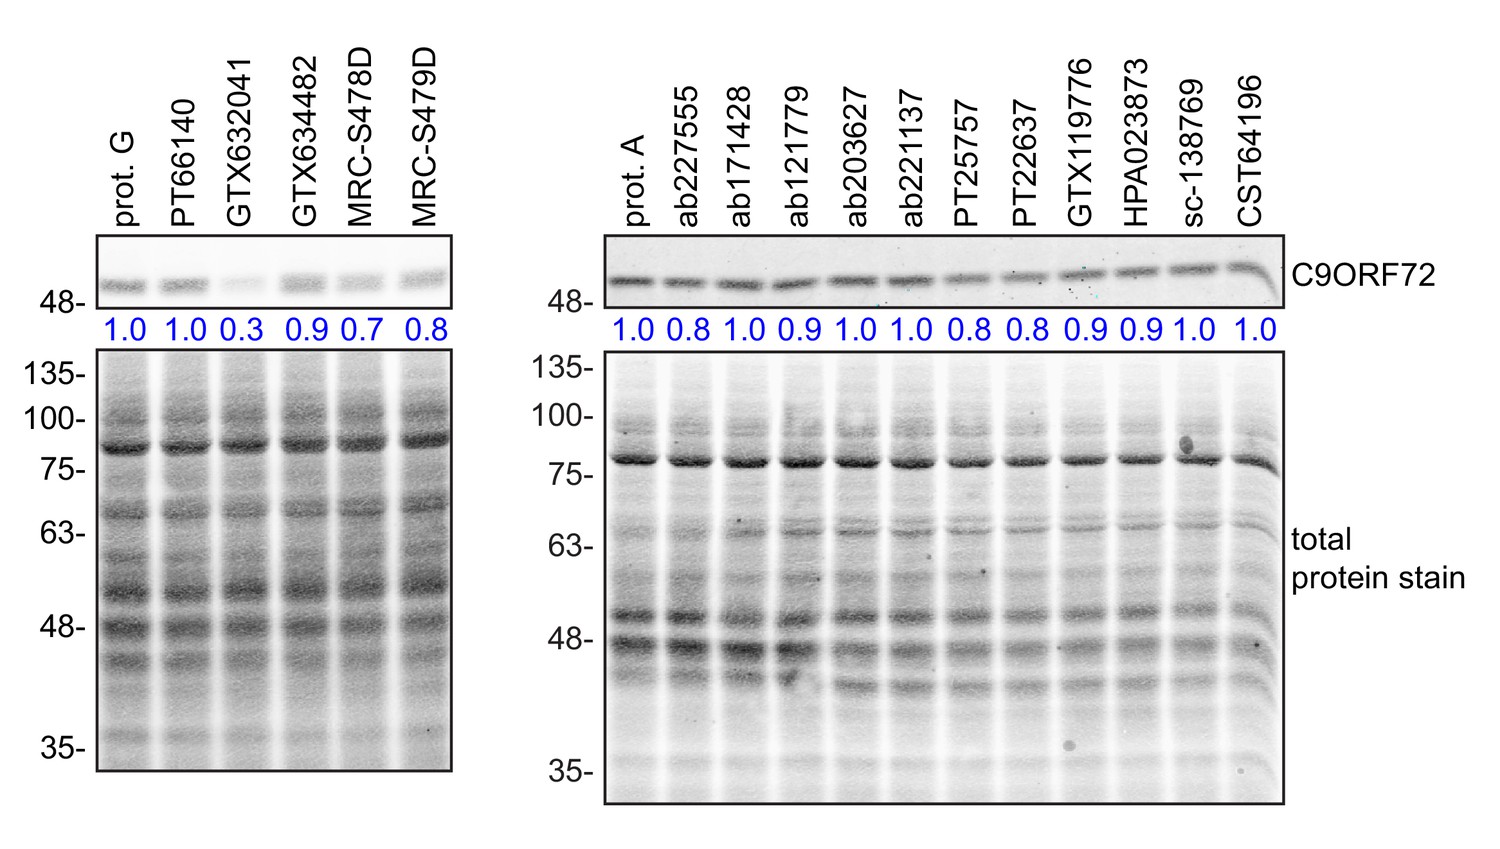
Comparison of the amount of C9ORF72 remaining in the unbound fraction after immunoprecipitation.
HEK-293 cell lysates were prepared and immunoprecipitation was performed using the indicated C9ORF72 antibodies and the appropriate protein A/G-Sepharose (prot. A/G) bead controls. After the O/N incubation period, samples were spun to pellet the bead-antibody conjugates. The supernatant (unbound fraction) were conserved and analyzed by quantitative immunoblot with the C9ORF72 antibody ab221137 (left panel) or GTX634482 (right panel). The C9ORF72 protein signal as a ratio to total protein was determined, normalized to the appropriate prot A/G control, and presented as fold change (blue numbers).
Figure 4 with 3 supplements
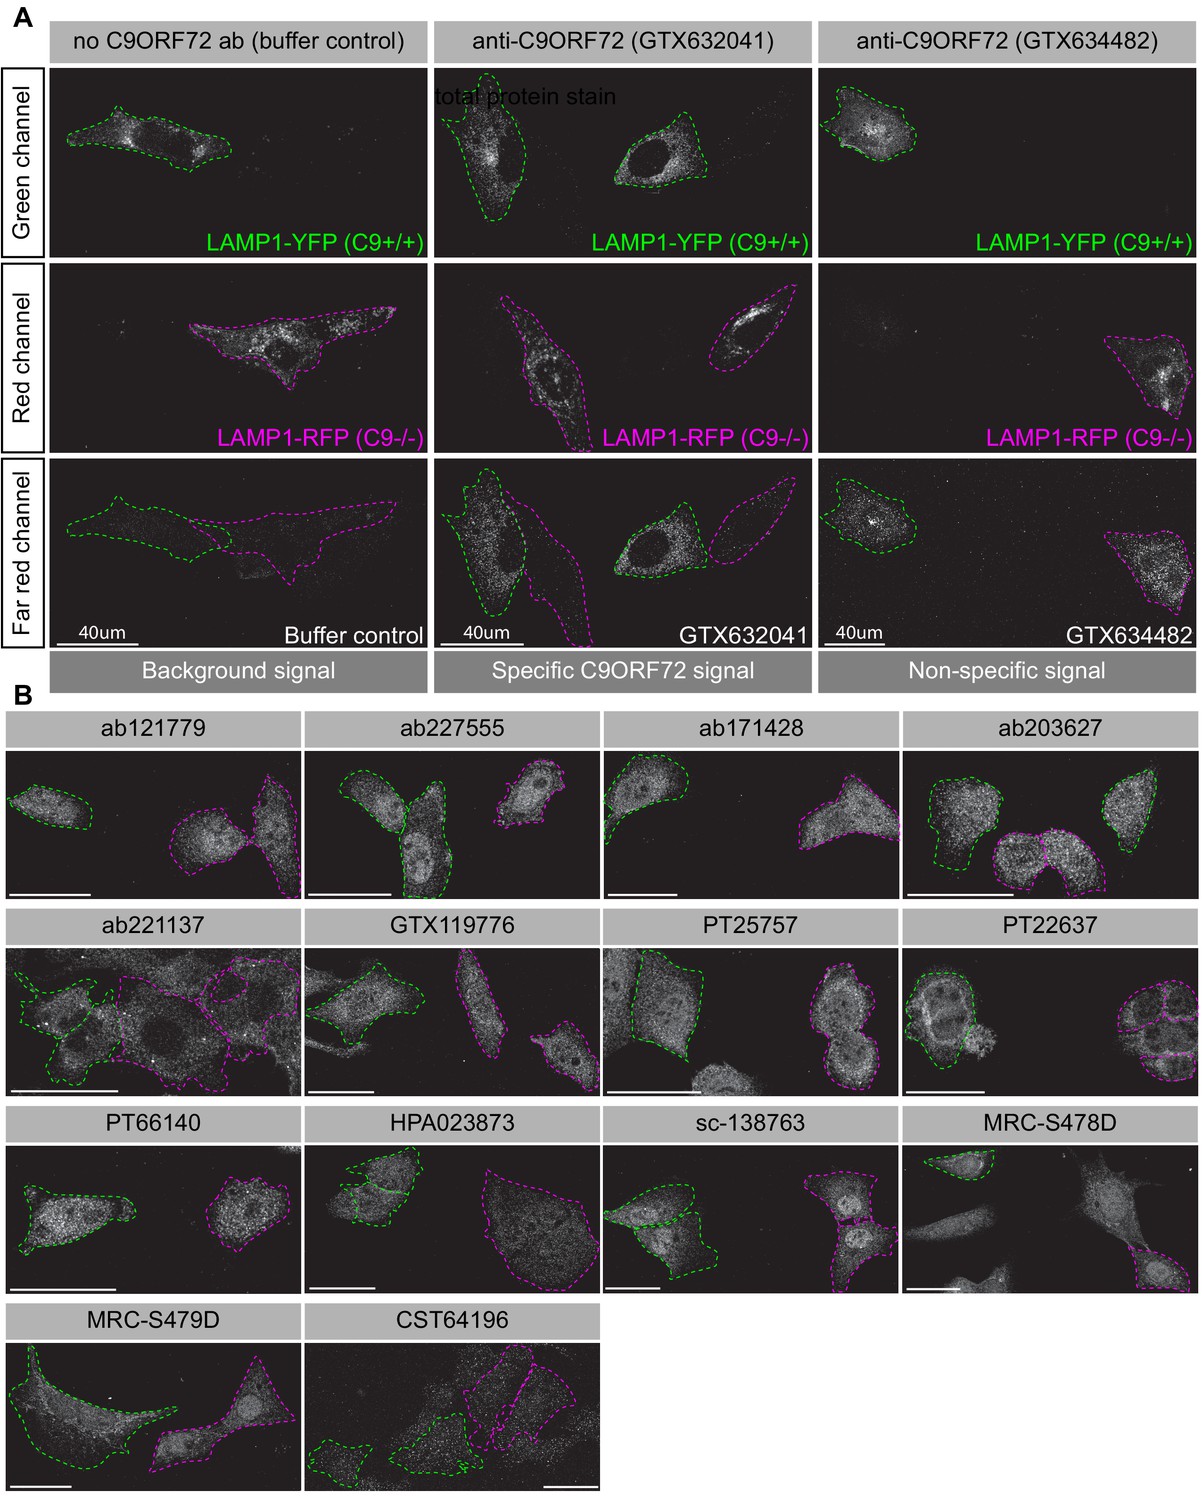
Analysis of 16 C9ORF72 antibodies by immunofluorescence.
(A) Parental and KO cells were transfected with LAMP1-YFP or LAMP1-RFP, respectively. Parental and KO cells were combined and incubated with buffer only or stained with the indicated GeneTex C9ORF72 monoclonal antibodies. Grayscale images of the green, red and far-red channels are shown. Parental and KO cells are outlined with green and red dashed line, respectively. Representative images are shown. Bars = 40 µm. (B) Parental and KO cells were prepared as in (A) and stained with the indicated C9ORF72 antibodies. Grayscale images of the far-red channel are shown. Parental and KO cells are outlined with green and red dashed line, respectively. Representative images are shown. Bars = 40 µm.
Figure 4—figure supplement 1
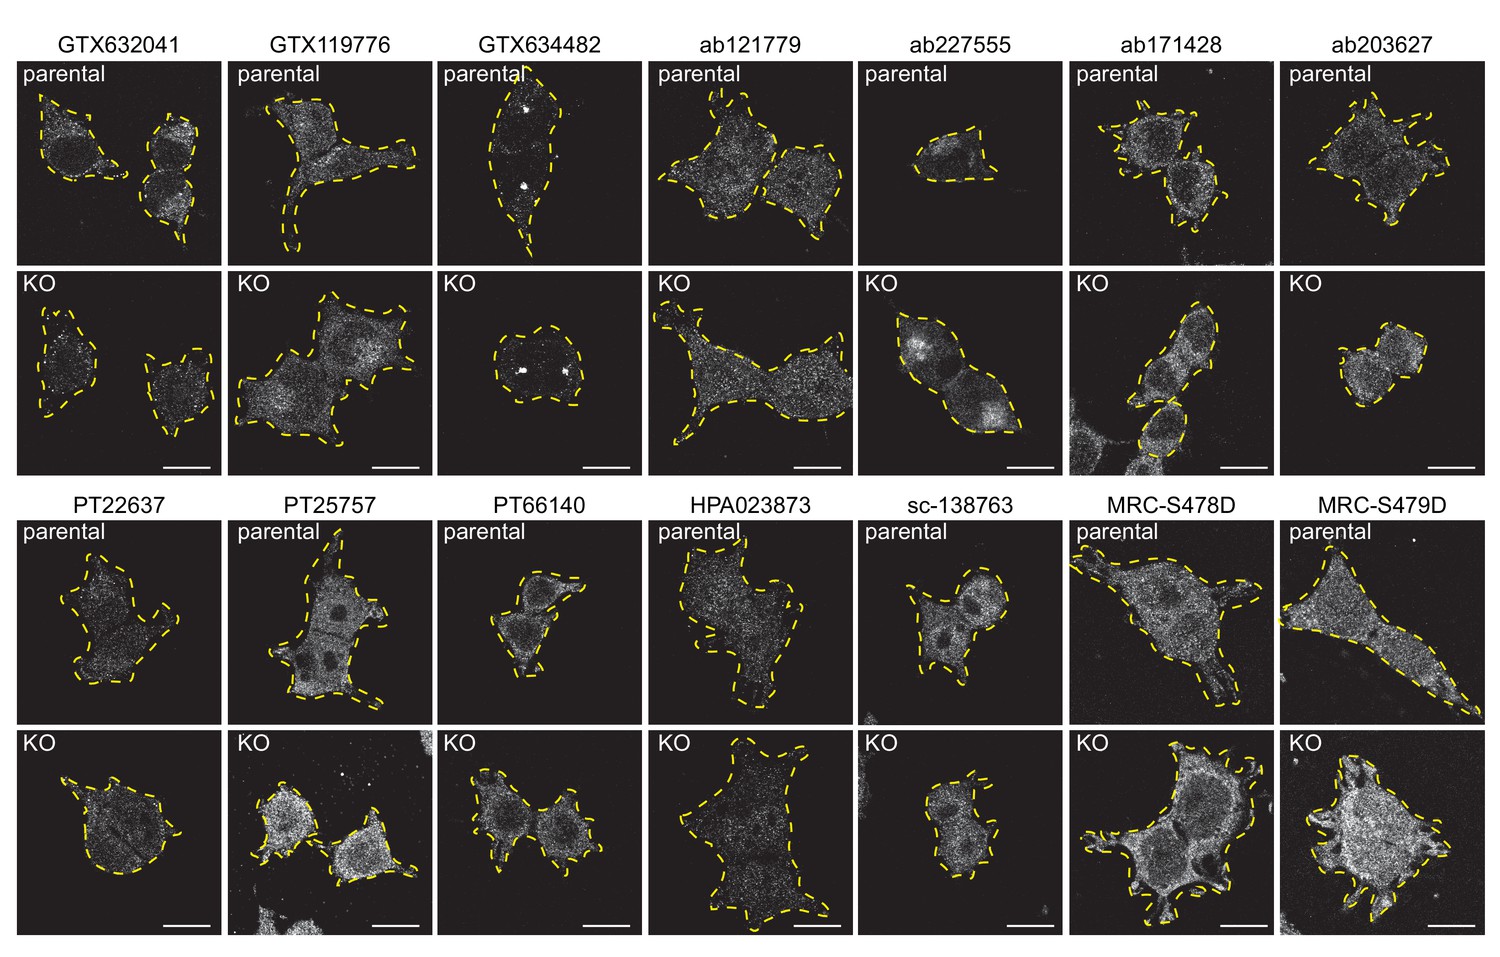
Testing of C9ORF72 antibodies by immunofluorescence analysis in HEK-293 cells fixed with PFA HEK-293 parental and KO cells were fixed with PFA, permeabilized and incubated with the indicated C9ORF72 antibodies.
Representative images are shown. Cells are outlined with yellow dashed lines.
Bars = 16 µm.
Figure 4—figure supplement 2
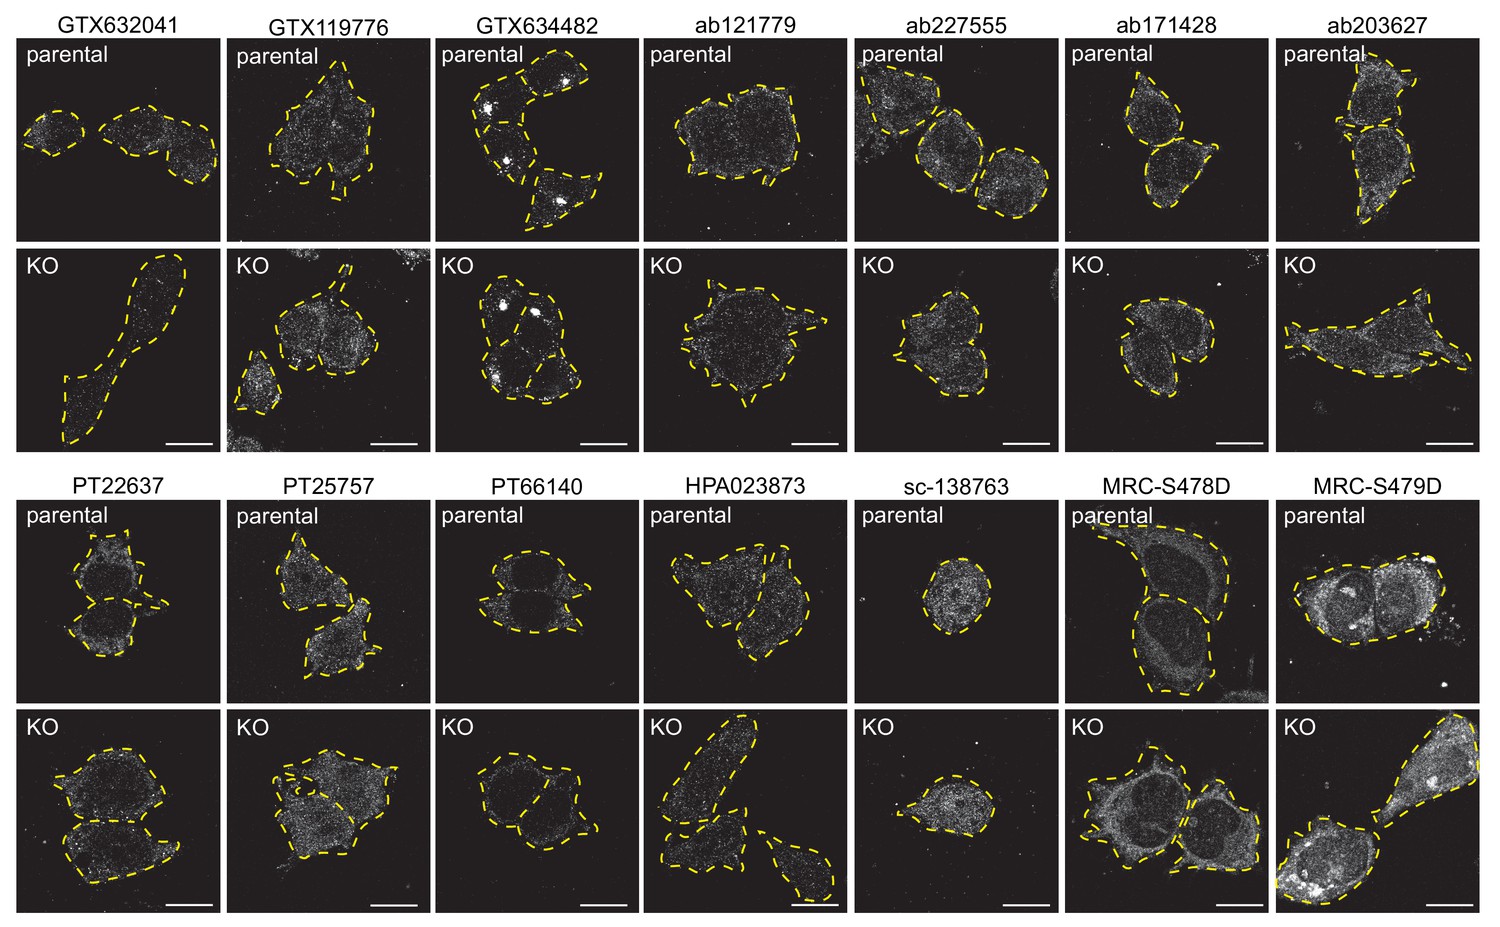
Testing of C9ORF72 antibodies by immunofluorescence analysis in HEK-293 cells fixed with −20°C methanol HEK-293 parental and KO cells were fixed with −20°C methanol and incubated with the indicated C9ORF72 antibodies.
Representative images are shown. Cells are outlined with yellow dashed lines.
Bars = 16 µm.
Figure 4—figure supplement 3
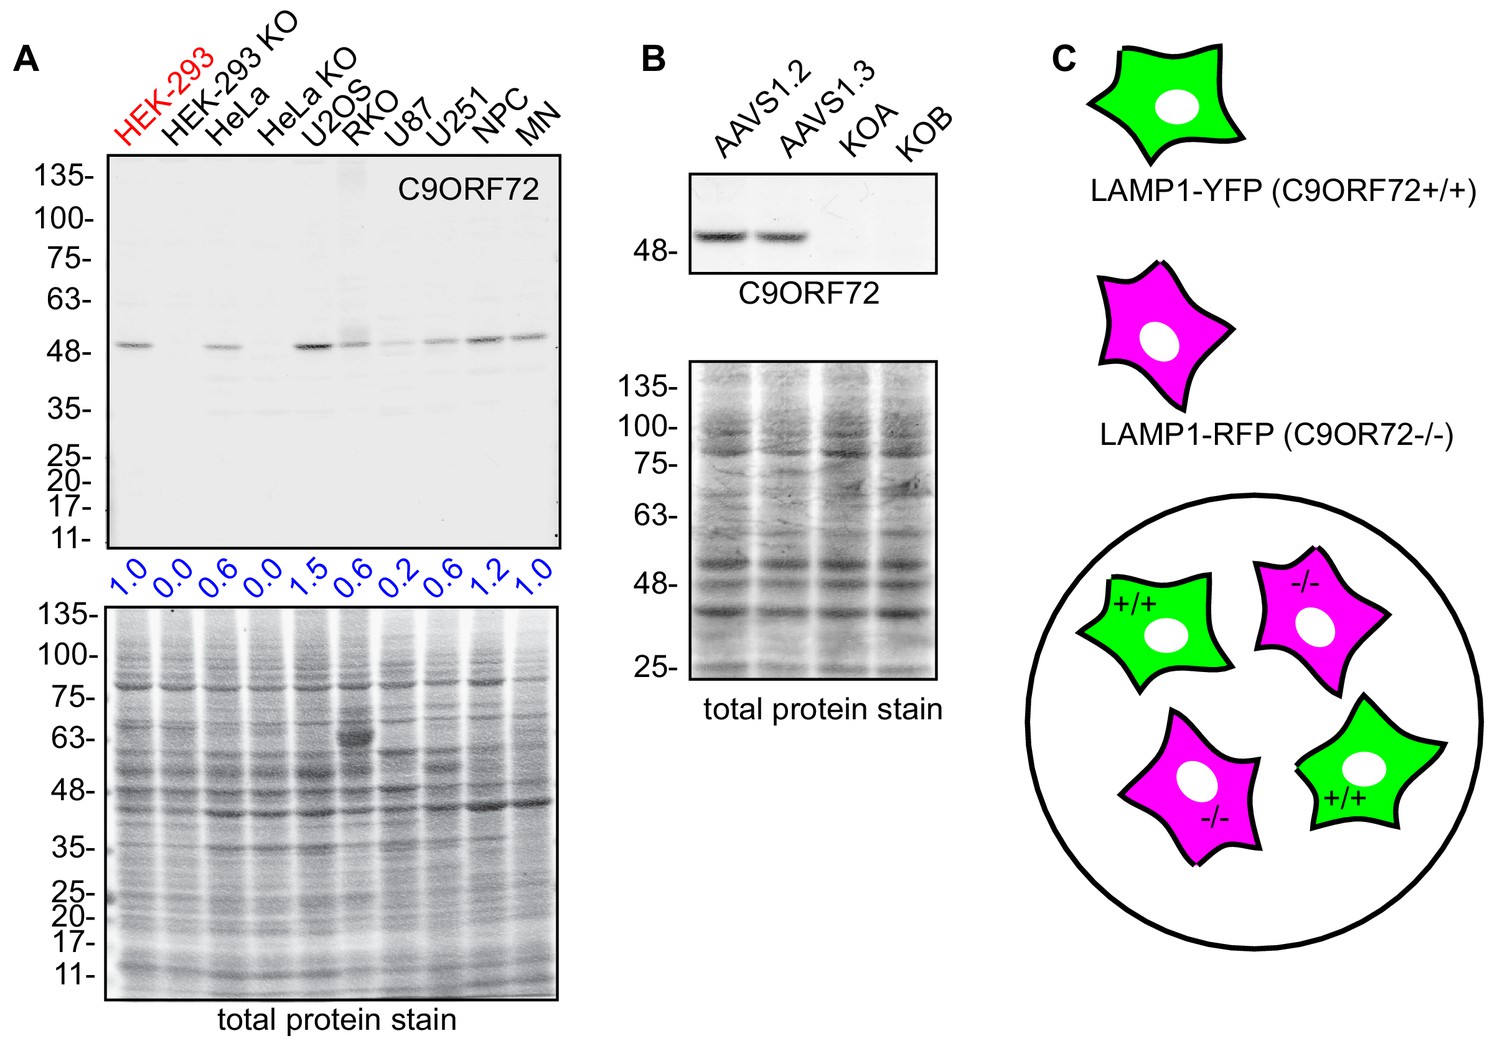
immunofluorescence strategy in U2OS cells.
(A) Lysates were prepared from selective human cell lines and processed for quantitative immunoblot using antibody GTX634482 (HEK, human embryonic kidney; HeLa, human cervical cancer; U2OS, human osteocarcoma; RKO, human colon carcinoma; U87/U251, human glioblastoma; NPC, human neural precursor cells; MN, human motor neurons). The total protein stained transfers are shown as a loading control. The C9ORF72 protein signal as a ratio to total protein was determined, normalized to parental HEK-293 cells (red), and presented as fold change (blue numbers). (B) Cell lysates of parental and KO U2OS cells were analyzed by immunoblot with C9ORF72 antibody GTX634482. (C) Mosaic strategy used to investigate antibody specificity by immunofluorescence.
Figure 5
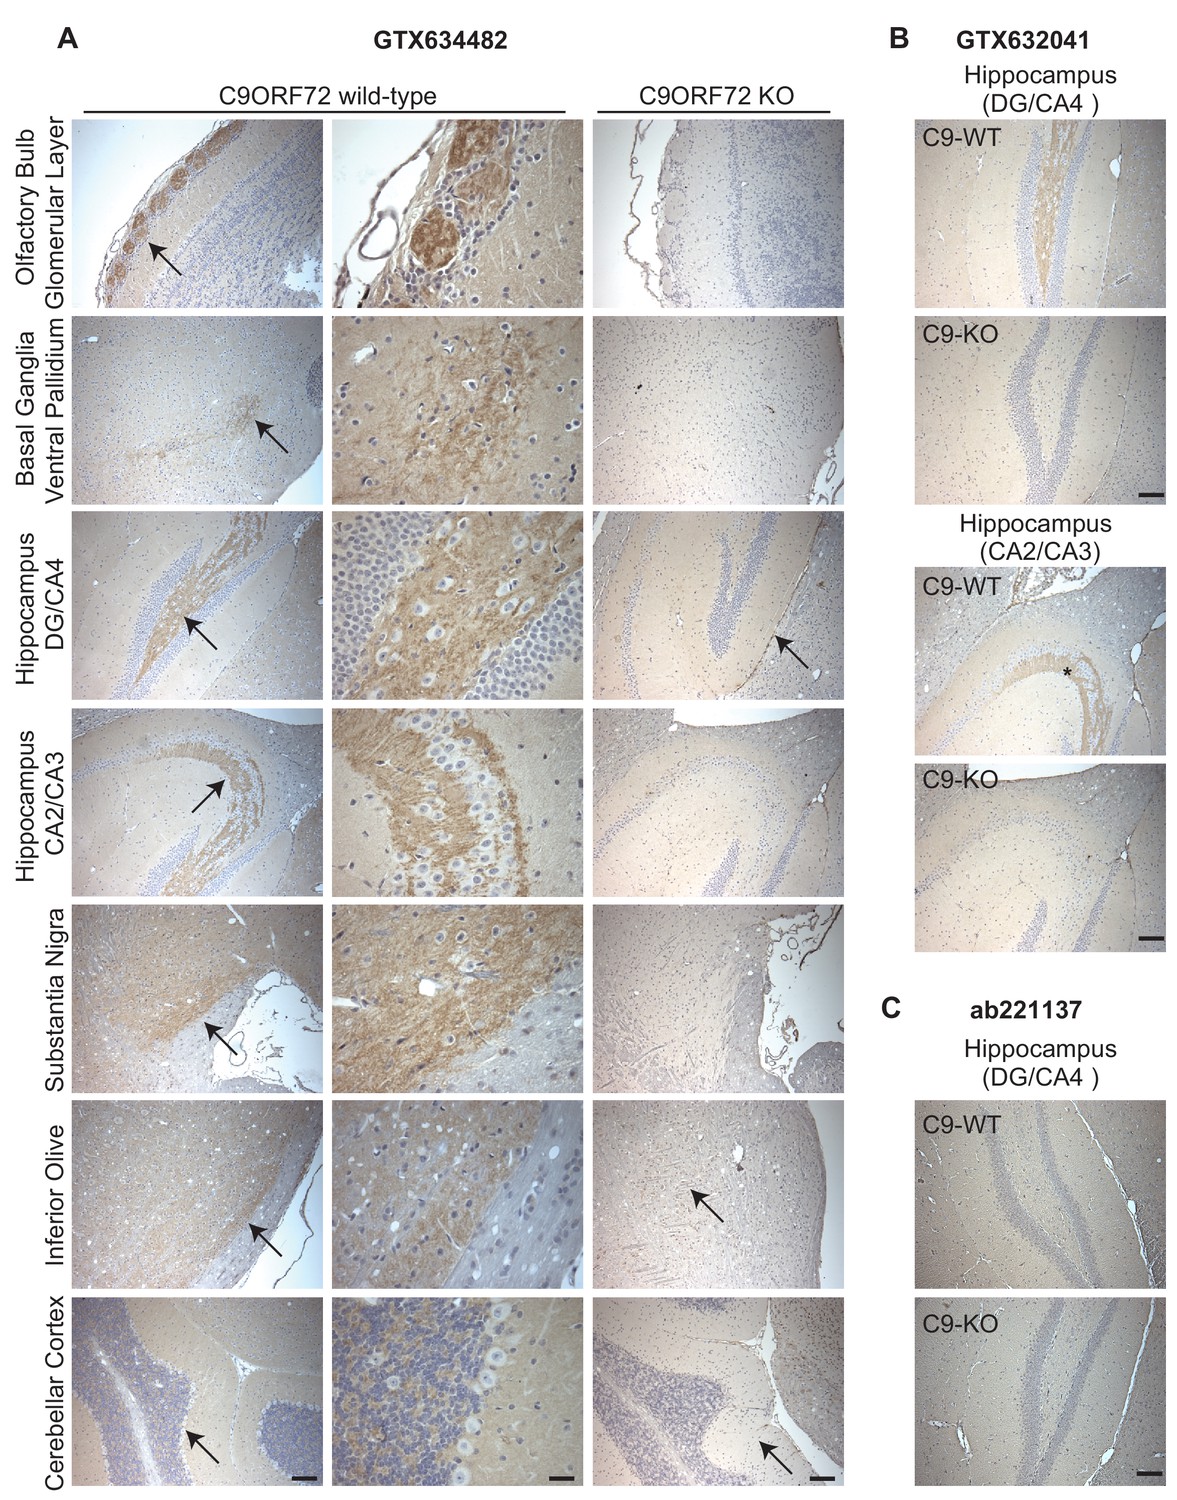
Analysis of C9ORF72 antibodies by immunohistochemistry.
(A) DAB immunohistochemistry of C9ORF72 WT and C9ORF72 KO mouse brains in the sagittal plane using C9ORF72 antibody GTX634482. Micrographs are ordered from the rostral to caudal aspect of the mouse brain. For C9ORF72 WT, arrows indicate areas of increased DAB labeling intensity and correspond to the inset regions in the middle column of images. For C9ORF72 KO (right most column), arrows indicate areas of non-specific labeling. Scale bars = 100 µm or 25 µm for the inset images on the right for the C9ORF72 WT micrographs). (B) DAB immunohistochemistry of C9ORF72 WT and C9ORF72 KO mouse brains in the sagittal plane of the indicated brain regions using C9ORF72 antibody GTX632041. Scale bars = 100 µm. (C) DAB immunohistochemistry of C9ORF72 WT and C9ORF72 KO mouse brains in the sagittal plane of the indicated region using C9ORF72 antibody ab221137. Scale bar = 100 µm.
Figure 6 with 2 supplements
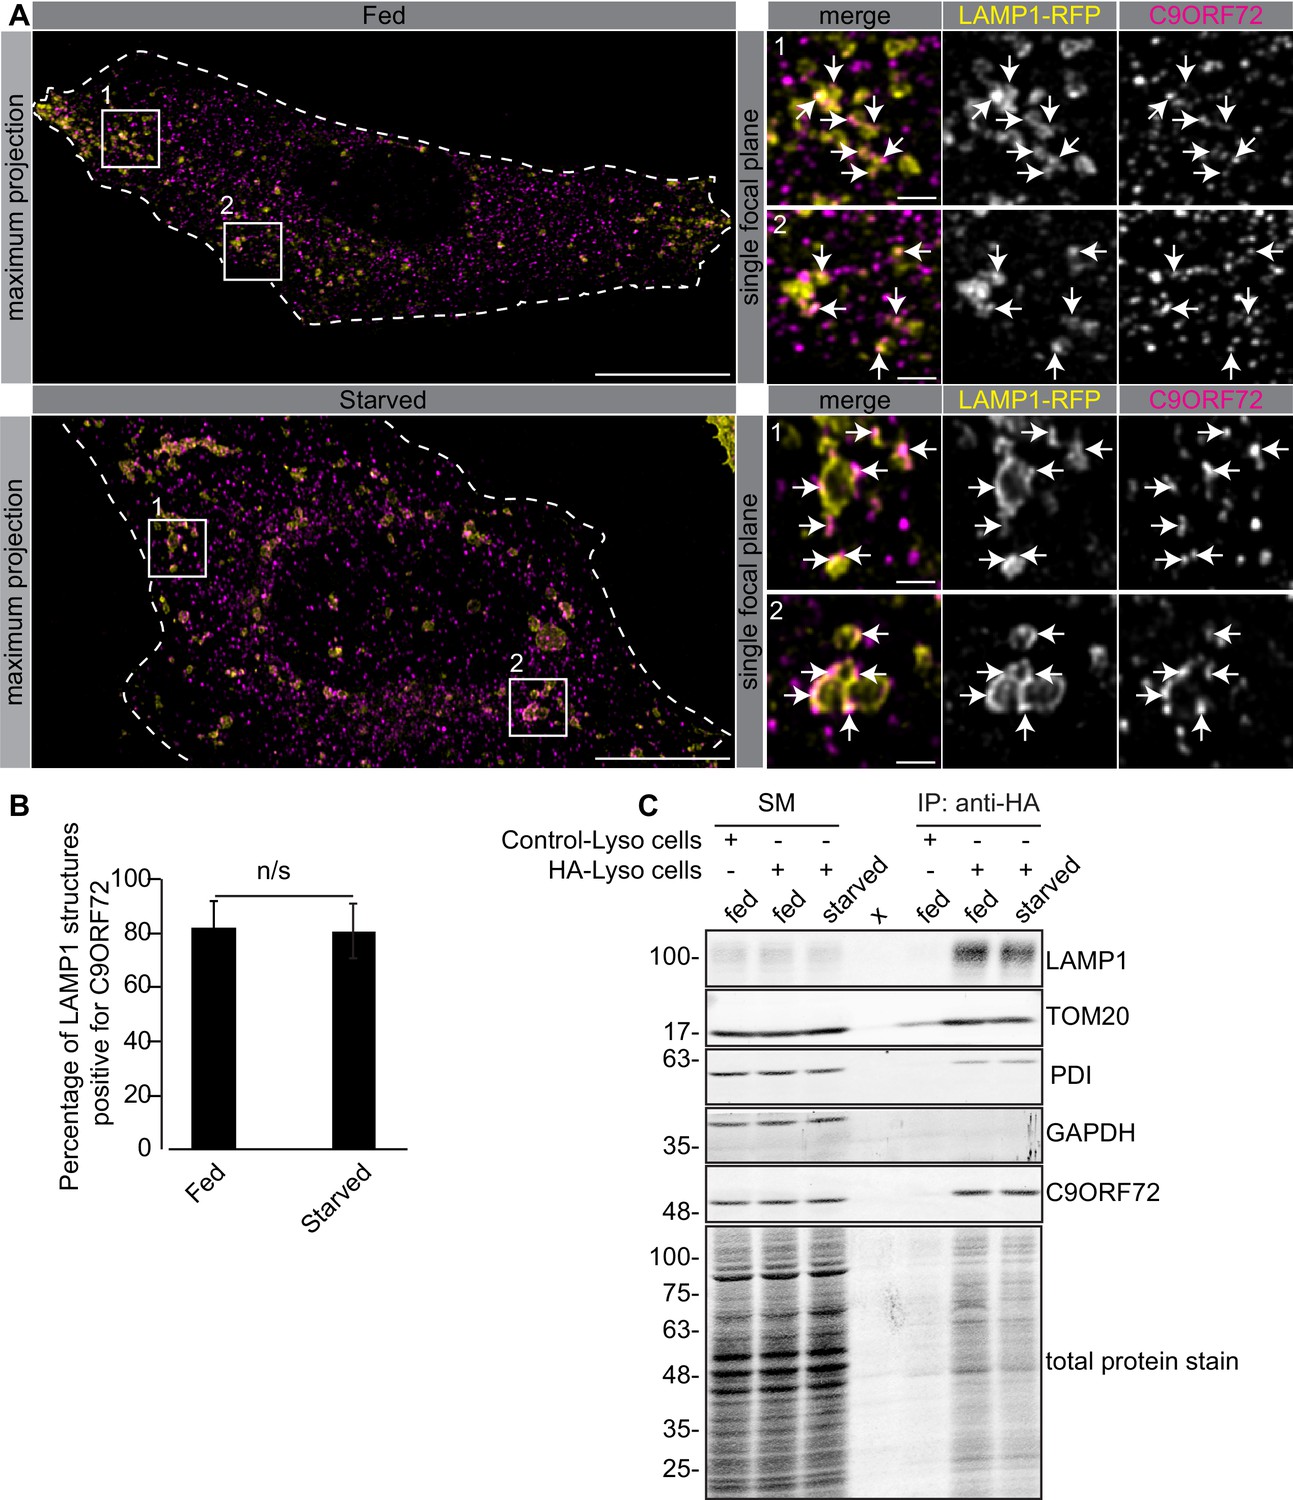
C9ORF72 localizes to lysosomes.
(A) Immunofluorescence of endogenous C9ORF72 stained with GTX632041 in U2OS cells expressing LAMP1-RFP. The large images on the left show a maximum projection to highlight intracellular structures. Insets 1 and 2 are single focal plane, higher magnification images of the boxed regions. Merge and grayscale images of C9ORF72 and LAMP1-RFP are shown. C9ORF72 localization was observed under basal conditions (top panels) or under starvation for 2 hr (bottom panels). Cells are outlined with white dashed lines. Scale bars = 20 µm for large images and 2 µm for insets. (B) Quantification of LAMP1 structures positive for C9ORF72 in basal growing condition (fed) or 2 hr starved condition (starved) in U2OS cells. Between 228–262 lysosomes were counted from at least nine different cells from three independent experiments. A Student’s t-test reveals that the percentage of LAMP1 structures positive for C9ORF72 is not significantly different between the fed and starved conditions (C) Lysates were prepared from HEK-293 cells expressing the Tmem192-3xHA (HA-Lyso cells) or the Tmem192-2xFlag (Control-Lyso cells). Lysosomes were immunoprecipitated using anti-HA magnetic beads. Quantitative immunoblotting for the indicated proteins was performed for starting material (SM), purified lysosomes and control immunoprecipitates (anti-HA IP). C9ORF72 was detected using GTX634482.
Figure 6—figure supplement 1
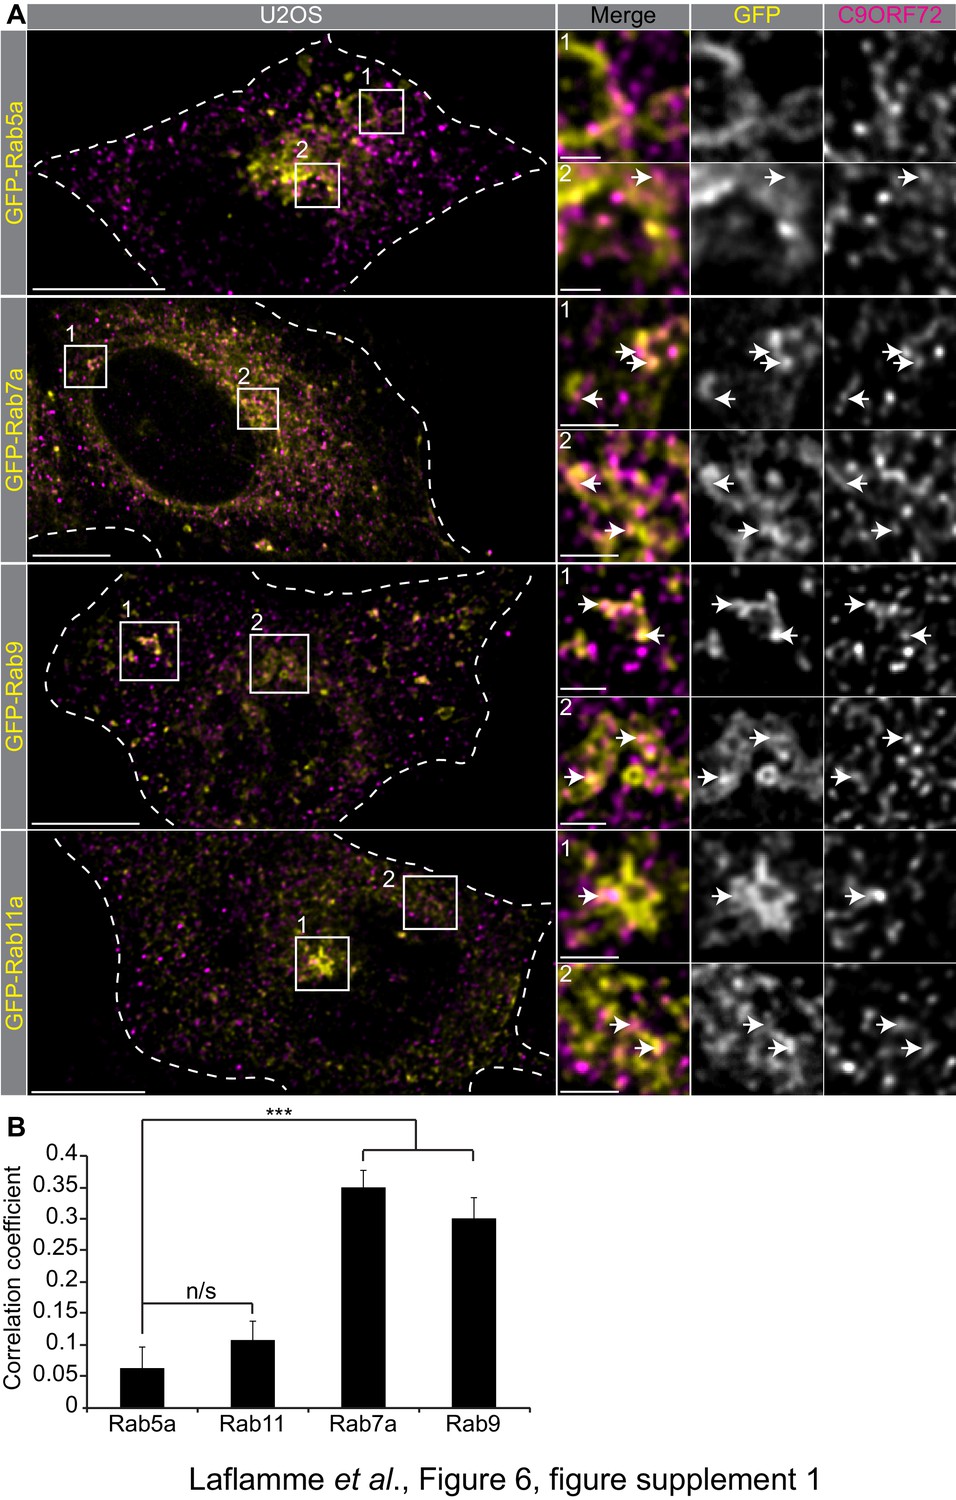
C9ORF72 co-staining with Rab.
GTPases Immunofluorescence of endogenous C9ORF72 stained with GTX632041 in U2OS cells expressing GFP-Rab5a, GFP-Rab7a, GFP-Rab9 and GFP-Rab11a as indicated. Insets are higher magnifications of the boxed regions. Merge and grayscale images of C9ORF72 and GFP-Rabs are shown. All images are the result of LIGHTNING applied to the confocal image. Cells are outlined with white dashed lines. For full-sized cells the bars = 10 µm, for insets the bars = 2 µm. White arrows point toward close proximity between the marker and C9ORF72. (B) Pearson’s correlation coefficient of C9ORF72 stained with GTX632041 and GFP-Rab5a, GFP-Rab11a, GFP-Rab7a and GFP-Rab9 in U2OS cells. Between 8 and 12 regions of interest were analyzed from at least five different cells for each construct. A Student’s t-test reveals that the means of the correlation coefficient between Rab5 and the other tested Rab is significantly different. ***=p value<0.01.
Figure 6—figure supplement 2
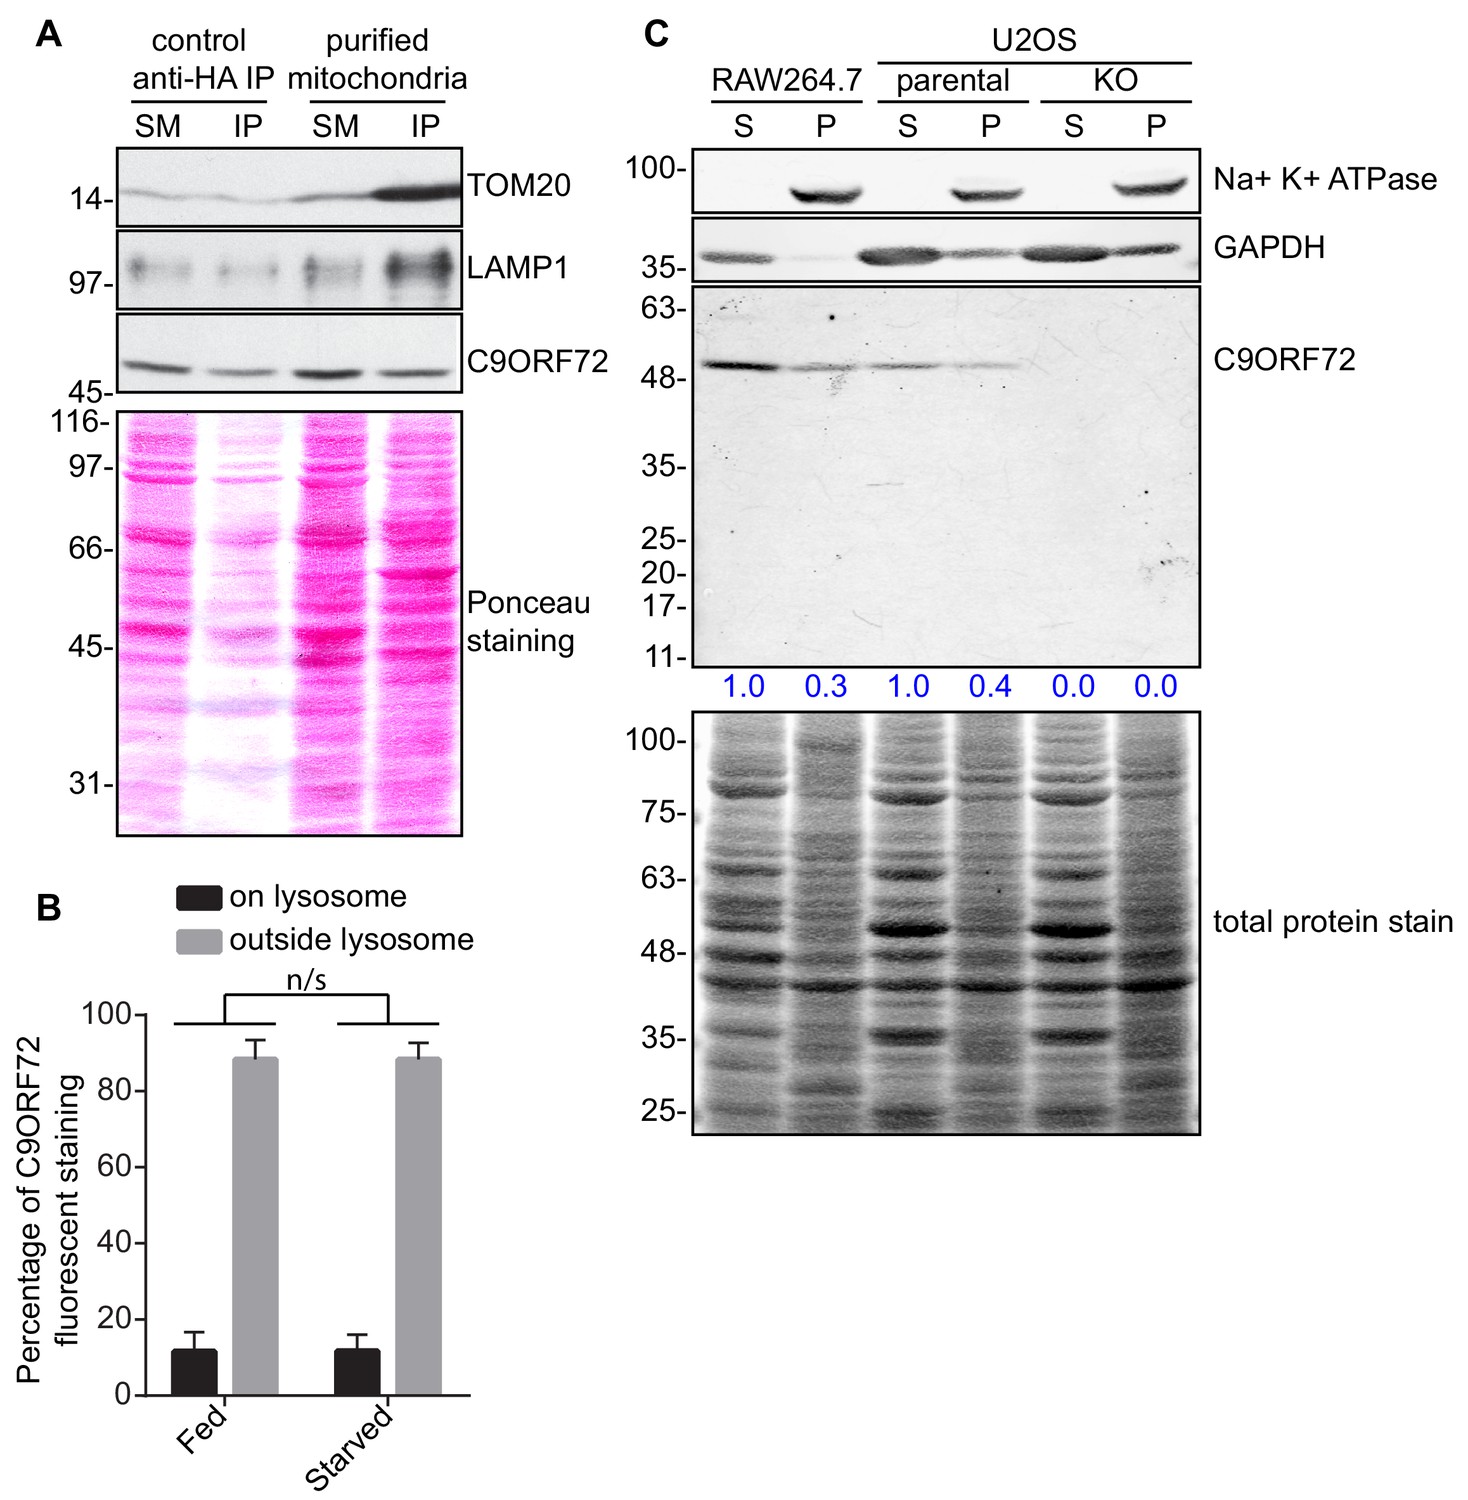
C9ORF72 subcellular fractionation.
(A) Lysates were prepared from HEK-293 cells non-transfected or expressing 3xHA-eGFP-OMP25 (MitoIP). Lysates were incubated with anti-HA magnetic beads to immunoprecipitate mitochondria. Immunoblotting for the indicated proteins was performed for starting material (SM), purified mitochondria and control immunoprecipitates (anti-HA IP). (B) Quantification of C9ORF72 fluorescent signal on LAMP1 structures or outside LAMP1 structures in basal growing condition (fed) or following 2 hr starvation (starved) in U2OS cells. The C9ORF72 fluorescent signal was quantified in nine individual cells for both conditions from three independent experiments. A Student’s t-test reveals that the C9ORF72 pool between fed and starved condition is not significantly different. (C) RAW264.7 cells treated with 1 µg/ml LPS and both parental and C9ORF72 KO U2OS cells were lysed in 20 mM HEPEs pH 7.4 without detergent. Lysates were spun at 200 000 g for 30 min. Supernatant (S) was collected and the pellet (P) was resuspended and conserved. The S and P fractions for each cell line were analyzed by quantitative immunoblot using GTX634482. The C9ORF72 protein signal in both the S and P fraction was determined, normalized to total protein, and presented as percentage (blue numbers) of the total S + P C9ORF72 signal for each cell line.
Figure 7

Macrophages express C9ORF72 at high levels.
(A) Lysates were prepared from rat cortical neurons, rat hippocampal neurons, mouse bone marrow-derived macrophages (BMDMs) and mouse whole brain, and processed for quantitative immunoblot using antibody GTX634482 with the LI-COR Odyssey Imaging System that utilizes fluorescent secondary antibodies to allow for quantitative blots. The total protein stained transfers are shown as a loading control. The C9ORF72 protein signal as a ratio to total protein was determined, normalized to parental HEK-293 cells (red), and presented as fold change (blue numbers). C9ORF72 KO mouse brain (KO) was included as a specificity control. (B) Lysates were prepared from human monocyte-derived macrophages (MDMs) treated with either IFN-γ and LPS or with TGF-β. Immunoblot and C9ORF72 quantification were performed as in (A).
Figure 8
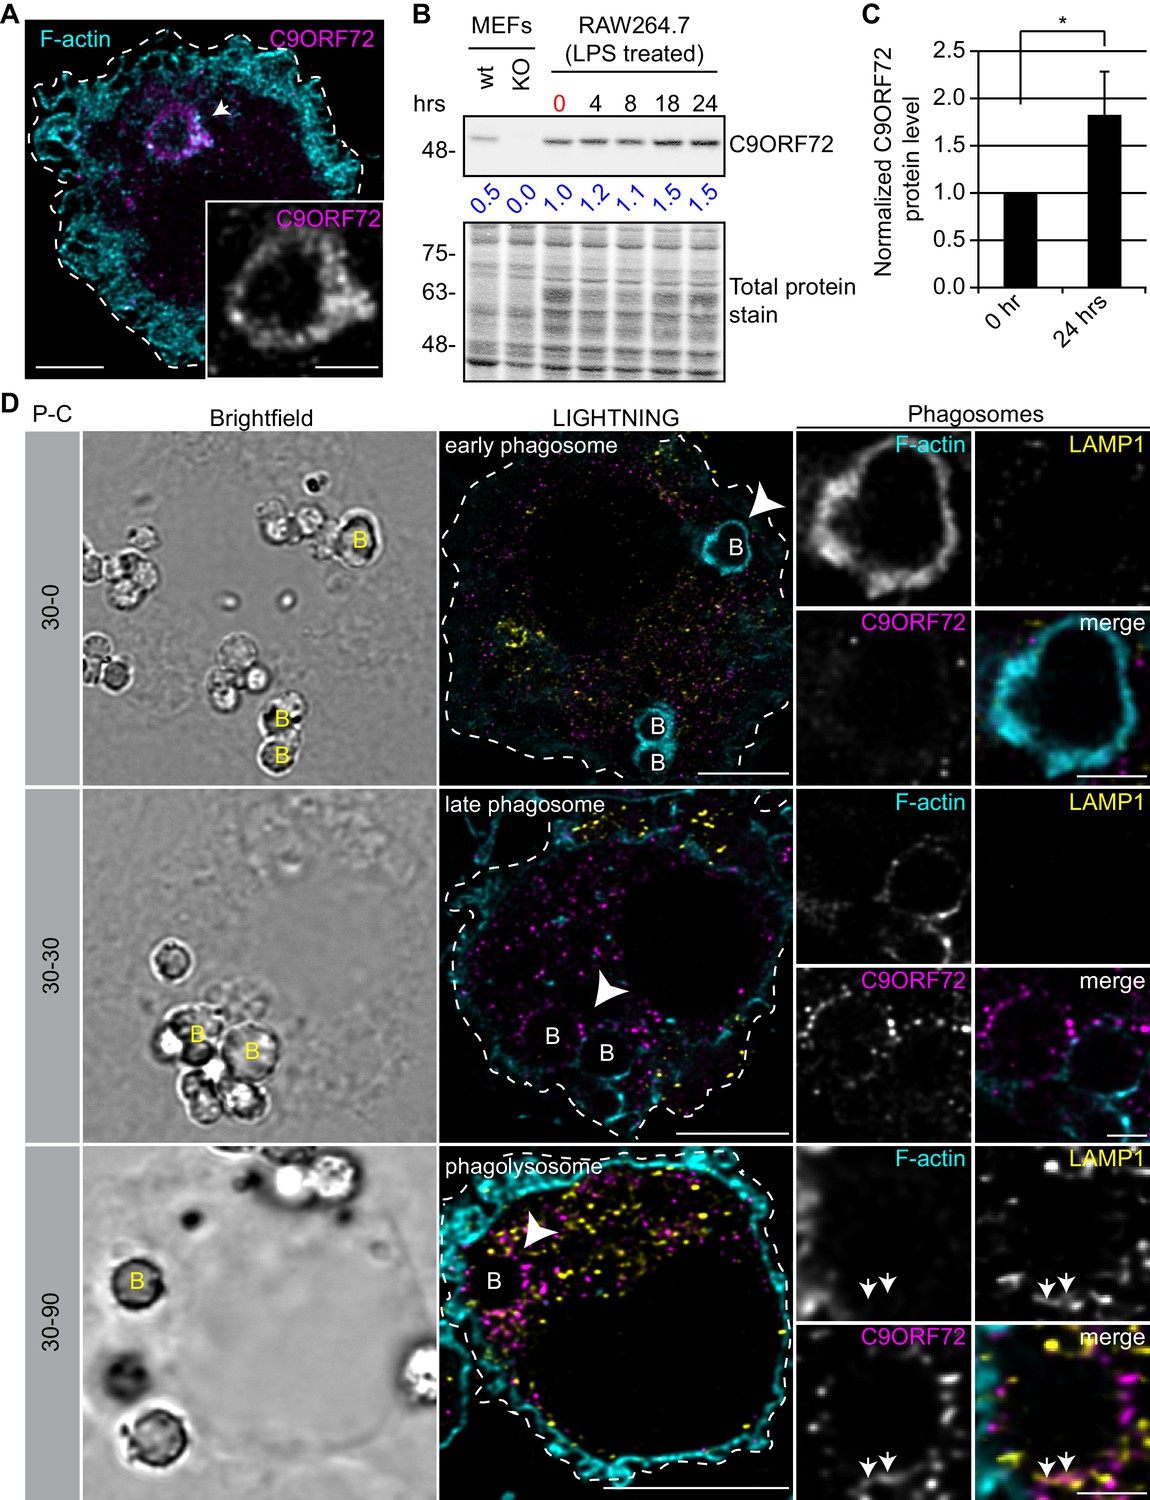
C9ORF72 localizes in part to late phagosomes and phagolysosomes.
(A) Immunofluorescence of C9ORF72 (GTX632041, magenta) and F-actin staining (cyan) in human MDMs. The inset is a higher magnification of the region indicated by the arrow and shows a grayscale image of C9ORF72. Cell is outlined with a white dashed line. Scale bar = 5 µm (full size) and 2 µm (inset). (B) Quantitative immunoblot of RAW264.7 cell lysates treated with 1 µg/ml LPS for the indicated time points. The total protein stained transfer is shown as loading control. C9ORF72 is detected using GTX634482. The C9ORF72 protein signal as a ratio to total protein was determined, normalized to RAW264.7 lysates at time 0 (red), and presented as fold change (blue numbers). C9ORF72 KO MEFs are included as a specificity control. (C) Quantification of C9ORF72 intensity from immunoblots performed as in (B) at 0 hr and 24 hr time points, presented as normalized values. Four individual experiments were quantified. *=p value<0.05 (D) Pulse-chase (P–C) experiments in LPS-treated RAW264.7 cells using phagocytosed beads. Beads were incubated for a 30 min pulse followed by a 0 min (30-0), 30 min (30-30) or 90 min (30-90) chase. Brightfield imaging reveals the phagocytosed beads. Staining of C9ORF72 (GTX632041; magenta), LAMP1 (yellow) and F-actin (cyan) were performed and imaged using confocal microscopy together with LIGHTNING image processing as described previously. Single focal plane images are shown. Insets are higher magnification views of the internalized beads indicated with arrowheads in the large images and show the merged channel together with grayscale images of F-actin, LAMP1 and C9ORF72. White arrows point toward C9ORF72 and LAMP1 co-localization. All images are the result of LIGHTNING applied to the confocal image. Cells are outlined with white dashed lines. Scale bar = 8 µm (full size) and 2 µm (inset).
Additional files
-
Supplementary file 1
Summary of C9ORF72 antibodies and their properties.
- https://doi.org/10.7554/eLife.48363.017
-
Supplementary file 2
Mass spectrometry data from immunoprecipitation of C9ORF72 from parental and KO cell lines.
- https://doi.org/10.7554/eLife.48363.018
-
Transparent reporting form
- https://doi.org/10.7554/eLife.48363.019
Download links
A two-part list of links to download the article, or parts of the article, in various formats.
Downloads (link to download the article as PDF)
Open citations (links to open the citations from this article in various online reference manager services)
Cite this article (links to download the citations from this article in formats compatible with various reference manager tools)
Implementation of an antibody characterization procedure and application to the major ALS/FTD disease gene C9ORF72
eLife 8:e48363.
https://doi.org/10.7554/eLife.48363


