Differential contributions of the two human cerebral hemispheres to action timing
- Goethe University, Germany
- Johannes Gutenberg University, Germany
Figures
Figure 1
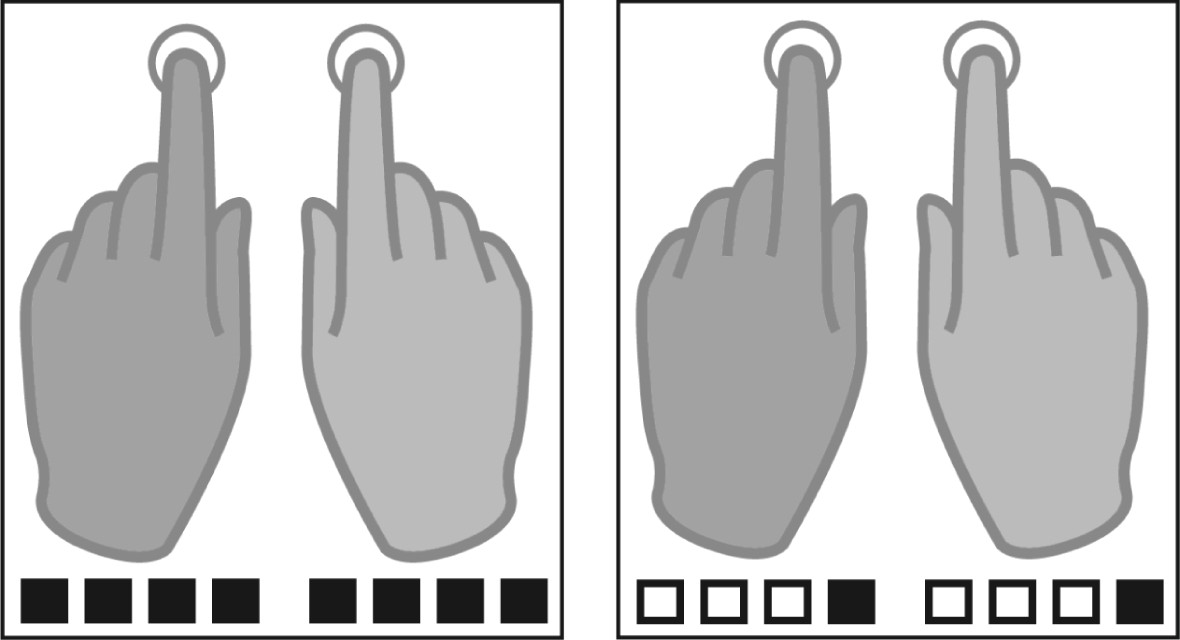
Tapping conditions.
Participants were instructed to tap either to every beat (fast tapping, left panel) or to the fourth position of four consequent auditory beats (slow condition, right panel). Filled squares represent tapping events, white squares represent auditory beats without tapping in the slow tapping condition.
Figure 2
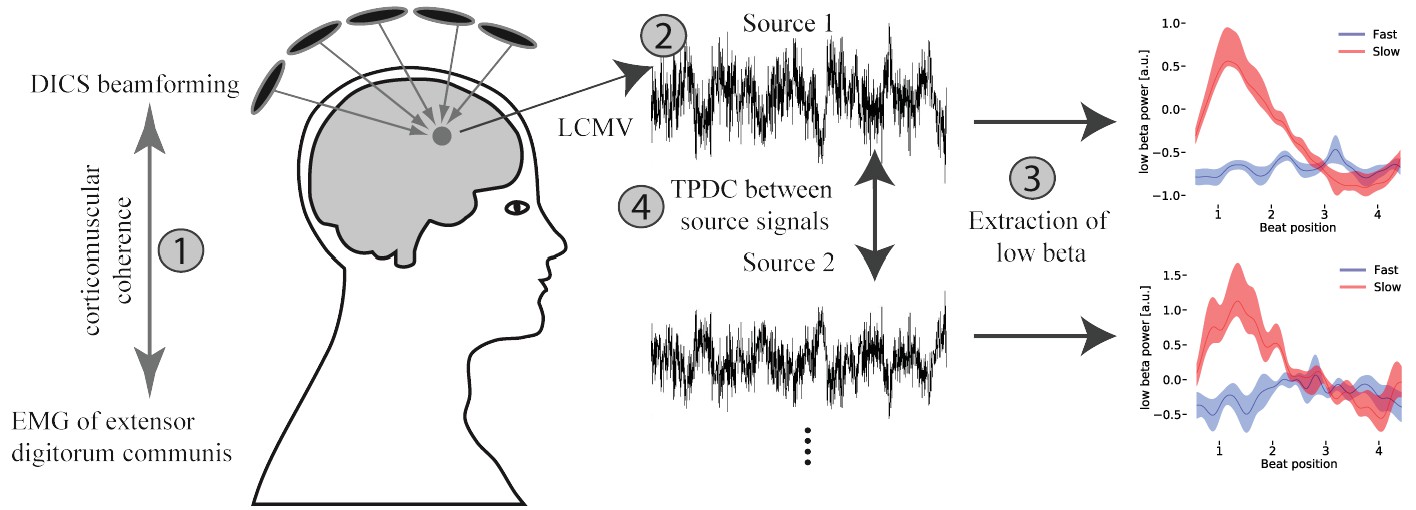
Overview of the applied MEG analysis steps.
(1) Coherent sources with the EMG signal were detected at fast tapping frequency using a DICS beamformer. (2) Timeseries were extracted from the localized sources using an LCMV beamformer. (3) A sliding window time-frequency analysis was applied to transform these signals into a time-frequency-representation. By averaging over frequencies (14–20 Hz) a low beta band signal was extracted. (4) Source signals were fed into a time and frequency resolved directed connectivity analysis (TPDC).
Figure 3

Asymmetries in performance.
Timing variability is defined as standard deviation of the absolute distance between the actual and target inter-tap-intervals (Pflug et al., 2017). Smaller values are associated with better performance. Error bars represent the within subject standard error of the mean. While the right hand taps more precisely in fast tapping, the left hand demonstrates lower timing variability in the slow tapping condition. The interaction between hand and condition is significant at p = 0.003. Note the overall higher precision in fast compared to slow tapping (differently scaled y-axes; Repp, 2005).
-
Figure 3—source data 1
Source-data contains for each participant the timing variability for each hand (right and left) and each condition (slow and fast tapping).
- https://doi.org/10.7554/eLife.48404.006
Figure 4
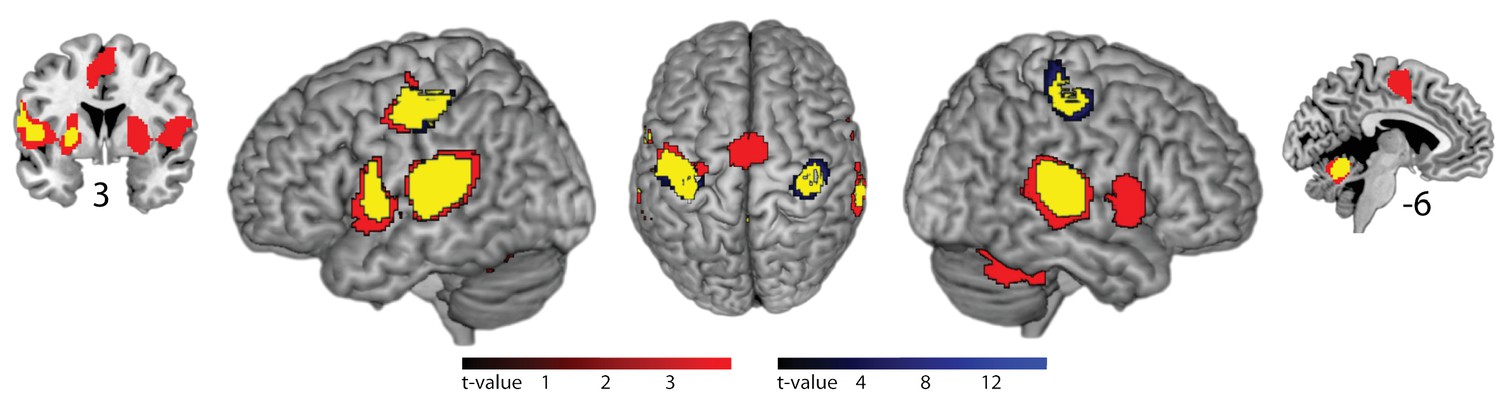
Brain areas activated by rhythmic finger tapping.
Red: BOLD activation associated with slow tapping (p<0.05, FWE cluster-level corrected). Blue: BOLD activation associated with fast tapping (p<0.05, FWE cluster-level corrected). Yellow: Overlap of activity associated with slow and fast tapping. 3 and −6 indicate coronal and sagittal coordinates, respectively.
Figure 5

Effects of internal generation of a slow rhythm.
BOLD activation for slow compared to fast tapping (p<0.05, FWE cluster-level corrected). Activity in the auditory association cortex is right-lateralized at p<0.001.
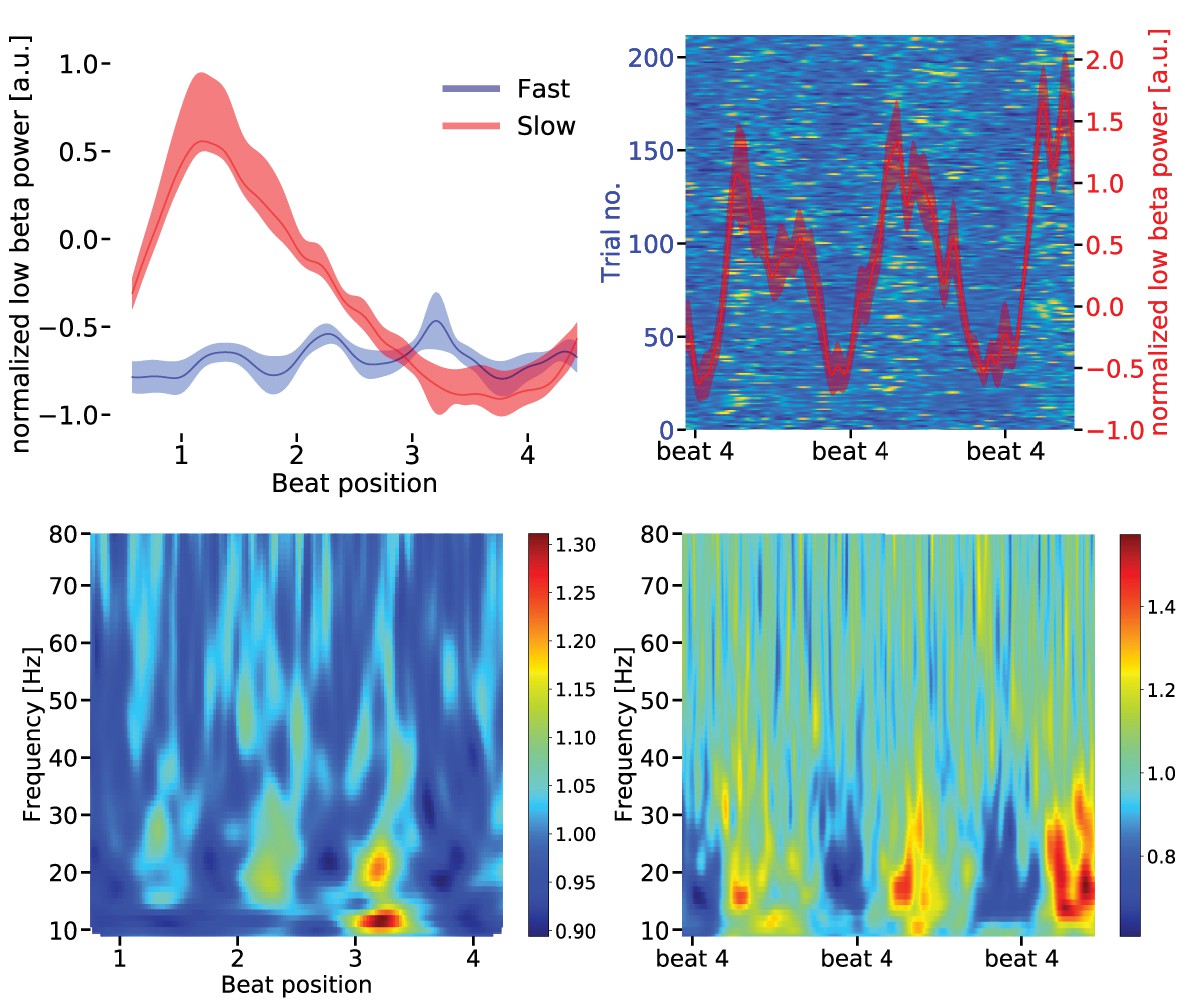
Figure 6

Upper panels: Low beta band (14–20 Hz normalized to mean over conditions) power modulation in the left (upper left panel) and right (upper right panel) auditory association cortex (A2) for slow (red) and fast (blue) tapping.
One sequence of four auditory beats is illustrated. There was a stronger representation of the fast auditory beat frequency in the left compared to the right auditory association cortex during slow finger tapping (for statistics in the spectral domain, please see main text). Data are aligned to the tap at beat position four. Note the different scales for the beta power in left and right auditory association cortex. Shaded error bars represent the standard error of the mean (SEM). Lower panels: The background illustrates the low beta power in single slow tapping trials. Two sequences of four auditory beats with taps at beat position four are illustrated. Red curves represent mean low beta power ± SEM. Data are aligned to the right beat four in the panels.
Figure 7
Upper left panel: Low beta band [14–20 Hz] power modulation in the supplementary motor area (SMA) for slow and fast tapping (mean over sequences).
During fast tapping (blue) the low beta power is modulated by the fast tapping rate while during slow tapping (red) there is a temporal modulation by the slow tapping rate (linear beta power decrease). Data are aligned to tap at beat position four. Shaded error bars indicate the standard error of the mean (SEM). For statistics in the spectral domain, please see main text. Upper right panel: The background illustrates the low beta power in single slow tapping trials. Two sequences of four auditory beats with taps at beat position four are illustrated. Data are aligned to the tap at the right beat position four in the panels. Same scale as in Figure 6. Red curves represent mean low beta power ± SEM. Lower panels: Time frequency representation of the SMA source signal during fast (left panel) and slow tapping (right panel).
Figure 8
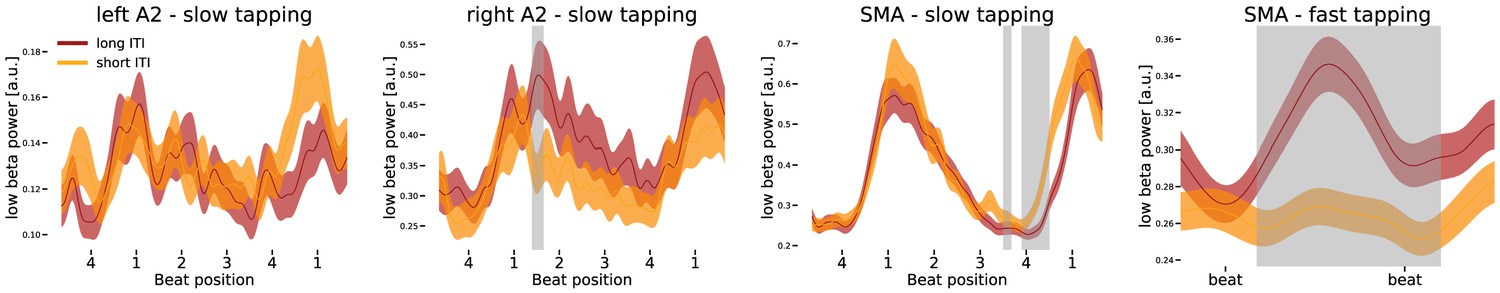
Differences in low beta power modulation between too short and too long inter-tap-intervals (ITI).
Sequences of four auditory beats with taps at beat four were aligned at the left tap in the first three panels. While the first three panels illustrate effects during slow tapping, the right panel illustrates low beta power in the supplementary motor area (SMA) during fast tapping (data left aligned). Significant differences between too long and too short sequences were marked in grey. Only low beta power in the right auditory association cortex (A2) and in the SMA predicted performance during slow tapping. Low beta amplitude coded the ITI during fast tapping in the SMA. Note the different scales in the panels.
Figure 9
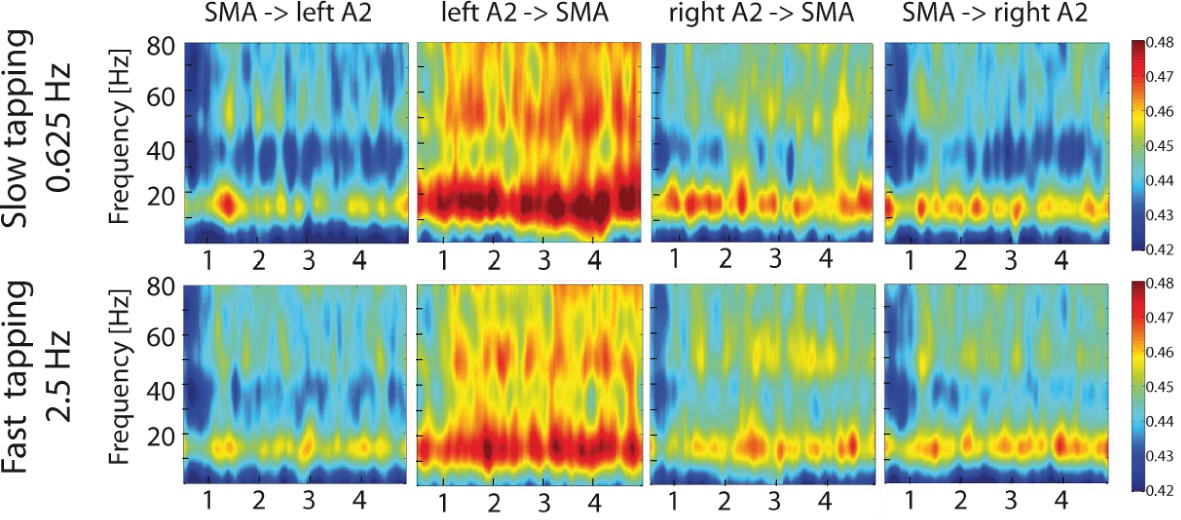
Time-resolved partial-directed coherence (TPDC) during slow (upper panels) and fast tapping (lower panels).
TPDC was particularly strong in the low beta and the low gamma band. Note the overall increased connectivity strength between the left auditory association cortex and the SMA compared to the other connections. SMA: supplementary motor area. A2: Auditory association cortex.
Figure 10
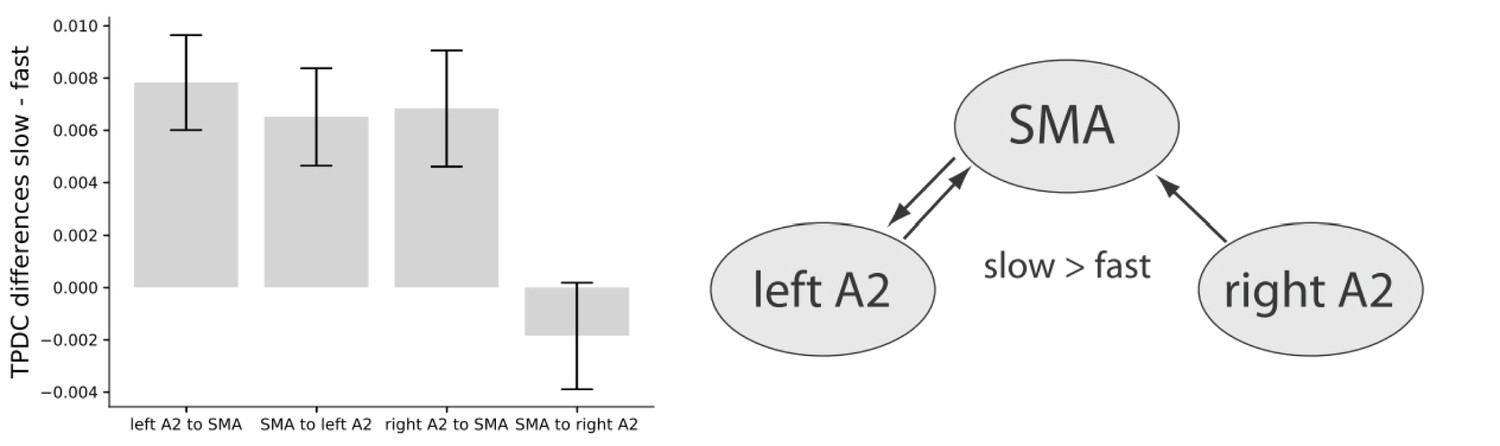
Left panel: Condition differences between slow and fast tapping in low beta band [14–20 Hz] effective connectivity.
Right panel: Connections with increased low beta band interactions (p<0.05) during slow compared to fast tapping. SMA: supplementary motor area. A2: Auditory association cortex. TPDC: Time-resolved partia-directed coherence.
-
Figure 10—source data 1
Source-data contains for each participant the mean low beta connectivity from the TPDC for the four connections (right A2 to SMA, SMA to right A2, left A2 to SMA and SMA to left A2).
- https://doi.org/10.7554/eLife.48404.016
Tables
Table 1
FMRI effects of Slow Rhythm Generation (slow > fast).
BA, Brodmann area; L, left hemisphere; R, right hemisphere.
| Anatomical region | Cluster p-value | Cluster size | Local maxima | BA | Peak MNI-coordinates (x,y,z) |
|---|---|---|---|---|---|
| Frontal | 0.000 | 1087 | R Supplementary Motor Area | 6 | [4 8 52] |
| L Supplementary Motor Area | 6 | [-10 -2 54] | |||
| L Superior Frontal Gyrus | 6 | [-20 -4 54] | |||
| R Middle Cingulum | 24 | [2 14 38] | |||
| R Anterior Cingulum | 24 | [4 28 24] | |||
| Temporal | 0.001 | 619 | R Superior Temporal Gyrus (A2) | 42 | [62 -38 14] |
| R Middle Temporal Gyrus (A2) | 21 | [46 -38 14] | |||
| Occipital | 0.000 | 925 | R Calcarine Sulcus | 18 | [4 -88 -8] |
| R Lingual Gyrus | 18 | [6 -74 -4] | |||
| L Lingual Gyrus | 18 | [ -4 -72 -4] |
Table 2
MEG source power for fast (f) and slow (s) tapping (Mean/Standard Deviation).
https://doi.org/10.7554/eLife.48404.011| Freq. band | SMA | Left A2 | Right A2 | Left M1 | Right M1 | L cerebellum | R cerebellum |
|---|---|---|---|---|---|---|---|
| theta | f: 0.083/0.107 | f: 0.030/0.046 | f: 0.088/0.167 | f: 0.0673/0.1477 | f: 0.0670/0.1403 | f: 0.050/0.063 | f: 0.057/0.119 |
| s: 0.076/0.088 | s: 0.030/0.048 | s: 0.089/0.170 | s: 0.0674/0.1455 | s: 0.0765/0.1777 | s: 0.046/0.056 | s: 0.056/0.105 | |
| alpha | f: 0.062/0.077 | f 0.028/0.040 | f: 0.084/0.159 | f: 0.0742/0.1767 | f: 0.0812/0.1977 | f: 0.041/0.045 | f: 0.047/0.080 |
| s: 0.073/0.088 | s: 0.027/0.037 | s: 0.090/0.166 | s: 0.0836/0.2052 | s: 0.1025/0.2714 | s: 0.040/0.040 | s: 0.046/0.063 | |
| low beta | f: 0.031/0.034 | f: 0.013/0.018 | f: 0.036/0.064 | f: 0.0280/0.0473 | f: 0.0296/0.0533 | f: 0.015/0.014 | f: 0.019/0.025 |
| s: 0.039/0.040 | s: 0.014/0.019 | s: 0.040/0.068 | s: 0.0344/0.0615 | s: 0.0390/0.0754 | s: 0.015/0.013 | s: 0.020/0.024 | |
| high beta | f: 0.018/0.021 | f: 0.008/0.012 | f: 0.018/0.029 | f: 0.0161/0.0285 | f: 0.0153/0.0277 | f: 0.008/0.008 | f: 0.009/0.011 |
| s: 0.022/0.022 | s: 0.008/0.012 | s: 0.020/0.031 | s: 0.0182/0.0318 | s: 0.0189/0.0348 | s: 0.008/0.007 | s: 0.009/0.010 | |
| gamma | f: 0.007/0.006 | f: 0.003/0.004 | f: 0.006/0.009 | f: 0.0064/0.0088 | f: 0.0057/0.0088 | f: 0.004/0.004 | f: 0.005/0.005 |
| s: 0.007/0.006 | s: 0.003/0.003 | s: 0.006/0.009 | s: 0.0065/0.0090 | s: 0.0059/0.0092 | s: 0.004/0.004 | s: 0.005/0.004 |
Table 3
Rhythmic modulation of the low beta band directed connectivity in slow compared to fast tapping.
https://doi.org/10.7554/eLife.48404.017| Connection | Modulation peak in theta band | Modulation peak in alpha band |
|---|---|---|
| left A2 to SMA | t(16)=2.441, p<0.001 | t(16)=1.803, p=0.031 |
| right A2 to SMA | t(16)=2.305, p=0.001 | t(16)=1.399, p=0.114 |
| SMA to left A2 | t(16)=2.760, p=0.004 | t(16)=2.398, p=0.002 |
| SMA to right A2 | t(16)=1.509, p=0.083 | t(16)=2.093, p=0.010 |
Additional files
-
Transparent reporting form
- https://doi.org/10.7554/eLife.48404.018
Download links
A two-part list of links to download the article, or parts of the article, in various formats.
Downloads (link to download the article as PDF)
Open citations (links to open the citations from this article in various online reference manager services)
Cite this article (links to download the citations from this article in formats compatible with various reference manager tools)
Differential contributions of the two human cerebral hemispheres to action timing
eLife 8:e48404.
https://doi.org/10.7554/eLife.48404


