A nuclear role for the DEAD-box protein Dbp5 in tRNA export
- University of Alberta, Canada
- University of California, Davis, United States
- University of California Davis, United States
- University of British Columbia, Canada
Figures
Figure 1 with 2 supplements

Identification of N-terminal nuclear export signal in Dbp5.
(A) Fluorescent images showing localization of GFP-Dbp5 in plasmid based GFP-DBP5, GFP-dbp5-L12A, and GFP-dbp5-L15A strains (top panel). Bottom panel shows GFP-Dbp5 (gray) co-localization with the nucleolar marker Nop1-RFP (blue). (B) Schematic at the top shows the overall sequence composition of verified NES motifs (la Cour et al., 2004), as compared to the Dbp5 N-terminal amino acid sequence. Fluorescent images show localization of 2xGFP-NLSSV40-NESDBP5 reporters fused to residues 1–52 of DBP5 or dbp5-L12A compared to a bona-fide NES (NESPKI). Graph at the bottom shows the ratio between nuclear and cytoplasmic GFP signals measured for the various reporter constructs (n ≥ 100, error bars represent standard deviation, p-value from unpaired t-test with two-tailed distribution shown). (C) Fluorescent images show 2xGFP reporters as used in panel B in a strain carrying xpo1-T539C before and after addition of 100 ng/ml of LMB for 30 min to disrupt Xpo1 mediated export. (D) Fluorescent images show localization of GFP-FRB-Dbp5 or GFP-FRB-Dbp5ΔNES in cells with a Pex25-FKBP12 anchor prior to and following addition of 1 μg/ml rapamycin at 2 and 4 min. Bottom panel shows GFP-FRB-Dbp5 in cells with a Pex25-FKBP12 anchor and the xpo1-539C mutation to allow disruption of Xpo1 mediated export with LMB. Imaging was performed after treatment with 100 ng/ml of LMB for 7 min and following addition of rapamycin at 2 and 4 min. (E) Fluorescent images show localization of GFP-FRB-Dbp5L12A (gray) in reference to Nop1-RFP (blue) in cells with a Pex25-FKBP12 anchor before and after addition of rapamycin for 10 min. Co-localization of GFP-FRB-Dbp5L12A and Nop1-RFP indicated by white arrows. Scale bars = 2 μm. See Figure 1—figure supplement 1 for primary Dbp5 sequence with position of DEAD-box motifs and lethal mutations. See Figure 1—figure supplement 2 for further characterization of the dbp5-L12A allele.
Figure 1—figure supplement 1
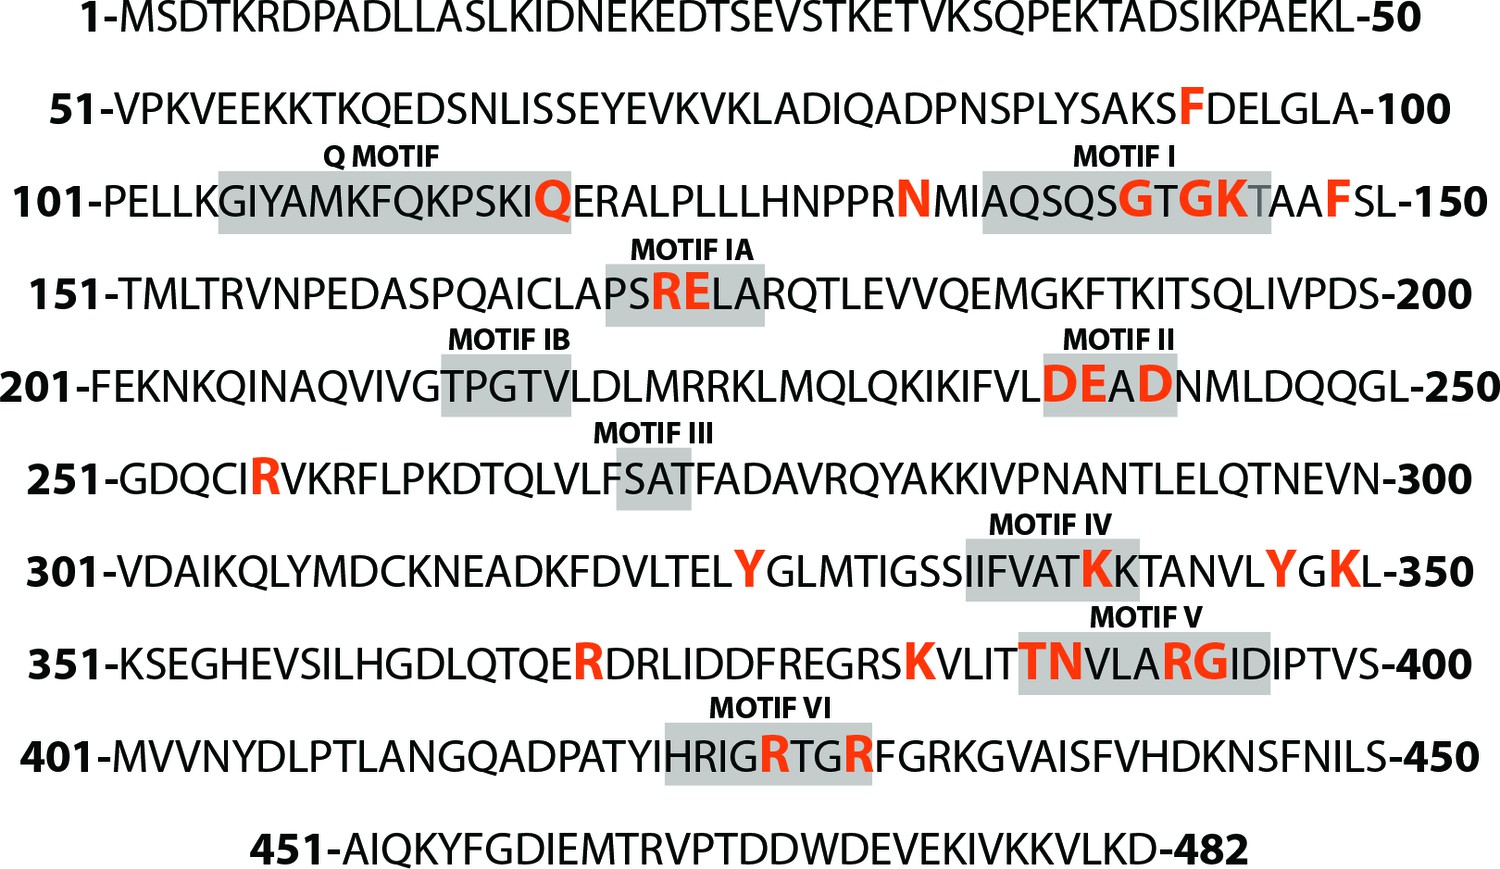
DEAD-box motifs and lethal dbp5 alleles.
Primary amino acid sequence of yeast Dbp5 highlighting the position of lethal mutations (orange) and conserved motifs required for RNA-binding, ATP-binding, and hydrolysis (gray boxes).
Figure 1—figure supplement 2
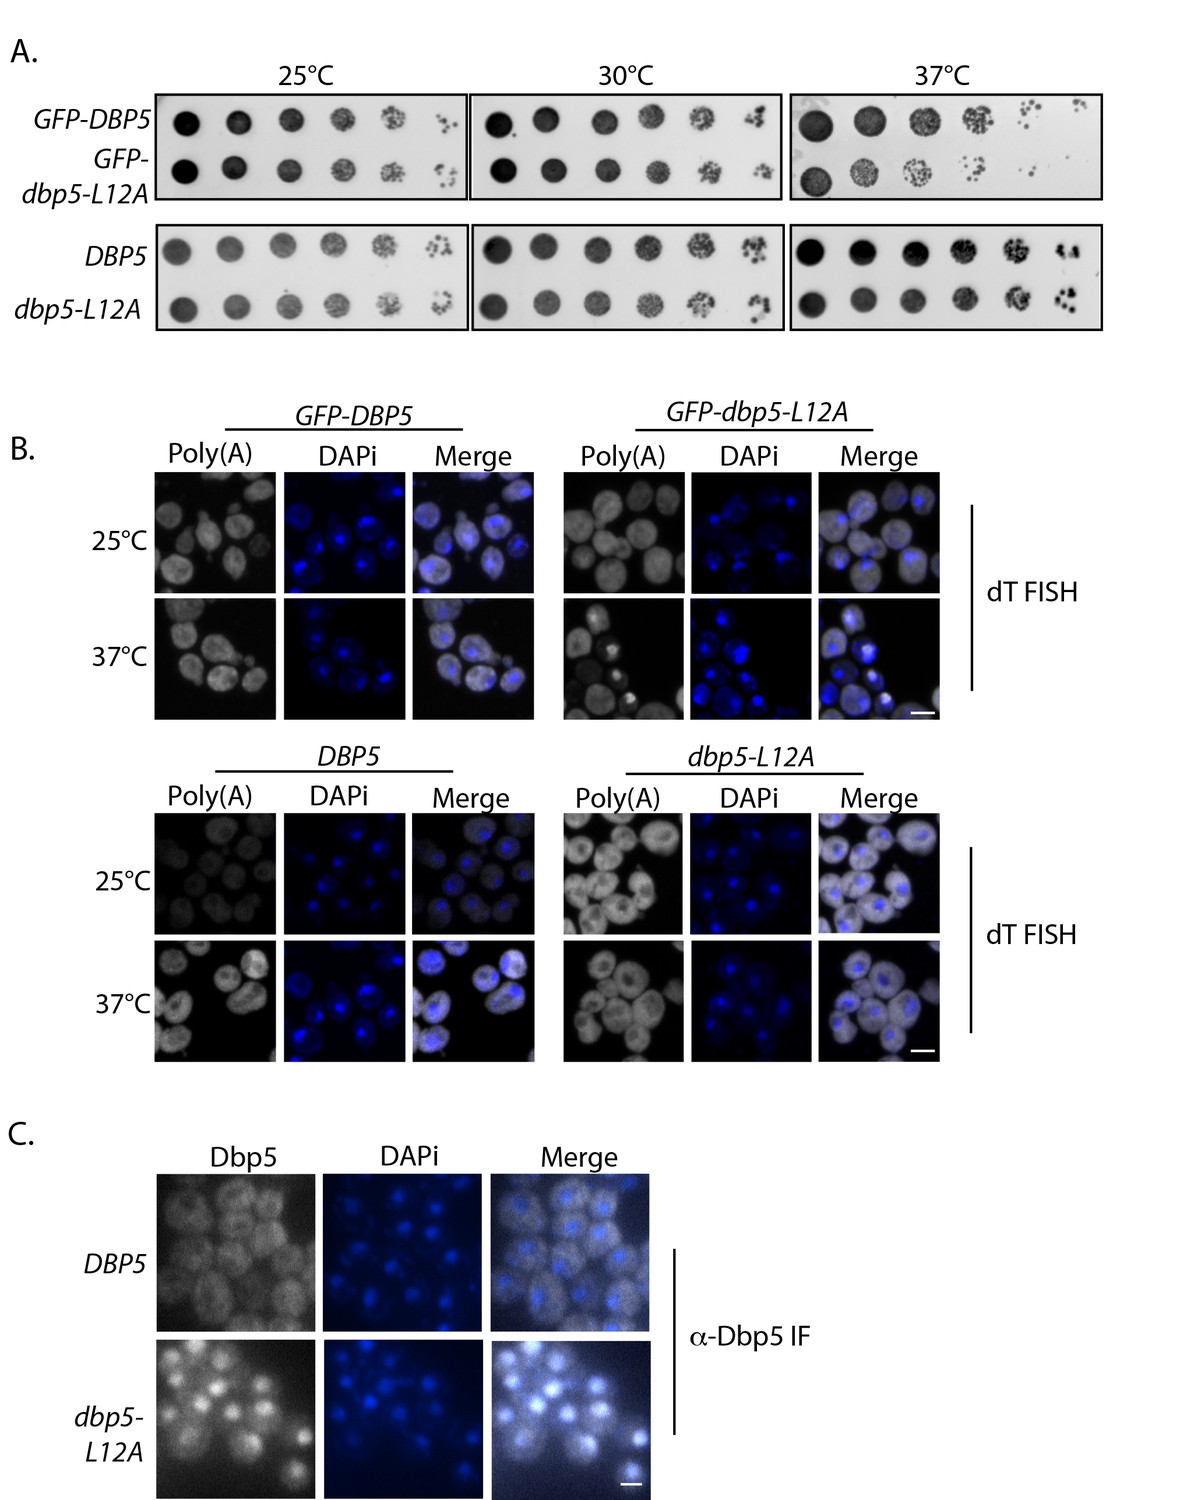
GFP-tagging of dbp5-L12A alters growth and mRNP export phenotypes.
(A) Growth of yeast strains with plasmid based GFP-DBP5 and GFP-dbp5-L12A (top row) compared to untagged integrated versions (bottom row) at 25°C, 30°C, and 37°C for 3 days. (B) FISH images showing poly(A)-RNA (gray) localization in yeast strains carrying plasmid based versions of GFP-DBP5 and GFP-dbp5-L12A (top row) vs. untagged integrated versions (bottom row) as compared to the DAPi stained DNA mass (blue) before and after a 3 hr shift to 37°C. Scale bars = 2 μm. (C) Immunofluorescence imaging data showing Dbp5 localization in yeast strains expressing untagged and integrated versions of DBP5 and dbp5-L12A using an anti-Dbp5 antibody (gray) and DAPi to stain the DNA mass (blue). Scale bars = 2 μm.
Figure 2 with 1 supplement
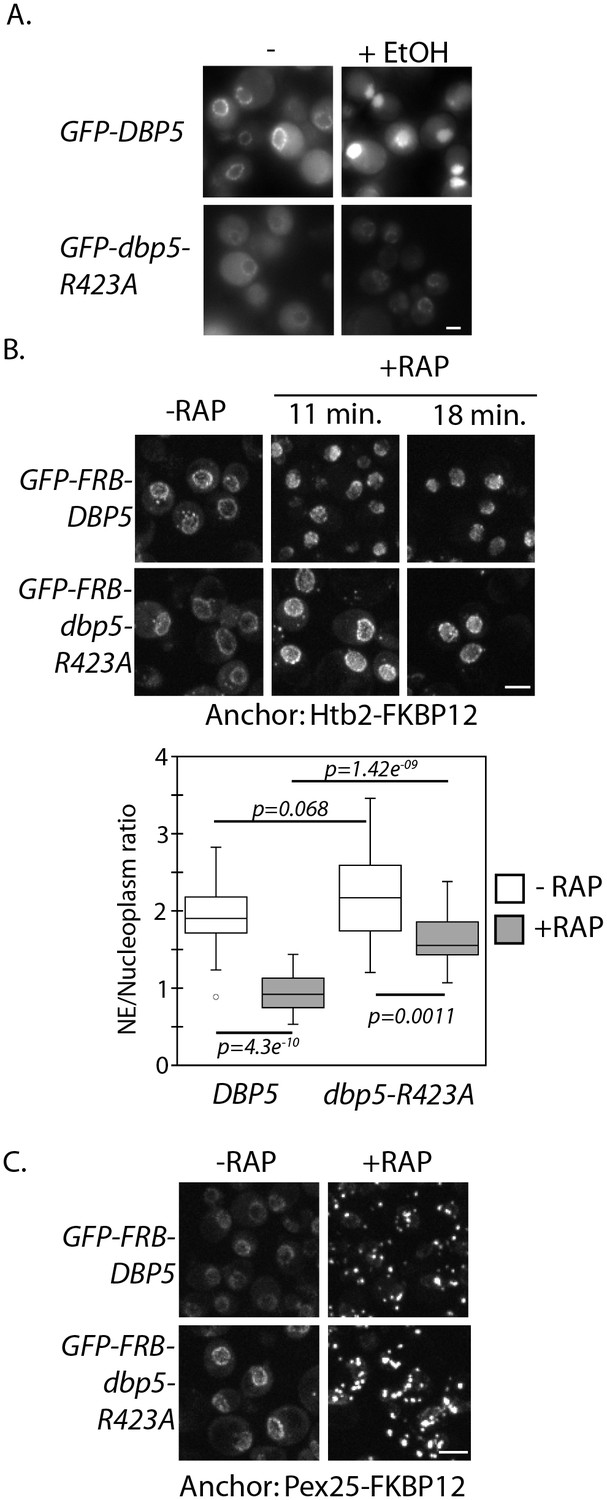
Altered import kinetics of Dbp5R423A.
(A) Fluorescent images showing localization of plasmid expressed GFP-Dbp5 in GFP-DBP5 and GFP-dbp5-R423A strains pre- and post-shift to media with 12% ethanol for 30 min. (B) Fluorescent images showing localization of GFP-FRB-Dbp5 or GFP-FRB-Dbp5R423A in cells with the nuclear Htb2-FKBP12 anchor following addition of 1 μg/ml rapamycin at the indicated time points. Graph shows quantification of the nuclear envelope signal intensity vs. nucleoplasm (n = 23, error bars indicate standard deviation, p-value from paired or unpaired t-test with two-tailed distribution shown). (C) Fluorescent images showing localization of GFP-FRB-Dbp5 or GFP-FRB-Dbp5R423A in cells with the Pex25-FKBP12 anchor following addition of 1 μg/ml rapamycin for 4 min. Scale bars = 2 μm. See Figure 2—figure supplement 1 for characterization of other motif VI plasmid expressed GFP-Dbp5 mutants in ethanol.
Figure 2—figure supplement 1
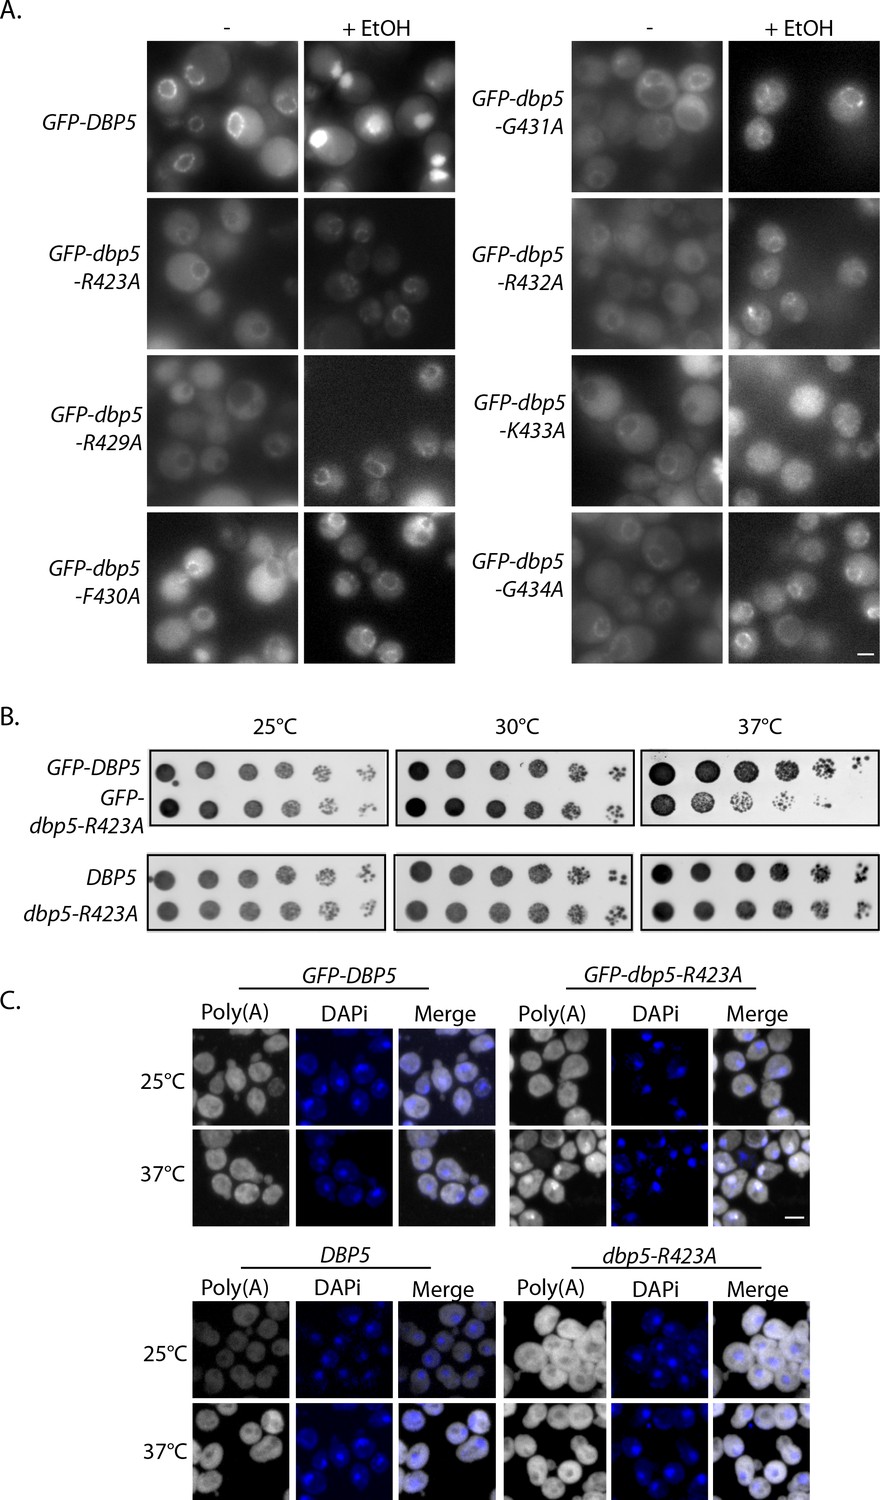
Altered nuclear import kinetics of dbp5 mutants in response to ethanol stress.
(A) Fluorescent images of yeast strains expressing plasmid based GFP-Dbp5 in GFP-DBP5 and GFP-dbp5 mutants in and around motif VI before and after a shift to media containing 12% ethanol for 20 min. (B) Growth of strains carrying plasmid-based versions of GFP-DBP5 and GFP-dbp5-R423A compared to untagged integrated versions at 25°C, 30°C, and 37°C for 3 days. (C) FISH images showing poly(A)-RNA (gray) localization in yeast strains carrying plasmid-based versions of GFP-DBP5 and GFP-dbp5-R423A (top row) vs. untagged integrated versions (bottom row) with respect to the DAPi stained DNA mass (blue) before and after a 3 hr shift to 37°C. Scale bars = 2 μm.
Figure 3
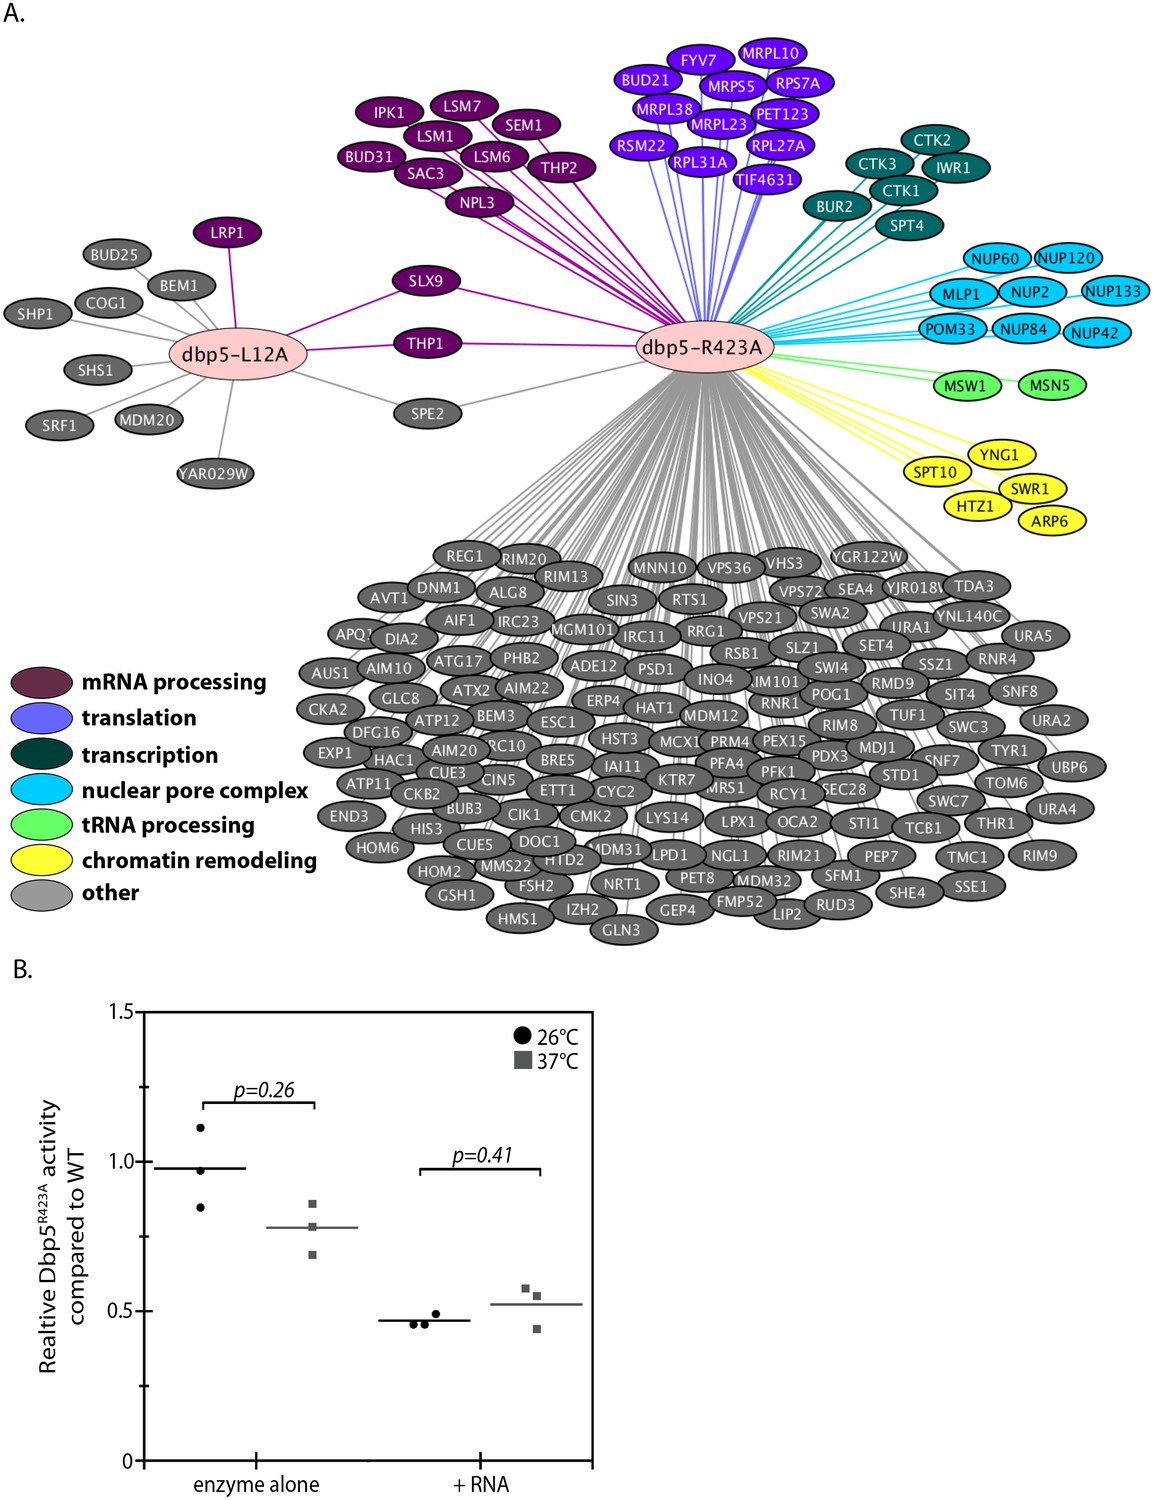
Genetic interaction analyses of dbp5-L12A and dbp5-R423A.
(A) Identified synthetic interactions by SGA analysis in integrated and untagged dbp5-L12A and dbp5-R423A strains. Gene deletions are grouped based on gene ontology (magenta- mRNA processing, purple- translation, teal- transcription, blue- nuclear pore complex, green- tRNA processing, yellow- chromatin remodeling, gray- other). (B) Steady state in vitro ATPase assays performed with purified Dbp5 and Dbp5R423A at 26°C or 37°C. Graph shows the average ATPase rate measured for Dbp5R423A as a percentage of Dbp5 activity, with or without RNA stimulation (n = 3, error bars represent standard deviation, p-value from paired t-test with two-tailed distribution shown).
Figure 4 with 1 supplement
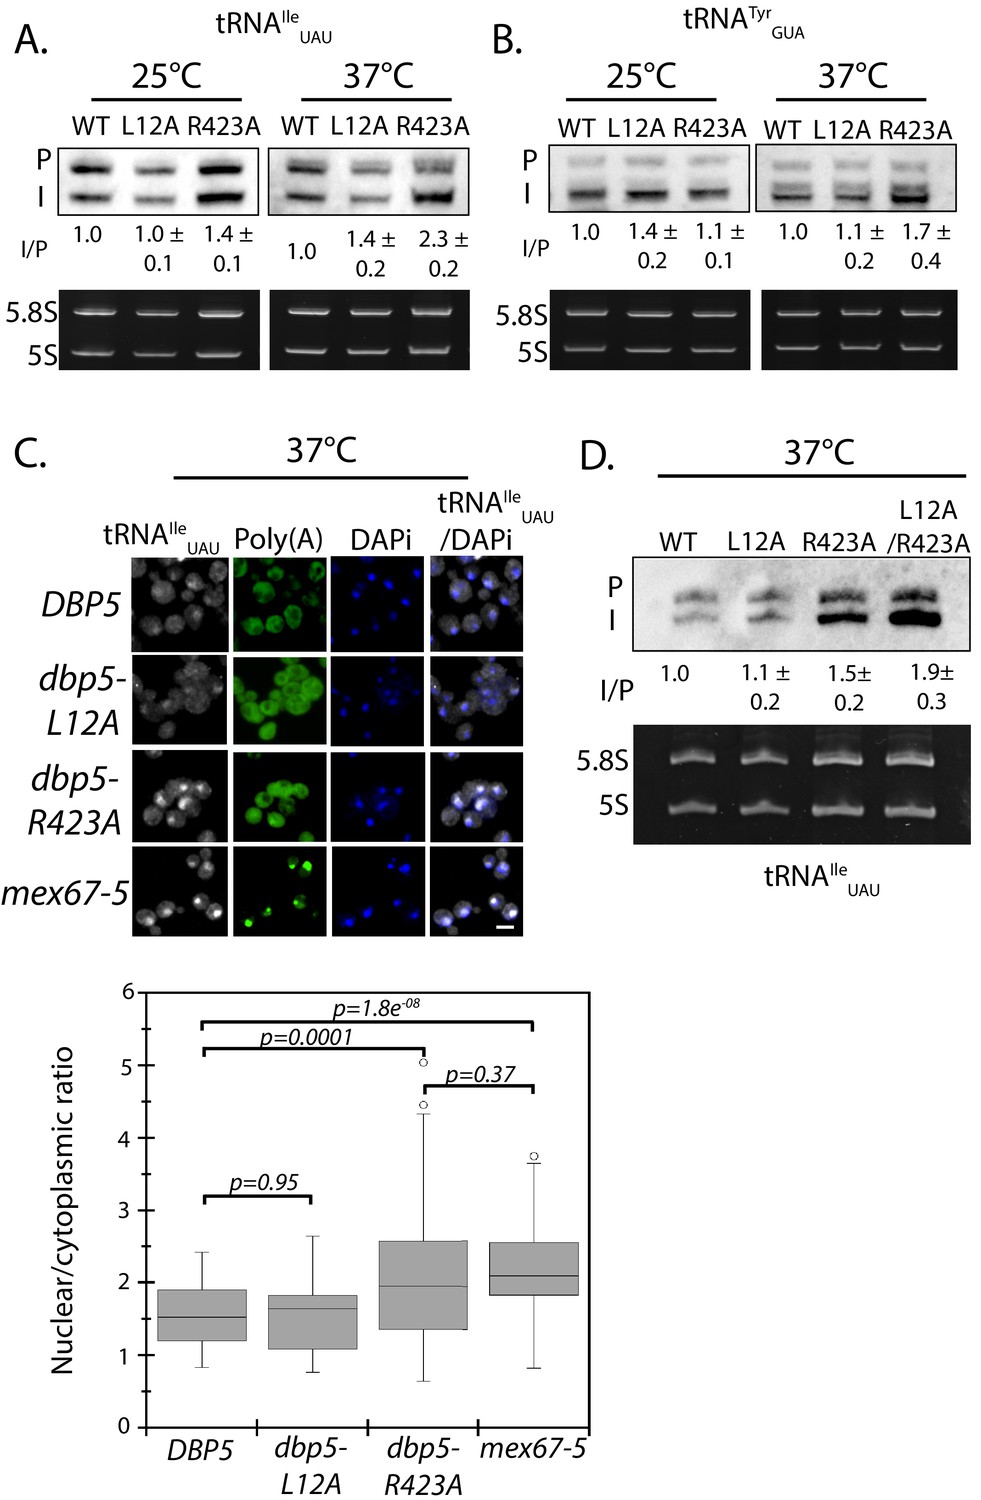
Dbp5 is required for tRNA export.
(A) Northern blot analysis of tRNAIleUAU (Probe1) in integrated and untagged DBP5 (WT), dbp5-L12A, and dbp5-R423A strains before and after a 2 hr temperature shift to 37°C. The primary tRNA transcript is denoted as (P), and the end-matured intron-containing tRNA is denoted as (I). Ratio of mean integrated intensity between (I) and (P) species is measured and normalized to the wild type value (n = 3, error represents standard deviation). Ethidium bromide stained gel shows 5.8S and 5S rRNA species in bottom panel as a loading control. (B) Northern blot analysis as in panel A using tRNATyrGUA (Probe KC031). (C) Localization of tRNAIleUAU determined by FISH in integrated and untagged dbp5-L12A and dbp5-R423A strains after a 4 hr shift to 37°C. Cells were probed with a Cy3 end-labeled tRNAIleUAU probe (SRIM04, gray) and DAPi (blue). Scale bar = 2 μm. Graph shows the ratio between nuclear and cytoplasmic tRNAIleUAU signals (n ≥ 50, error bars represent standard deviation, p-value from unpaired t-test with two-tailed distribution shown). (D) Northern blot analysis of tRNAIleUAU (Probe1) as performed in panel A, including an integrated and untagged dbp5-L12A/R423A double mutant strain. See Figure 4—figure supplement 1 for characterization of the dbp5-L12A/R423A double mutant strain and tRNA processing defects in Ts alleles of DBP5, NUP159, GLE1, and MEX67.
Figure 4—figure supplement 1
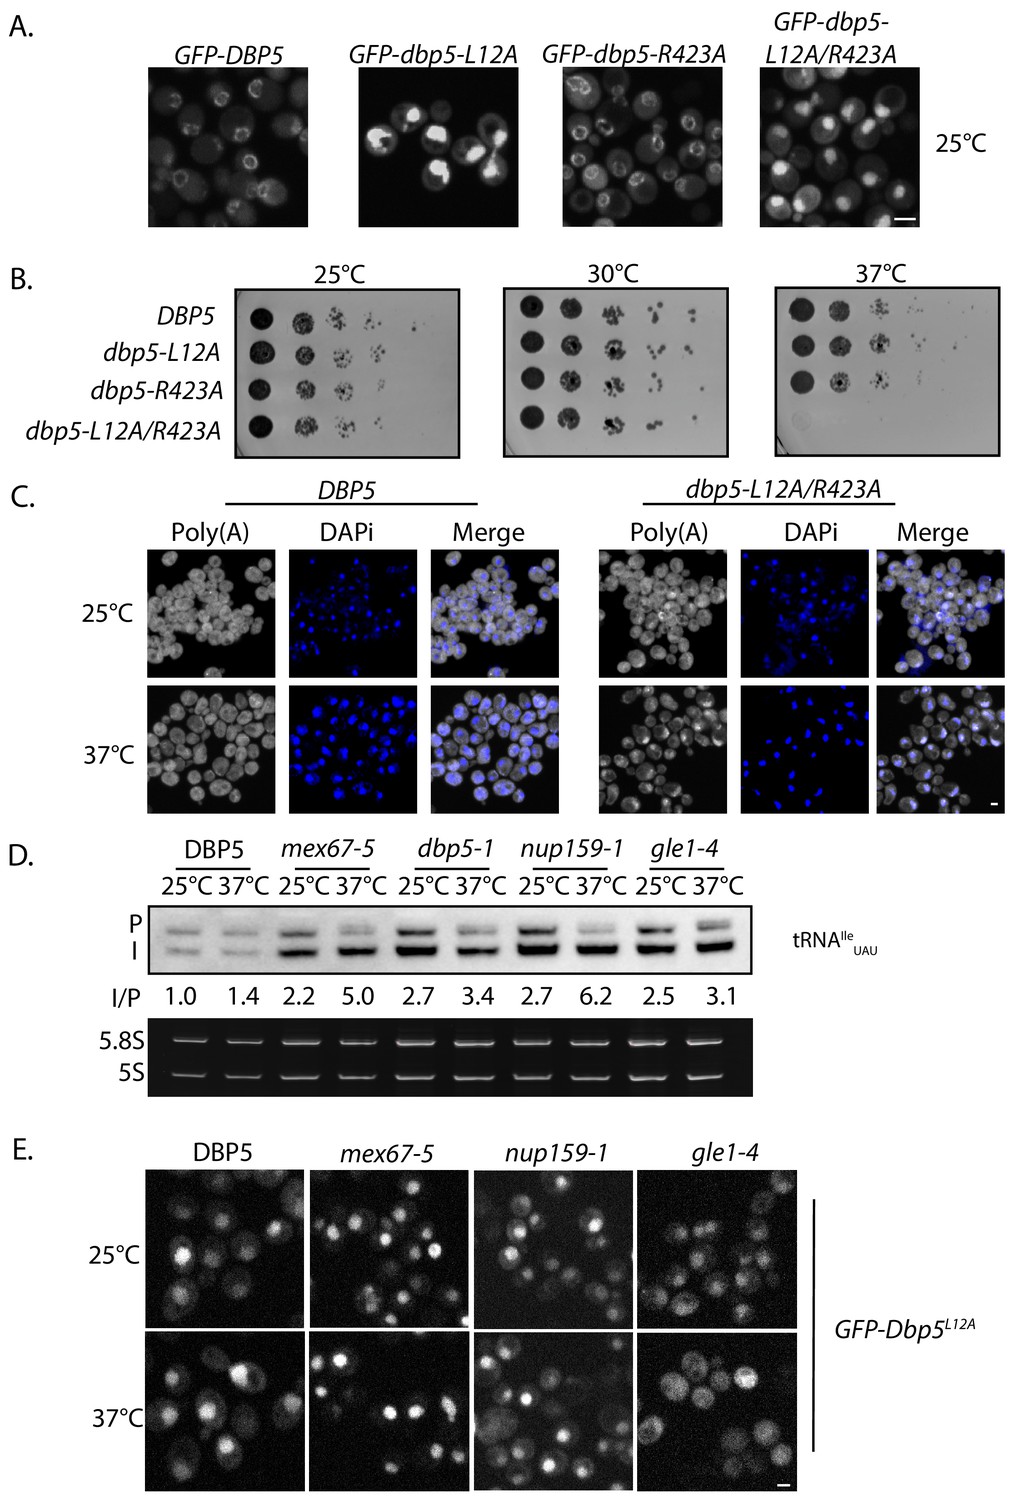
Characterization of dbp5-L12A/R423A and tRNA processing status in mRNP export mutants.
(A) Fluorescent images showing GFP-Dbp5 localization in strains carrying plasmid versions of GFP-DBP5, GFP-dbp5-L12A, GFP-dbp5-R423A, and GFP-dbp5-L12A/R423A. (B) Growth of integrated and untagged DBP5, dbp5-L12A, dbp5-R423A, and dbp5-L12A/R423A at 25°C, 30°C, and 37°C for 1 day. (C) FISH images showing poly(A)-RNA (gray) localization in integrated and untagged DBP5 and dbp5-L12A/R423A strains compared to the DAPi stained DNA mass (blue) before and after a 4 hr shift to 37°C. Scale bars = 2 μm. (D) Northern blot analysis of tRNAIleUAU (Probe1) in DBP5 (WT), mex67-5, dbp5-1, nup159-1, and gle1-4 strains before and after a 2 hr temperature shift to 37°C. The primary tRNA transcript is denoted as (P), and the end-matured intron-containing tRNA is denoted as (I). Ratio of mean integrated intensity between (I) and (P) species is measured and normalized to the wild type value. Ethidium bromide stained gel shows 5.8S and 5S rRNA species in bottom panel as a loading control. (E) Fluorescent images of plasmid expressed GFP-Dbp5L12A localization in DBP5, mex67-5, nup159-1, and gle1-4 strains before and after a 2 hr temperature shift to 37°C. Scale bars = 2 μm.
Figure 5 with 1 supplement
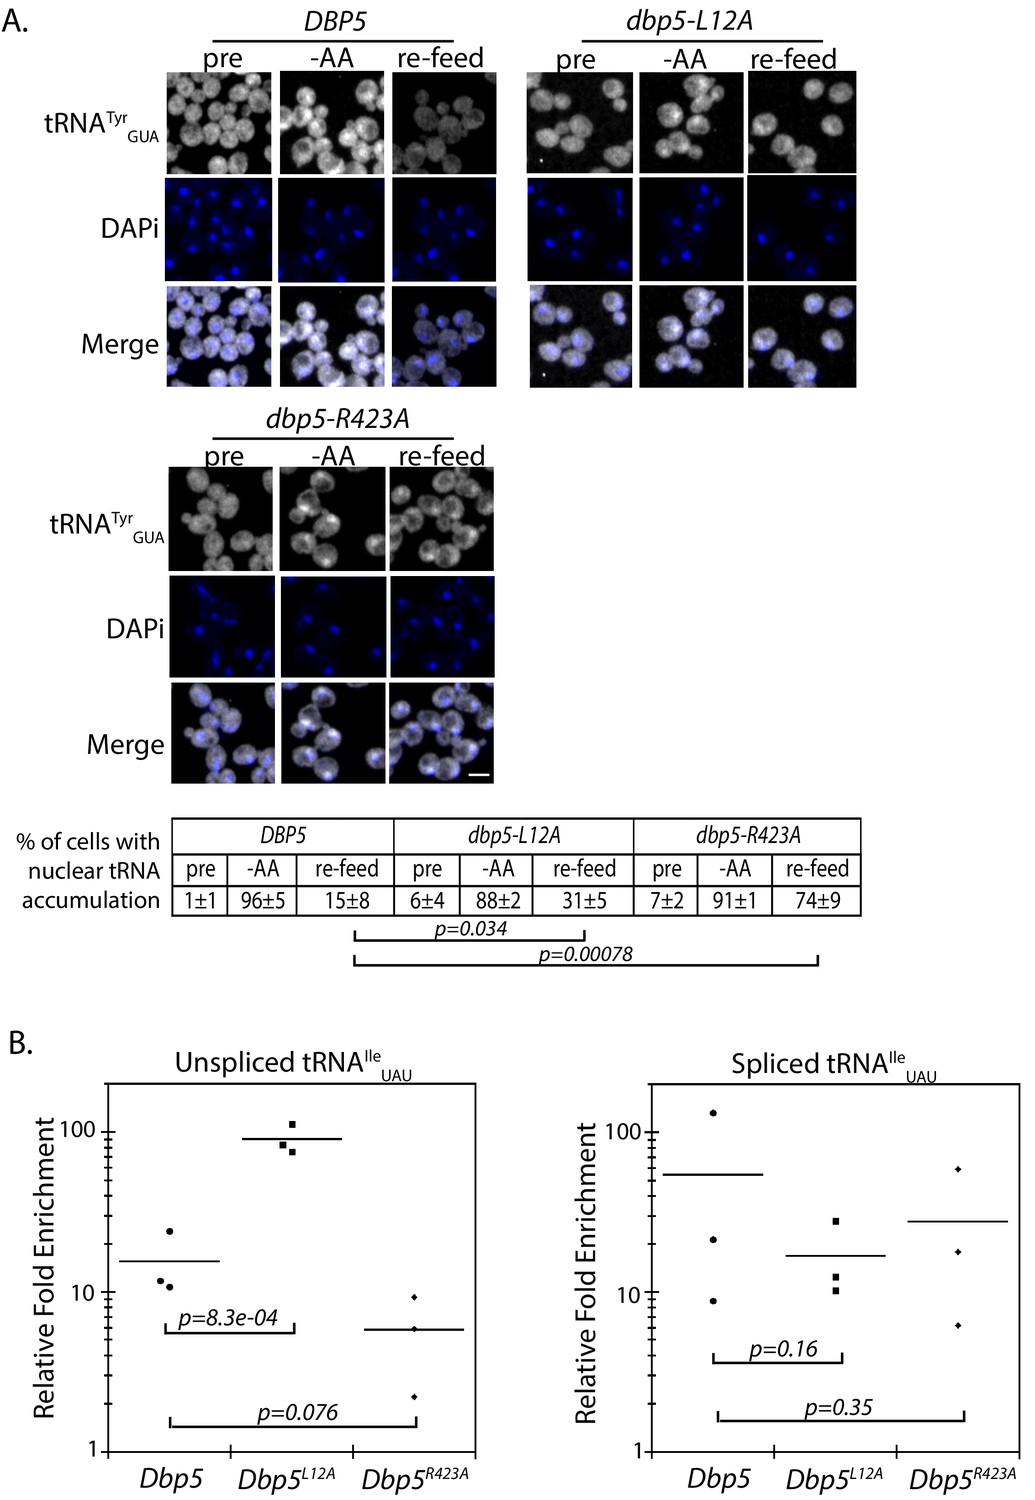
Dbp5 supports re-export of mature tRNAs following nutritional stress.
(A) Localization of tRNATyr determined by FISH at 25°C in integrated and untagged DBP5, dbp5-L12A, and dbp5-R423A strains prior to (pre), during a 10 min starvation for amino acids (-AA), and 15 min after reintroduction of amino acids through addition of rich media (re-feed). Cells were probed with a Cy3 end-labeled tRNATyr probe (SRIM15, gray) and DAPi (blue). Scale bar = 2 μm. Percent of cells determined to have increased levels of nuclear tRNA (i.e. nuclear signal >than cytoplasmic) under each condition are indicated below (three biological replicates, n = 100, error represents standard deviation, p-value from unpaired t-test with two-tailed distribution shown). (B) Graph showing relative fold enrichment (log scale) of associated unspliced or spliced tRNAIleUAU with PrA-Dbp5 in DBP5, dbp5-L12A, and dbp5-R423A strains as compared to the untagged control. Data generated by co-immunoprecipitation of PrA-Dbp5 followed by RT-qPCR using formaldehyde cross-linked cells (three biological replicates, p-value from unpaired t-test with two-tailed distribution using delta Ct values). See Figure 5—figure supplement 1 for silver stained gel showing proteins present in the immunoprecipitation and RT-qPCR products amplified in the analyses of spliced and unspliced tRNAIleUAU, including a control for non-specific binding.
Figure 5—figure supplement 1
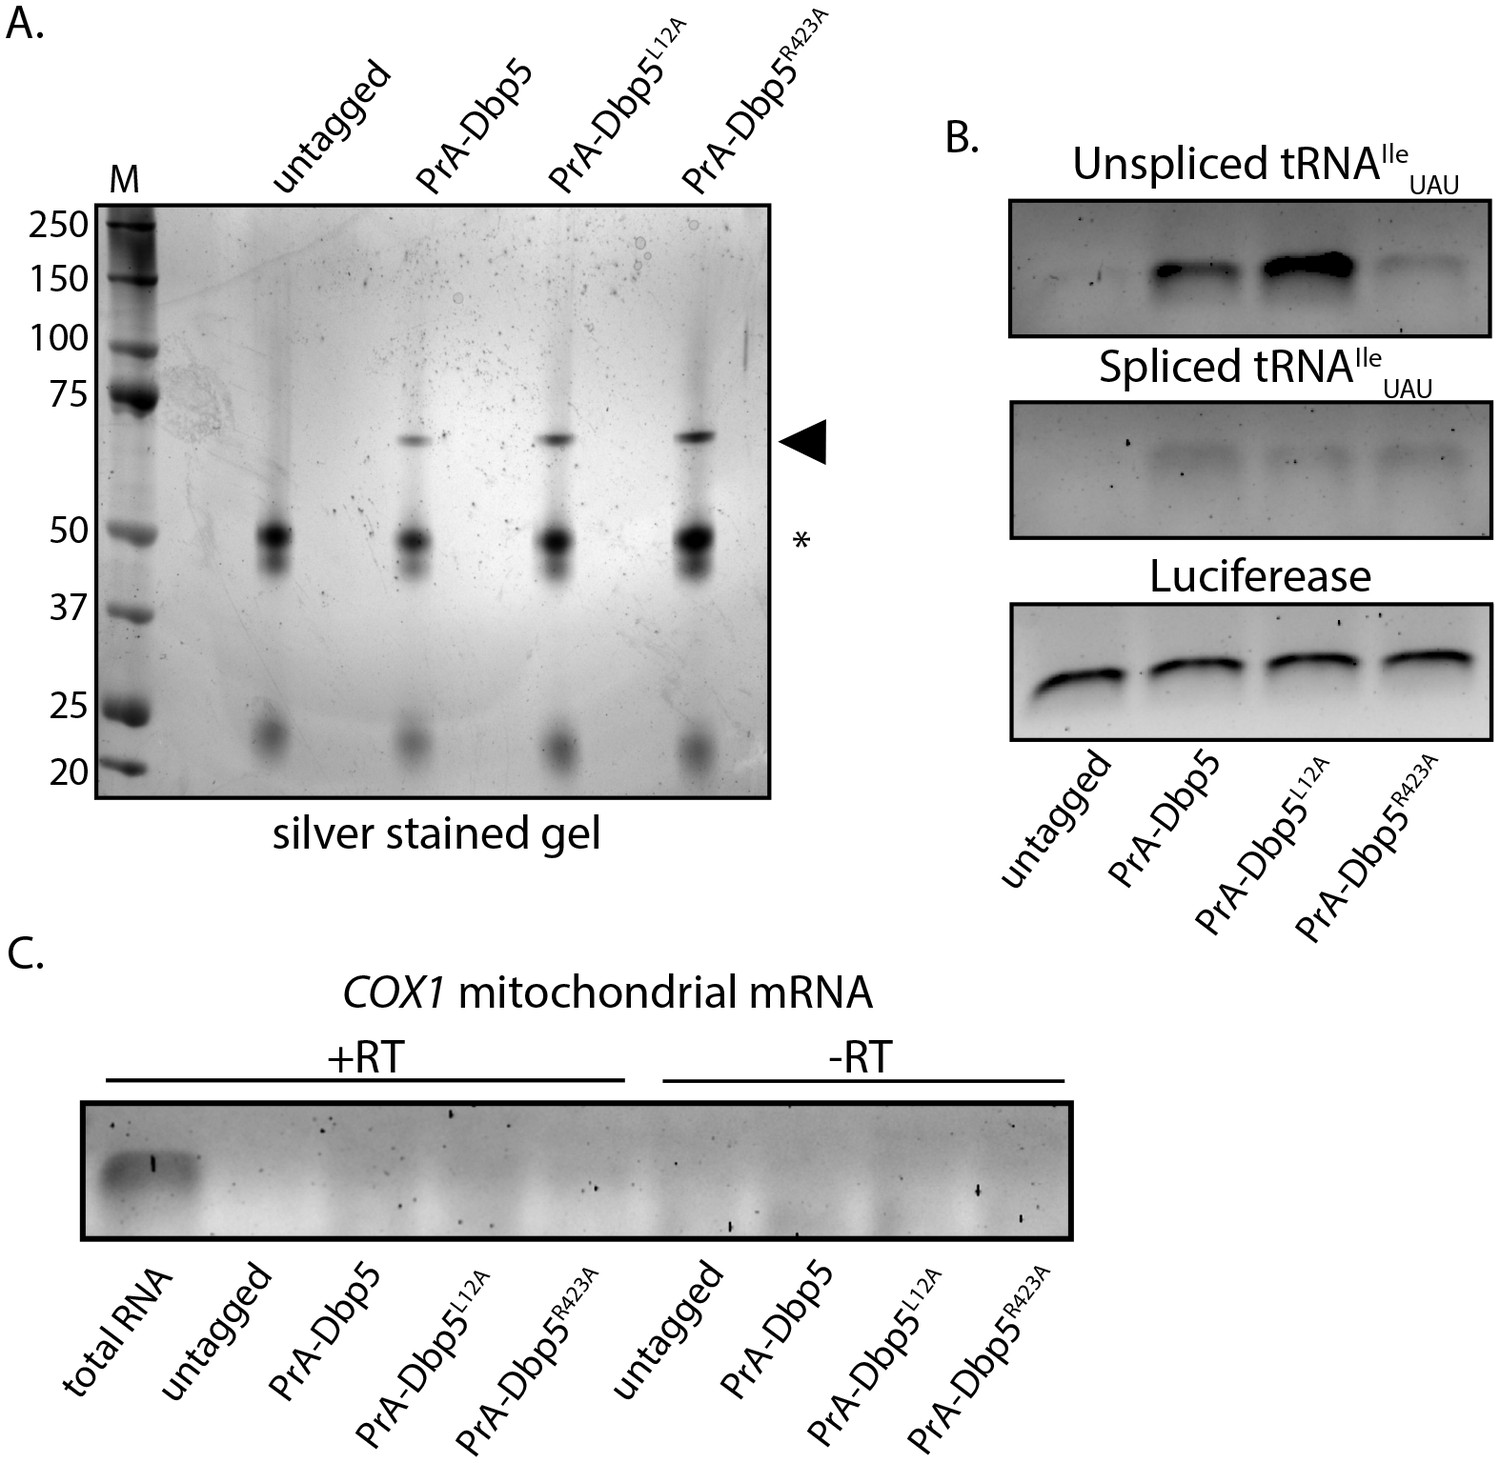
Co-immunoprecipitation analyses show tRNAs co-purify with Dbp5.
(A) Representative silver stained gel showing proteins present in co-immunoprecipitations of untagged control, PrA-Dbp5, PrA-Dbp5L12A, or PrA-Dbp5R423A. Black arrowhead denotes Dbp5 and asterisk denotes IgG heavy chain. (B) Representative agarose gel showing RT-qPCR products for tRNAIleUAU, co-immunoprecipitations in untagged control, PrA-Dbp5, PrA-Dbp5L12A, and PrA-Dbp5R423A RIPs, as well as the luciferase spike in control used for normalization. (C) Agarose gel showing RT-qPCR products for the COX1 mitochondrial mRNA in cDNA libraries made from total RNA vs. input RNA from RIPs. PCR products from reactions with (+RT) and without (-RT) addition of reverse transcriptase during cDNA library preparation are shown. Note that measured delta Ct values for COX1 were similar to the levels found in -RT reactions suggesting only background detection of low levels of contaminating genomic DNA, which negates the calculation of relative fold change values.
Figure 6

Models of Dbp5 function in mRNP and tRNA export.
Data from this work suggest that Dbp5 shuttling is not critical to mRNP export, supporting a model in which Dbp5 acts at NPCs to facilitate export. In such a model (schematic on left), mRNPs assembled in the nucleus would be expected to include the cap binding complex (CBC), export factors Mex67/Mtr2, Nab2, and various other RBPs. Following transport out of the nucleus, the activity of Dbp5 at the cytoplasmic face of the NPC in the context of Gle1:InsP6 and Nup159 would promote remodeling of RNA-RBP interactions to enforce directional transport (e.g. RNPase model). For tRNAs, a nuclear pool of Dbp5 is involved in export suggesting two broad models of Dbp5 function (schematic on right). In model #1, Dbp5 would act solely within the nucleus to support tRNA processing and export by facilitating events, potentially as an RNPase, that ultimately lead to a tRNA being exported with a tRNA export factor (e.g. Los1 or Mex67). In model #2, Dbp5 engages a tRNA in the nucleus and travels with tRNAs from the nucleus to the cytoplasm in complex with the tRNA and tRNA export factor (e.g. scaffold model), and upon entering the cytoplasm, these interactions would be remodeled in the context of the NPC and Dbp5 regulators. The second model provides a rationale for tRNA export defects in mutants of Dbp5 co-regulators (Nup159 and Gle1), whereas in model #1 the impact of mutations in Dbp5 co-regulators would act through an indirect and/or independent mechanism.
Additional files
-
Supplementary file 1
File contains the following tables referenced in the main text.
Table 1: List of lethal point mutations in Dbp5, Table 2: results of the SGA analysis of dbp5-L12A and dbp5-R423A, Table 3: DBP5 mutagenesis oligo sequences, Table 4: Yeast Strains, Table 5: Plasmids, and Table 6: sequences of qPCR primers, FISH probes, and Northern probes.
- https://cdn.elifesciences.org/articles/48410/elife-48410-supp1-v2.xlsx
-
Transparent reporting form
- https://cdn.elifesciences.org/articles/48410/elife-48410-transrepform-v2.pdf
Download links
A two-part list of links to download the article, or parts of the article, in various formats.
Downloads (link to download the article as PDF)
Open citations (links to open the citations from this article in various online reference manager services)
Cite this article (links to download the citations from this article in formats compatible with various reference manager tools)
A nuclear role for the DEAD-box protein Dbp5 in tRNA export
eLife 8:e48410.
https://doi.org/10.7554/eLife.48410


