MRGPRX4 is a bile acid receptor for human cholestatic itch
- Peking University School of Life Sciences, China
- PKU-IDG/McGovern Institute for Brain Research, China
- Peking-Tsinghua Center for Life Sciences, China
- University of Pennsylvania, United States
- Peking University, China
- Peking University First Hospital, Peking University, China
- Peking University Third Hospital, Peking University, China
- Chinese Academy of Sciences, China
- Peking Union Medical College Hospital, Chinese Academy of Medical Sciences, Peking Union Medical College, China
- Peking University First Hospital, China
- Chinese Institute for Brain Research, China
Figures
Figure 1 with 1 supplement
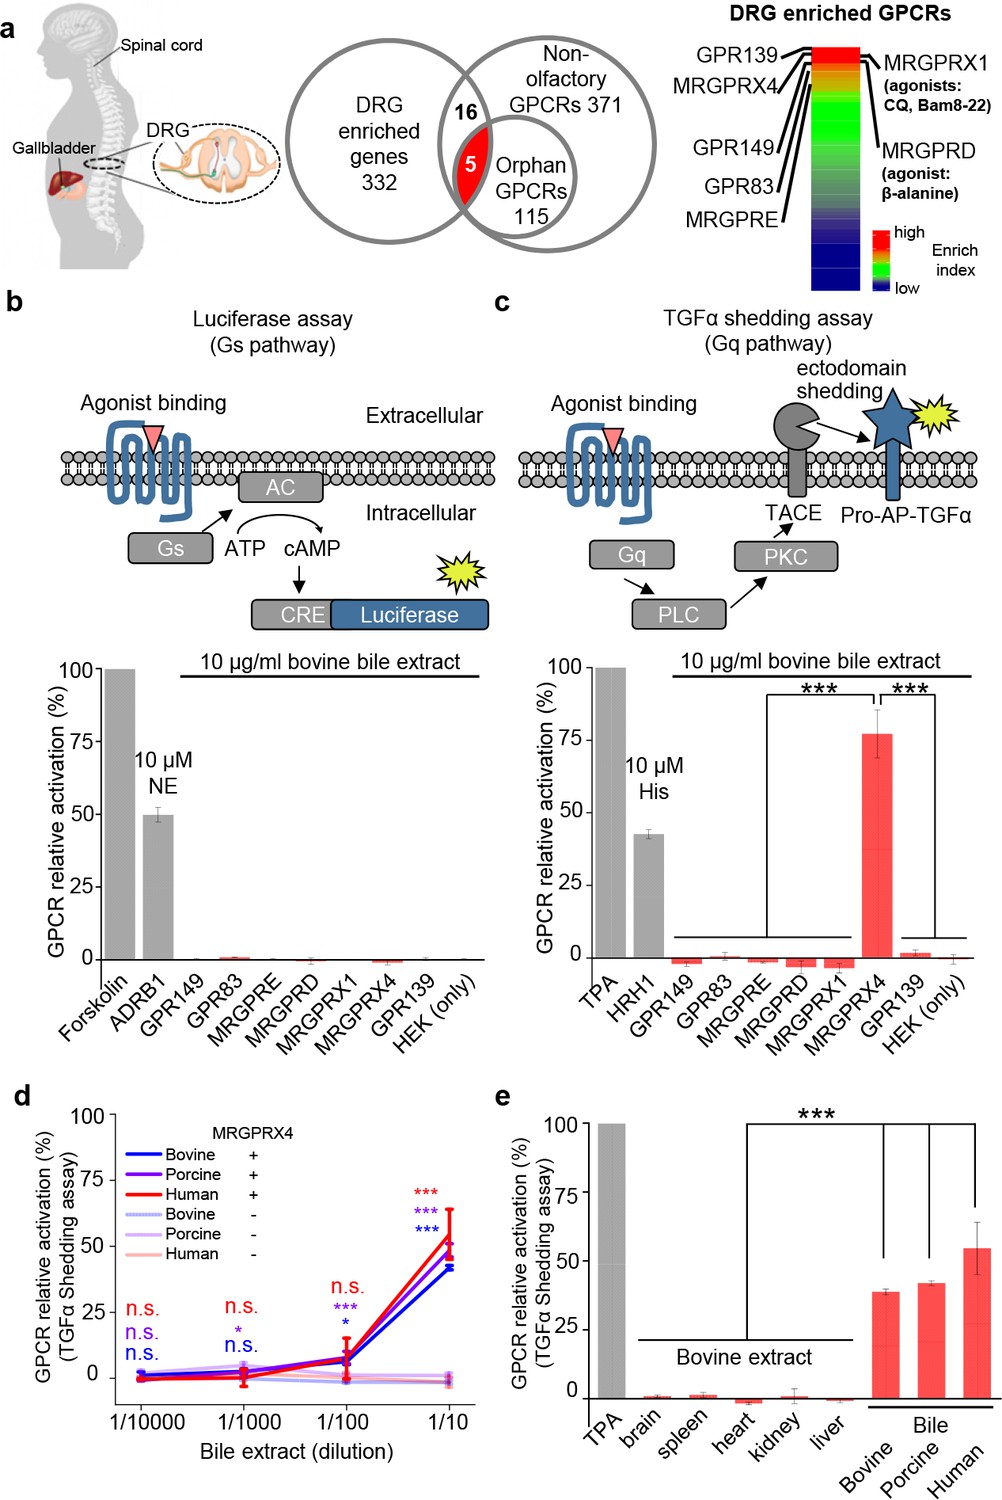
MRGPRX4 is activated by bile extract.
(a) Flow chart for the strategy used to identify GPCRs enriched in human DRG. Transcriptome analysis of DRG and other tissues (trigeminal ganglia, brain, colon, liver, lung, skeletal muscle, and testis) revealed 332 transcripts with high expression in the DRG. The top seven GPCRs are listed. See also Supplementary files 1 and 2. Gene expression data were obtained from Flegel et al. (2013). (b and c) Activation of MRGPRX4 by bovine bile extract. The diagrams at the top depict the reporter gene assays used to measure GPCR activation via Gs-dependent (b) and Gq-dependent (c) pathways. The seven GPCRs identified in (a) were tested, revealing that MRGPRX4-expressing HEK293T cells are activated by bile extract via the Gq-dependent pathway. Forskolin and TPA were used as positive controls for activating Gs- and Gq-dependent signaling, respectively. The responses obtained from the tested GPCRs were normalized to the responses induced by respective positive controls. As positive controls for detecting GPCR activation, separate cells were transfected with ADRB1 and stimulated with 10 μM norepinephrine (NE) (b) or transfected with HRH1 and stimulated with 10 μM histamine (His) (c). ‘HEK (only)’ refers to non-transfected cells. n = 3 experiments performed in triplicate. (d) Concentration-response curve for the activation of MRGPRX4 by bovine bile extract, porcine bile extract, and human bile measured using the TGFα shedding assay. The bovine and porcine bile extract solutions were diluted 1 :10 from a 100 μg/ml stock solution, and the human bile solution was diluted 1:10 from crude human bile. n = 2 experiments performed in triplicate. (e) MRGPRX4 is activated selectively by bovine, porcine, and human bile extracts, but not by bovine brain, spleen, heart, kidney, or liver tissue extracts. The data for porcine and human bile are reproduced from (d). n = 2 experiments performed in triplicate. All error bars represent the s.e.m.. Student’s t-test, *p<0.05, ***p<0.001, and n.s. not significant (p>0.05).
Figure 1—figure supplement 1
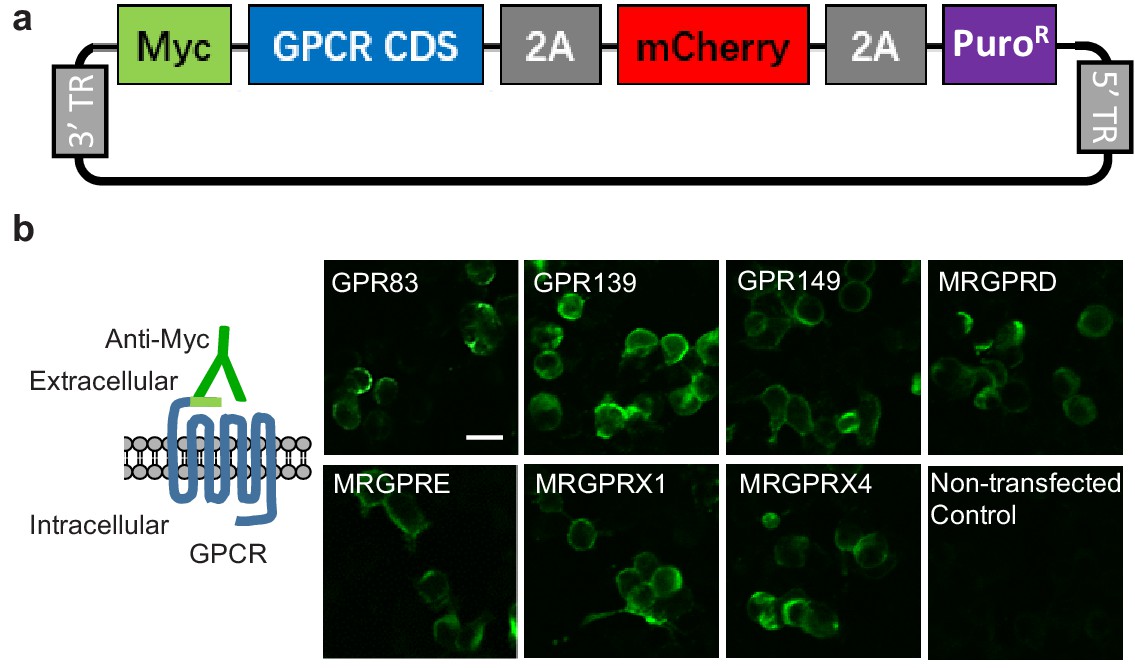
Construct design and surface expression of candidate GPCRs in HEK293T cells.
(a) Map of the generic GPCR expression vector. The 3’ and 5’ terminal repeats (TR) are recognized by the PiggyBac transposase. Myc, Myc tag; PuroR, puromycin-resistance gene. (b) Plasma membrane expression of the indicated GPCRs transiently expressed in HEK293T cells, detected using an anti-Myc antibody. Scale bar, 20 μm.
Figure 2 with 1 supplement
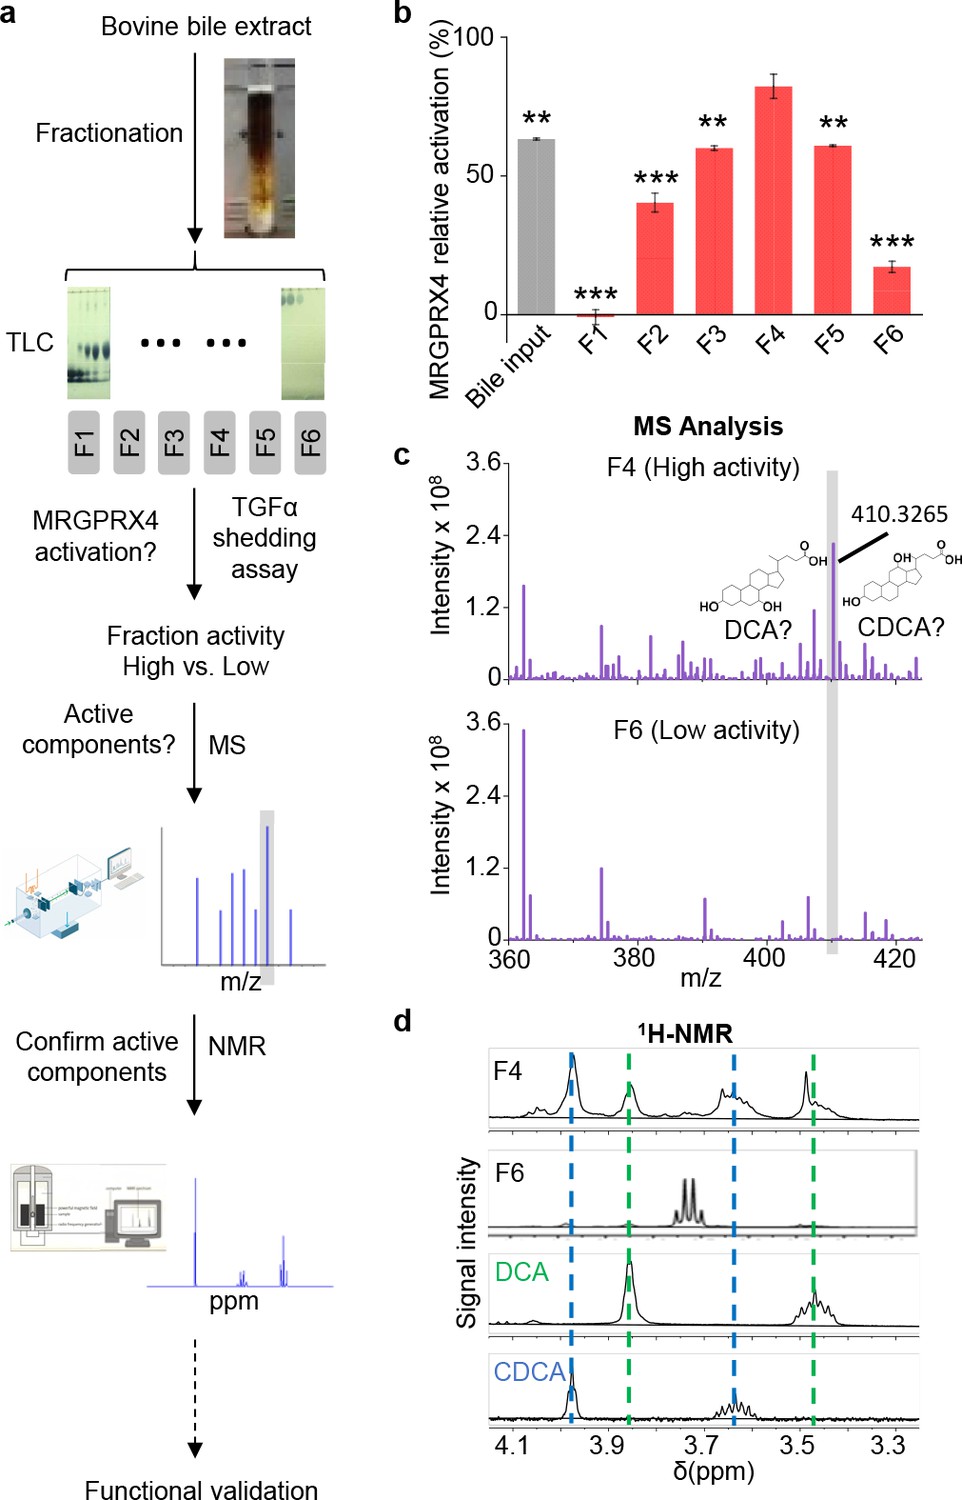
Identification of the active components in bile extract that activate MRGPRX4.
(a) Flow chart depicting the strategy for isolating and identifying candidate MRGPRX4 ligands in bovine bile extract. F1 through F6 indicate the six fractions used in subsequent experiments. (b) Activation of MRGPRX4 by bile extract fractions F1 through F6; fraction F4 has the highest activity. The data represent one experiment performed in triplicate. All error bars represent the s.e.m.. Student’s t-test, **p<0.01. ***p<0.001 versus fraction F4. (c) MS analysis of fractions F4 and F6 (which showed high and weak activity, respectively). The selectively enriched peak in fraction F4 at molecular weight 410.3265 corresponds to the bile acids DCA and CDCA. (d) 1H-NMR analysis of fractions F4 and F6 using purified DCA and CDCA as controls.
Figure 2—figure supplement 1
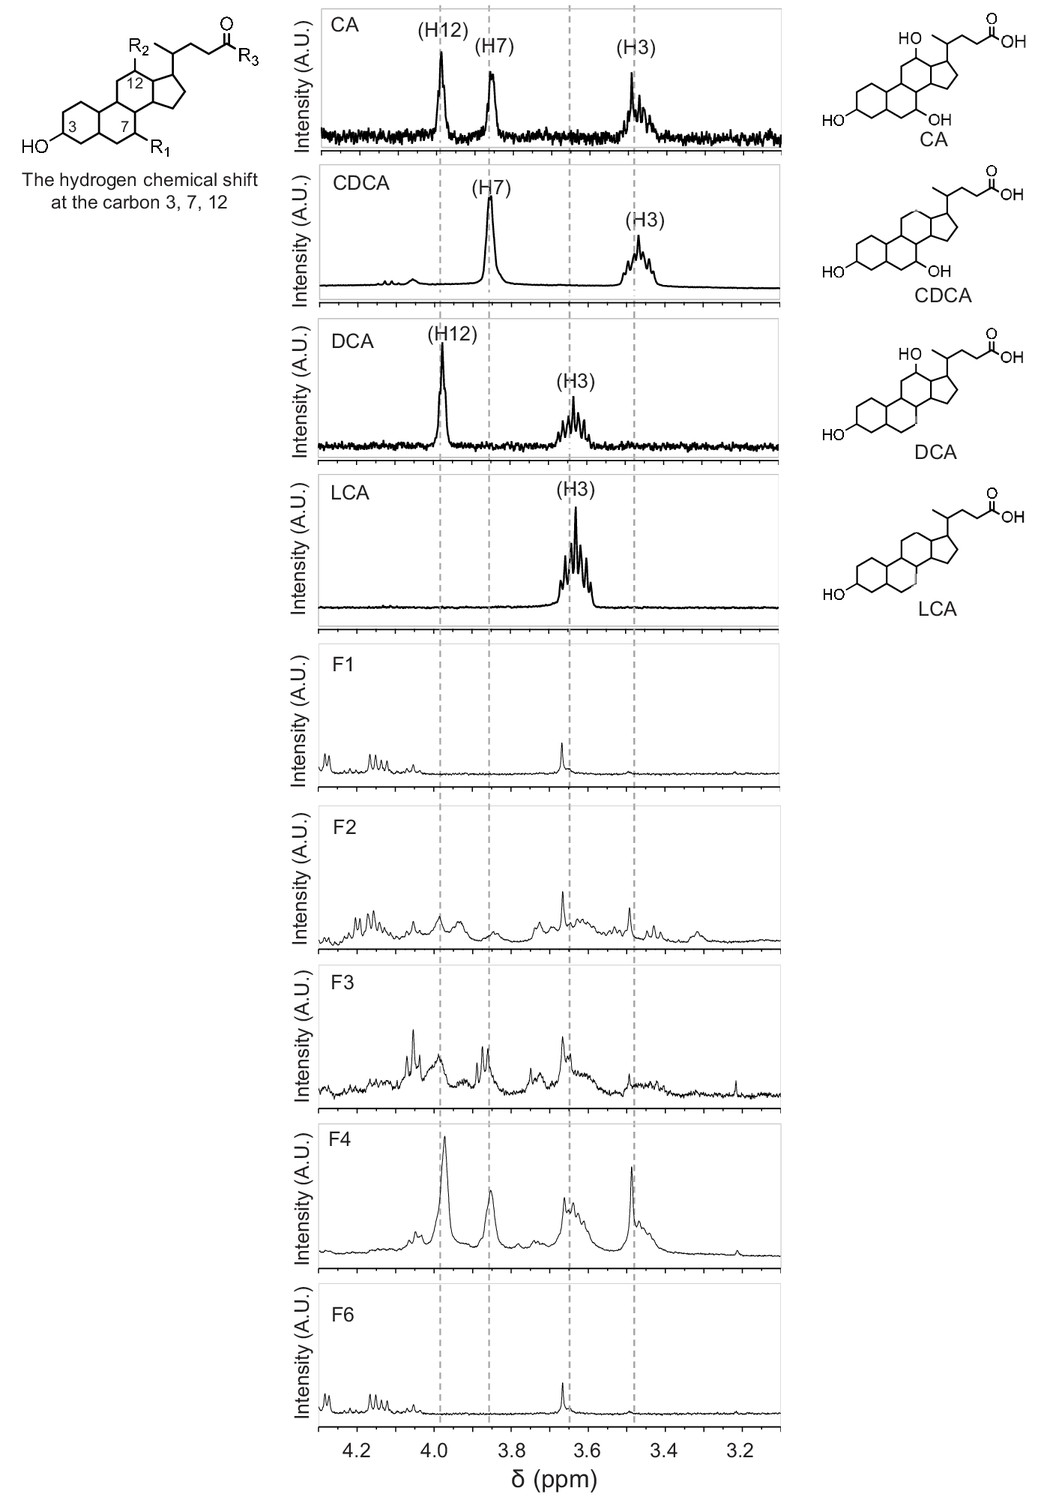
1H-NMR analysis of bile acids in fractions F1, F2, F3, F4, and F6.
The hydrogen chemical shift of CA, CDCA, DCA, and LCA at carbon 3, 7, 12 were determined by 1H-NMR. Note that the active fractions (F2 through F4) contained the characteristic hydrogen peaks corresponding to these bile acids.
Figure 3 with 1 supplement
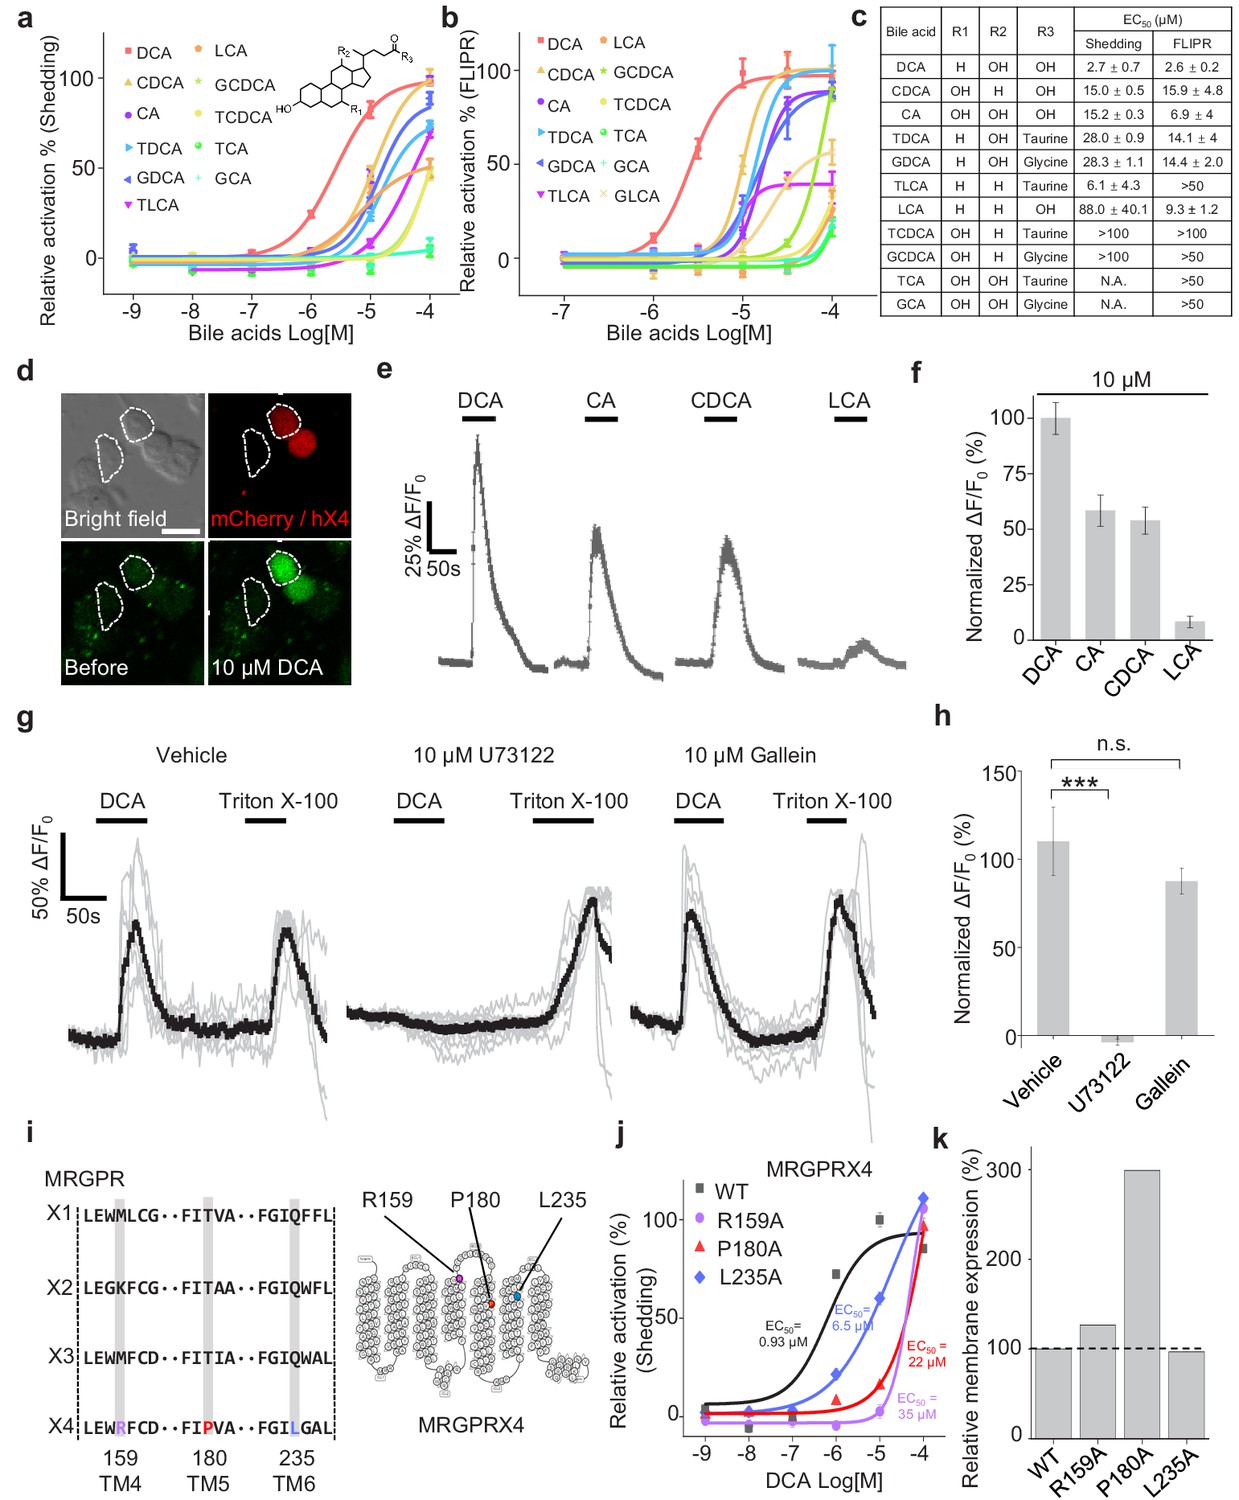
Functional characterization and molecular profiling of bile acids as ligands for MRGPRX4.
(a–c) Dose-dependent activation of MRGPRX4 by various bile acids and their derivatives. MRGPRX4 activation was measured using the TGFα shedding assay (a) or the FLIPR assay (b) see Materials and methods) in MRGPRX4-expressing HEK293T cells; n = 1 experiment performed in triplicate. The general structure of the bile acids and derivatives is shown in (a), and the respective potencies of the bile acids/derivatives are listed in (c). (d–f) Activation of MRGPRX4 by various bile acids in cells loaded with the Ca2+ indicator Fluo-8 AM. (d) Representative images of MRGPRX4-expressing HEK293T cells (shown by mCherry fluorescence) before and after application of 10 μM DCA. (e) Representative traces of Ca2+ responses induced by application of 10 μM DCA, CA, CDCA, or LCA. n = 50 cells each. (g–h) MRGPRX4 is coupled to the Gq-PLC-Ca2+ signaling pathway. DCA (10 μM) evoked a robust Ca2+ signal in MRGPRX4-expressing HEK293T cells (g), left); this response was blocked by pretreating cells for 30 min with the PLC inhibitor U73122 (g), middle), but not the Gβγ inhibitor gallein (g), right). Triton X-100 was used as a positive control. The summary data are shown in (h); n = 7–10 cells each. Student’s t-test, ***p<0.001, and n.s. not significant (p>0.05). (i–k) Identification of key residues in MRGPRX4 that mediate ligand binding and receptor activation. (i) Primary sequence alignment of the human MRGPRX1, MRGPRX2, MRGPRX3, and MRGPRX4 proteins. The positions of the three amino acids in MRGPRX4 that were mutated to alanine are shown at the right. (j) Dose-dependent activation of wild-type (WT) MRGPRX4 and three MRGPRX4 mutants with the indicated point mutations was measured using the TGFα shedding assay. n = 1 experiment performed in triplicate. (k) Plasma membrane expression of Myc-tagged WT and mutant MRGPRX4 was measured using an anti-Myc antibody and normalized to WT MRGPRX4 expression. All error bars represent the s.e.m.
Figure 3—figure supplement 1
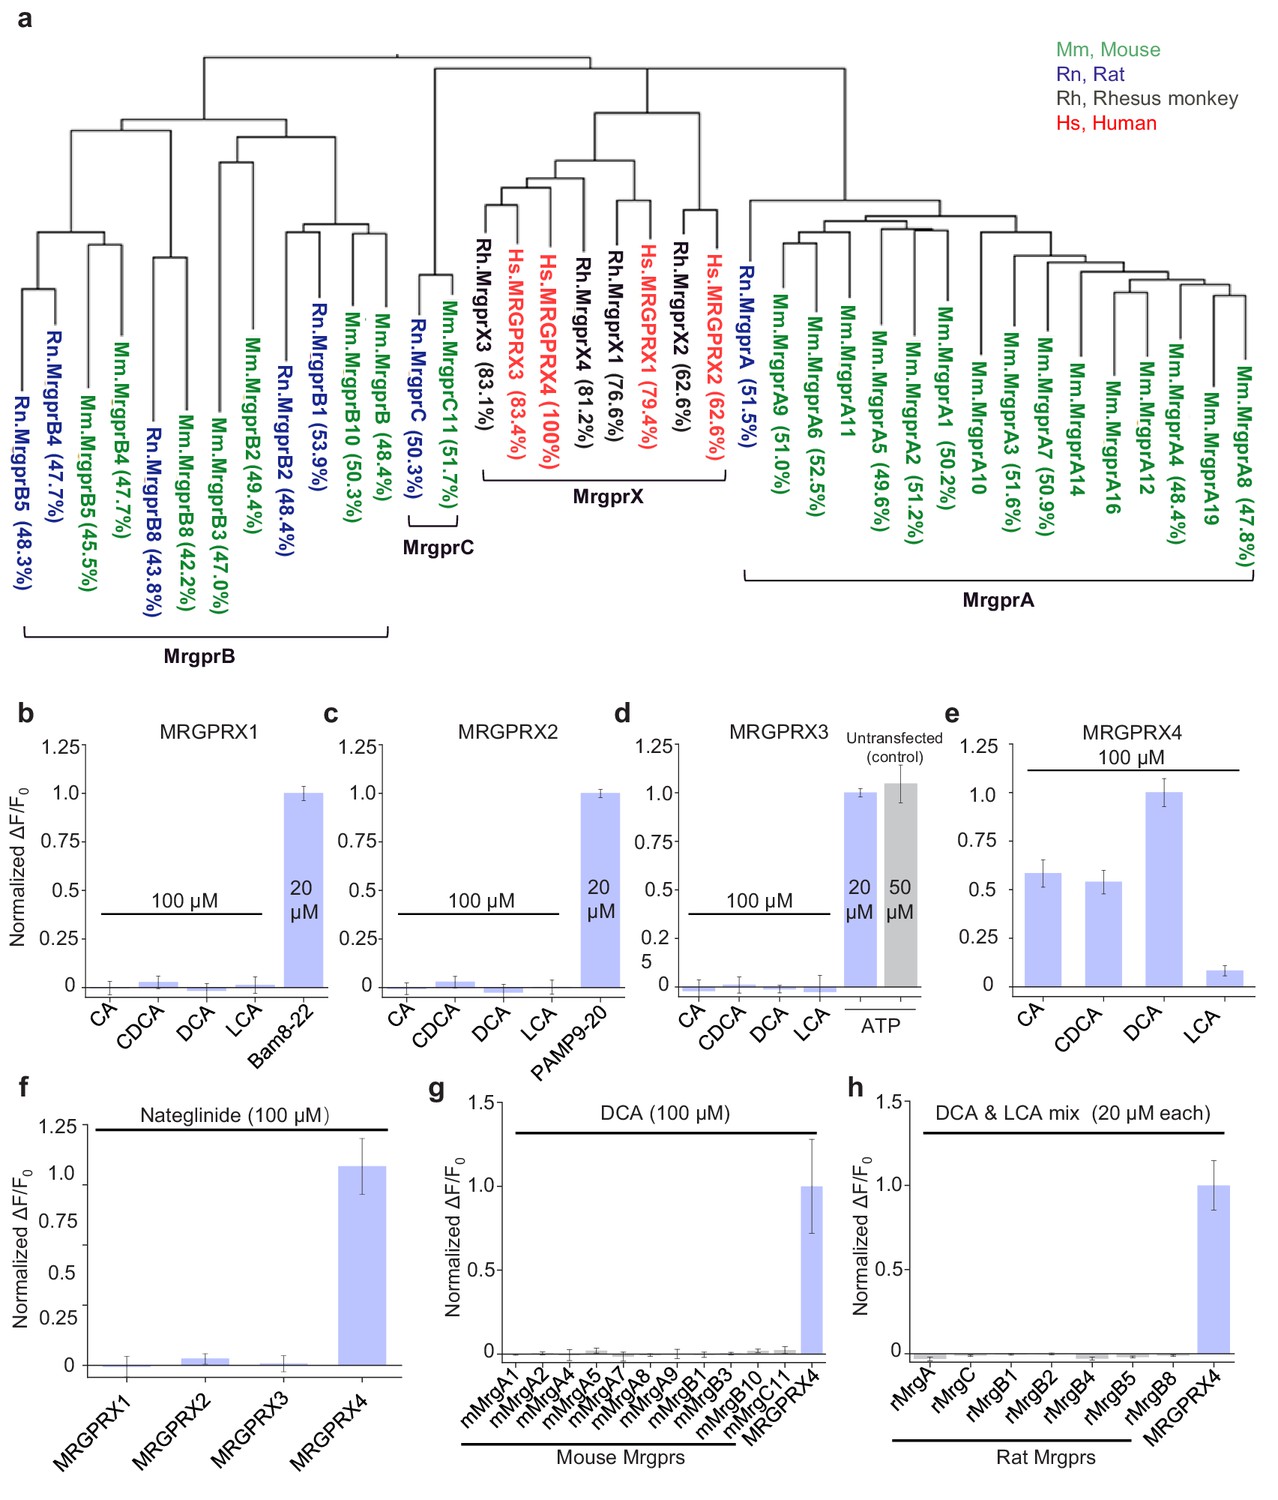
Human MRGPRX4, but not human MRGPRX1-3 or mouse and rat Mrgpr family members, are activated by bile acids.
(a) Phylogenetic analysis of mouse (Mm, green), rat (Rn, blue), rhesus monkey (Rh, black), and human (Hs, red) Mas-related GPCR (Mrg) family members. Amino acid sequence similarity compared to Hs. MRGPRX4 is shown in the parenthesis. (b–f) Activation of human MRGPRX1-4 by CA, CDCA, DCA, LCA and Nateglinide (100 μM each, n = 100 cells from two experiments). Human MRGPRX1-4 were stably expressed in HEK293T cells, and activation was measured using the Ca2+ indicator Fluo-8. Responses are normalized to Bam8-22 (20 μM), PAMP9-20 (20 μM), ATP (50 μM), and DCA (100 μM) for MRGPRX1, MRGPRX2, MRGPRX3, and MRGPRX4, respectively. The data for MRGPRX4 (e) are reproduced from Figure 3f. (g–h) Mouse and rat Mrgpr family members are not activated by DCA (100 μM, n = 6 cells) or a mixture of DCA and LCA mix (20 μM each, n = 50 cells). All error bars represent the s.e.m.
Figure 4 with 1 supplement
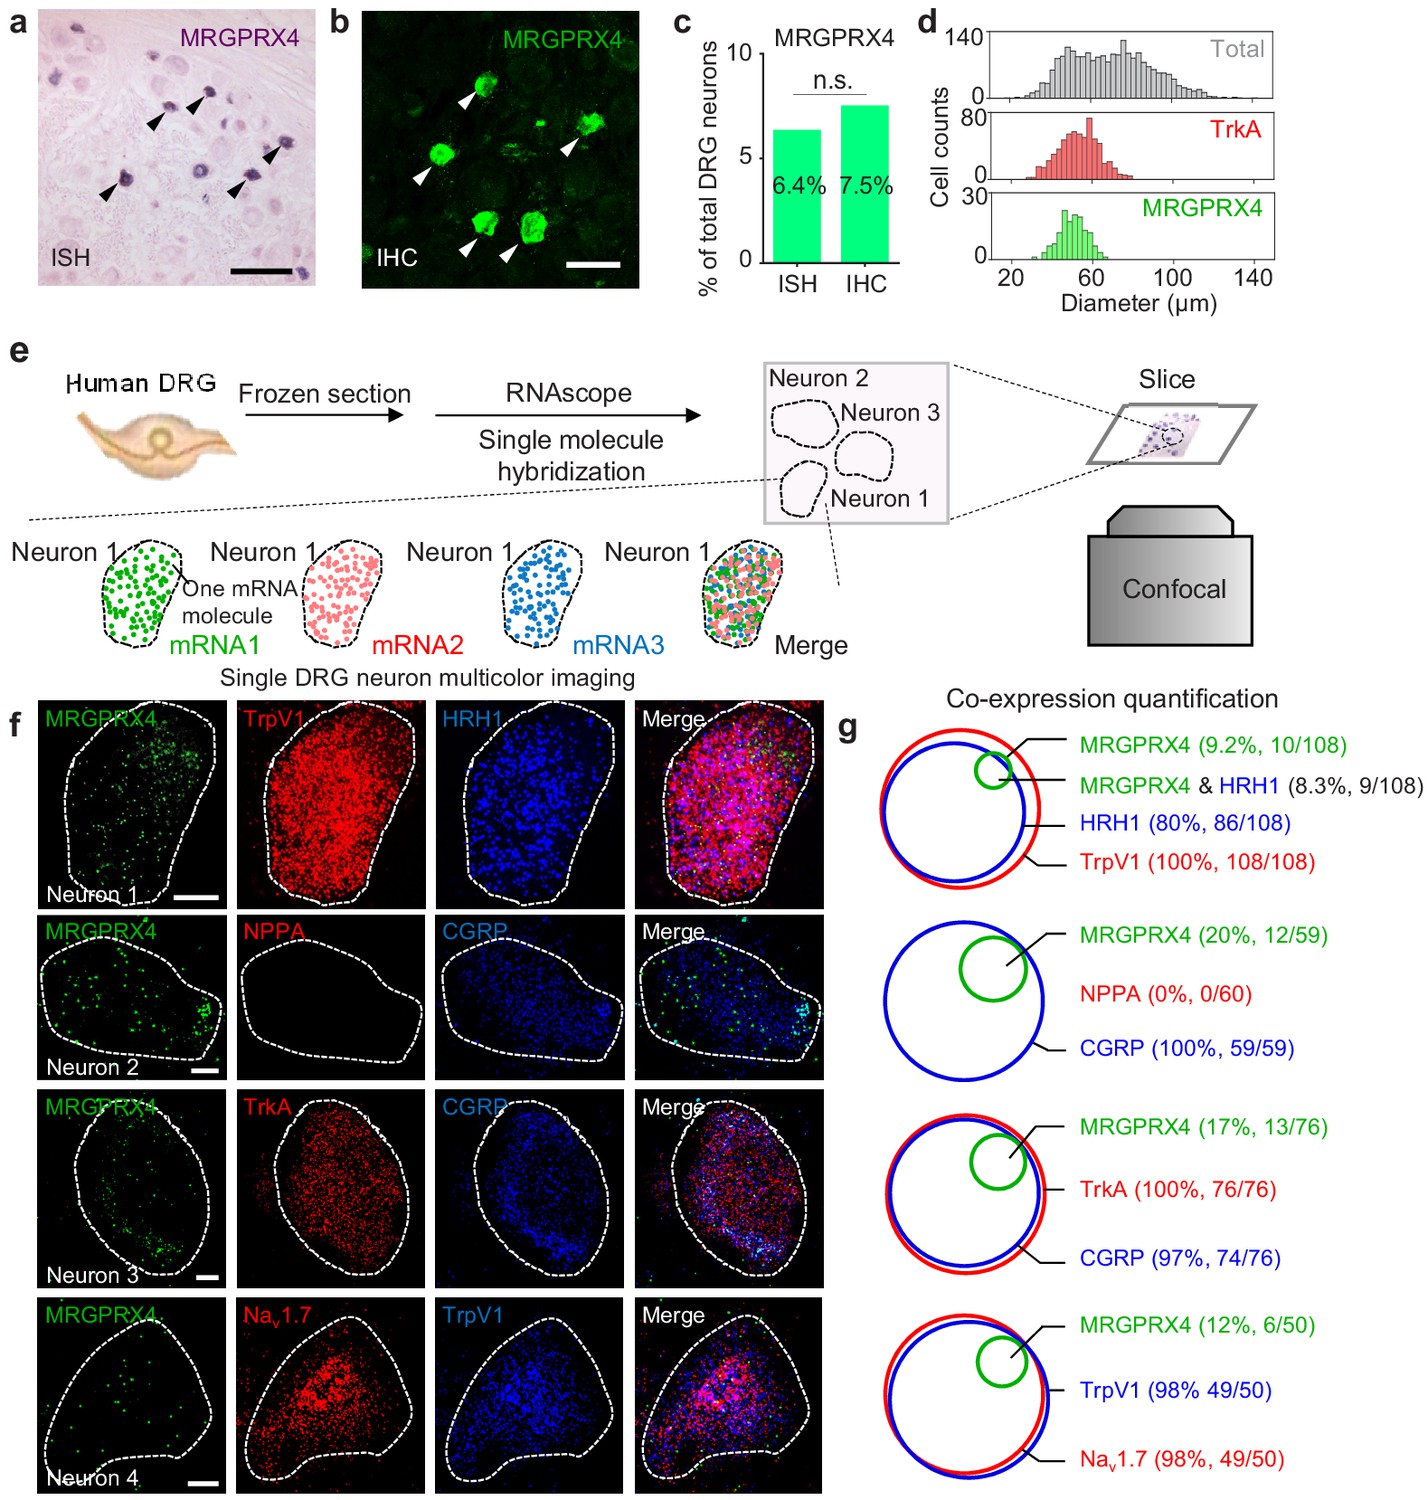
MRGPRX4 is expressed in a subset of hDRG neurons.
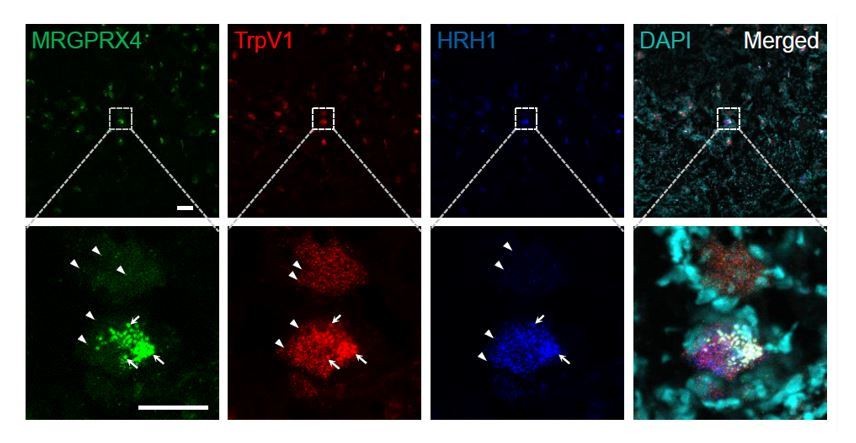
(a–d) Representative DRG sections showing in situ hybridization (ISH, (a) and immunohistochemistry (IHC, (b) for MRGPRX4; the summary data are shown in (c); n = 2234 and 2735 neurons for ISH and IHC, respectively. The scale bars represent 200 μm (a) and 100 μm (b). (d) Diameter distribution for all 2234 DRG neurons measured using in situ hybridization, 124 MRGPRX4-positive neurons, and 788 TrkA-positive neurons. Two-proportion z-test, n.s. not significant (p=0.103). (e) Flow chart depicting the steps for characterizing the gene expression profiles of human DRG samples using triple-color RNAscope in situ hybridization. (f) Representative RNAscope images of MRGPRX4 and other genes in human DRG sections. Each fluorescent dot indicates a single mRNA transcript. Scale bar, 10 μm. (g) Quantification of the gene expression data shown in (f). A neuron was defined as positive if ≥ 20 fluorescent dots in the respective mRNA channel were detected in that neuron.
Figure 4—figure supplement 1
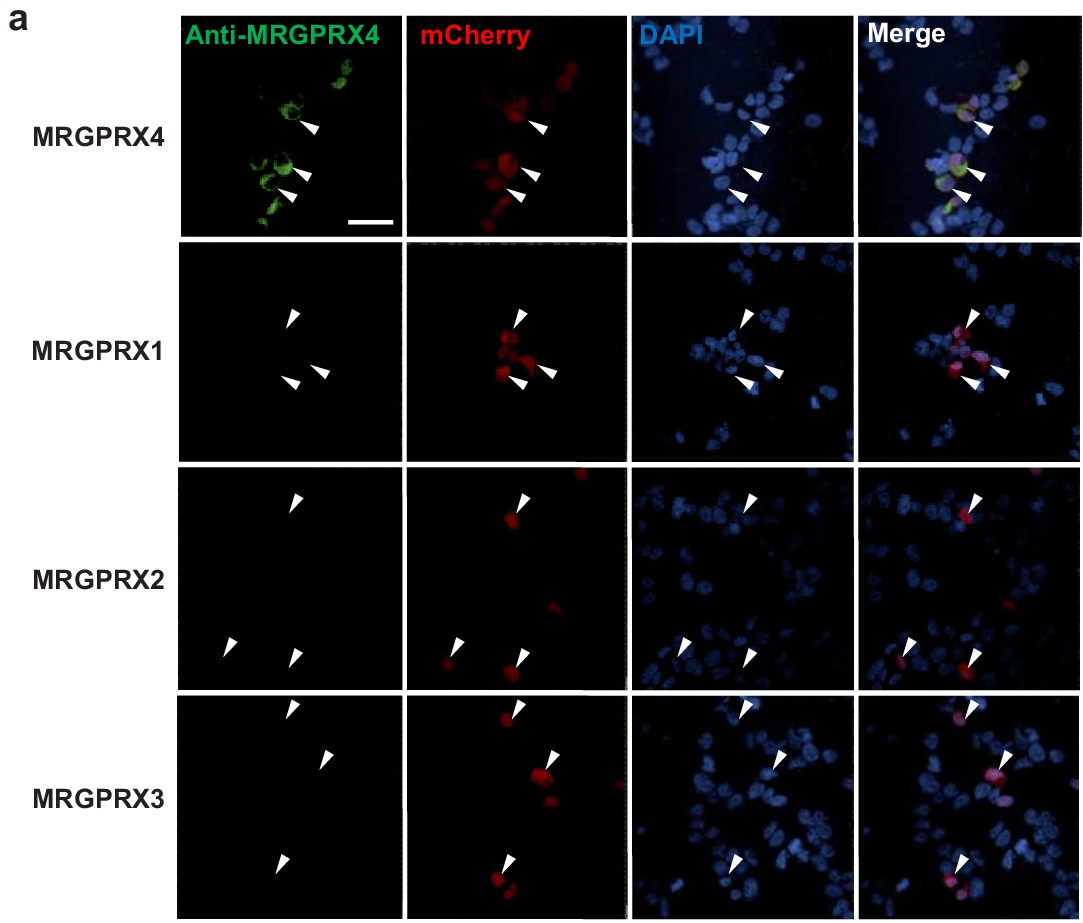
The anti-MRGPRX4 antibody has high specificity.
HEK293T cells were transiently transfected with MRGPRX1, MRGPRX2, MRGPRX3, or MRGPRX4. The anti-MRGPRX4 antibody (Abcam, ab120808, 1:200 dilution) specifically labeled MRGPRX4-expressing HEK293T cells, but not MRGPRX1-, MRGPRX2-, or MRGPRX3-expressing cells. Transfected cells were identified by mCherry fluorescence, and the nuclei were counterstained with DAPI. Scale bar, 50 μm.
Figure 5 with 2 supplements
MRGPRX4 mediates bile acids induced activation of DRG neurons.
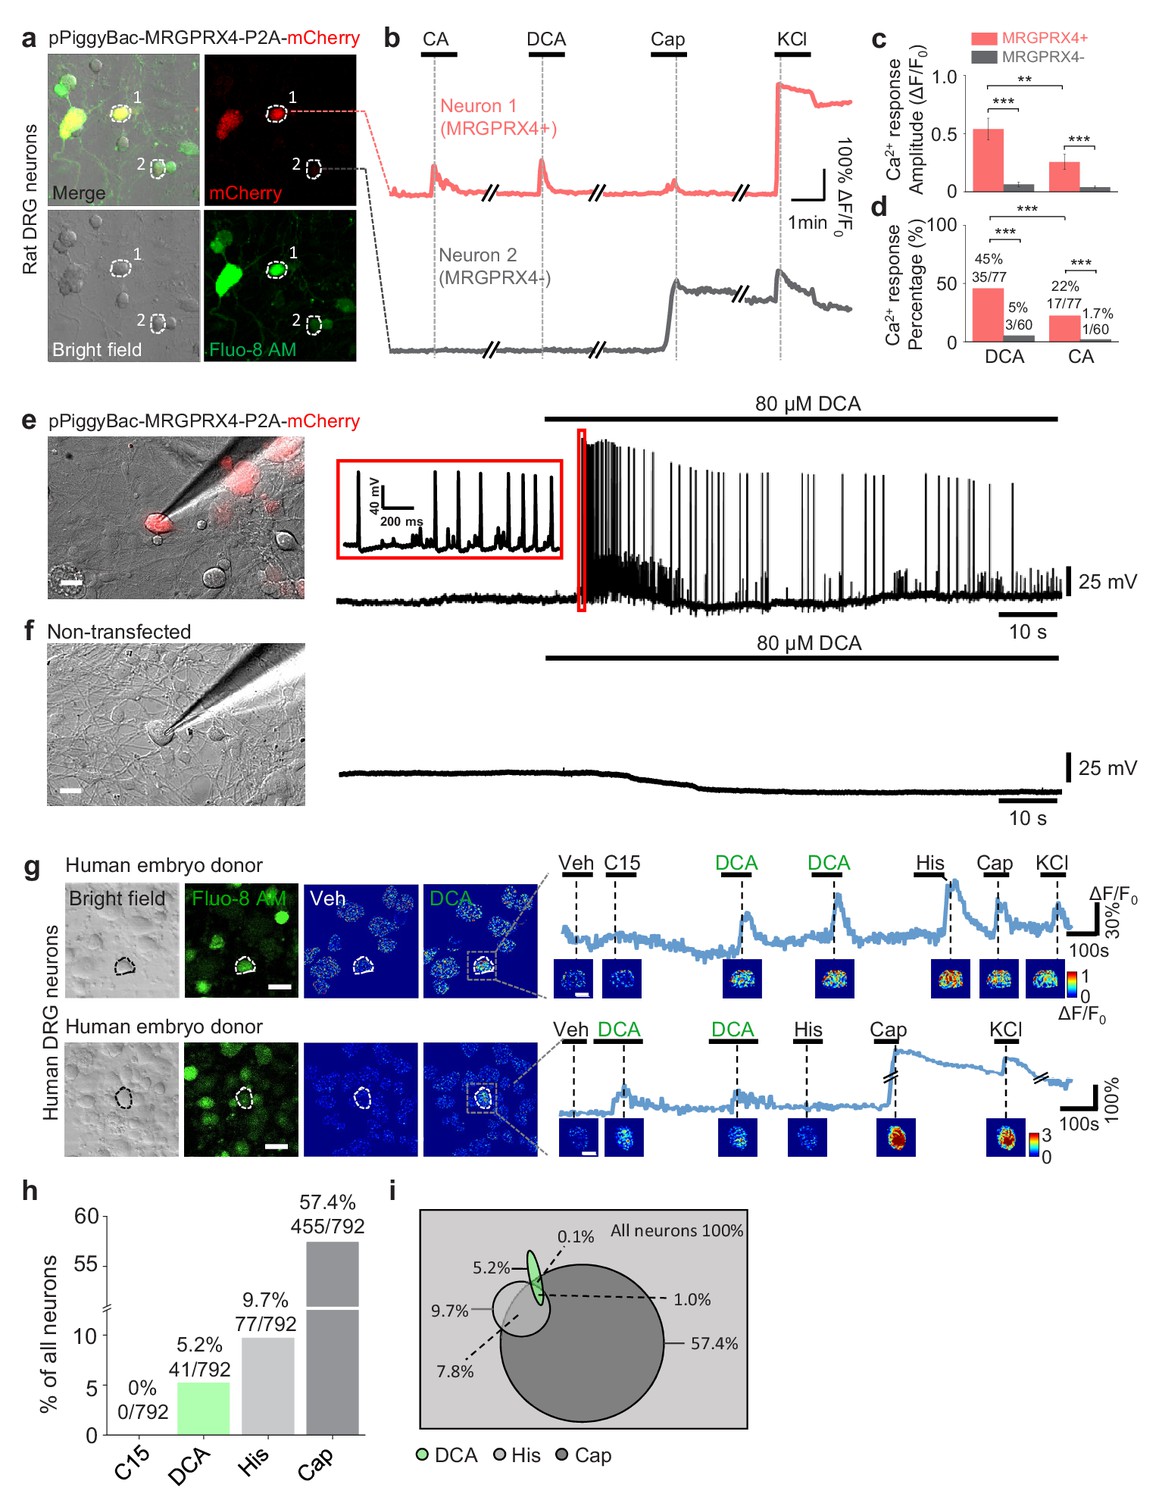
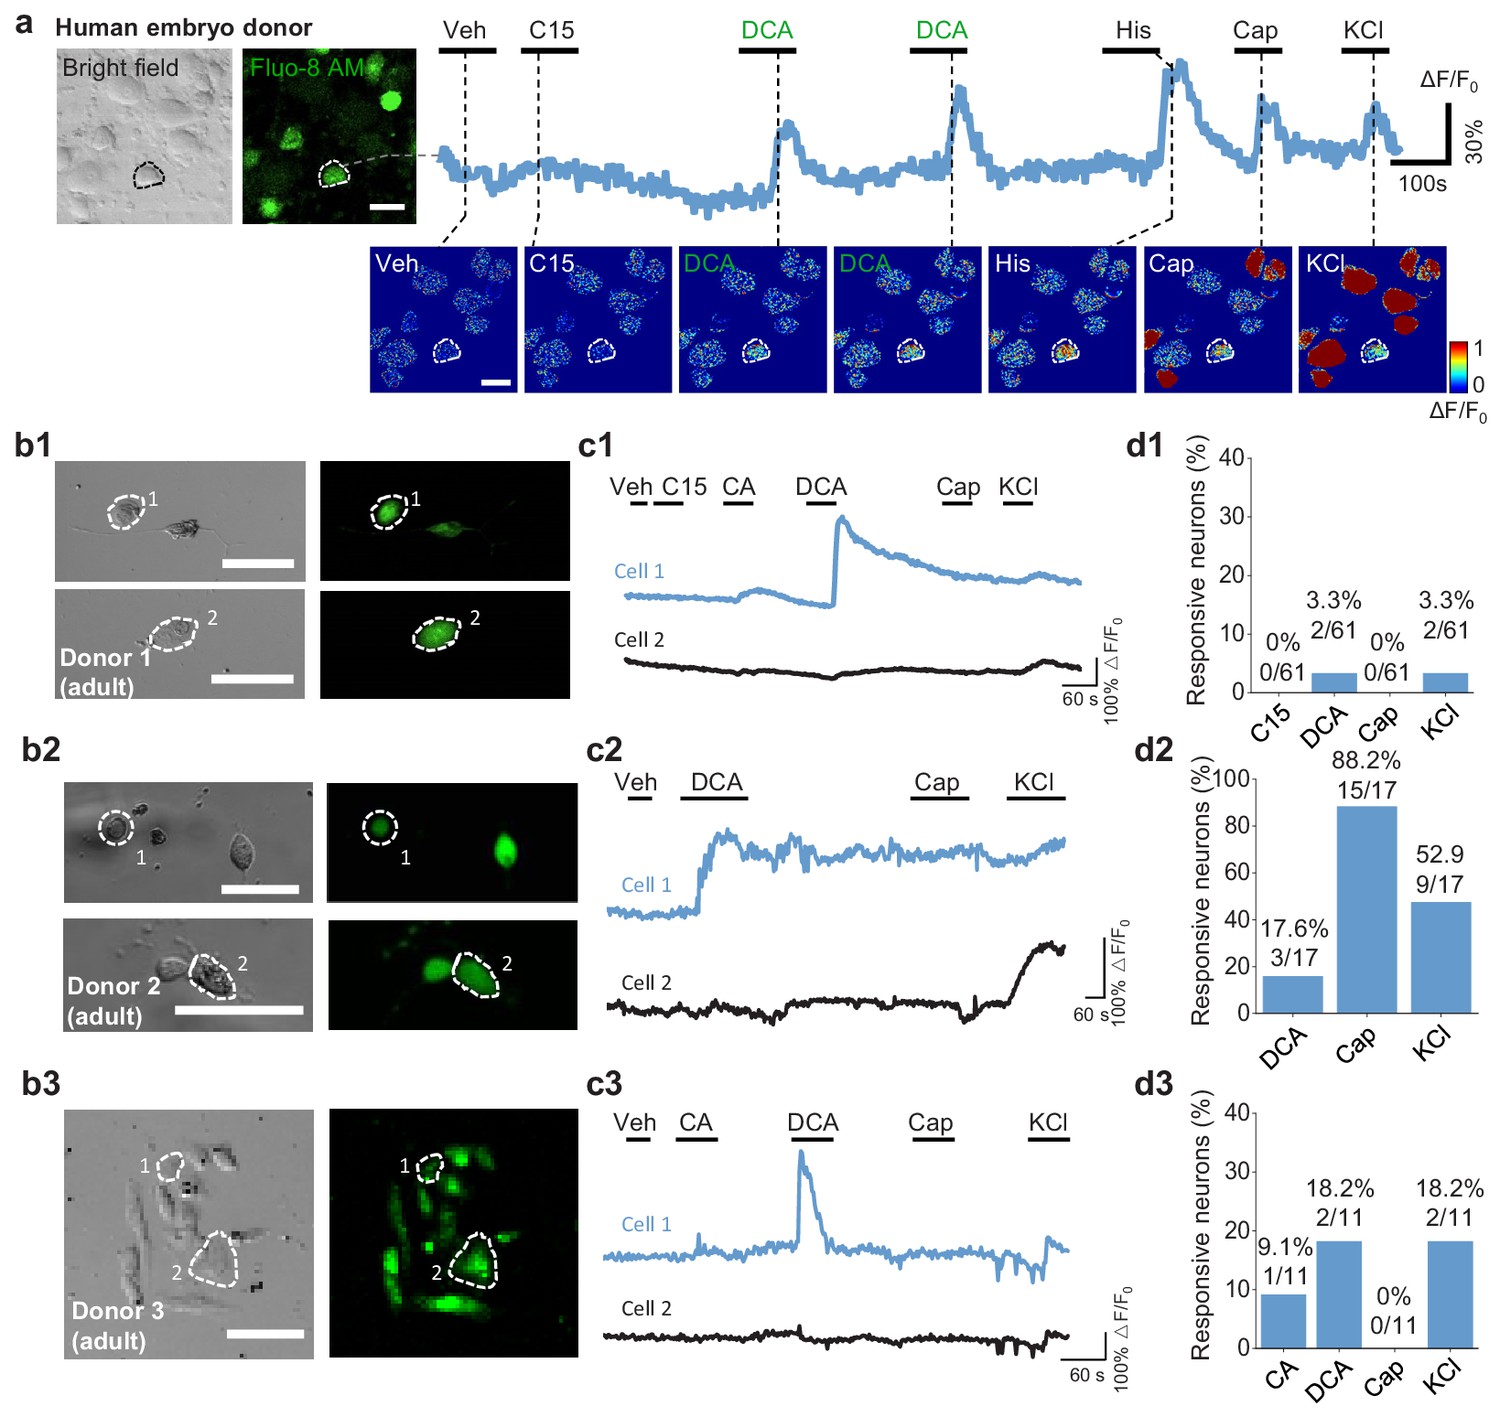
(a) Top, cultured rat DRG neurons were transfected with the pPiggyBac-CAG-MRGPRX4-P2A-mCherry plasmid by electroporation. The neurons circled by dashed lines are an MRGPRX4-positive neuron (neuron one with red fluorescence) and an MRGPRX4-negative neuron (neuron 2). (b) Representative traces from the cells indicated in (a). DCA and CA: 10 μM; capsaicin (Cap): 1 μM; KCl: 75 mM. (c, d) Summary of the amplitude and percentage of Ca2+ signals in response to DCA and CA from MRGPRX4-positive and MRGPRX4 negative neurons in (a, b). Responsive neurons were defined as exceeding a threshold of 20% ΔF/F0. n = 60–77 neurons per group. All error bars represent the s.e.m.. Student’s t-test and two-proportion z-test, **p<0.01, ***p<0.001. (e, f) Representative images and electrophysiological recording of DCA induced action potentials in cultured DRG neurons transfected with MRGPRX4. Cultured rat DRG neurons were transfected with the pPiggyBac-CAG-MRGPRX4-P2A-mCherry plasmid by electroporation. Red fluorescence indicated MRGPRX4-expressing neurons. DCA induced a series of action potentials in MRGPRX4-expressing cells (e) but not in non-transfected cells (f). Scale bar, 20 μm. (g) Bile acids induced a Ca2+ response in a subset of cultured human embryo DRG neurons. (left) Representative bright-field images and Fluo-8 fluorescence images of DRG neuron cultures from one embryo donor. The pseudo-color images show the DCA-induced calcium responses of all imaged neurons. (right) Representative traces of individual DCA-responsive DRG neurons (circled by the dash line in [left]). Pseudo-color images of chemical-induced signals are shown under each trace. C15 (compound 15), CA, DCA, and His (histamine): 100 μM each; KCl: 75 mM. Veh, vehicle. Scale bar, 50 μm. (h) Percentage of human embryo DRG neurons that were responsive to the indicated tested compounds measured as in (g). (i) Venn diagram of the cultured human embryo DRG neurons that were activated by the indicated tested compounds. Green represents DCA responded neurons; Heavy gray represents capsaicin responded neurons; light gray represents histamine responded neurons.
Figure 5—figure supplement 1
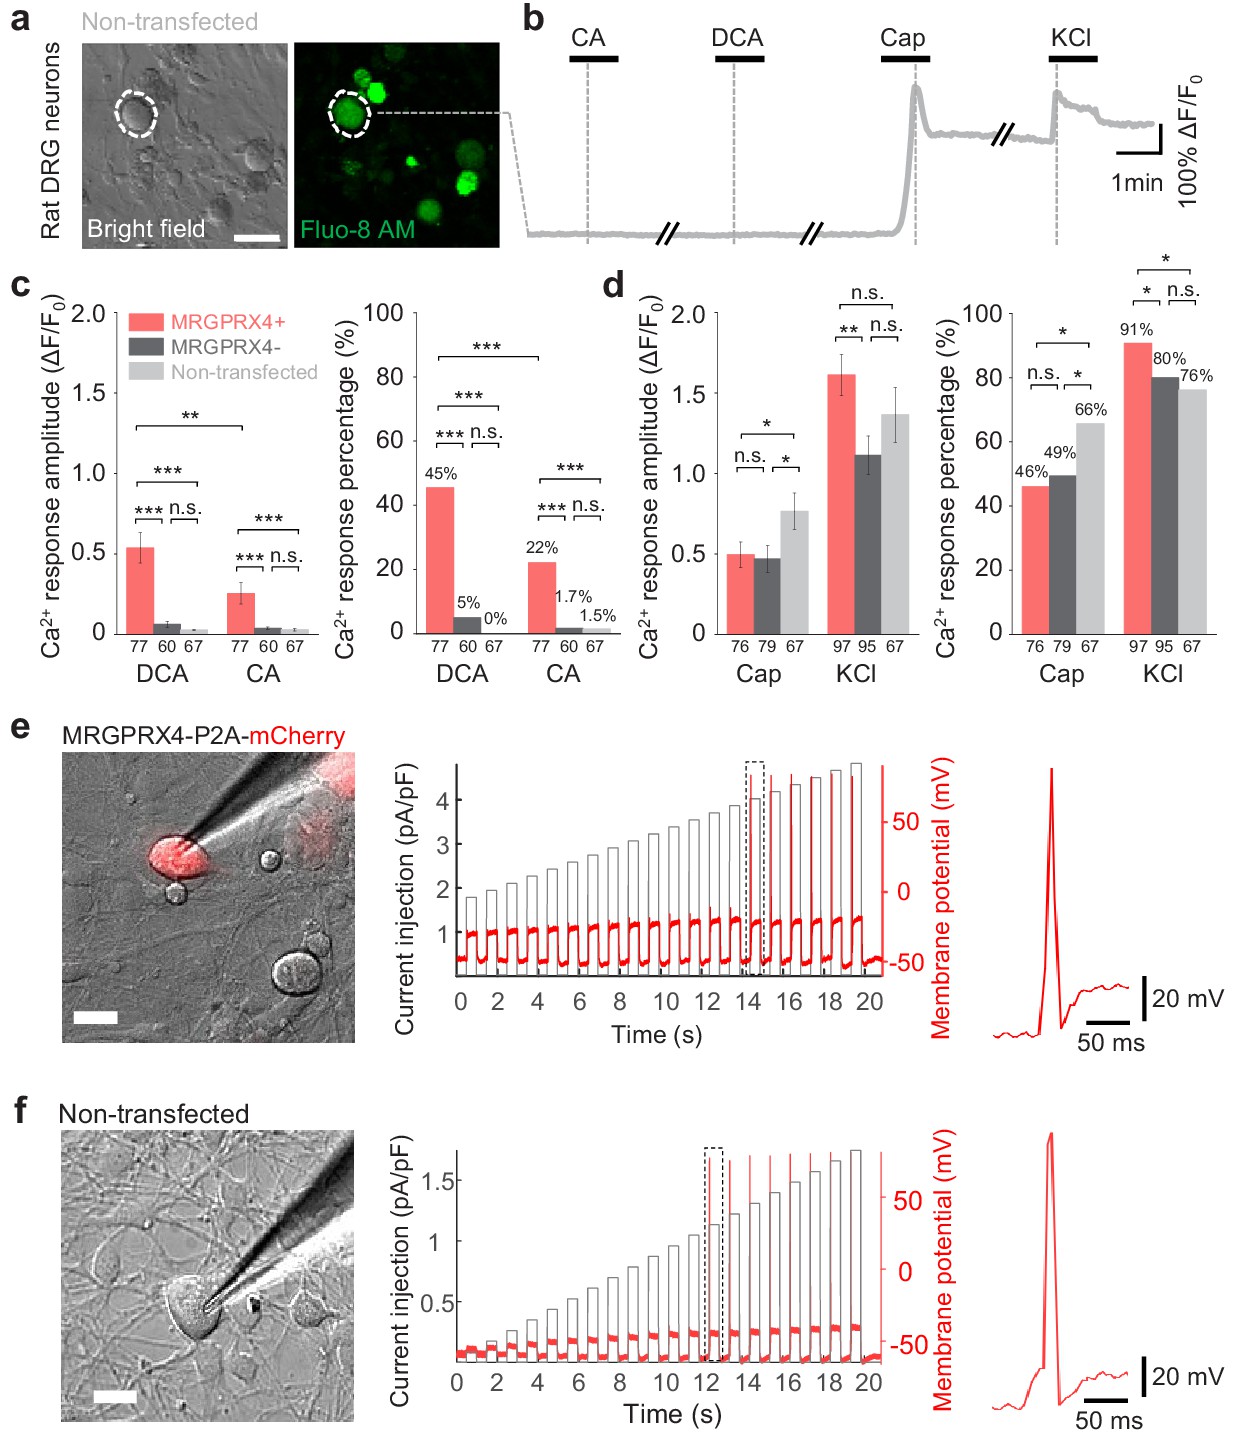
Expressing MRGPRX4 in cultured rat DRG neurons renders the cells responsive to bile acids.
(a) Non-transfected cultured rat DRG neurons. A representative neuron is circled by the dash line. Scale bar, 50 μm. (b) Representative traces from the cells indicated in (a). DCA and CA: 10 μM; capsaicin (Cap): 1 μM; KCl: 75 mM. (c, d) Summary and comparison of the amplitude and percentage of Ca2+ signals in response to DCA, CA, capsaicin and KCl in (a, b) and (Figure 5a, b). Responsive neurons were defined as exceeding a threshold of 20% ΔF/F0. n = 60–95 neurons per group. (The n numbers are labeled under each column). All error bars represent the s.e.m.. Student’s t-test and two-proportion z-test (Fisher’s exact test for the 0% percentage), *p<0.05, **p<0.01, ***p<0.001, and n.s. not significant (p>0.05). (e, f) Representative images and recording of electrical stimulation-induced action potentials in cultured DRG neurons from (Figure 5e, f) before DCA treatment. The representative single action potentials in the dotted box are shown in the right. Scale bar, 20 μm.
Figure 5—figure supplement 2
Cultured human DRG neurons respond to various chemicals.
(a) Full size pseudo-color images of chemical-induced signals from cultured human embryo DRG neurons (Figure 5g). (b1–b3) Representative bright-field and fluorescence images of cultured human adult DRG neurons from three donors. Scale bar, 50 μm. (c1–c3) Representative Ca2+ traces in response to the indicated test compounds measured in the cells shown in (b1–b3). Veh, vehicle. Compound 15 (C15), CA and DCA: 100 μM; histamine (His): 50 μM; capsaicin (Cap): 1 μM; KCl: 75 mM. (d1–d3) Summary of the percentage of neurons that responded to the indicated test compounds (defined as exceeding a threshold of > 20% ΔF/F0).
Figure 6

Bile acids and MRGPRX4 specific agonist induce histamine-independent itch in human.
(a1–a2) Itch evoked by a double-blind intradermal injection of DCA and nateglinide (Nat) in human subjects. (25 μl for each injection) (a1) Time courses of the perceived itch intensity (n = 18–32). The traces are plotted with the standard error of the mean (s.e.m.) at the peak of each trace. The descriptions of the itch intensity are shown on the right. The injection sites on the subject’s forearm are indicated (inset). X4, MRGPRX4 (a2) Summary of the area-under-curve (AUC) of the itch intensity traces shown in (a1). (b1–b2) Itch evoked by the indicated doses of DCA (25 μl for each injection, n = 8–14). The linear regression analysis of concentration versus the AUC is showed as a red line. (c1–c2) Itch evoked by CDCA, CA, TCDCA, and LCA (25 μl for each injection, n = 10–31). The vehicle data (Veh) is reproduced from (a1). (d1–d2) DCA-evoked itch is not inhibited by antihistamine (Anti-His). (d1) Time course of itch intensity evoked by an intradermal injection of DCA or histamine (His) following antihistamine or placebo pretreatment (25 μl for each injection, n = 12–14). Each pair of dots connected by a gray line represents an individual subject. All error bars represent the s.e.m.. Student’s t-test, *p<0.05, **p<0.01, ***p<0.001, and n.s. not significant (p>0.05).
Figure 7 with 1 supplement
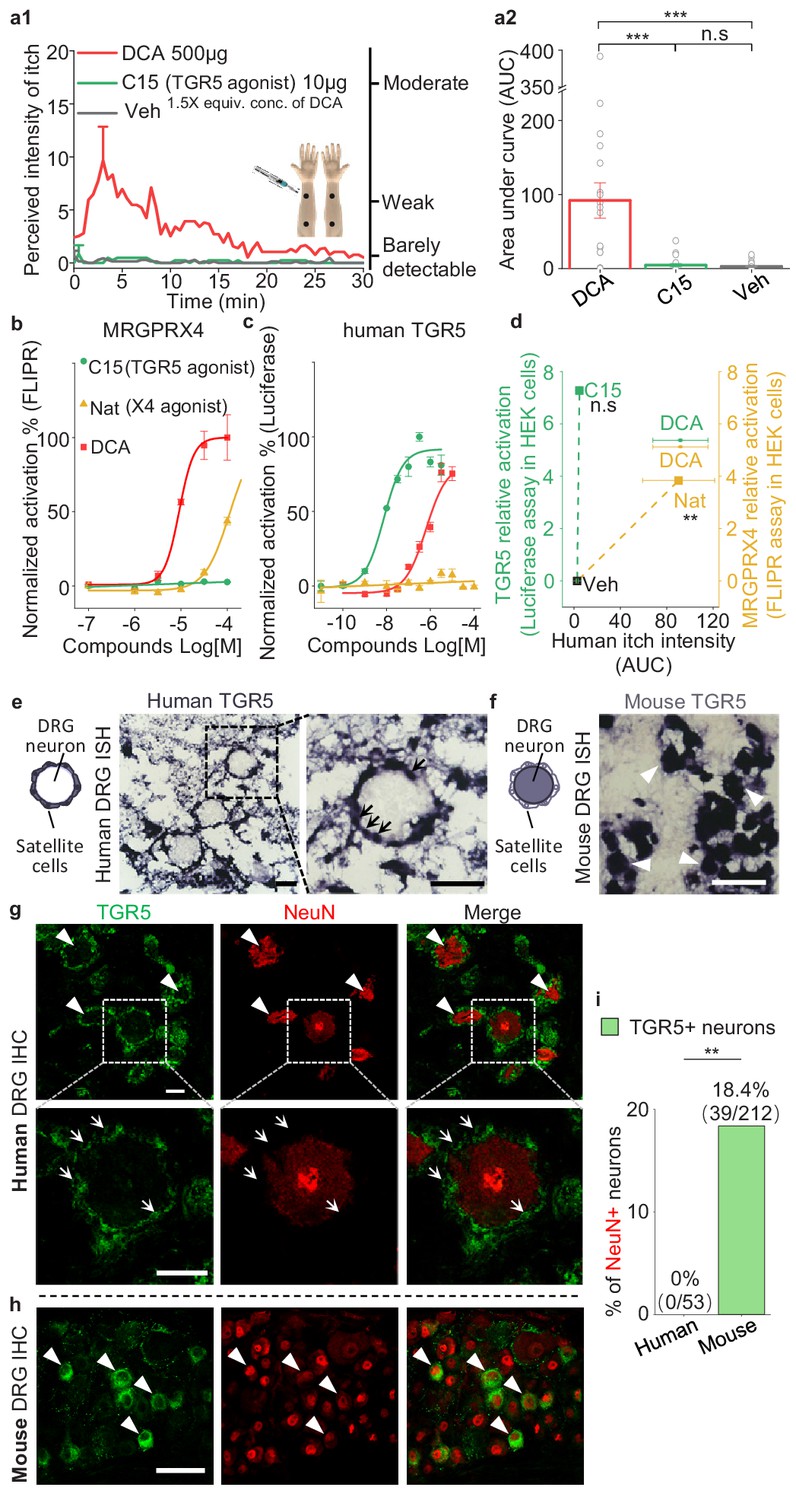
TGR5 does not serve as an itch receptor in human.
(a1–a2) Intradermal injection of a non-bile acid TGR5 agonist compound 15 (C15) does not induce itch in human. (a1) Time courses of the perceived intensity of itch evoked by DCA and vehicle are reproduced from Figure 5a1, and the itch evoked by C15 is from 19 subjects. The equivalent concentration (equiv. conc.) of DCA and C15 means the fold of concentration to the EC50 of activating human TGR5. (a2) The quantification results of area under curve (AUC) of itch intensity shown in (a1) (mean ± s.e.m.). Veh, vehicle. Student’s t-test, ***p<0.001, and n.s. not significant (p>0.05). (b–c) The activation of human MRGPRX4 (b) or human TGR5 (c) by DCA (red), compound 15 (C15, green) and nateglinide in MRGPRX4- or TGR5-expressing HEK293T cells detected by FLIPR and luciferase assay respectively. (d) The relationship between the evoked itch and the relative potency to activate human MRGPRX4 or human TGR5 by the specific agonists of these two receptors. The Y-axis shows the relative activation of certain compound to the receptor, representing the logarithm of (maximal response/EC50). The X-axis shows the human itch intensity, representing the AUC of itch evoked by certain compound. Statistic test was performed between the itch intensity of compound 15 and vehicle, or between the itch intensity of nateglinide and vehicle. Nat, nateglinide; C15, compound 15; Veh, vehicle. Student’s t-test, **p<0.01, and n.s. not significant (p>0.05) versus vehicle treatments. (e) In situ hybridization (ISH) of TGR5 in human DRG sections. (left) The diagram depicting the morphology of DRG neurons and surrounding satellite glial cells. (middle and right) TGR5 was highly expressed in satellite glial cells (indicated by arrows) but not DRG neurons in human DRG. Scale bar, 50 μm. (f) In situ hybridization of TGR5 in mouse DRG sections. TGR5 was highly expressed in DRG neurons (indicated by arrow heads) in mouse DRG. Scale bar, 50 μm. (g–h) Immunohistochemistry (IHC) of human and mouse DRG sections. (g) In human DRG, TGR5 was expressed in satellite glial cells (indicated by arrows) but not in neurons (marked by NeuN, indicated by arrow heads). (h) In mouse DRG, TGR5 was expressed in neurons (marked by NeuN, indicated by arrow heads). Scale bar, 50 μm. (i) Quantification of the percentage of TGR5+ neurons (over NeuN+ neurons) in human and mouse DRG (immunohistochemistry). Chi-square test, **p<0.01. All error bars represent the s.e.m.
Figure 7—figure supplement 1
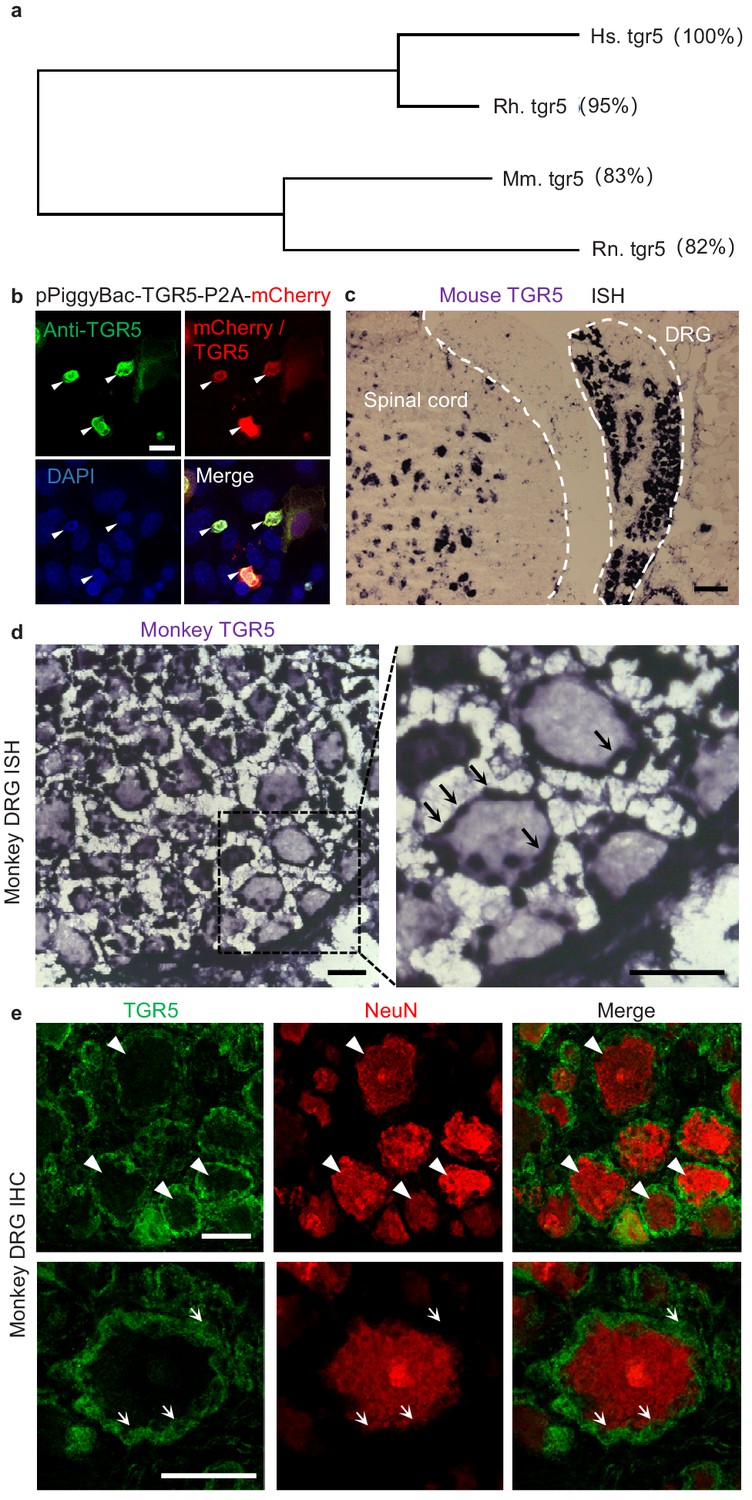
Expression of TGR5 in mouse and monkey DRG.
(a) Phylogenetic analysis of mouse (Mm.), rat (Rn.), rhesus monkey (Rh,) and human (Hs,) TGR5. Amino acid sequence similarity compared to Hs. TGR5 is shown in the parenthesis. (b) The HEK293T cells were transiently transfected with human TGR5 expression vector (pPiggyBac-TGR5-P2A-mCherry). The anti-TGR5 antibody can specifically labeled the TGR5-expressing cells identified by the mCherry signal. The nuclei were counterstained with DAPI. Arrow heads indicate the representative TGR5-expressing cells. Scale bar, 20 μm. (c) In situ hybridization (ISH) of TGR5 in mouse showing the morphology of mouse DRG and the adjacent spinal cord. Scale bar, 100 μm. (d) In situ hybridization of TGR5 in monkey (Macaca mulatta) DRG sections. TGR5 was highly expressed in satellite glial cells (indicated by arrows). Scale bar, 50 μm. (e) Immunohistochemistry (IHC) of monkey DRG sections. TGR5 was expressed in satellite glial cells (indicated by arrows) but not neurons (marked by NeuN, indicated by arrow heads). Scale bar, 50 μm.
Figure 8 with 1 supplement
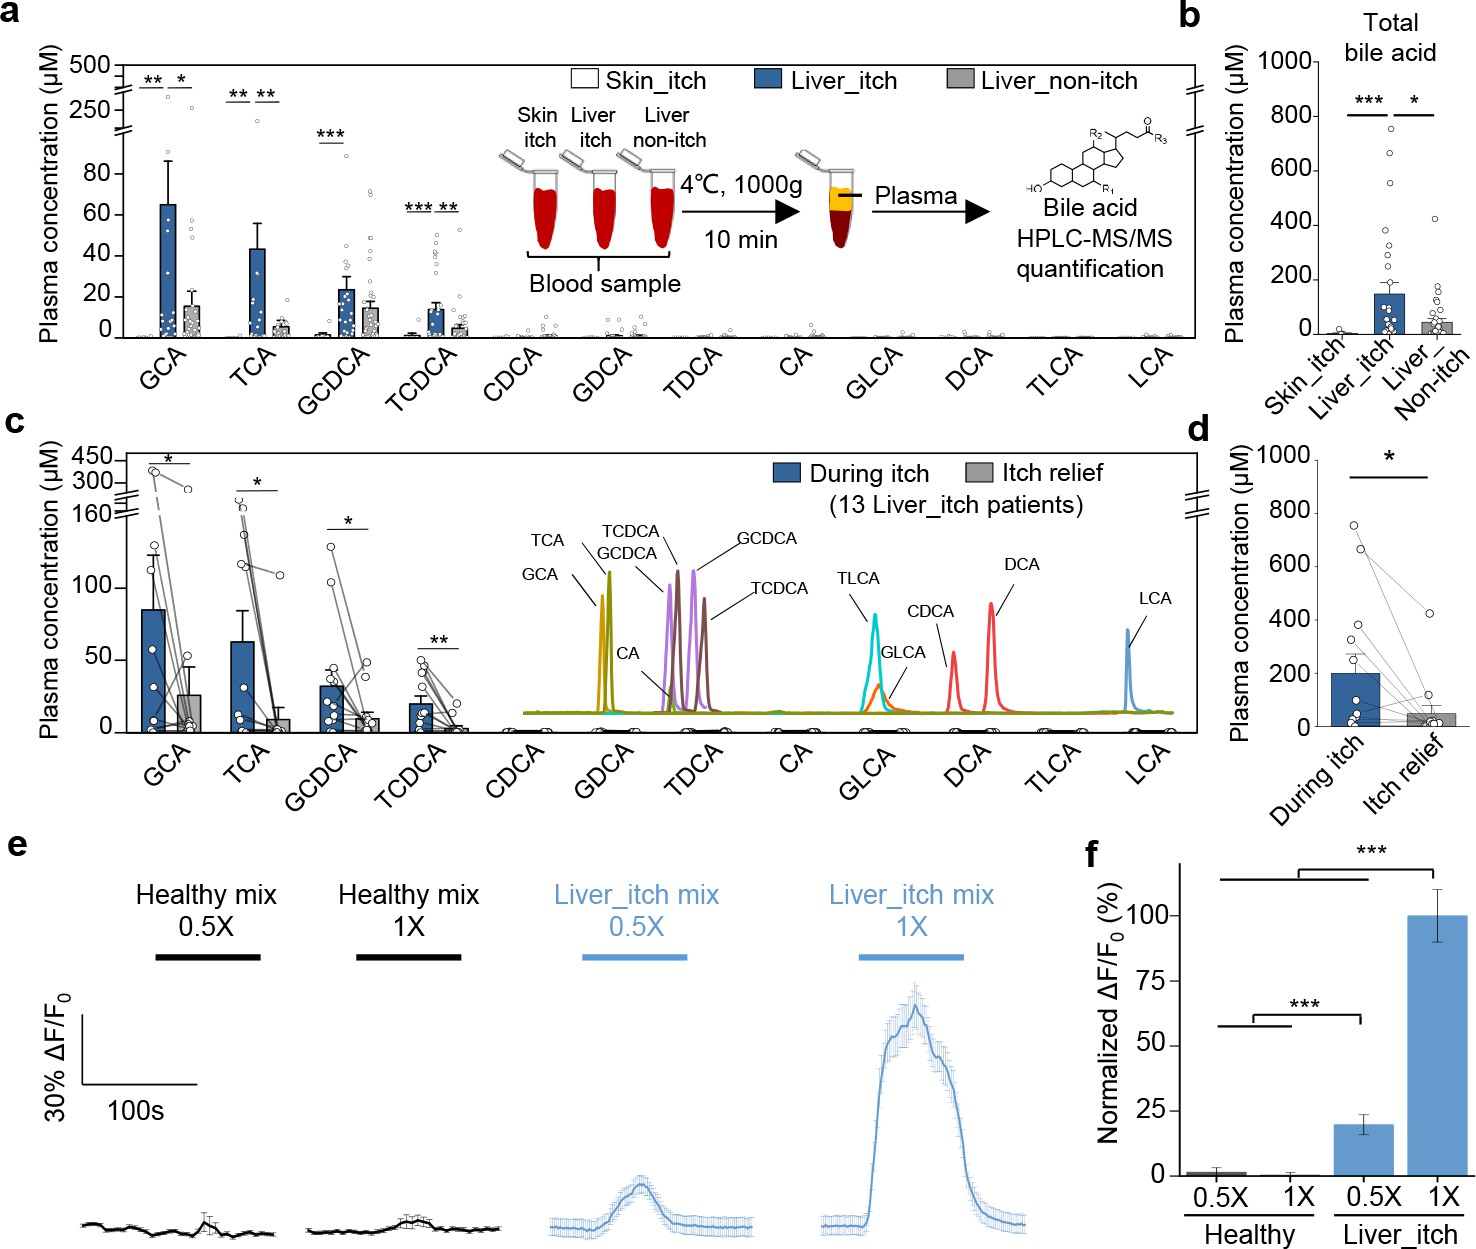
Elevated bile acids are correlated with the occurrence of itch among patients with liver disease and are sufficient to activate MRGPRX4.
(a–b) Summary of individual bile acid levels (a) and total bile acid levels (b), the sum of the 12 bile acids shown in a) in itchy patients with liver diseases (Liver_itch, n = 27), non-itchy patients liver with diseases, (Liver_non-itch, n = 36), and itchy patients with dermatic diseases (Skin_itch, n = 8). The plasma bile acid levels were measured using HPLC-MS/MS (inset). (c–d) Summary of individual bile acid levels (c) and total bile acid levels (d), the sum of the 12 bile acids shown in c) in 13 patients with liver diseases during itch and after itch relief. The inset shows the separation of standard bile acids by HPLC-MS/MS. (e–f) Left, Ca2+ responses in MRGPRX4-expressing HEK293T cells induced by application of a mixture of artificial bile acids derived from itchy patients with liver diseases and healthy subjects. The Ca2+ signal was measured using Fluo-8 and was normalized to the signal measured using the 1x liver_itch mix. The summary data are shown in (f); n = 50 cells each. All error bars represent the s.e.m.. Student’s t-test, *p<0.05, **p<0.01, ***p<0.001.
Figure 8—figure supplement 1
Quantification of bile acids in human plasma.
(a) Standard curve of 12 bile acids quantified by HPLC-MS/MS. All the 12 bile acids show good linear correlation between the MS response and the concentration (0.1–1 μM). (b) Quantification results of 8 bile acids shown in Figure 7a. (c) Quantification results of 8 bile acids shown in Figure 7c. All error bars represent the s.e.m.. Student’s t-test, *p<0.05, and n.s. not significant (p>0.05).
Figure 9
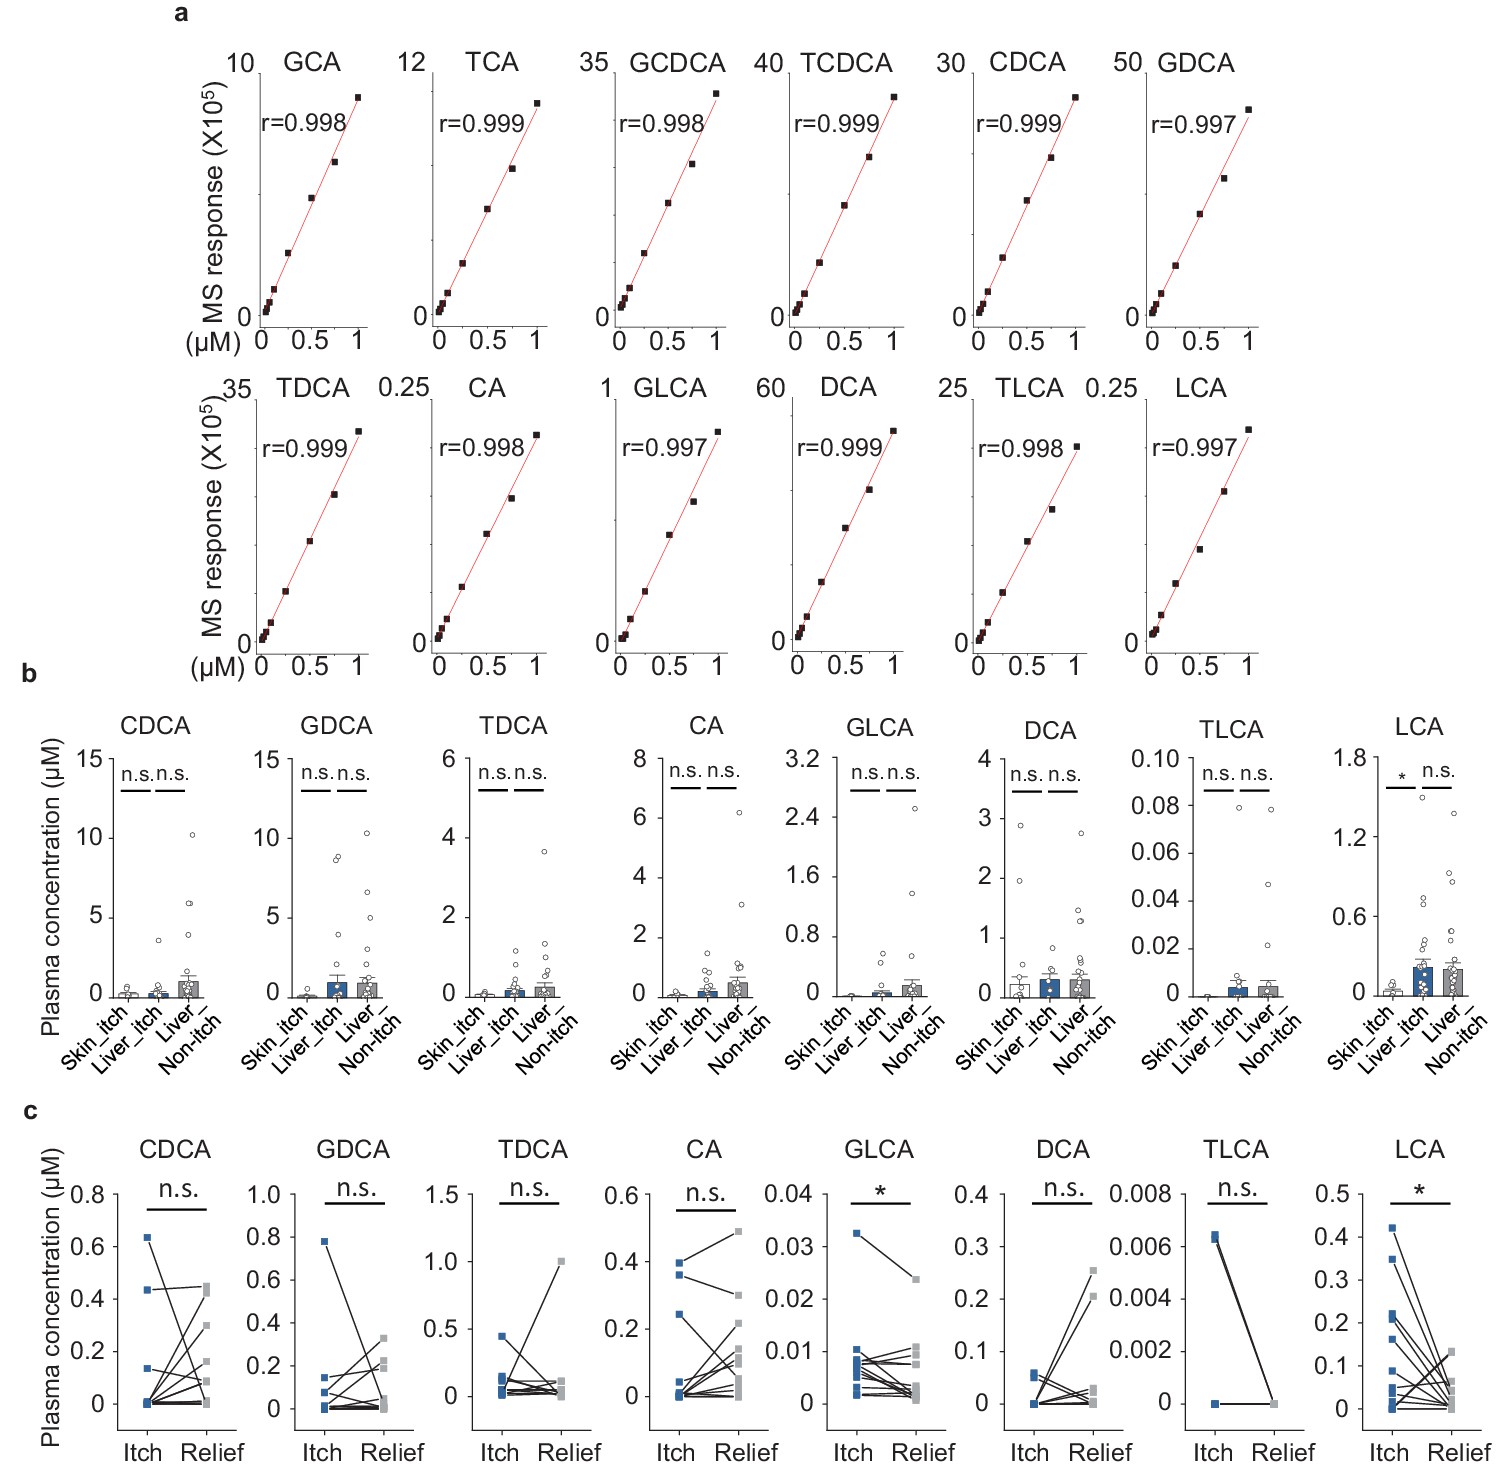
Bilirubin potentiates the activation of MRGPRX4 by bile acids and may contribute to cholestatic itch.
(a) Comparison of the activation of MRGPRX4 by DCA, bilirubin and taurine conjugated bilirubin. Taurine conjugated bilirubin was used in order to mimic the direct bilirubin under human physiological condition. MRGPRX4 was expressed in HEK293T cells and the activation was measured by FLIPR assay. (b) Bilirubin allosterically modulates the activation of MRGPRX4 by DCA. Different concentrations of bilirubin was mixed with DCA, and then the activation of MRGPRX4 by these mixes was tested in MRGPRX4-expressing HEK293T cells using FLIPR assay. (c) DCA allosterically modulates the activation of MRGPRX4 by bilirubin, similar to (b). (d) Cultured rat DRG neurons were transfected with the PiggyBac-CAG-MRGPRX4-P2A-mCherry plasmids by electroporation. The neurons circled by dashed lines are an MRGPRX4-positive neuron (neuron one with red fluorescence) and an MRGPRX4-negative neuron (neuron 2). Scale bar, 20 μm. (e) Representative traces from the cells indicated in (d). Bilirubin and DCA: 100 μM; KCl: 75 mM. (f–g) Summary of the amplitude (f) and percentage (g) of Ca2+ signals in response to bilirubin and DCA. Responsive neurons were defined as exceeding a threshold of 10% ΔF/F0. n = 136–310 neurons per group. (h) Comparison of total bilirubin, direct bilirubin (conjugated) and indirect bilirubin (unconjugated) level in liver disease patients with itch (Liver_itch) (n = 30) or without itch (Liver_Non-itch) (n = 34), or patients with dermatic itch (Skin_itch) (n = 6). (i) Comparison of total bilirubin, direct bilirubin and indirect bilirubin level in liver disease patients (n = 12) during itch and after itch relief. (j) Correlation between itch intensity and plasma total bile acid, total bilirubin, direct bilirubin, and indirect bilirubin. The itch intensity was directly reported by patients via a questionnaire with 0 representing no itch and 10 the highest level of itch. All error bars represent the s.e.m.. (a-c) One-way ANOVA, *p<0.05, **p<0.01, ***p<0.001, and n.s. not significant (p>0.05). (f-j) Student’s t-test and two proportion z-test, *p<0.01, **p<0.01, ***p<0.001, and n.s. not significant (p>0.05).
Figure 10

Proposed model depicting the mechanism underlying itch in patients with liver diseases.
In itchy patients, accumulated bile acids reach the skin via the circulatory system, where they activate nerve fibers of a subset of MRGPRX4-expressing DRG neurons. Bilirubin, as a partial agonist, facilitates the activation of MRGPRX4 by bile acids. These activated neurons relay the itch signal to the spinal cord and higher brain centers, eliciting the sensation of itch.
Author response image 1
Representative large-scale RNAscope images of human DRG.
Each fluorescent dot indicated by an arrowhead represents one single mRNA transcript. The large fluorescent dots indicated by arrows are non-specific background (positive for all three channels). Scale bar, 100 μm and 50 μm.
Tables
Key resources table
| Reagent type (species) or resource | Designation | Source or reference | Identifiers | Additional information |
|---|---|---|---|---|
| Gene (H. sapiens) | MRGPRX4 | hORFeome Database | Genbank Accession: KJ900052 | |
| Gene (H. sapiens) | TGR5 | hORFeome Database | Genbank Accession: KJ895655 | |
| Cell line (Homo-sapiens) | HEK stable cell line for TGFα shedding assay | PMID: 22983457 | Self-generated according to reference paper | |
| Chemical compound, drug | Screen Quest Fluo-8 No Wash Calcium Assay Kit | AAT Bioquest | Cat. #: 36316 | |
| Chemical compound, drug | Fluo-8, AM | AAT Bioquest | Cat. #: 21083 | |
| Chemical compound, drug | Deoxycholic acid | Sigma-Aldrich | Cat. #: D2510 | |
| Chemical compound, drug | U73122 | Selleck | Cat. #: S8011 | |
| Chemical compound, drug | Nateglinide | J and K Scientific | Cat. #: 586681 | |
| Chemical compound, drug | Bilirubin ditaurate | J and K Scientific | Cat. #: F-H130 | |
| Chemical compound, drug | Compound 15 | custom- synthesized | Verified by HPLC and mass spectrum | |
| Chemical compound, drug | Histamine | Sigma-Aldrich | Cat. #: H7250 | |
| Antibody | Rabbit polyclonal anti-hMRGPRX4 | Abcam | Cat #: ab120808 | IHC (1:200) |
| Antibody | Rabbit polyclonal anti-hTGR5 | Thermofisher | Cat #: PA5-27076 RRID:AB_2544552 | IHC (1:200-1:500) |
| Antibody | Mouse monoclonal anti-NeuN (clone A60) | Sigma-Aldrich | Cat. #: MAB377 RRID:AB_2298772 | IHC (1:1000) |
| Antibody | Rabbit polyclonal anti-c-Myc | Sigma-Aldrich | Cat. #: C3956 RRID: AB_439680 | IHC (1:200) FACS (1:50) |
| Antibody | Sheep polyclonal anti-Digoxigenin-AP | Roche | Cat. #: 11093274910 RRID:AB_2734716 | ISH (1:1000) |
| Commercial assay or kit | RNAscope Fluorescent Multiplex Assay | Advanced Cell Diagnostics | Cat. #: 320293 UM | |
| Commercial assay or kit | P3 Primary Cell 4D-NucleofectorTM X Kit L | Lonza | Cat. # V4XP-3012 | |
| Recombinant DNA reagent | pPiggyBac-MRGPRX4-P2A-mCherry (Plasmid) | This paper | See in Figure 1—figure supplement 1a | |
| Recombinant DNA reagent | pPiggyBac-TGR5-P2A-mCherry (Plasmid) | This paper | See in Figure 1—figure supplement 1a | |
| Other | Doxepin hydrochloride cream | Chongqing Huapont Pharm. Co. | ||
| Other | Cold cream | Eau Thermale Avène |
Additional files
-
Supplementary file 1
Genes that are highly expressed in human DRG.
- https://doi.org/10.7554/eLife.48431.020
-
Supplementary file 2
GPCRs expression profiling in human DRG.
Red labeled genes are candidate GPCRs that are highly expressed in human DRG. The blue labeled gene is TGR5.
- https://doi.org/10.7554/eLife.48431.021
-
Transparent reporting form
- https://doi.org/10.7554/eLife.48431.022
Download links
A two-part list of links to download the article, or parts of the article, in various formats.
Downloads (link to download the article as PDF)
Open citations (links to open the citations from this article in various online reference manager services)
Cite this article (links to download the citations from this article in formats compatible with various reference manager tools)
MRGPRX4 is a bile acid receptor for human cholestatic itch
eLife 8:e48431.
https://doi.org/10.7554/eLife.48431


