Neutrophils promote CXCR3-dependent itch in the development of atopic dermatitis
- University of California, Berkeley, United States
- Buck Institute for Research on Aging, United States
Figures
Figure 1 with 10 supplements
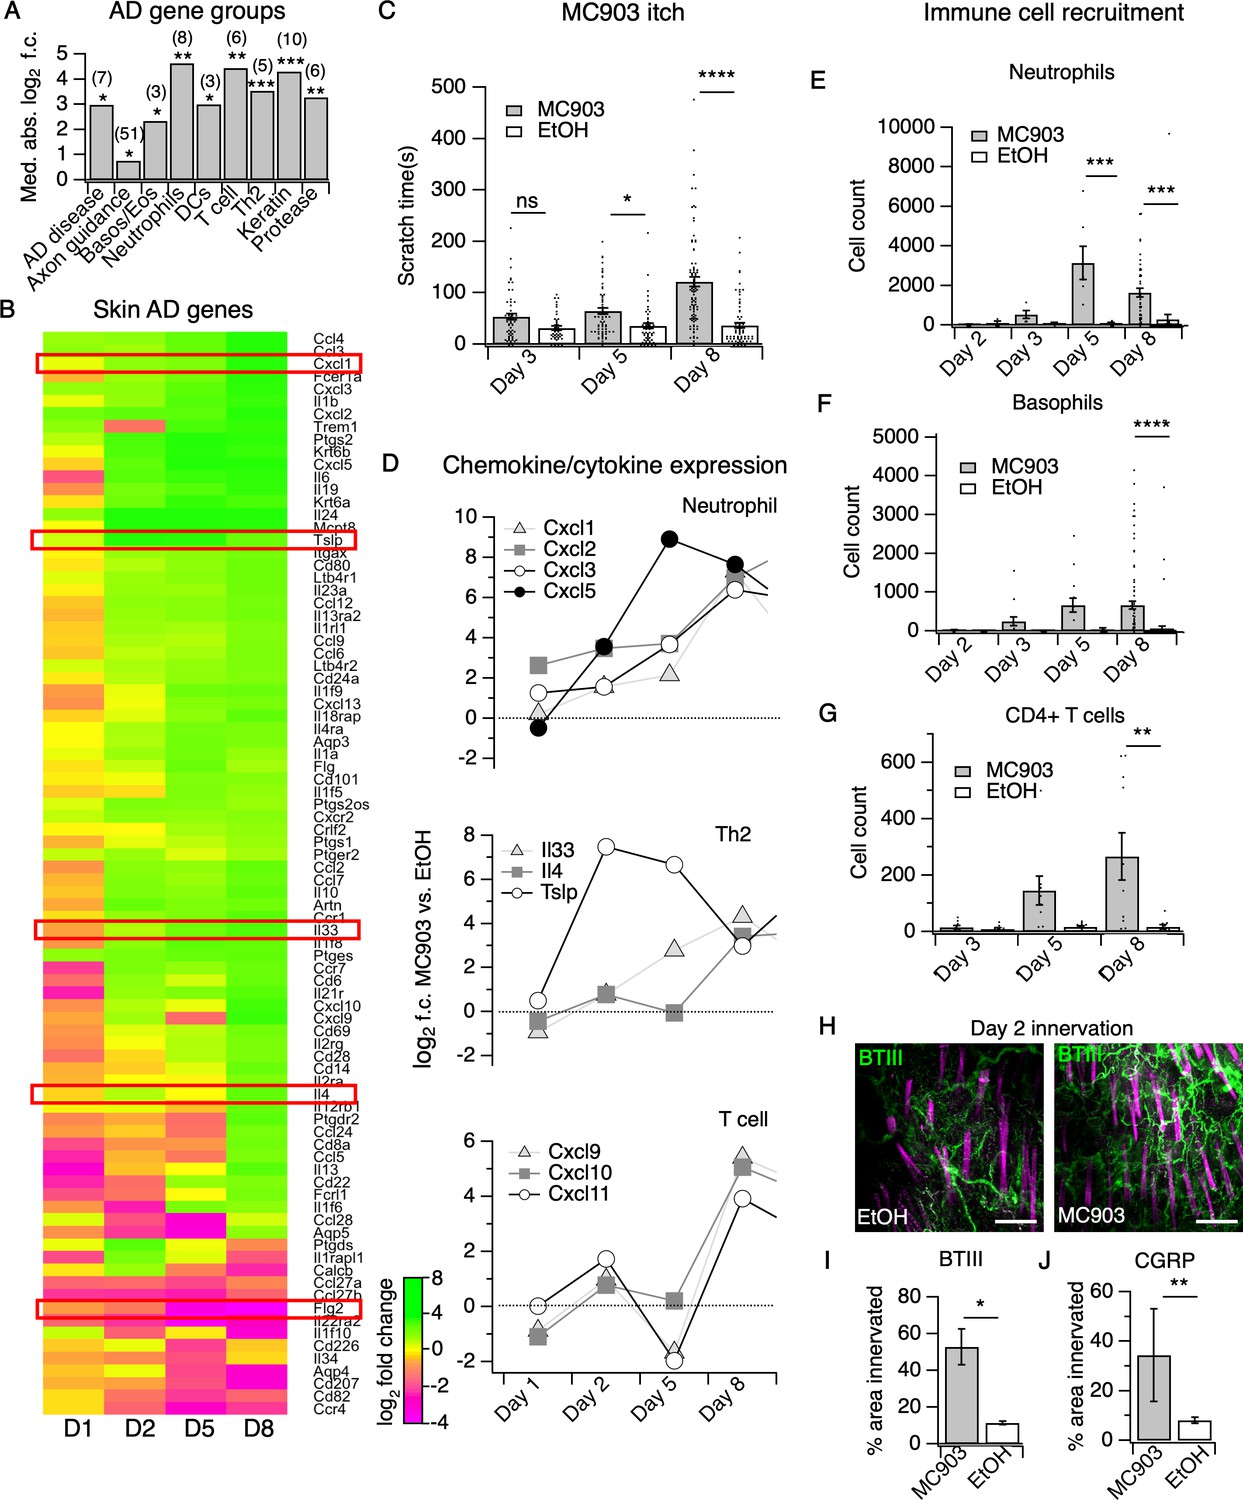
The MC903 model parallels the progression of human atopic disease and suggests a temporal sequence of AD pathogenesis.
(A) Exact permutation test (10,000 iterations, see Materials and methods) for significance of mean absolute log2 fold change in gene expression at Day 8 (MC903 vs. ethanol) of custom-defined groups of genes for indicated categories (see Figure 1—source data 1). (B) Log2 fold change in gene expression (MC903 vs. ethanol) in mouse skin at indicated time points for key immune and mouse/human AD genes that were significantly differentially expressed for at least one time point in the MC903 model. Only genes from our initial list (see Materials and methods) differentially expressed at corrected p<0.05 and changing >2 fold between treatments for at least one condition are shown. Green bars = increased expression in MC903 relative to ethanol; magenta = decreased expression. Exact values and corrected p-values are reported in Figure 1—source data 2 and Source Data 1 Supplemental Data, respectively. D1 = 6 hr post-treatment; D2 = Day 2; D5 = Day 5; D8 = Day 8. (C) Scratching behavior of mice treated with MC903 or ethanol for indicated length of time (two-way ANOVA: ****pinteraction <0.0001, F(2,409) = 13.25; Sidak’s multiple comparisons: pday 3 = 0.1309, n = 62,51 mice; *pday 5 = 0.0171, n = 69,56 mice; ****pday 8 < 0.0001, n = 92,85 mice). Exact values displayed in Figure 1—source data 3. (D) Log2 fold change in gene expression of neutrophil chemoattractants (upper), Th2 cytokines (middle) and T cell chemoattractants (lower, from RNA-seq data). (E) Neutrophil counts in MC903- and ethanol-treated skin at indicated time points (two-way ANOVA: **ptreatment = 0.0023, F(1,102) = 9.82; Sidak’s multiple comparisons: pday 2 > 0.999, n = 4,4 mice; pday 3 = 0.9801, n = 5,5 mice; ***pday 5 = 0.0003, n = 6,8 mice; ***pday 8 = 0.0001, n = 40,38 mice). (F) Basophil counts in MC903- and ethanol-treated skin at indicated time points (two-way ANOVA: **ptreatment = 0.0051, F(1,102) = 8.17; Sidak’s multiple comparisons: pday 2 > 0.999, n = 4,4 mice; pday 3 = 0.8850, n = 5,5 mice; pday 5 = 0.0606, n = 6,8 mice; ****pday 8 < 0.0001, n = 40,38 mice). (G) CD4+ T cell counts in MC903- and ethanol-treated skin at indicated time points (two-way ANOVA: **ptime = 0.0042, F(1,44) = 9.10; pday 3 = 0.9998, n = 8,6 mice; pday 5 = 0.2223, n = 9,8 mice; **pday 8 = 0.0021, n = 11,8 mice). Day 8 immune cell infiltrate represented as % of CD45+ cells in Figure 1—figure supplement 2A–B (see Supplementary file 3 for all experimental conditions). Exact values displayed in Figure 1—source data 4 and representative FACS plots for myeloid and T cell gating shown in Figure 1—figure supplement 3A and Figure 1—figure supplement 4A. For Figure 4E–G, data from mice receiving i.p. injection of PBS (see Figure 4) in addition to MC903 or EtOH are also included. (H) (Upper and Lower) Representative maximum intensity Z-projections from immunohistochemistry (IHC) of whole-mount mouse skin on Day 2 of the MC903 model. Skin was stained with neuronal marker beta-tubulin III (BTIII; green). Hair follicle autofluorescence is visible in the magenta channel. Images were acquired on a confocal using a 20x water objective. (I) Quantification of innervation (see Materials and methods) of mouse skin as determined from BTIII staining (*p=0.012; two-tailed t-test (t = 3.114; df = 9); n = 7,4 images each from two mice per treatment). Day 1 IHC results as follows: 31.78 ± 18.39% (MC903) and 31.51 ± 16.43% (EtOH); p=0.988; two-tailed unpaired t-test; n = 6 images each from two mice per treatment. Exact values are reported in Figure 1—source data 5. (J) Quantification of CGRP+ nerve fibers (see Materials and methods) in skin (**p=0.0083; two-tailed t-test (t = 2.868; df = 25); n = 15, 12 images from three mice per treatment). Exact values are reported in Figure 1—source data 5. Representative images in Figure 1—figure supplement 9A.
-
Figure 1—source data 1
Values displayed in the bar plot shown in Figure 1A.
- https://cdn.elifesciences.org/articles/48448/elife-48448-fig1-data1-v2.csv
-
Figure 1—source data 2
Values displayed in the heat map shown in Figure 1B.
- https://cdn.elifesciences.org/articles/48448/elife-48448-fig1-data2-v2.csv
-
Figure 1—source data 3
Values displayed in the bar plot shown in Figure 1C.
- https://cdn.elifesciences.org/articles/48448/elife-48448-fig1-data3-v2.csv
-
Figure 1—source data 4
Values displayed in the bar plots shown in Figure 1E–G and Figure 1—figure supplement 5A–C.
- https://cdn.elifesciences.org/articles/48448/elife-48448-fig1-data4-v2.csv
-
Figure 1—source data 5
Values displayed in the bar plots shown in Figure 1I and Figure 1J.
- https://cdn.elifesciences.org/articles/48448/elife-48448-fig1-data5-v2.csv
-
Figure 1—source data 6
Values displayed in the heat map shown in Figure 1—figure supplement 1A.
- https://cdn.elifesciences.org/articles/48448/elife-48448-fig1-data6-v2.csv
-
Figure 1—source data 7
Values displayed in the heat map shown in Figure 1—figure supplement 6A.
- https://cdn.elifesciences.org/articles/48448/elife-48448-fig1-data7-v2.csv
-
Figure 1—source data 8
Values displayed in the heat map shown in Figure 1—figure supplement 7A.
- https://cdn.elifesciences.org/articles/48448/elife-48448-fig1-data8-v2.csv
-
Figure 1—source data 9
Values displayed in the bar plot shown in Figure 1—figure supplement 10A.
- https://cdn.elifesciences.org/articles/48448/elife-48448-fig1-data9-v2.csv
Figure 1—figure supplement 1
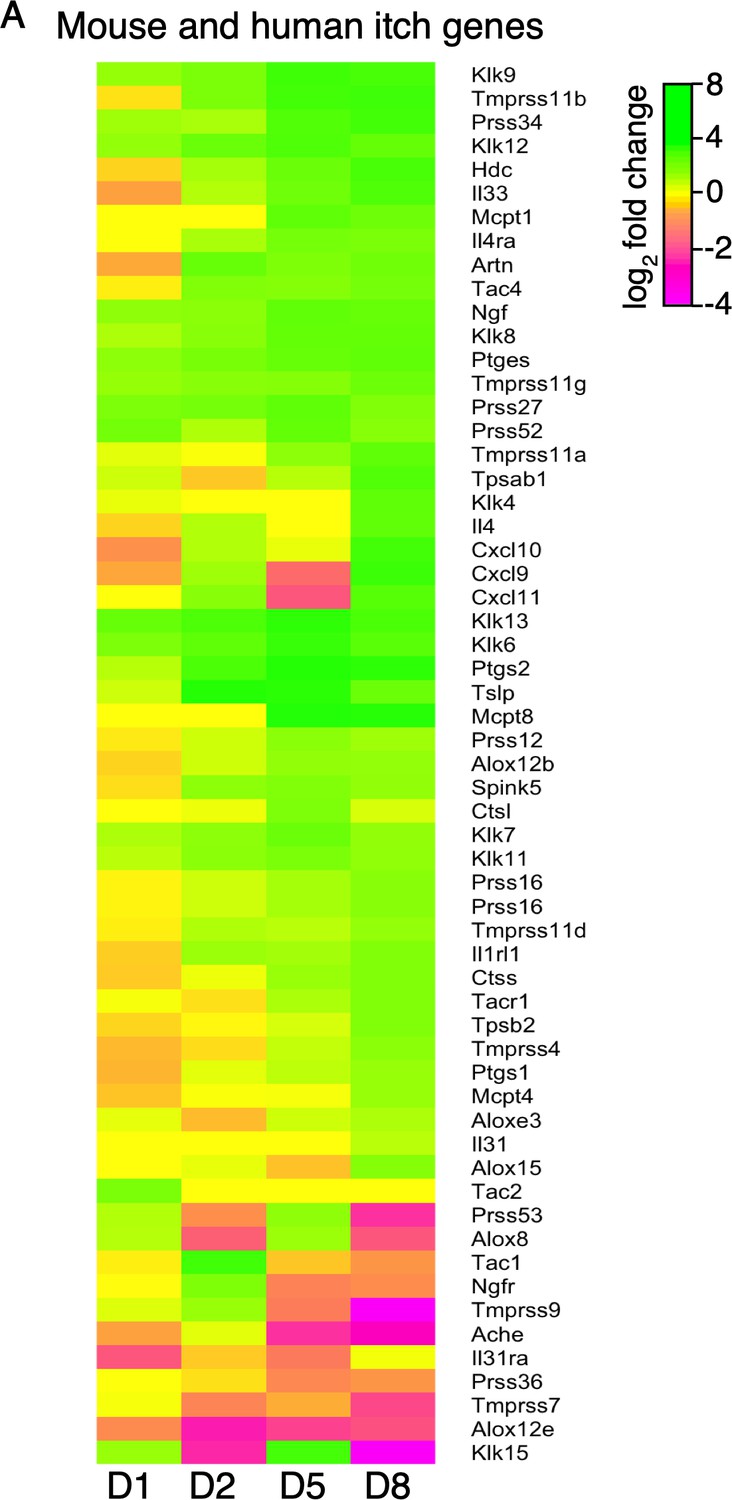
Expression of mouse and human itch genes.
(A) Log2 fold change in gene expression (MC903 vs. ethanol) in mouse skin at indicated time points for genes implicated in mouse or human acute or chronic itch that were significantly differentially expressed for at least one time point in the MC903 model. Green bars = increased expression in MC903 relative to ethanol; magenta = decreased expression. Exact values and corrected p-values are reported in Figure 1—source data 6 and Source Data 1 Supplemental Data, respectively.
Figure 1—figure supplement 2
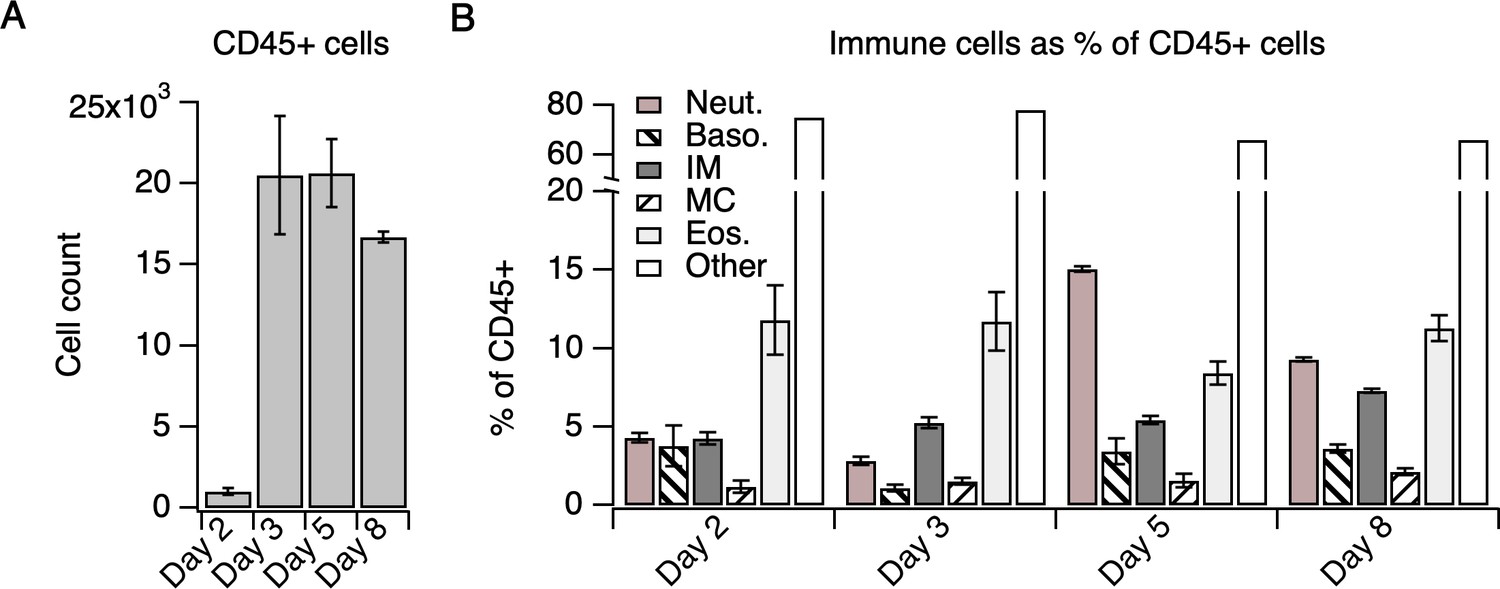
Immune cells represented as % of CD45+ cells.
(A) Number of CD45+ cells in MC903-treated skin on days 2–8 of the model. (B) Skin-infiltrating immune cell subtypes on days 2–8 of the MC903 model shown in Figure 1, represented as % of CD45+ cells. CD4+ T cell measurements were acquired using a separate staining panel from different animals than the myeloid cell measurements (see Materials and methods) and were not included. See Supplementary file 3 for % of CD45+ cell measurements for all flow cytometry experiments. Error bars represent mean ± SEM.
Figure 1—figure supplement 3
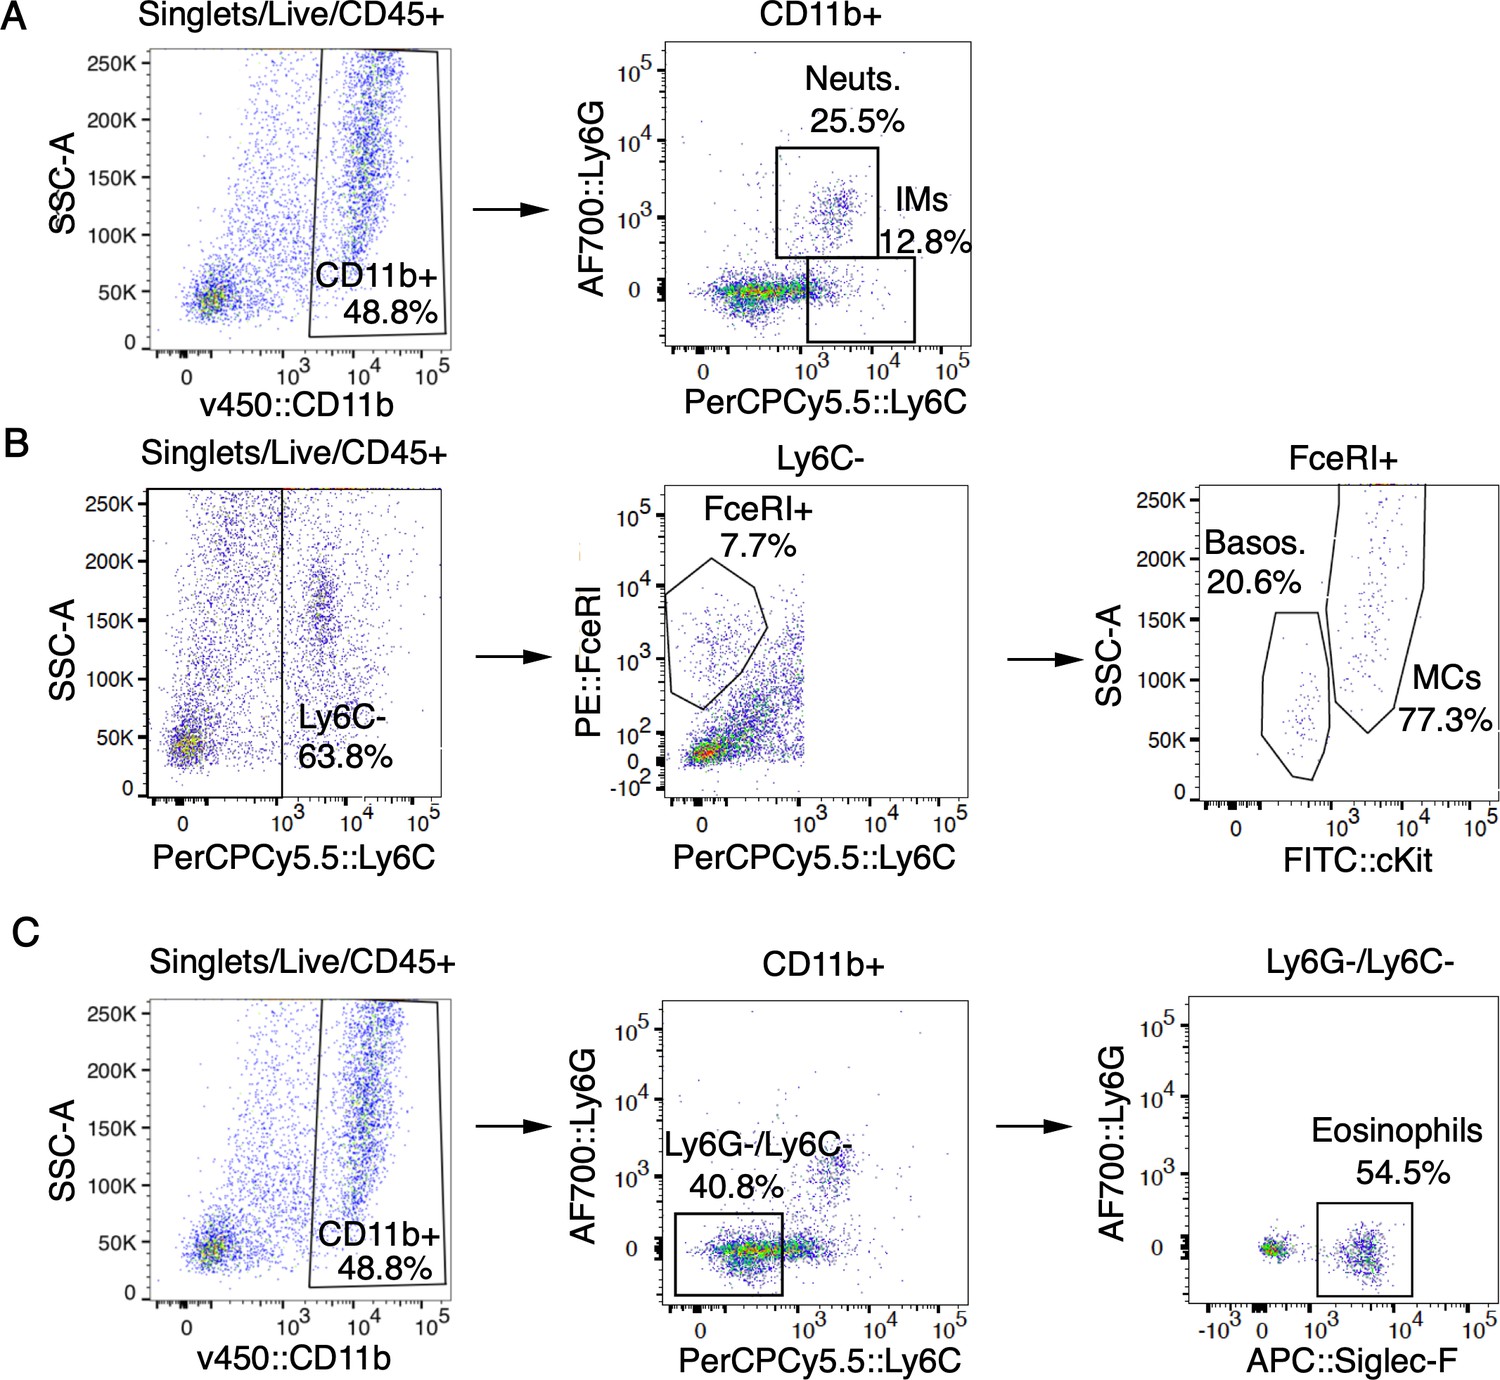
Myeloid and granulocyte gating strategy.
(A-C) Representative FACS plots of cells isolated from MC903-treated cheek skin showing gating strategy for neutrophils (A), inflammatory monocytes (A), mast cells (B), basophils (B), and eosinophils (C) as shown in Figure 1E–F and Figure 1—figure supplement 5.
Figure 1—figure supplement 4
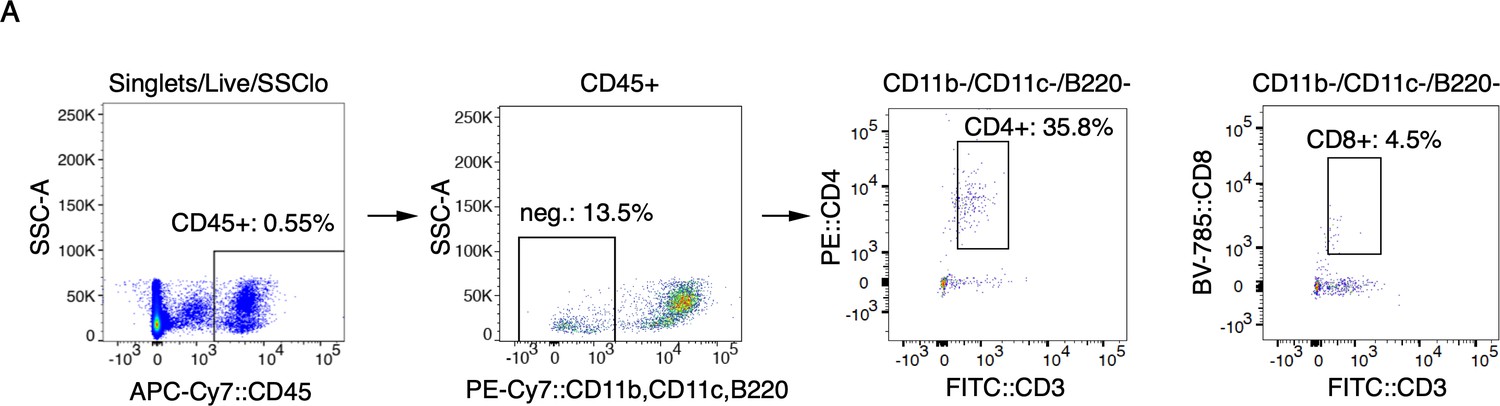
T cell gating strategy.
(A) Representative FACS plots of cells isolated from MC903-treated cheek skin showing gating strategy for CD4+ T cells as shown in Figure 1G.
Figure 1—figure supplement 5
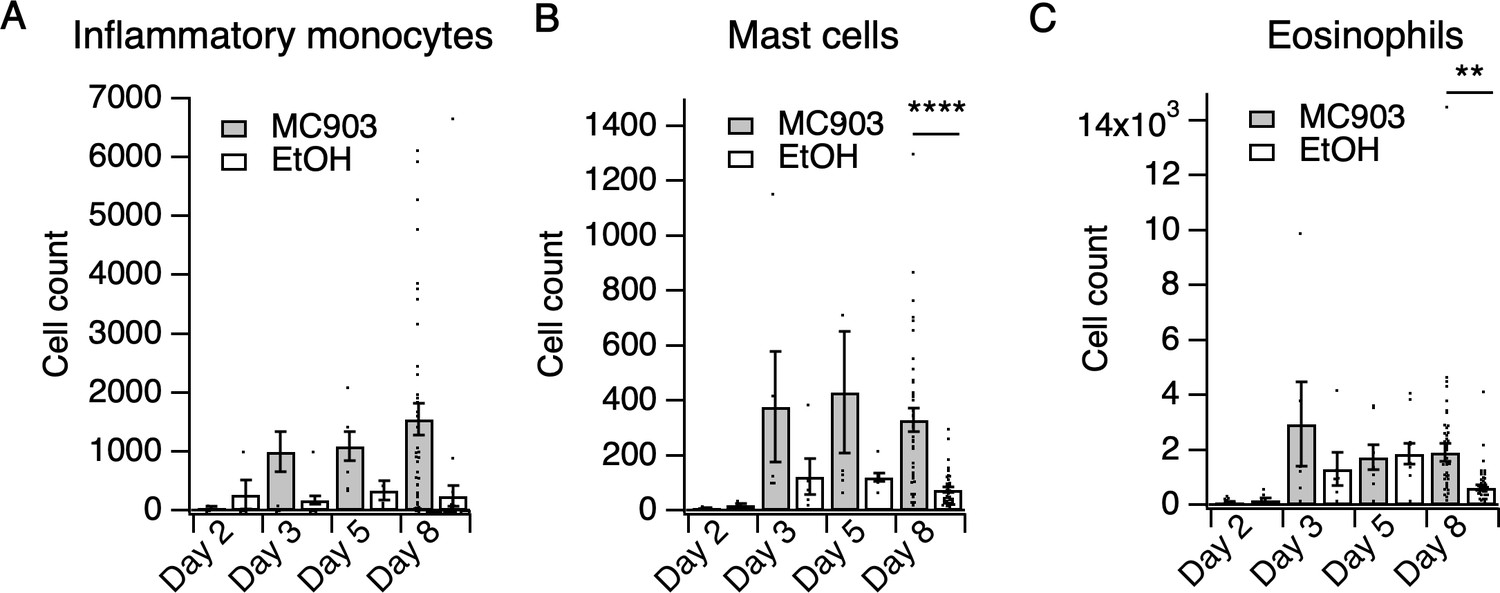
Immune cell counts in MC903-treated skin.
(A) Inflammatory monocyte counts in MC903- and ethanol-treated skin at indicated time points (two-way ANOVA: ptreatment = 0.0662, F(1,102) = 3.44; n = 4,4,5,5,6,8,40,38 mice). (B) Mast cell counts in MC903- and ethanol-treated skin at indicated time points (two-way ANOVA: **ptreatment = 0.0024, F(1,102) = 9.69; Sidak’s multiple comparisons: pday 2 > 0.999, n = 4,4 mice; pday 3 = 0.3019, n = 5,5 mice; pday 5 = 0.0586, n = 6,8 mice; ****pday 8 < 0.0001, n = 40,38 mice). (C) Eosinophil counts in MC903- and ethanol-treated skin at indicated time points (two-way ANOVA: ptime = 0.0471, F(3,102) = 2.74; Sidak’s multiple comparisons: pday 2 > 0.999, n = 4,4 mice; pday 3 = 0.3596, n = 5,5 mice; pday 5 = 0.9998, n = 6,8 mice; **pday 8 = 0.0020, n = 40,38 mice). Data from mice receiving i.p. injection of PBS (see Figure 4) in addition to MC903 or EtOH are also included. Exact values displayed in Figure 1—source data 4.
Figure 1—figure supplement 6
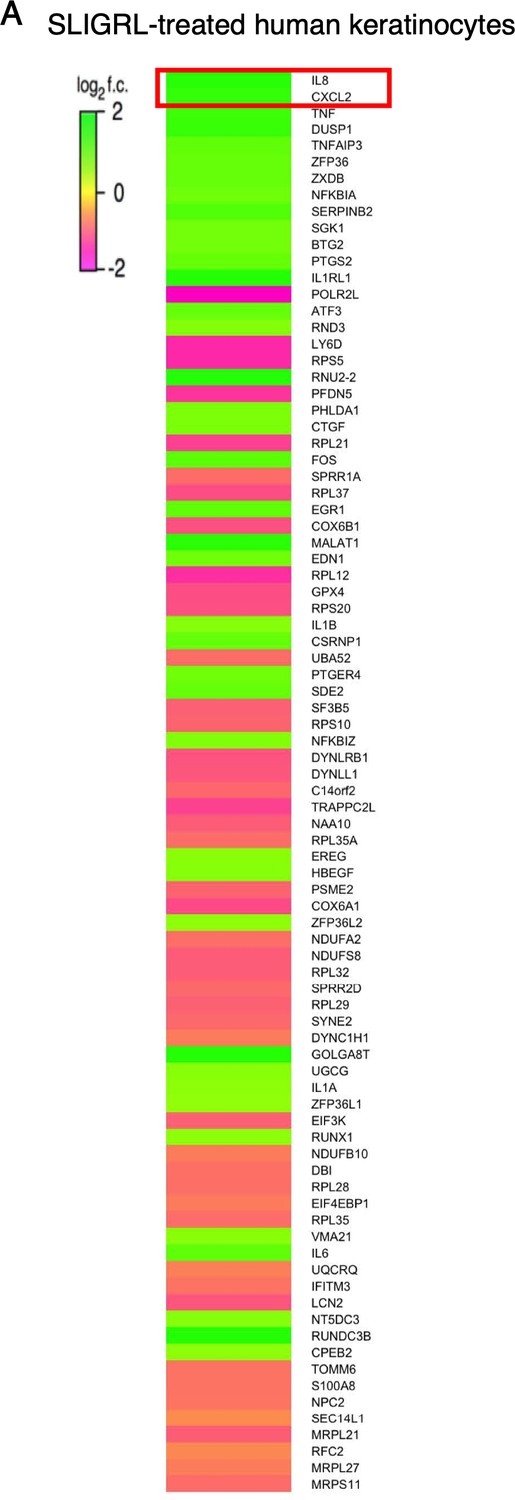
Protease receptor activation triggers rapid upregulation of neutrophil chemoattractant genes in human keratinocytes.
(A) Heat map showing log2 fold change in gene expression in cultured human keratinocytes 3 hr after SLIGRL treatment (100 µM; bottom; see Figure 1—source data 7) compared to vehicle controls, as measured by RNA-seq. Genes are sorted by descending corrected p-value; only significantly differentially expressed (p<0.05) are displayed. Exact values and corrected p-values are reported in Figure 1—source data 7 and Source Data 1 Supplemental Data, respectively.
Figure 1—figure supplement 7
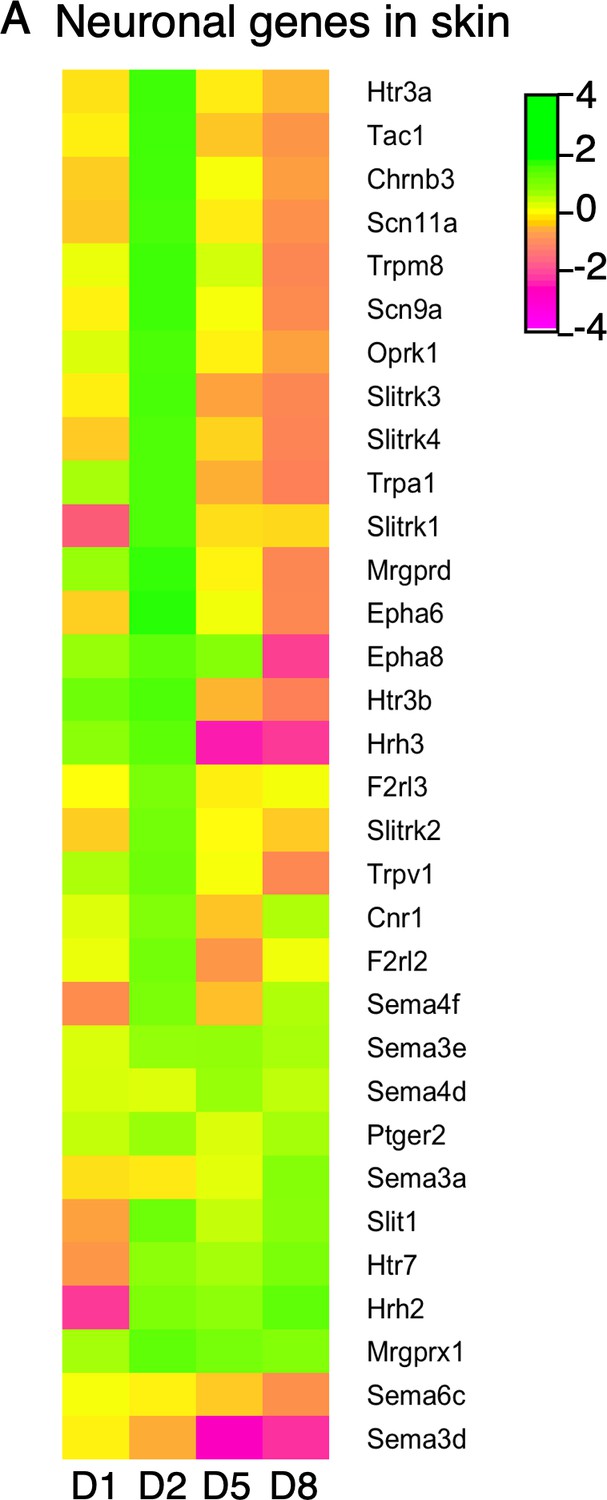
Expression of neuronal genes and axon guidance molecules in skin.
(A) Log2 fold change in gene expression (MC903 vs. EtOH) in mouse skin at indicated time points for markers of locally translated sensory neuronal transcripts or genes implicated in neurite remodeling and/or axon guidance that were significantly differentially expressed for at least one time point in the MC903 model. Green bars = increased expression in MC903 relative to ethanol; magenta = decreased expression. Exact values and corrected p-values are reported in Figure 1—source data 8 and Source Data 1 Supplemental Data, respectively.
Figure 1—figure supplement 8
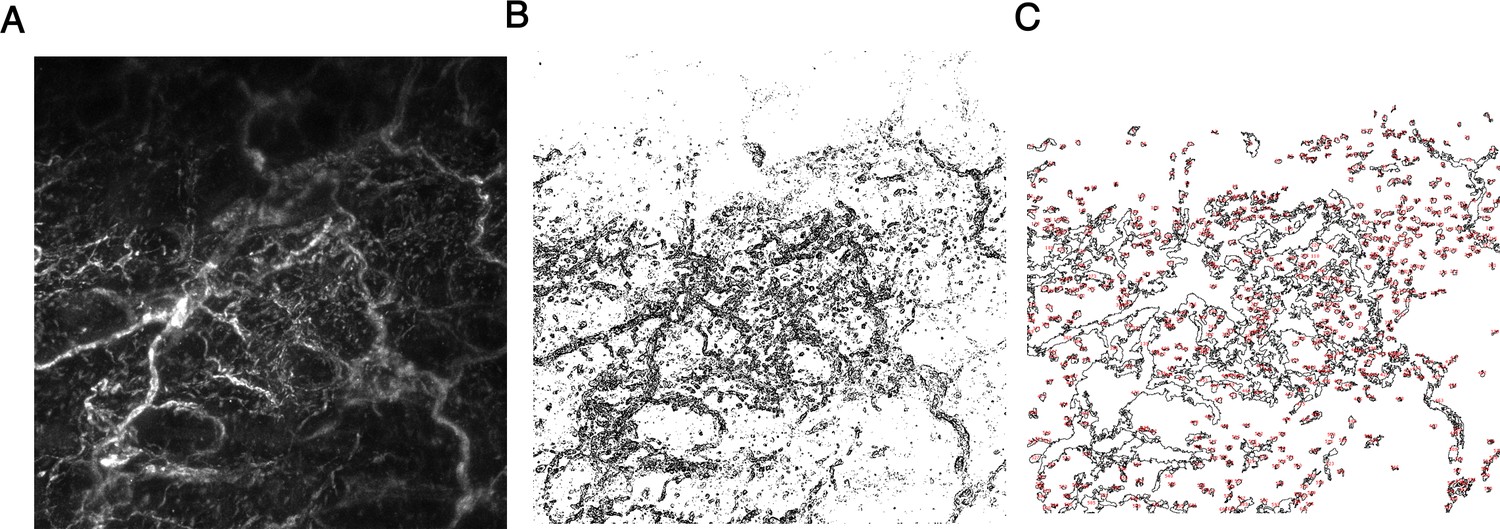
Method of image quantification for whole mount skin.
(A) Representative maximum intensity z-projection of beta tubulin III staining in cheek skin. (B) Binary image after edge-detection. (C) % Area innervated was calculated from the percentage of the image area which was occupied by the regions of interest (ROIs) outlined in red.
Figure 1—figure supplement 9
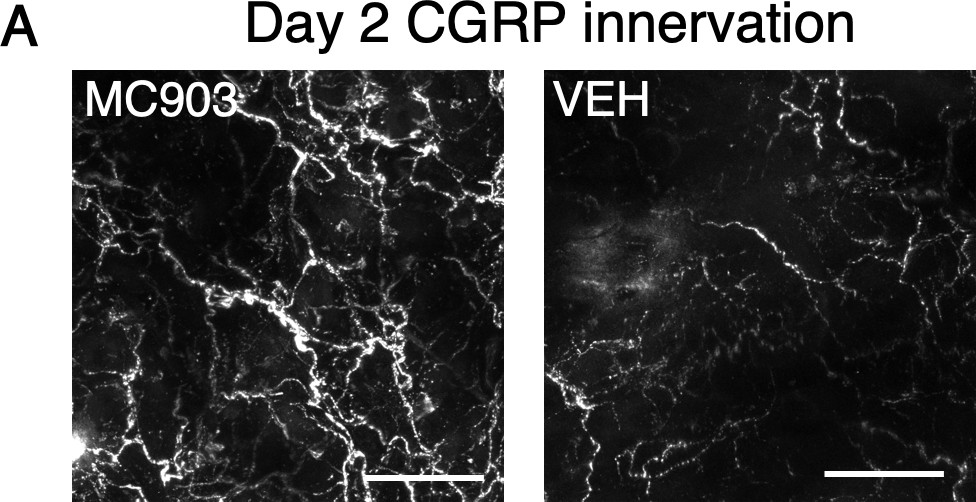
Peptidergic fibers display hyperinnervation in MC903-treated skin.
(A) Representative maximum intensity Z-projections from immunohistochemistry (IHC) of whole-mount mouse skin on day 2 of the MC903 model. Skin was stained with peptidergic neuronal marker Calcitonin related-gene peptide (CGRP; white). Images were acquired on a confocal microscope using a 20x water objective.
Figure 1—figure supplement 10
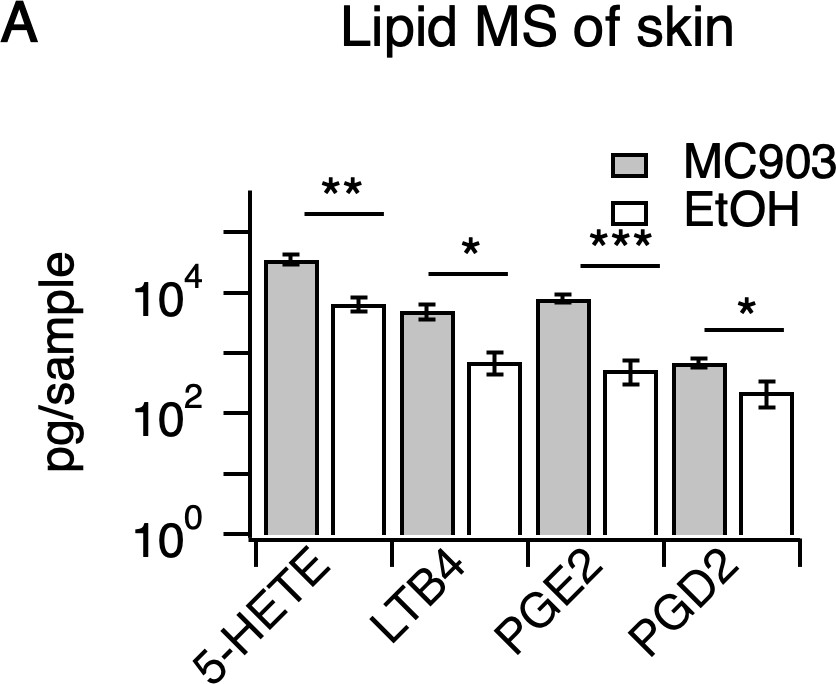
Inflammatory lipids in MC903-treated skin.
(A) Quantification of indicated lipids from 6 mm biopsy punches of cheek skin of MC903- and EtOH-treated mice (at day 8) by LC-MS/MS (**p=0.006 (t = 4.148,df = 6), *p=0.024 (t = 3.003,df = 6), ***p=0.0007 (t = 6.392,df = 6), *p=0.022 (t = 3.058,df = 6); two-tailed unpaired t-tests; n = 4 mice per group, see Figure 1—source data 8).
Figure 2 with 5 supplements
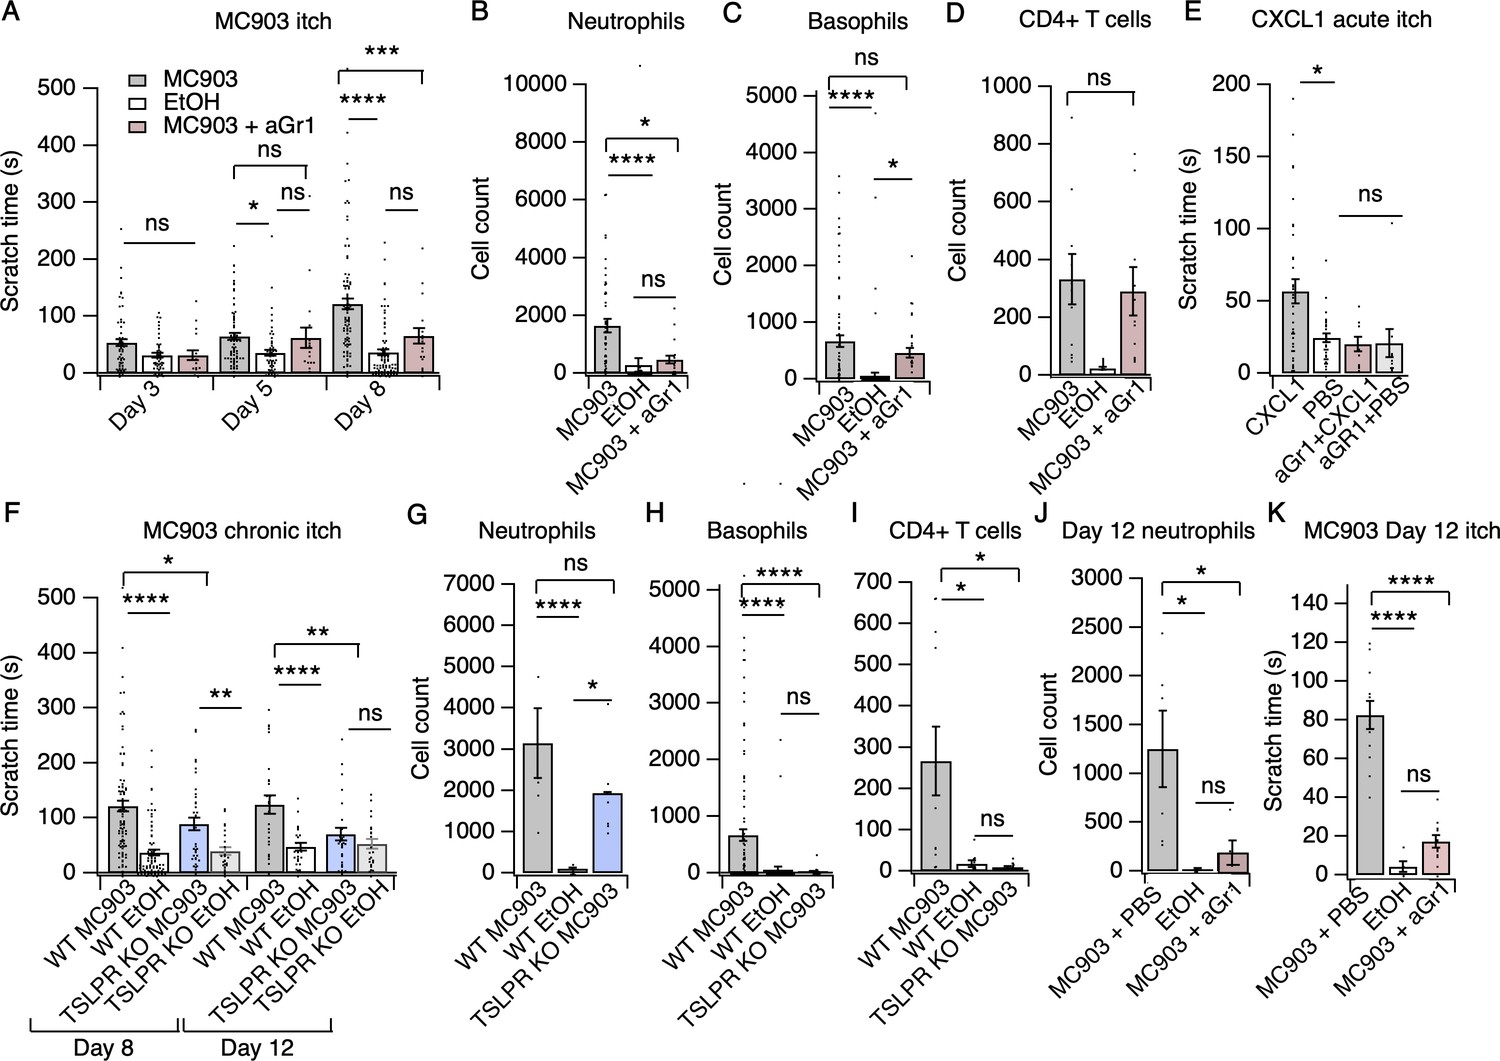
Neutrophils are necessary and sufficient for itch behaviors.
(A) Scratching behavior of uninjected and PBS-injected mice (combined) and aGr1-injected mice treated with MC903 or ethanol for indicated length of time (two-way ANOVA: ****pinteraction <0.0001, F(4,447) = 7.16; Tukey’s multiple comparisons: pday 3 MC903 vs. EtOH = 0.1111 n = 62,51,17 mice; *pday 5 MC903 vs. EtOH = 0.0154, pday 5 MC903 vs. aGr1 = 0.9854, pday 5 aGr1 vs. EtOH = 0.2267, n = 69,56,17 mice; ****pday 8 MC903 vs. EtOH <0.0001, ***pday 8 MC903 vs. aGr1 = 0.0007, pday 8 aGr1 vs. EtOH = 0.1543, n = 92,85,17 mice). (B) Neutrophil count from cheek skin of uninjected/PBS-injected MC903- and ethanol-treated, and aGr1-injected MC903-treated mice on day 8 (one-way ANOVA: ****p<0.0001, F(2,92) = 10.59; Tukey’s multiple comparisons: ****pMC903 vs. EtOH <0.00001, n = 40,38 mice; *pMC903 vs. aGr1 MC903 = 0.0109, n = 40,17 mice; paGr1 vs. EtOH = 0.8859, n = 38,17 mice). (C) Basophil count from cheek skin of uninjected/PBS-injected MC903- and ethanol-treated, and aGr1-injected MC903-treated mice on day 8 (one-way ANOVA: ****p=0.0001, F(2,92) = 14.61; Tukey’s multiple comparisons: pMC903 vs. aGr1 MC903 = 0.3217, n = 40,17 mice, ****pMC903 vs. EtOH <0.0001, n = 40,38 mice, *paGr1 MC903 vs. EtOH = 0.0204, n = 17,38 mice). (D) CD4+ T cell count from cheek skin of PBS-injected MC903- and ethanol-treated, and aGr1-injected MC903-treated mice on day 8 (two-way ANOVA: **ptreatment = 0.0035, F(1,35) = 9.82; Holm-Sidak multiple comparisons for PBS versus aGr1: pMC903 = 0.8878, n = 9,11 mice; pEtOH = 0.5201, n = 8,9 mice). Control MC903 and EtOH data from Figure 2B–C are also displayed in Figure 1. Exact values displayed for Figure 2A–D in Figure 2—source data 1. (E) Scratching behavior of mice immediately after injection of 1 µg CXCL1 or PBS (s.c. cheek). For neutrophil-depletion experiments, mice received 250 µg anti-Gr1 (aGr1) 20 hr prior to cheek injection of CXCL1 or PBS (one-way ANOVA: ****p<0.0001, F(4,88) = 75.53; Tukey’s multiple comparisons: *pCXCL1 vs. PBS = 0.0126, n = 36,31 mice; paGr1-CXCL1 vs. aGr1-PBS > 0.9999, n = 10,10 mice; paGr1-CXCL1 vs. PBS = 0.9986, n = 10,31 mice). Exact values displayed in Figure 2—source data 2. (F) Scratching behavior of WT and TSLPR KO (TSLPR KO) mice treated with MC903 or ethanol for indicated length of time (two-way ANOVA: ****pinteraction <0.0001, F(9,657) = 4.93; Tukey’s multiple comparisons: ****pday 8 WT MC903 vs. EtOH <0.0001, *pday 8 WT MC903 vs. KO MC903 = 0.0194, **pday 8 KO MC903 vs. KO EtOH = 0.0039, n = 92,85,36,26 mice; ****pday 12 WT MC903 vs. EtOH <0.0001, **pday 12 WT MC903 vs. KO MC903 = 0.0028, pday 12 KO MC903 vs. KO EtOH = 0.7061, n = 26,26,27,23 mice). (G) Neutrophil count from cheek skin of wild-type MC903- and ethanol-treated, and TSLPR KO MC903-treated mice on day 5 (two-way ANOVA: **pgenotype = 0.0025, F(2,125) = 6.28; Tukey’s multiple comparisons: ****pday 5 WT MC903 vs. WT EtOH <0.0001, n = 6,8 mice; pday 5 WT MC903 vs. KO MC903 = 0.2198, n = 6,6 mice; *pday 5 WT EtOH vs. KO MC903 = 0.0212, n = 8,6 mice). (H) Basophil count from cheek skin of wild-type MC903- and ethanol-treated, and TSLPR KO MC903-treated mice on day 8 (two-way ANOVA: **pgenotype = 0.0003, F(2,117) = 8.87; Tukey’s multiple comparisons: ****pday 8 WT MC903 vs. WT EtOH <0.0001, n = 40,38 mice; ****pday 8 WT MC903 vs. KO MC903 <0.0001, n = 40,15 mice; pday 8 WT EtOH vs. KO MC903 = 0.9519, n = 38,15 mice). See also Figure 2—figure supplement 5A. For Figure 2G–H, data from days 3, 5, and 8 are presented in Figure 2—source data 3. (I) CD4+ T cell count from cheek skin of wild-type MC903- and ethanol-treated, and TSLPR KO MC903-treated mice on day 8 (one-way ANOVA: **p=0.0053, F(2,24) = 6.564; Tukey’s multiple comparisons: *pWT MC903 vs. WT EtOH = 0.0163, n = 11,8 mice; *p MC903 vs. KO MC903 = 0.0130, n = 11,8 mice; pWT EtOH vs. KO MC903 = 0.9953, n = 8,8 mice). Wild-type MC903 and EtOH data from 2 F-H are also displayed in Figure 1. Exact values for Figure 2F–I displayed in Figure 2—source data 3. (J) Neutrophil count from cheek skin of wild-type MC903- and ethanol-treated mice on day 12 of the MC903 model. MC903-treated animals received daily i.p. injections of 250 µg aGr1 antibody or PBS (250 µL) on days 8–11 of the model (one-way ANOVA: *p=0.01, F(2,13) = 6.69; Tukey’s multiple comparisons: *pMC903-PBS vs. EtOH = 0.0141, n = 6,5 mice; *pMC903-PBS vs. MC903-aGr1 = 0.10330, n = 6,5 mice; pMC903-aGr1 vs. EtOH = 0.9005, n = 5,5 mice). (K) Time spent scratching over a thirty minute interval for wild-type MC903- and ethanol-treated mice on day 12 of the MC903 model. MC903-treated animals received daily i.p. injections of 250 µg aGr1 antibody or PBS (250 µL) on days 8–11 of the model (one-way ANOVA: ****p<0.0001, F(2,26) = 53.1; Tukey’s multiple comparisons: ****pMC903-PBS vs. EtOH <0.0001, n = 12,5 mice; ****pMC903-PBS vs. MC903-aGr1 < 0.0001, n = 12,12 mice; pMC903-aGr1 vs. EtOH = 0.3734, n = 12,5 mice). Values from bar plots are reported in Figure 2—source data 5.
-
Figure 2—source data 1
Values displayed in bar plots shown in Figure 2A–D.
- https://cdn.elifesciences.org/articles/48448/elife-48448-fig2-data1-v2.xlsx
-
Figure 2—source data 2
Values displayed in the bar plots shown in Figure 2E and Figs.
- https://cdn.elifesciences.org/articles/48448/elife-48448-fig2-data2-v2.xlsx
-
Figure 2—source data 3
Values displayed in the bar plots shown in Figure 2F–I and Figure 2—figure supplement 4A–B.
- https://cdn.elifesciences.org/articles/48448/elife-48448-fig2-data3-v2.xlsx
-
Figure 2—source data 4
Values used to generate the line plots shown in Figure 2—figure supplement 1C.
- https://cdn.elifesciences.org/articles/48448/elife-48448-fig2-data4-v2.csv
-
Figure 2—source data 5
Values displayed in the bar plots shown in Figure 2J–K.
- https://cdn.elifesciences.org/articles/48448/elife-48448-fig2-data5-v2.xlsx
-
Figure 2—source data 6
Values displayed in the bar plots in Figure 2—figure supplement 5A.
- https://cdn.elifesciences.org/articles/48448/elife-48448-fig2-data6-v2.xlsx
Figure 2—figure supplement 1
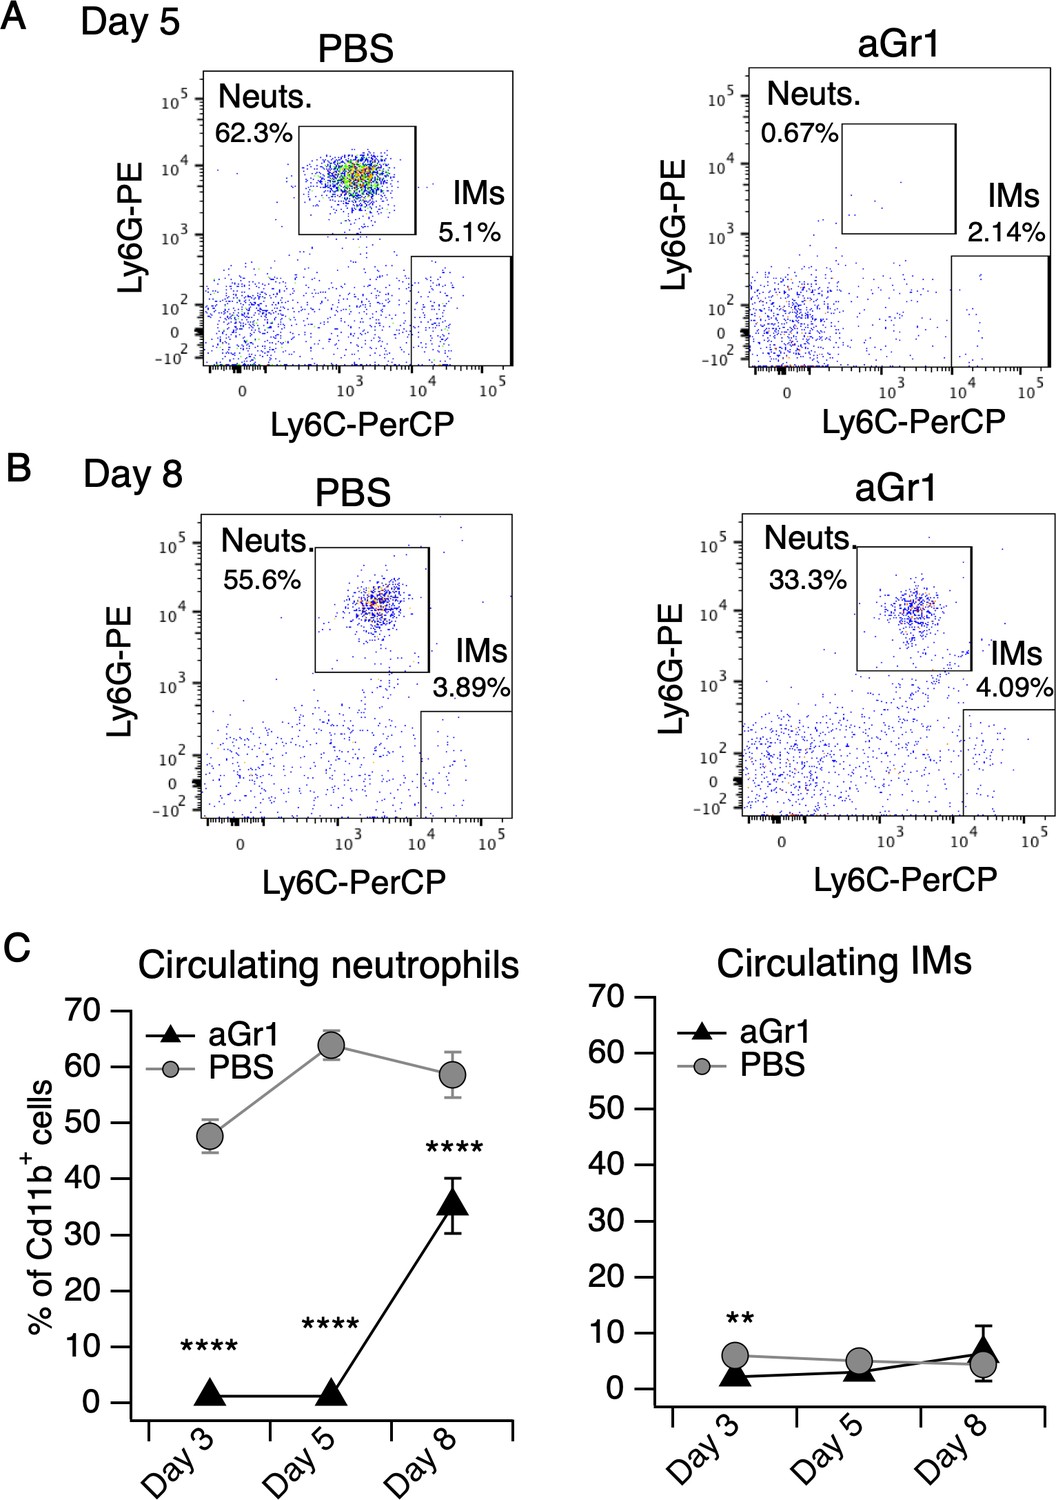
aGr1 treatment preferentially depletes neutrophils.
(A) Representative flow cytometry plots of cells collected from blood of mice injected with PBS or aGr1 (250 μg, i.p.) once-daily for five days concurrent with daily MC903 topical treatment. Shown are CD45.2+CD11b+ cells, plotted by Ly6G and Ly6C signal, with neutrophil (Neuts.) and inflammatory monocyte (IMs) populations indicated. Neutrophils were defined as Cd11b+Ly6G+Ly6Cmid/high and IMs were defined as Cd11b+Ly6G-Ly6Chigh (see Materials and methods). (B) Representative flow cytometry plot as in A, depicting neutrophil and IM populations from blood collected on day 8. (C) (Left) Neutrophil counts in blood shown as % of Cd11b+ cells from aGr1/MC903 (black triangles) and PBS/MC903 (gray circles)-treated animals on days 3, 5, and 8 of the model (two-way repeated measures ANOVA: ****ptreatment <0.0001, F(1,31) = 299.5; Sidak’s multiple comparisons: ****pday 3 < 0.0001; ****pday 5 < 0.0001; ****pday 8 < 0.0001, n = 16,17 mice). (Right) Inflammatory monocyte counts in blood shown as % of Cd11b+ cells from aGr1/MC903 and PBS/MC903-treated animals on days 3, 5, and 8 of the model (two-way repeated measures ANOVA: *ptreatment = 0.0468, F(1,31) = 4.287; Sidak’s multiple comparisons: **pday 3 = 0.0015; pday 5 = 0.1918; pday 8 = 0.2013, n = 16,17 mice). Exact values displayed in Figure 2—source data 4.
Figure 2—figure supplement 2
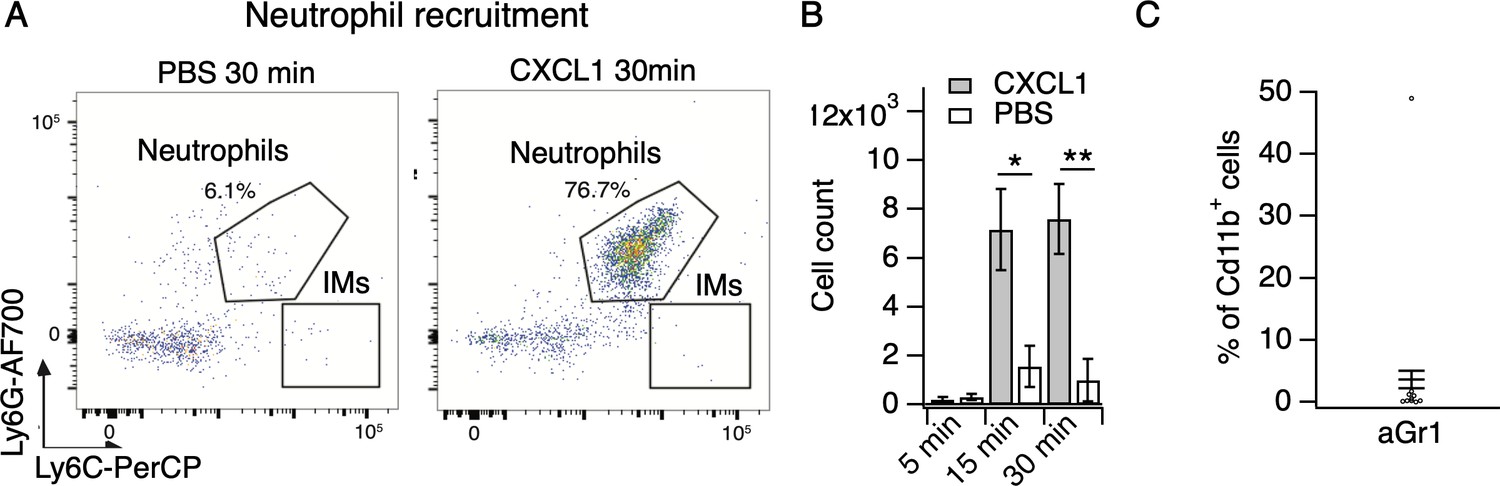
CXCL1 rapidly and selectively recruits neutrophils to skin.
(A) Representative flow cytometry plots of cells from cheek skin of mice injected with PBS or CXCL1 (1 μg in 20 µL, s.c.). Shown are CD45.2+CD11b+ cells, plotted by Ly6G and Ly6C signal, with neutrophil and inflammatory monocyte (IMs) populations indicated. (B) Neutrophil count from cheek skin of mice 5, 15, and 30 min after injection of CXCL1 or PBS (two-way ANOVA: *pinteraction = 0.0239, F(2,21) = 4.48; Sidak’s multiple comparisons: p5 min >0.9999, n = 4,5 mice; *pday 15 min = 0.0141, n = 4,4 mice; **pday 30 min = 0.0031, n = 3,7 mice). Exact values displayed in Figure 2—source data 2. (C) Blood neutrophils as % of Cd11b+ cells approximately 20 hr after injection of 250 µg aGr1 (n = 15 mice). Mice assayed for CXCL1-evoked itch behavior immediately preceding blood isolation (see Figure 2E). Exact values displayed in Figure 2—source data 2. See Figure 2—figure supplement 1C for representative blood neutrophil measurements from PBS-injected animals.
Figure 2—figure supplement 3
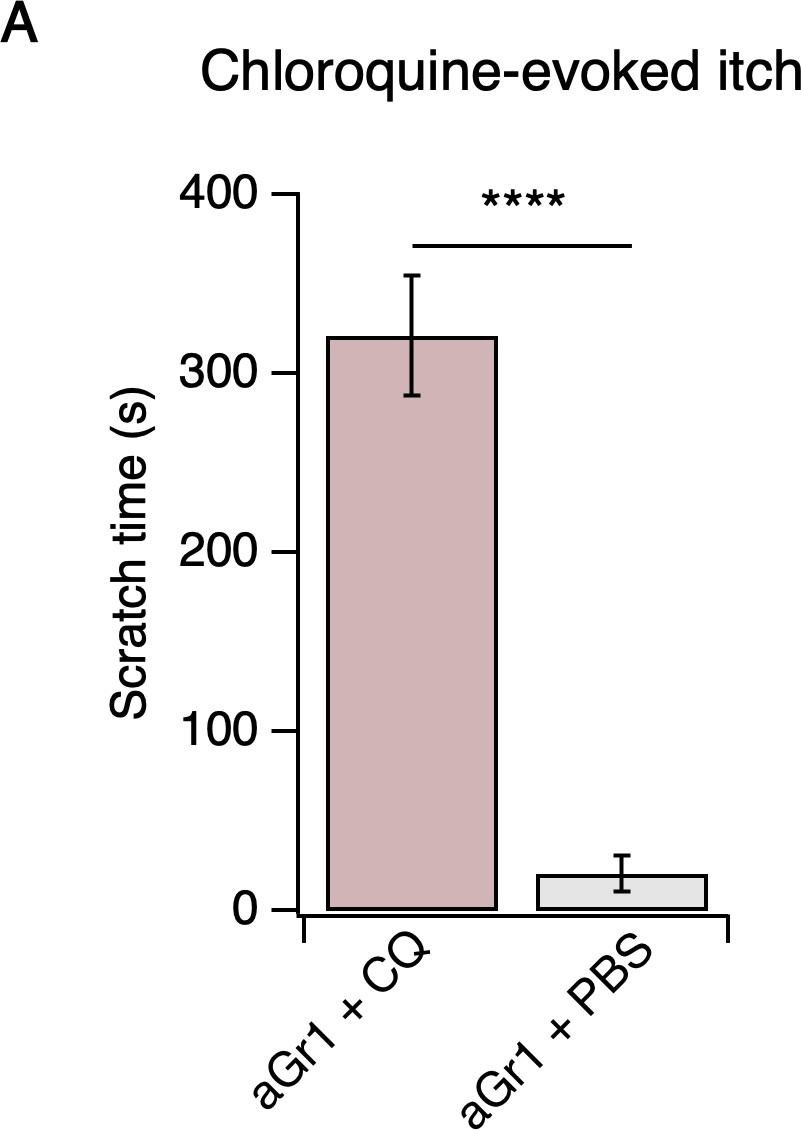
Neutrophil depletion does not affect chloroquine-evoked itch.
(A) Scratching behavior of mice immediately after injection of chloroquine (CQ) or PBS (s.c. cheek). For neutrophil-depletion experiments, mice received 250 µg anti-Gr1 (aGr1) 20 hr prior to cheek injection of CQ or PBS (two-tailed t-test: ****p<0.0001 (t = 10.58, df = 14); n = 6,10 mice). Exact values displayed in Figure 2—source data 2.
Figure 2—figure supplement 4
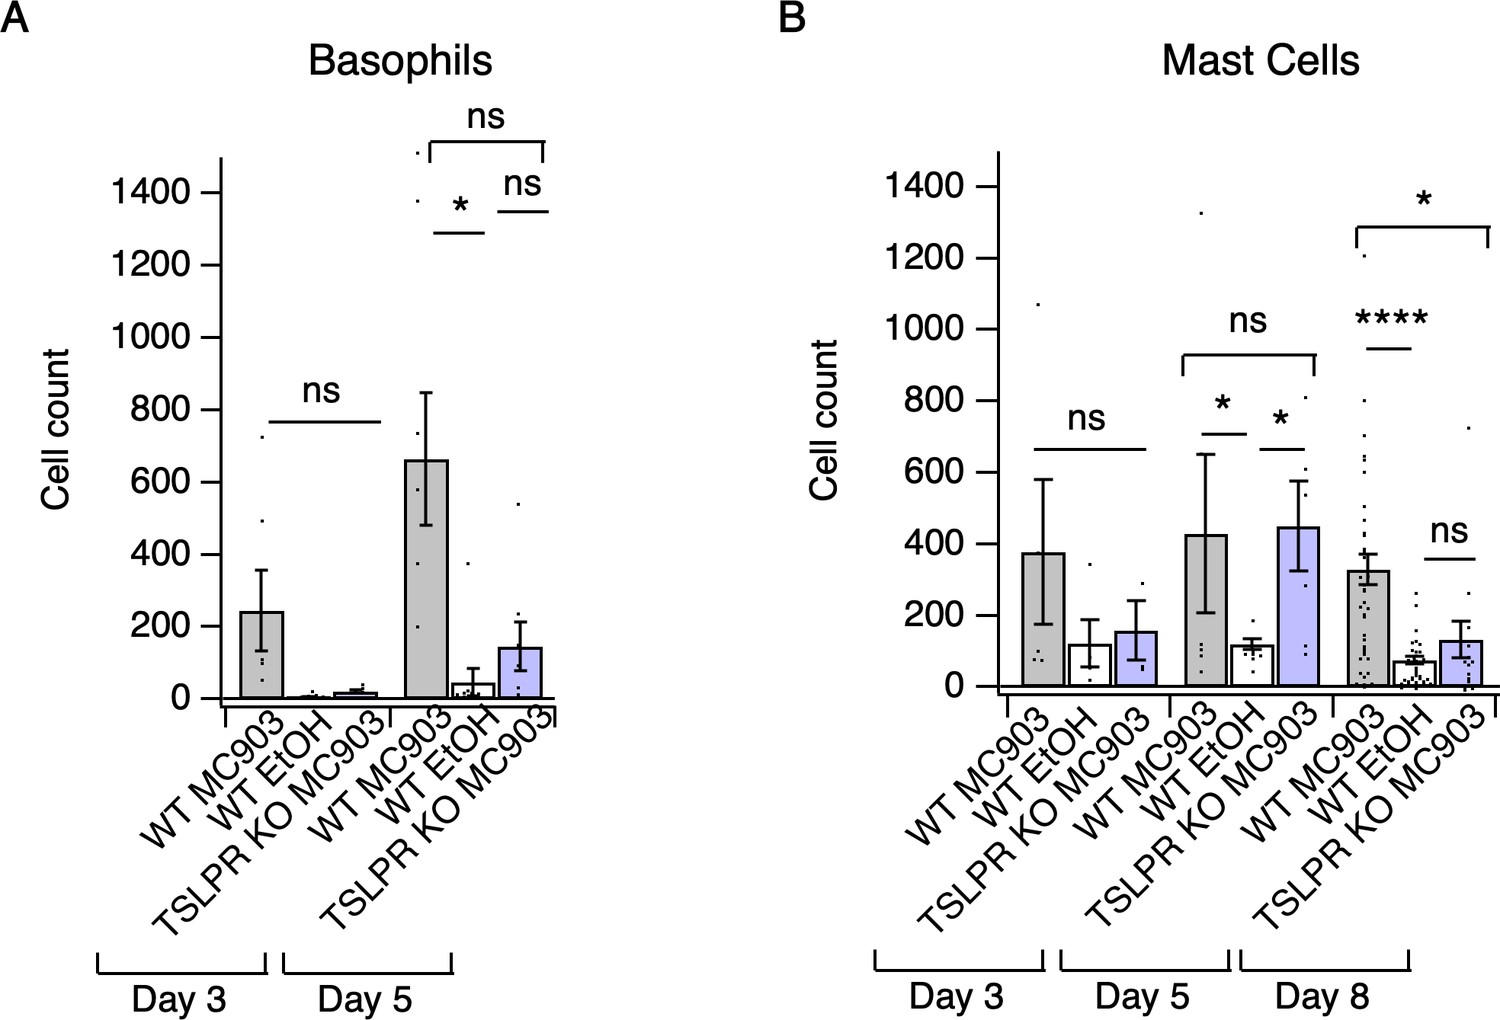
Loss of TSLPR reduces skin basophil and mast cell numbers in the first week of AD development.
(A) Basophil count from cheek skin of wild-type MC903- and ethanol-treated, and TSLPR KO MC903-treated mice after 3 or 5 days of treatment (two-way ANOVA: ***ptime = 0.0003, F(2,117) = 8.87; Tukey’s multiple comparisons: pday3 WT MC903 vs. KO MC903 = 0.6540, n = 3,5 mice; *pday 5 WT MC903 vs. KO MC903 = 0.1023, n = 6,6 mice; pday 5 WT EtOH vs. KO MC903 = 0.9077, n = 8,6 mice; pday 5 WT MC903 vs. WT EtOH = 0.0264, n = 6,8 mice). (B) Mast cell count from cheek skin of wild-type MC903- and ethanol-treated, and TSLPR KO MC903-treated mice after 3, 5, or 8 days of treatment (two-way ANOVA: *pgenotype = 0.0384, F(2,117) = 3.35; Tukey’s multiple comparisons: pday 3 WT MC903 vs. KO MC903 = 0.4133, n = 3,5 mice; pday 5 WT MC903 vs. KO MC903 = 0.9882, n = 6,6 mice; *pday 5 WT MC903 vs. WT EtOH = 0.0440, n = 6,5 mice; *pday 5 KO MC903 vs. WT EtOH = 0.0294, n = 6,5 mice; *pday 8 WT MC903 vs. KO MC903 = 0.0188, n = 40,15 mice; ****pday 8 WT MC903 vs. WT EtOH < 0.0001, n = 40,38 mice; pday 8 WT EtOH vs. KO MC903 = 0.7810, n = 38,15 mice). Data from days 3, 5, and 8 are presented in Figure 2—source data 3.
Figure 2—figure supplement 5
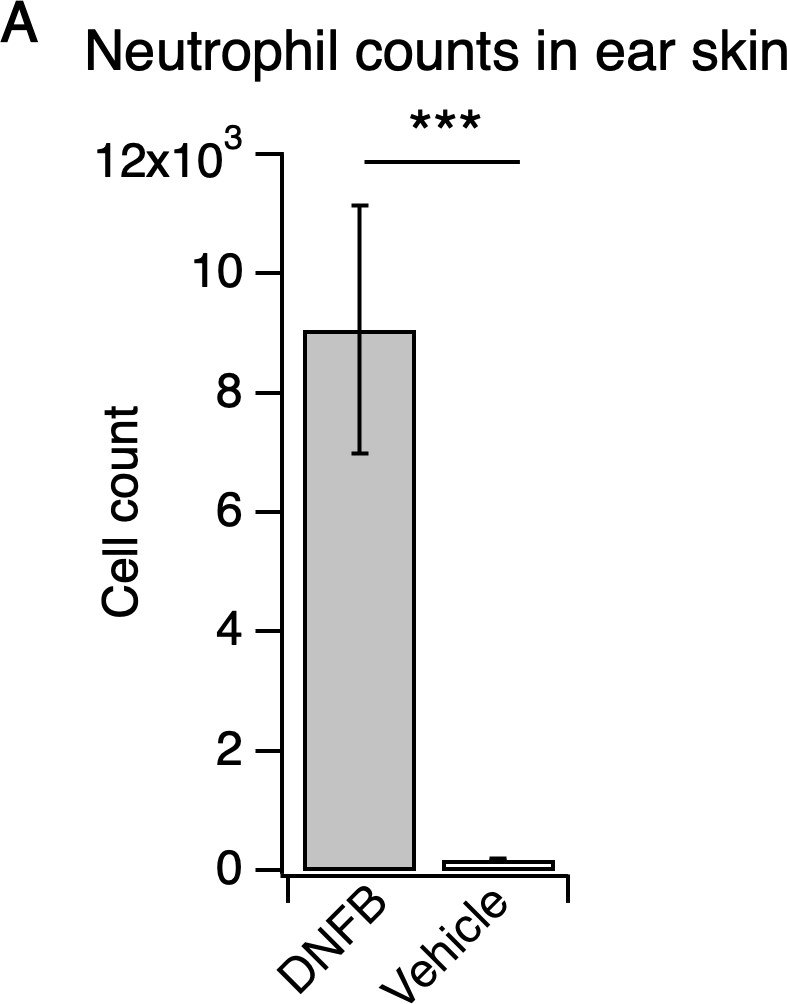
Neutrophils robustly infiltrate the skin in the DNFB mouse model of atopic dermatitis.
(A) Neutrophil count from ear skin of wild-type DNFB- and vehicle-treated mice 24 hr after challenge with DNFB or vehicle performed five days after initial DNFB sensitization on shaved rostral back skin (***p=0.0004; two-tailed t-test (t = 4.290; df = 18); n = 10 mice per group). Values from bar plot is reported in Figure 2—source data 6.
Figure 3 with 1 supplement
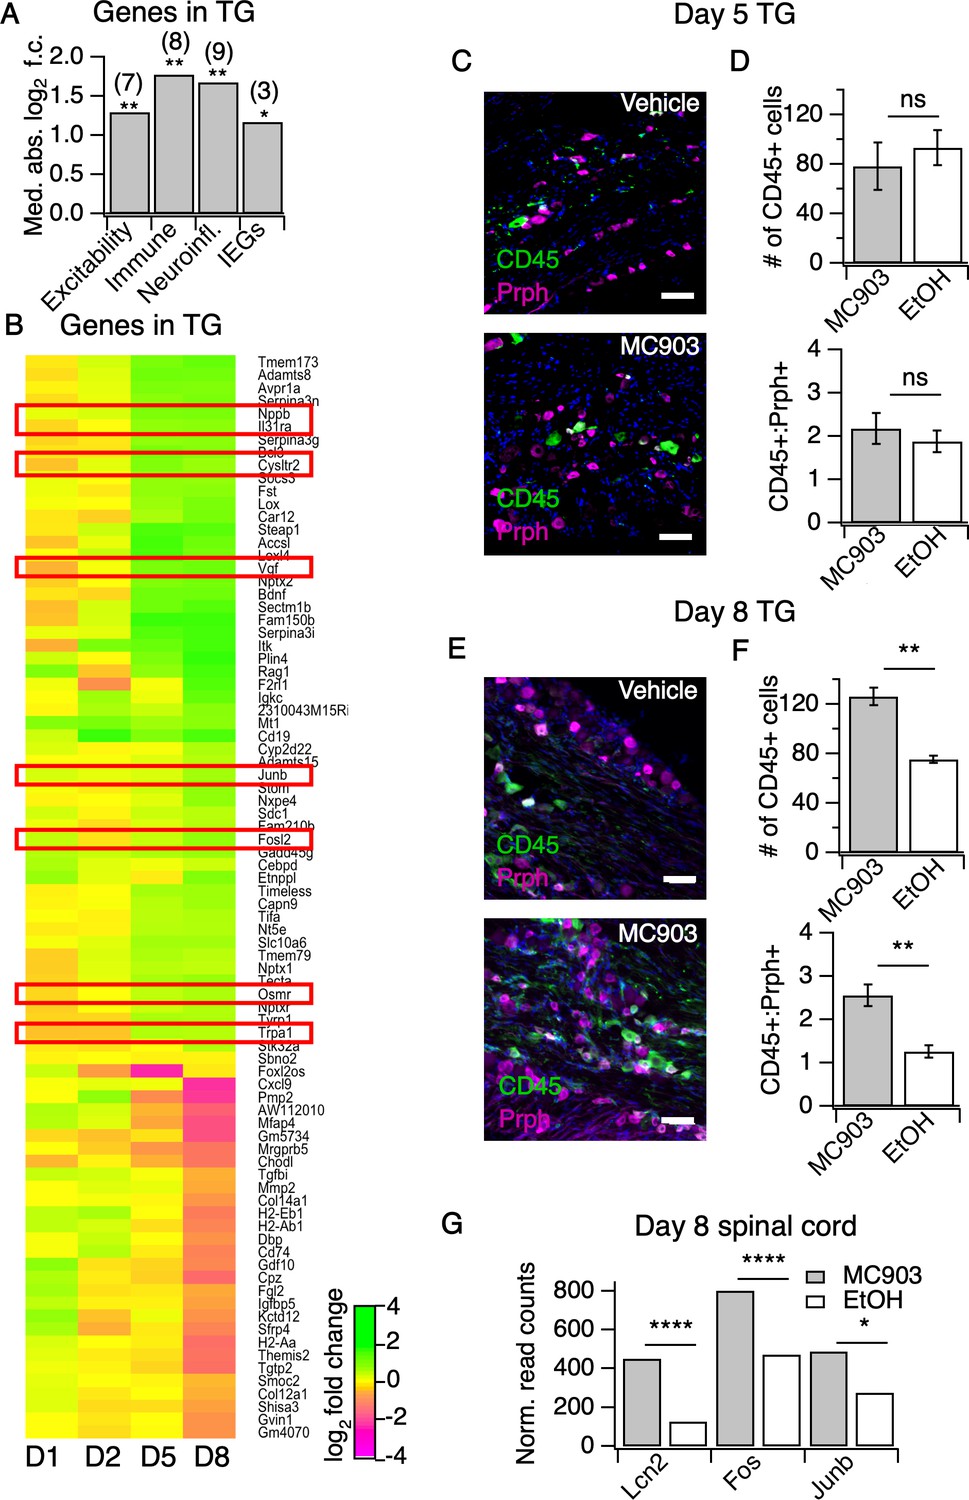
The MC903 model induces rapid and robust changes in neuronal tissue.
(A) Exact permutation test (10,000 iterations, see Materials and methods) for significance of mean absolute log2 fold change in gene expression at Day 8 (MC903 vs. ethanol) of custom-defined groups of genes for indicated categories (see Figure 3—source data 1). (B) Log2 fold change in gene expression (MC903 vs. ethanol) in mouse trigeminal ganglia (TG) at indicated time points for all genes which were significantly differentially expressed for at least one time point in the MC903 model. Green bars = increased expression in MC903 relative to ethanol; magenta = decreased expression. Exact values and corrected p-values are reported in Figure 3—source data 2 and Source Data 1 Supplemental Data, respectively. (C) Representative composite images showing immune cells (CD45, green), and sensory neurons (Prph, magenta) with DAPI (blue) in sectioned trigeminal ganglia from mice treated with Vehicle or MC903 for five days on the cheek. (D) Quantification of images examining average number of CD45+ cells per section and average ratio of CD45:Peripherin cells per section after five days of treatment (p=0.562 (t = 0.6318, df = 4), 0.542 (t = 0.6660, df = 4); two-tailed unpaired t-tests, n = 33–159 fields of view (images) each of both trigeminal ganglia from three mice per condition treated bilaterally). (E) Representative composite images showing immune cells (CD45, green), and sensory neurons (Peripherin (Prph), magenta) with DAPI (blue) in sectioned trigeminal ganglia from mice treated with Vehicle or MC903 for eight days on the cheek. (F) Quantification of images examining average number of CD45+ cells per section and average ratio of CD45:Peripherin cells per section after eight days of treatment (**p=0.0019 (t = 5.977,df = 5), **p=0.0093 (t = 4.107,df = 4); two-tailed unpaired t-tests; n = 42–172 fields of view (images) each of both trigeminal ganglia from 3 EtOH or 4 MC903 animals treated bilaterally). Scale bar = 100 µm. Images were acquired on a fluorescence microscope using a 10x air objective. Values from bar plots and all TG IHC data are available in Figure 3—source data 3. (G) Log2 fold change in gene expression (MC903 vs. ethanol) in mouse spinal cord on day 8 showing selected differentially expressed genes (padjusted < 0.05). Exact values and corrected p-values are reported in Source Data 1 Supplemental Data.
-
Figure 3—source data 1
Values displayed in the bar plot shown in Figure 3A.
- https://cdn.elifesciences.org/articles/48448/elife-48448-fig3-data1-v2.csv
-
Figure 3—source data 2
Values displayed in the heat map shown in Figure 3B.
- https://cdn.elifesciences.org/articles/48448/elife-48448-fig3-data2-v2.csv
-
Figure 3—source data 3
Quantification of all IHC samples from trigeminal ganglia, and Values displayed in the bar plots shown in Figure 3D,F.
- https://cdn.elifesciences.org/articles/48448/elife-48448-fig3-data3-v2.csv
Figure 3—figure supplement 1
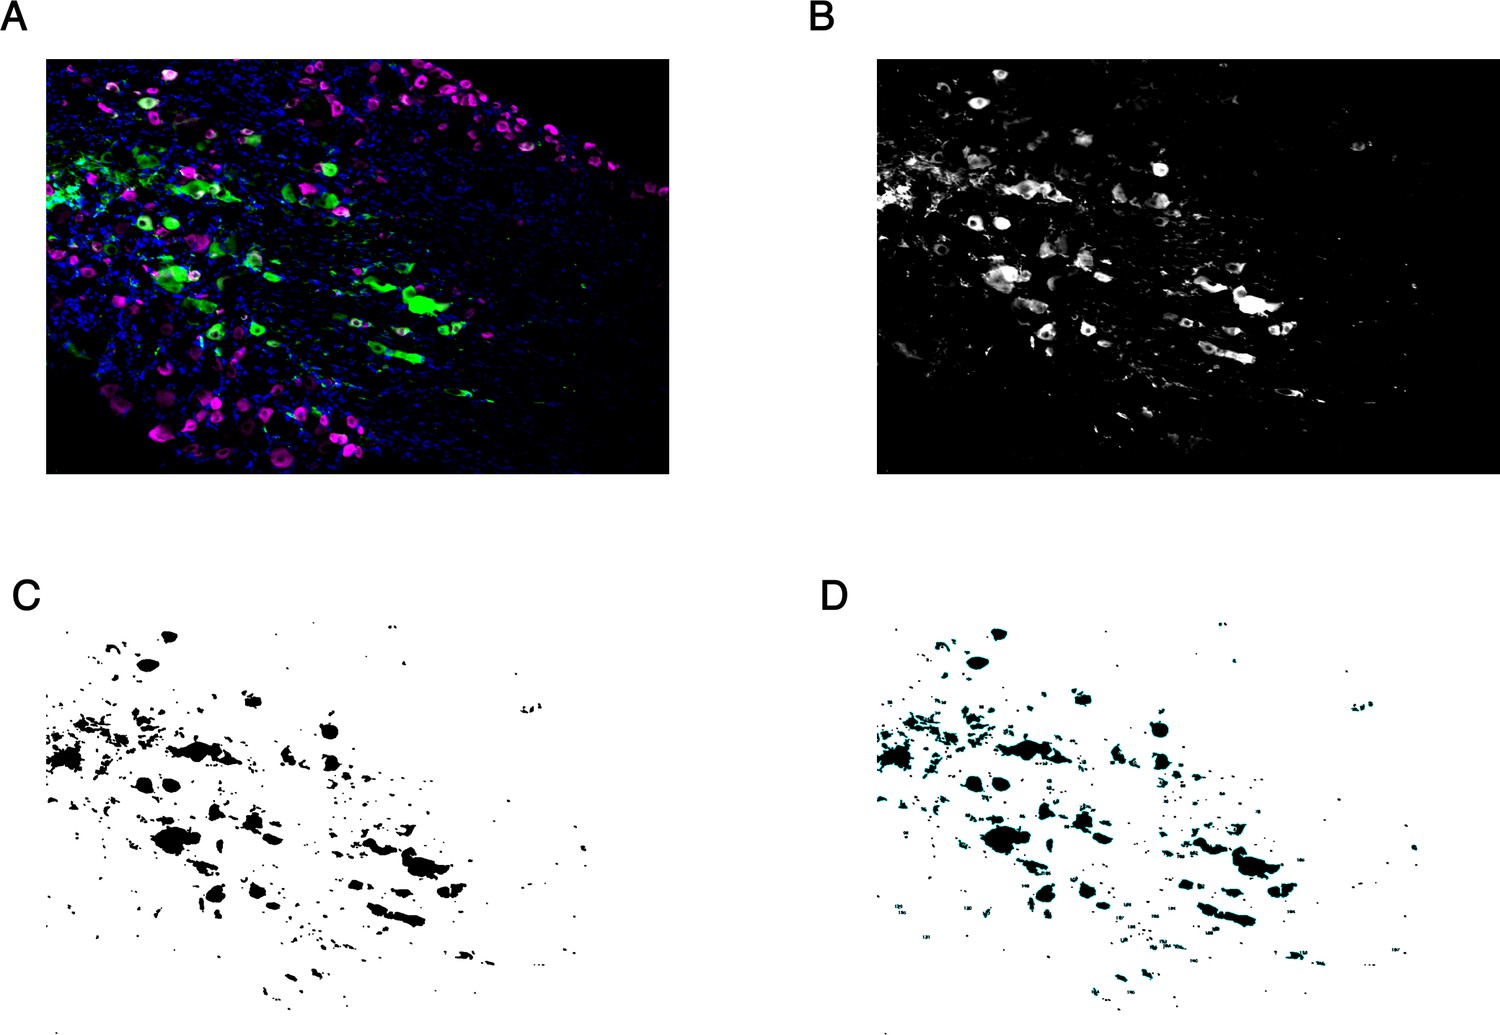
Method of image quantification for sectioned trigeminal ganglia.
(A) Representative composite image showing CD45 (green), Peripherin (magenta), and DAPI (blue). (B) Single-channel CD45 image with automated min/max intensity thresholding. (C) Resultant binary image generated from (B). (D) Cells were counted as the number of regions of interest (ROIs) outlined in blue.
Figure 4 with 1 supplement
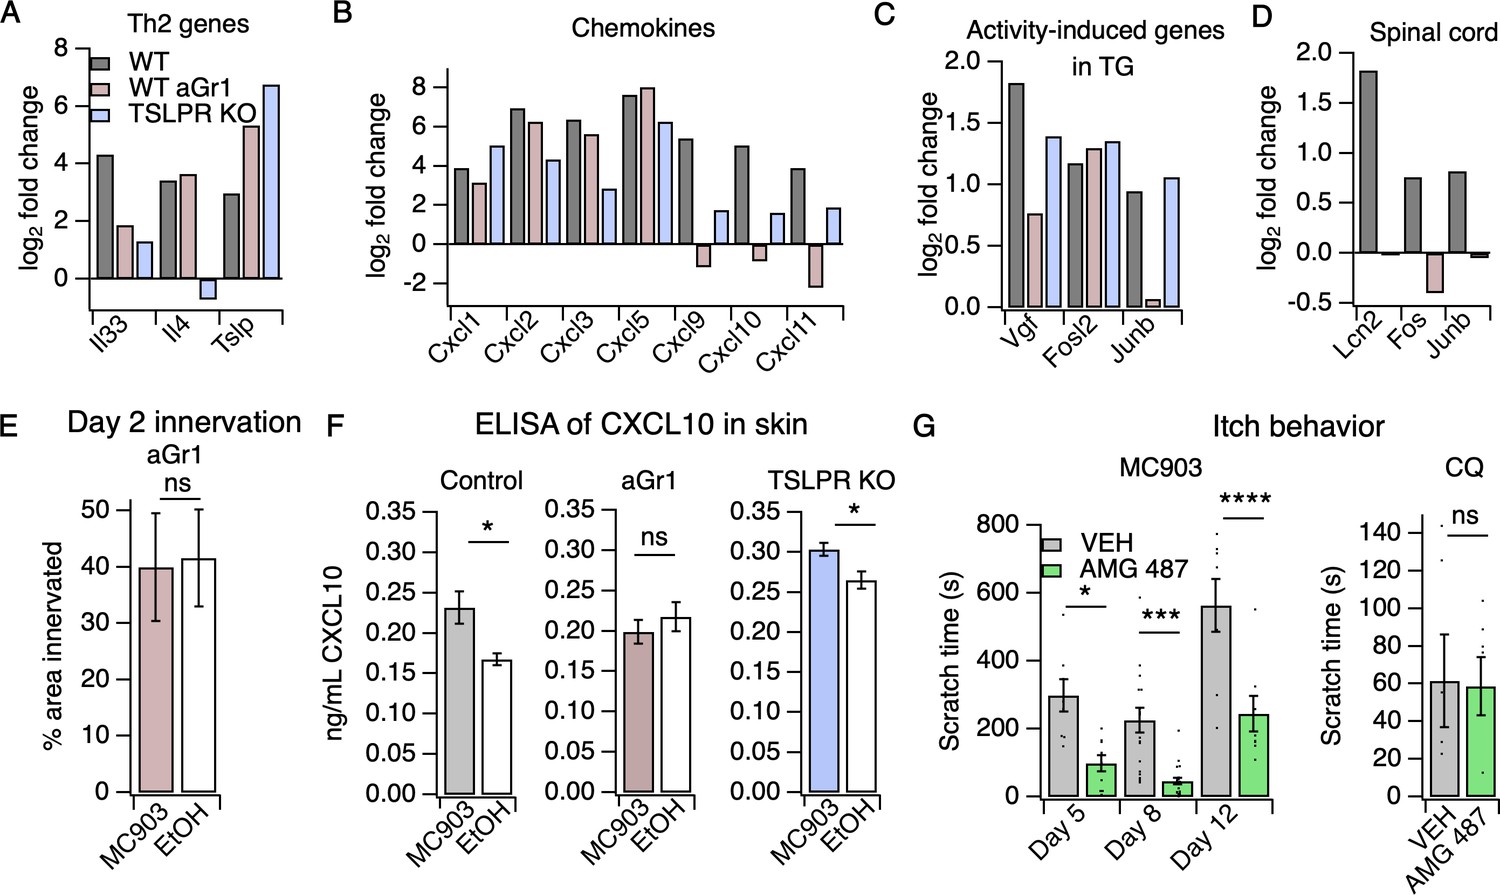
Neutrophils are required for induction of the itch-inducing chemokine CXCL10.
(A) Log2 fold change (Day 8 MC903 vs. EtOH) of Th2 genes in skin from uninjected wild-type, aGR1-treated, and TSLPR KO animals. (B) Log2 fold change (Day 8 MC903 vs. EtOH) of chemokine genes in skin from uninjected wild-type, aGr1-treated, and TSLPR KO animals. (C) Log2 fold change (Day 8 MC903 vs. EtOH) of activity-induced genes in trigeminal ganglia from uninjected wild-type, aGr1-treated, and TSLPR KO animals. (D) Log2 fold change (Day 8 MC903 vs. EtOH) of Lcn2 and activity-induced genes in spinal cord from uninjected and aGr1-treated wild-type mice on day 8. For Figure 4A–D, exact values and corrected p-values are reported in Source Data 1 Supplemental Data. (E) Quantification of innervation (see Materials and methods) of MC903 and EtOH-treated mouse skin as determined from BTIII staining (p=0.8985; two-tailed t-test (t = 0.1294; df = 18); n = 9,11 images each from two mice per treatment. Exact values are reported in Figure 4—source data 1. (F) CXCL10 levels in skin homogenate as measured by ELISA on day 8 of the MC903 model for uninjected animals (left; *p=0.029 (t = 2.715, df = 7); two-tailed t-test; n = 4,5 animals), animals which received aGr1 for 8 days (middle; p=0.43 (t = 0.815, df = 11); two-tailed t-test; n = 6,6 animals), and TSLPR KO animals (right; *p=0.0357 (t = 2.696, df = 6); two-tailed t-test; n = 4,4 animals. Skin homogenates were isolated on separate days and so uninjected, WT samples were not compared to aGr1-treated samples or to TSLPR KO samples. (G) (Left) Time spent scratching over a thirty minute interval on days 5, 8, and 12 of the MC903 model, one hour after mice were injected with either 3.31 mM of the CXCR3 antagonist AMG 487 or vehicle (20% HPCD in PBS; 50 µL s.c. in rostral back); (two-way ANOVA: ****ptreatment <0.0001, F(1,67) = 50.64; Tukey’s multiple comparisons: *pday 5 = 0.0216, n = 8,10 mice; ***pday 8 = 0.0007, n = 18,21 mice; ****pday 12 < 0.0001, n = 8,8 mice). (Right) Time spent scratching over a thirty minute interval one hour after mice were injected with either 3.31 mM of the CXCR3 antagonist AMG 487 or vehicle (20% HPCD in PBS; 50 µL s.c. in rostral back), and immediately after mice were injected with 50 mM chloroquine (20 µL i.d., cheek). p=0.92 (t = 0.0964, df = 8); two-tailed t-test; n = 5,5 mice. Values from bar plots in Figure 4F–G are displayed in Figure 4—source data 2.
-
Figure 4—source data 1
Values displayed in the bar plot shown in Figure 4E.
- https://cdn.elifesciences.org/articles/48448/elife-48448-fig4-data1-v2.csv
-
Figure 4—source data 2
Values displayed in the bar plots shown in Figure 4F–G.
- https://cdn.elifesciences.org/articles/48448/elife-48448-fig4-data2-v2.csv
-
Figure 4—source data 3
Values displayed in the heat map shown in Figure 4—figure supplement 1A.
- https://cdn.elifesciences.org/articles/48448/elife-48448-fig4-data3-v2.csv
-
Figure 4—source data 4
Values displayed in the heat map shown in Figure 4—figure supplement 1B.
- https://cdn.elifesciences.org/articles/48448/elife-48448-fig4-data4-v2.csv
Figure 4—figure supplement 1
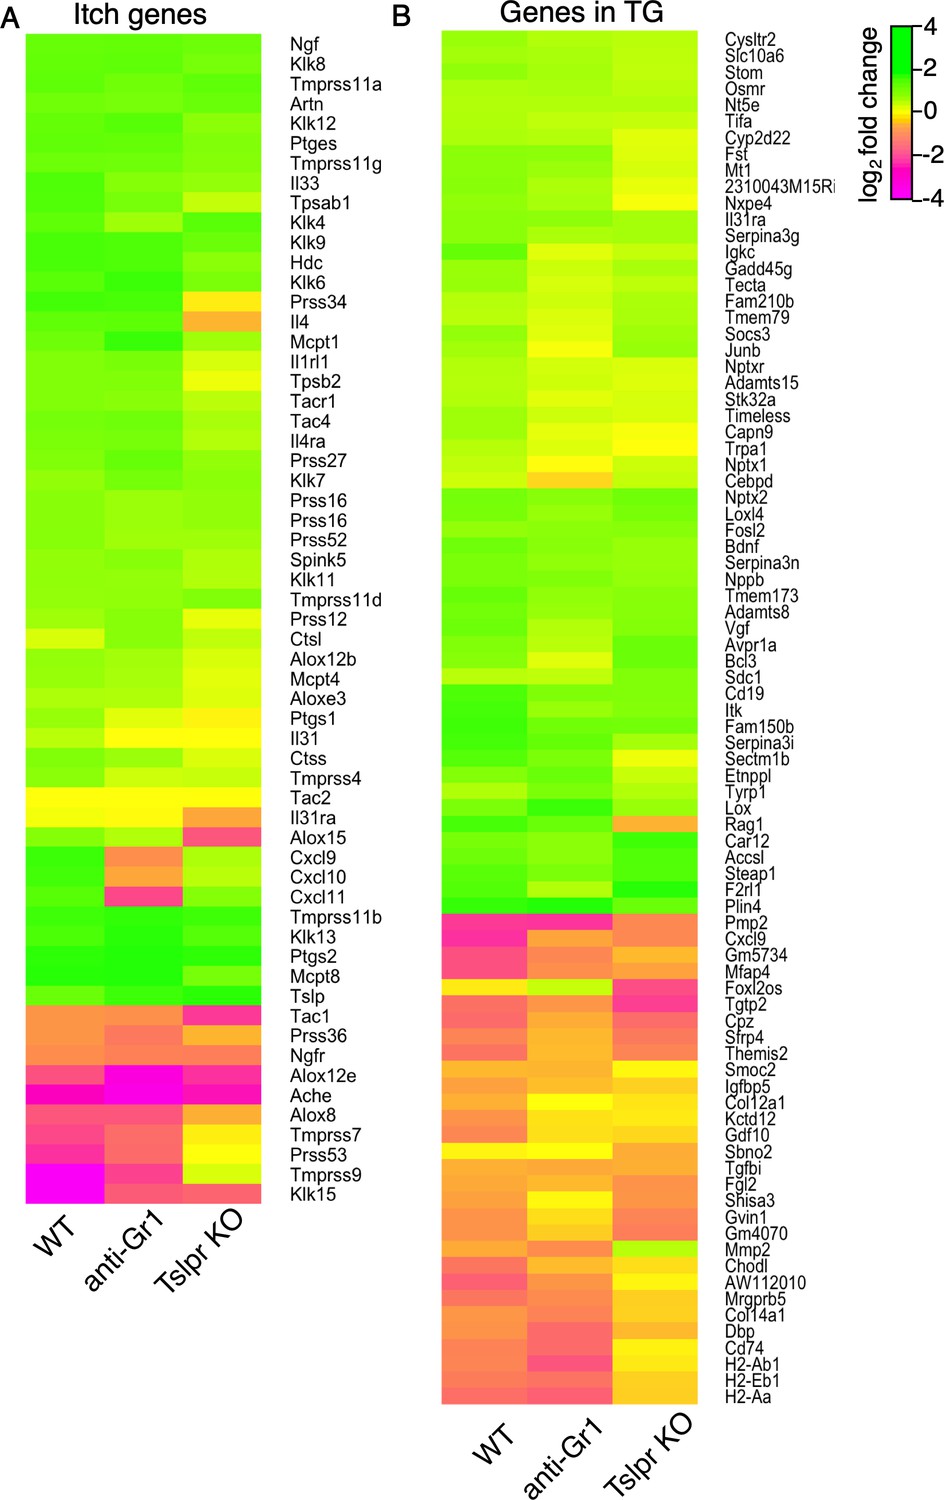
MC903-dependent gene expression changes in aGr1-treated and TSLPR KO animals.
(A) Heat map showing log2 fold change in gene expression (Day 8 MC903 vs. EtOH) for itch-associated genes in wild-type, aGr1-treated, and TSLPR KO skin. Green bars = increased expression in MC903 relative to ethanol; magenta = decreased expression. Exact values and corrected p-values are reported in Figure 4—source data 3 and Source Data 1 Supplemental Data, respectively. (B) Heat map showing log2 fold change in gene expression (Day 8 MC903 vs. EtOH) for wild-type, aGr1-treated, and TSLPR KO mouse trigeminal ganglia (TG) at indicated time points for all genes which were significantly differentially expressed for at least one time point in the MC903 model (See Figure 2D). Green bars = increased expression in MC903 relative to ethanol; magenta = decreased expression. Exact values and corrected p-values are reported in Figure 4—source data 4 and Source Data 1 Supplemental Data, respectively.
Figure 5

Model of early AD pathogenesis.
(A) AD induction first results in increased protease expression and barrier dysfunction, which drives production of the cytokines TSLP and CXCL1 via PAR2 activation within keratinocytes. CXCL1 can recruit neutrophils via its receptor CXCR2. Neutrophils may evoke itch by multiple pathways, including degranulation and release of proteases and histamine, production of sensitizing lipids such as PGE2 and LTB4, (Hashimoto et al., 2018) and induction of CXCL10 expression, which can activate sensory neurons via CXCR3. TSLP activates a number of immune cells to elicit IL-4 production, including basophils, which results in increased IL-4, recruitment of CD4+ T cells, (Oetjen et al., 2017) and sensitization of neurons to promote itch later in the model.
Tables
Key resources table
| Reagent type (species) or resource | Designation | Source or reference | Identifiers | Additional information |
|---|---|---|---|---|
| Strain, strain background (Mus musculus) | C57BL/6; WT; wild-type | The Jackson Laboratory | Jackson Stock #: 000664; RRID:IMSR_JAX:000664 | |
| Strain, strain background(Mus musculus) | C57BL/6; WT; wild-type | Charles River Laboratories | RRID:IMSR_CRL:27; Charles River strain code #: 027; | |
| Strain, strain background(Mus musculus) | Crlf2tm1Jni; TSLPR KO | PMID: 14993294 | RRID:MGI:3039553; MGI Cat# 3039553 | Obtained from the laboratory of Steven F. Ziegler (Ben Aroya Research Institute) |
| Antibody | Purified anti-mouse Ly-6G/Gr-1 antibody. Low endotoxin, no azide, in PBS; anti-GR1 (RB6-8C5); aGr1 | UCSF Core | UCSF Core Cat# AM051 | Obtained from the laboratory of Daniel Portnoy (UC Berkeley) |
| Antibody | LEAF Purified anti-mouse Ly-6G/Ly-6C (Gr-1); antibody; RB6-8C5; aGr1 | Biolegend | RRID:AB_313379; BioLegend Cat# 108414 | |
| Antibody | Anti-β-tubulin III (Rabbit polyclonal; 1:1000) | Abcam | RRID:AB_444319; Cat # ab18207 | |
| Antibody | Anti-CGRP (Rabbit polyclonal; 1:1000) | Immunostar | RRID:AB_572217; Cat # 24112 | |
| Antibody | Anti-Peripherin (Chicken polyclonal; 1:1000) | Abcam | RRID:AB_777207; Cat # ab39374 | |
| Antibody | Goat Anti-Mouse IgG H and L Alexa Fluor 488 (Goat polyclonal; 1:1000) | Abcam | RRID:AB_2688012; Cat # ab150117 | |
| Antibody | Goat anti-Chicken IgY (H+L) Secondary Antibody, Alexa Fluor 488 (Goat polyclonal; 1:1000) | ThermoFisher Scientific | RRID:AB_2534096; Cat # A-11039 | |
| Antibody | Goat Anti-Chicken IgG (H+L) Secondary Antibody, Alexa Fluor 594 (Goat polyclonal; 1:1000) | ThermoFisher Scientific | RRID:AB_2534099; Cat # A11042 | |
| Antibody | Goat anti-Rabbit IgG (H+L) Secondary Antibody, Alexa Fluor 594 (Goat polyclonal; 1:1000) | Invitrogen | RRID:AB_2556545; Cat # R37117 | |
| Commercial assay or kit | Promocell Keratinocyte Growth Medium 2 | Promocell | Cat # C-20011 | |
| Cell line (human) | Normal Human Epidermal Keratinocytes (NHEK), single juvenile donor, cryopreserved | Promocell | Cat # C-12001 | |
| Other | Liberase TM Research Grade; Liberase | Roche | Cat # 5401119001 | |
| Other | Dnase I from bovine pancreas | Sigma | Cat # 11284932001 | |
| Other | Ambionª DNase I (RNase-free); DNAse | Ambion | Cat # AM2222 | |
| Peptide, recombinant protein | SLIGRL-NH2; SLIGRL | Tocris | Cas 171436-38-7; Cat #1468 | |
| Commercial assay or kit | Qiagen RNeasy mini kit | Qiagen | Cat # 74104 | |
| Commercial assay or kit | RNAzol RT | Sigma-Aldrich | Cat # R4533-50ML | |
| Chemical compound, drug | (2-Hydroxypropyl)- β-cyclodextrin; HPCD | Sigma-Aldrich | Cas 128446-35-5; Cat # H107 | |
| Chemical compound, drug | Methyl alcohol; Methanol; MeOH | Sigma-Aldrich | Cas 67-56-1; Cat # 34860 | |
| Chemical compound, drug | Ethanol, Absolute (200 Proof), Molecular Biology Grade, Fisher BioReagents; Absolute Ethanol, Molecular-Biology grade; Ethanol; EtOH | Fischer Scientific | Cas 64-17-5; Cat # BP2818100 | |
| Chemical compound, drug | MC903; Calcipotriol | Tocris | Cas 112965-21-6; Cat # 2700 | |
| Chemical compound, drug | (±)-AMG 487; AMG | Tocris | Cas 947536-03-0; Cat # 4487 | |
| Chemical compound, drug | Chloroquine diphosphate; Chloroquine | Sigma-Aldrich | CAS 50-63-5; Cat # C6628 | |
| Chemical compound, drug | Dimethyl sulfoxide; DMSO | Sigma-Aldrich | Cat # 8418–100 mL | |
| Chemical compound, drug | Formaldehyde, 16%, methanol free, Ultra Pure; Paraformaldehyde; PFA | Polysciences, Inc. | Cat # 18814–10 | |
| Chemical compound, drug | Tissue Tek Optimal cutting temperature compound (OCT) | Sakura Finetek USA | Cat # 4583 | |
| Chemical compound, drug | Triton X-100 solution; Triton X-100 | BioUltra | CAS 9002-93-1; Cat # 93443 | |
| Chemical compound, drug | Phosphate-buffered saline (PBS), pH 7.4; PBS | Gibco | Cat # 10010023 | |
| Chemical compound, drug | Benzyl benzoate | Sigma-Aldrich | CAS 120-51-4; Cat # B6630 | |
| Chemical compound, drug | Benzyl alcohol | Sigma-Aldrich | CAS 100-51-6; Cat # 305197 | |
| Chemical compound, drug | Sucrose | Sigma-Aldrich | CAS 57-50-1; Cat # S0389 | |
| Chemical compound, drug | LIVE/DEAD Fixable Aqua Dead Cell Stain Kit, for405 nm excitation; Aqua | ThermoFisher Scientific | Cat # L34957 | |
| Chemical compound, drug | Isoflurane | Piramal | CAS 26675-46-7 | |
| Chemical compound, drug | 4',6-Diamidino-2-Phenylindole, Dihydrochloride; DAPI | ThermoFisher Scientific | CAS 28718-90-3; Cat # 1306 | |
| Chemical compound, drug | 4',6-Diamidino-2-Phenylindole, Dihydrochloride; DAPI LIVE/DEAD | Invitrogen | Cat # L34961 | |
| Chemical compound, drug | Fluoromount-G | ThermoFisher Scientific | Cat # 00-4958-02 | |
| Antibody | Goat Anti-Mouse IgG - H and L - Fab Fragment Polyclonal Antibody, Unconjugated, Abcam; F(ab) anti-mouse IgG (Goat polyclonal; 1:200) | Abcam | RRID:AB_955960; Cat # ab6668 | |
| Antibody | Anti-Mouse CD45.2 Purified 100 ug antibody, Thermo Fisher Scientific; Mouse anti-CD45.2 (Mouse monoclonal; 1:1000) | eBioscience | RRID:AB_467261; Cat # 14-0454-82 | |
| Antibody | Purified anti-mouse CD16/32 antibody. Low endotoxin, no azide, in PBS; Rat anti-Mouse CD16/32 (2.4G2) (Rat monoclonal; 1:1000) | UCSF Core | UCSF Core Cat# AM004 | |
| Commercial assay or kit | DuoSet ELISA Ancillary Reagent Kit 2 | R and D Systems | Cat # DY008 | |
| Commercial assay or kit | Mouse CXCl10 DuoSet ELISA | R and D Systems | Cat # DY466 | |
| Commercial assay or kit | Pierce BCA Protein Assay Kit - Reducing Agent Compatible | ThermoFisher Scientific | Cat # 23250 | |
| Chemical compound, drug | 2-Amino-2-(hydroxymethyl)−1,3-propanediol; Trizma base, TRIS, TRIS base | Sigma-Aldrich | Cas 77-86-1; Cat # T4661 | |
| Chemical compound, drug | Ethylene glycol-bis(2-aminoethylether)-N,N,N′,N′-tetraacetic acid; EGTA | Sigma-Aldrich | Cas 67-42-5; Cat # E3889 | |
| Chemical compound, drug | Ethylenedinitrilo)tetraacetic acid; EDTA | Sigma-Aldrich | Cas 60-00-4; Cat # E9884 | |
| Commercial assay or kit | PhosSTOP inhibitor | Roche | Cat # 4906845001 | |
| Chemical compound, drug | Sodium deoxycholate,≥97% (titration); Sodium deoxycholate | Sigma-Aldrich | Cas 302-95-4; Cat # D6750 | |
| Chemical compound, drug | Phenylmethylsulfonyl fluoride; PMSF | Sigma-Aldrich | Cas 329-98-6; Cat # 10837091001 | |
| Chemical compound, drug | 1-Fluoro-2,4,-dinitrobenzene; DNFB | Sigma | Cas 70-34-8; Cat # D1529 | |
| Commercial assay or kit | cOmplete protease inhibitor cocktail | Roche | Cat # 11697498001 | |
| Other | Advanced RPMI Medium 1640; RPMI | Gibco | Cat # 12633012 | |
| Other | Fetal Bovine Serum; FBS; FCS | HyClone | Cat # 30396.03 | |
| Other | sodium pyruvate 100 mM | Gibco | Cat # 11360070 | |
| Other | N-2-hydroxyethylpiperazine-N-2-ethane sulfonic acid; HEPES 1M | Gibco | Cat # 15630080 | |
| Other | L-Glutamine 200 mM | Gibco | Cat # 25030081 | |
| Other | Penicillin-Streptomycin (10,000 U/mL; Pen-Strep | Gibco | Cat # 15140122 | |
| Other | Collagenase VIII | Sigma-Aldrich | Cat # C2139-500MG | |
| Commercial assay or kit | Invitrogen CountBright Absolute Counting Beads, for flow cytometry; Counting Beads | Invitrogen | Cat # C36950 | |
| Antibody | CD45 Monoclonal Antibody (30-F11), APC-eFluor 780, eBioscience(TM), Thermo Fisher Scientific; CD45-APC/eFluor 780 (30-F11) (Rat monoclonal; 1:200) | eBioscience | RRID:AB_1548781; Cat # 47-0451-82 | |
| Antibody | CD11b Monoclonal Antibody (M1/70), PE-Cyanine7, eBioscience(TM), Thermo Fisher Scientific; CD11b-PE/Cy7 (M1/70) (Rat monoclonal; 1:200) | BD Biosciences | RRID:AB_469588; Cat # 25-0112-82 | |
| Antibody | PE-Cyanine7 Anti-Human/Mouse CD45R (B220) (RA3-6B2) Antibody, Tonbo Biosciences; B220-PE/Cy7 (RA3-6B2) (Rat monoclonal; 1:200) | Tonbo Biosciences | RRID:AB_2621849; Cat # 60–0452 | |
| Antibody | CD11c Monoclonal Antibody (N418), PE-Cyanine7, eBioscience(TM), Thermo Fisher Scientific; CD11c-PE/Cy7 (N418) (Armenian Hamster monoclonal; 1:200) | eBioscience | RRID:AB_469590; Cat # 25-0114-82 | |
| Antibody | CD3e Monoclonal Antibody (145–2 C11), FITC, eBioscience(TM), Thermo Fisher Scientific; CD3-FITC (145–2 C11) (Armenian Hamster monoclonal; 1:200) | eBioscience | RRID:AB_464882; Cat # 11-0031-82 | |
| Antibody | Brilliant Violet 785 anti-mouse CD8a antibody, BioLegend; CD8-BV785 (53–6.7) (Rat monoclonal; 1:200) | Biolegend | RRID:AB_1121880; Cat # 100749 | |
| Antibody | Rat Anti-CD4 Monoclonal Antibody, Phycoerythrin Conjugated, Clone GK1.5, BD Biosciences; CD4-PE (GK1.5) (Rat monoclonal; 1:200) | BD Biosciences | RRID:AB_395014; Cat # 553730 | |
| Antibody | Alexa Fluor 647 anti-mouse TCR γ/δ Antibody; gdTCR-AF647 (GL3) (Armenian Hamster monoclonal; 1:200) | Biolegend | RRID:AB_313826; Cat # 118133 | |
| Antibody | CD117 (c-Kit) Monoclonal Antibody (2B8), Biotin; c-Kit-Biotin (ACK2) (Rat monoclonal; 1:200) | eBioscience | RRID:AB_466569; Cat # 13-1171-82 | |
| Antibody | FceR1 alpha Monoclonal Antibody (MAR-1), PE, eBioscience; FceRI-PE (MAR-1) (Armenian Hamster monoclonal; 1:200) | eBioscience | RRID:AB_466028; Cat # 12-5898-82 | |
| Antibody | CD49b (Integrin alpha 2) Monoclonal Antibody (DX5), PE-Cyanine7, eBioscience; CD49b-PE/Cy7 (DX5) (Rat monoclonal; 1:200) | eBioscience | RRID:AB_469667; Cat # 25-5971-82 | |
| Antibody | Anti-Siglec-F-APC, mouse (clone: REA798); SiglecF-APC; (Rat monoclonal; 1:200) | Miltenyi Biotech | RRID:AB_2653441; Cat # 130-112-333 | |
| Other | Streptavidin FITC; SA-FITC | eBioscience | RRID:AB_11431787; Cat # 11-4317-87 | |
| Antibody | Ly-6C Monoclonal Antibody (HK1.4), PerCP-Cyanine5.5, eBioscience; Ly6C-PerCP/Cy5.5 (HK1.4) (Rat monoclonal; 1:200) | eBioscience | RRID:AB_1518762; Cat # 45-5932-82 | |
| Antibody | violetFluor 450 Anti-Human/Mouse CD11b (M1/70); CD11b-violet fluor 450 (M1/70) (Rat monoclonal; 1:200) | Tonbo Biosciences | RRID:AB_2621936; Cat # 75–0112 | |
| Antibody | AF700 anti-mouse Ly-6G Antibody (1A8); Ly6G-AF700 (1A8) (Rat monoclonal; 1:200) | BioLegend | RRID:AB_1064045; Cat # 127621 | |
| Antibody | CD45.2 Monoclonal Antibody (104), APC-Cy7, eBioscience; CD45.2-APC/Cy7 (104) (Mouse monoclonal, 1:200) | eBioscience | RRID:AB_1272175; Cat # 47-0454-82 | |
| Software, algorithm | IgorPro version 6.3 | WaveMetrics | https://www.wavemetrics.com/order/order_igordownloads6.htm | |
| Software, algorithm | Microsoft Excel 2011 | Microsoft | https://www.microsoft.com/en-us/store/d/excel-2016-for-mac/ | |
| Software, algorithm | FIJI | NIH | https://imagej.net/Fiji/Downloads | |
| Software, algorithm | Graphpad Prism 7 | Graphpad | https://www.graphpad.com/scientific-software/prism/ | |
| Software, algorithm | R-3.6.0 | The R Project for Statistical Computing | https://cran.r-project.org/bin/macosx/ | |
| Software, algorithm | Python 2.7 | Anaconda | https://www.anaconda.com/distribution/ | |
| Software, algorithm | HTSeq 0.11.1 | Python Package Index | https://htseq.readthedocs.io/en/release_0.11.1/install.html | |
| Software, algorithm | Trimmomatic | PMID: 24695404 | https://github.com/timflutre/trimmomatic | |
| Software, algorithm | Tophat 2.1.1 | PMID: 19289445 | https://ccb.jhu.edu/software/tophat/ | |
| Software, algorithm | EdgeR | PMID: 19910308; PMID: 22287627 | https://bioconductor.org/packages/release/bioc/html/edgeR.html | |
| Software, algorithm | DESeq | PMID: 20979621 | https://bioconductor.org/packages/release/bioc/html/DESeq.html | |
| Software, algorithm | FlowJo 10.4.2 | FlowJo; Treestar | https://www.flowjo.com/solutions/flowjo/downloads | |
| Other | Bovine serum albumin, cold ethanol fraction, pH 5.2,≥96%; BSA | Sigma-Aldrich | CAS 9048-46-8; Cat # A4503 | |
| Other | NGS; Goat serum; Normal goat serum | Abcam | Cat # ab7481 |
Author response table 1
| Neutrophils | Basophils | Infl. Monos. | Mast Cells | |||||
|---|---|---|---|---|---|---|---|---|
| INPUT | Day 5 | Day 8 | Day 5 | Day 8 | Day 5 | Day 8 | Day 5 | Day 8 |
| Effect size | 1.518 | 0.836 | 1.433 | 1.002 | 1.1711 | 0.8241 | 0.736 | 1.0670 |
| α error prob | 0.05 | 0.05 | 0.05 | 0.05 | 0.05 | 0.05 | 0.05 | 0.05 |
| # groups | 2 | 2 | 2 | 2 | 2 | 2 | 2 | 2 |
| sample size | 14 | 78 | 14 | 78 | 14 | 78 | 14 | 78 |
| OUTPUT | ||||||||
| λ | 32.26 | 54.618 | 28.99 | 102.34 | 19.2 | 52.98 | 7.583 | 31.54 |
| Fcrit | 4.747 | 3.966 | 4.747 | 3.966 | 4.747 | 3.966 | 4.747 | 3.966 |
| Num. df | 1 | 1 | 1 | 1 | 1 | 1 | 1 | 1 |
| Denom. df | 12 | 76 | 12 | 76 | 12 | 76 | 12 | 76 |
| Power | 0.993 | 1 | 0.986 | 1 | 0.979 | 0.999 | 0.715 | 0.999 |
Additional files
-
Source data 1
The outputs of all DESeq differential expression analyses used to determine adjusted p value and log2 fold change for all RNA-seq experiments in the manuscript.
- https://cdn.elifesciences.org/articles/48448/elife-48448-data1-v2.zip
-
Supplementary file 1
Number of mapped reads and sample information for all RNA-seq samples represented in the manuscript.
- https://cdn.elifesciences.org/articles/48448/elife-48448-supp1-v2.csv
-
Supplementary file 2
Outputs of statistical tests performed on behavioral and flow cytometry data to determine whether select data sets could be combined.
- https://cdn.elifesciences.org/articles/48448/elife-48448-supp2-v2.xlsx
-
Supplementary file 3
All flow cytometry data from Figures 1–2 represented as % of CD45+ cells.
- https://cdn.elifesciences.org/articles/48448/elife-48448-supp3-v2.xlsx
-
Transparent reporting form
- https://cdn.elifesciences.org/articles/48448/elife-48448-transrepform-v2.pdf
Download links
A two-part list of links to download the article, or parts of the article, in various formats.
Downloads (link to download the article as PDF)
Open citations (links to open the citations from this article in various online reference manager services)
Cite this article (links to download the citations from this article in formats compatible with various reference manager tools)
Neutrophils promote CXCR3-dependent itch in the development of atopic dermatitis
eLife 8:e48448.
https://doi.org/10.7554/eLife.48448


