Zika seroprevalence declines and neutralizing antibodies wane in adults following outbreaks in French Polynesia and Fiji
- London School of Hygiene and Tropical Medicine, United Kingdom
- Institut Louis Malardé, French Polynesia
- Fiji Centre for Communicable Disease Control, Fiji
- The University of the South Pacific, Fiji
- Institut Pasteur, France
- Direction de la Santé de la Polynésie française, French Polynesia
- Australian National University, Australia
Figures
Figure 1 with 4 supplements
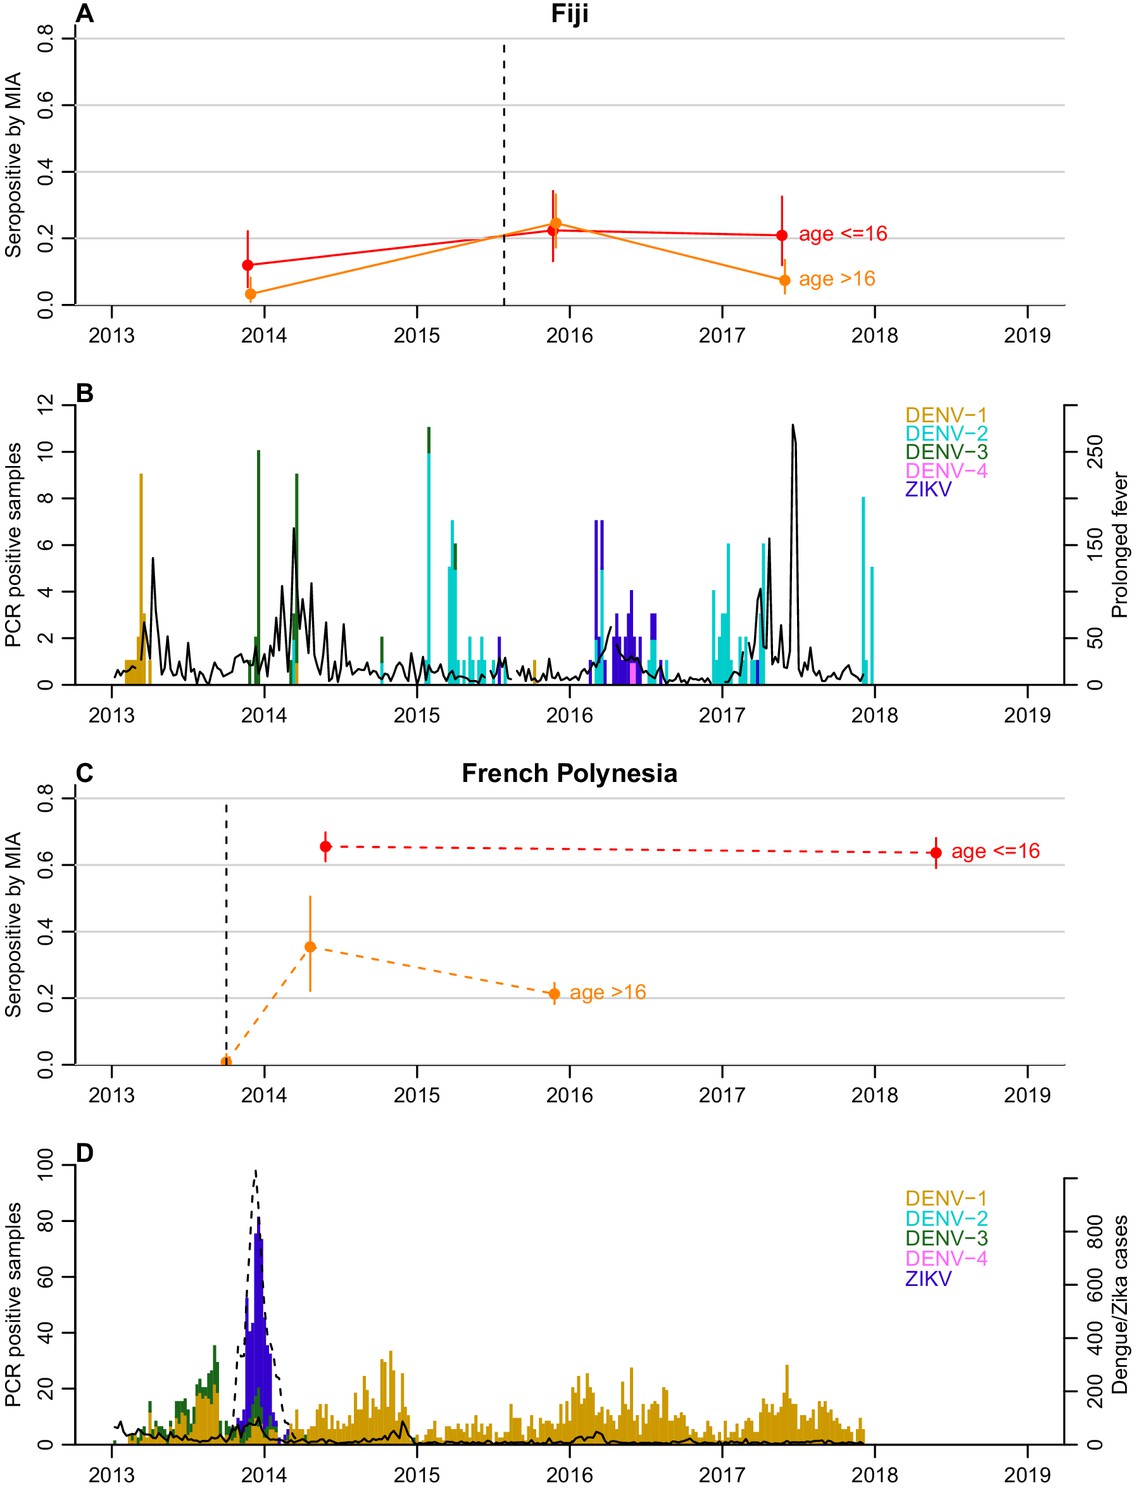
Dynamics of ZIKV seroprevalence following outbreaks in Fiji and French Polynesia.
(A) Seroprevalence by MIA in Fiji. Red, seroprevalence and 95% confidence intervals for children (aged ≤16 years). Orange, seroprevalence and 95% confidence intervals for adults (aged >16 years). Solid lines, trends in data collected from the same individuals. Dotted line indicates the first confirmed ZIKV case. (B) Epidemiological dynamics in Fiji between 2013 and 2018. Coloured bars show number of PCR-confirmed samples of different DENV serotypes and ZIKV in Fiji; black lines show reported prolonged fever in Fiji from the Pacific Syndromic Surveillance System (World Health Organization, 2019). There was a major outbreak of DENV-3 outbreak in 2013–14 (Kucharski et al., 2018a) with a smaller DENV-2 outbreak in early 2017 (Aubry et al., 2019). (C) Seroprevalence by MIA in French Polynesia. Dashed lines, trends in seroprevalence between population representative cross-sectional surveys. Note that the pre-outbreak samples were collected between July 2011 and October 2013; for brevity, the latest possible collection date is used in the plot. (D) Epidemiological dynamics in French Polynesia between 2013 and 2018. Solid black line shows reported symptomatic dengue cases; dashed lines showed reported symptomatic Zika cases. In French Polynesia, between the sampling periods, there were no reported DENV outbreaks for serotypes 2,3,4, and there was hyper-endemic DENV-1 circulation. In April 2019, a DENV-2 outbreak was declared, the first since 1997 (Aubry et al., 2019).
Figure 1—figure supplement 1
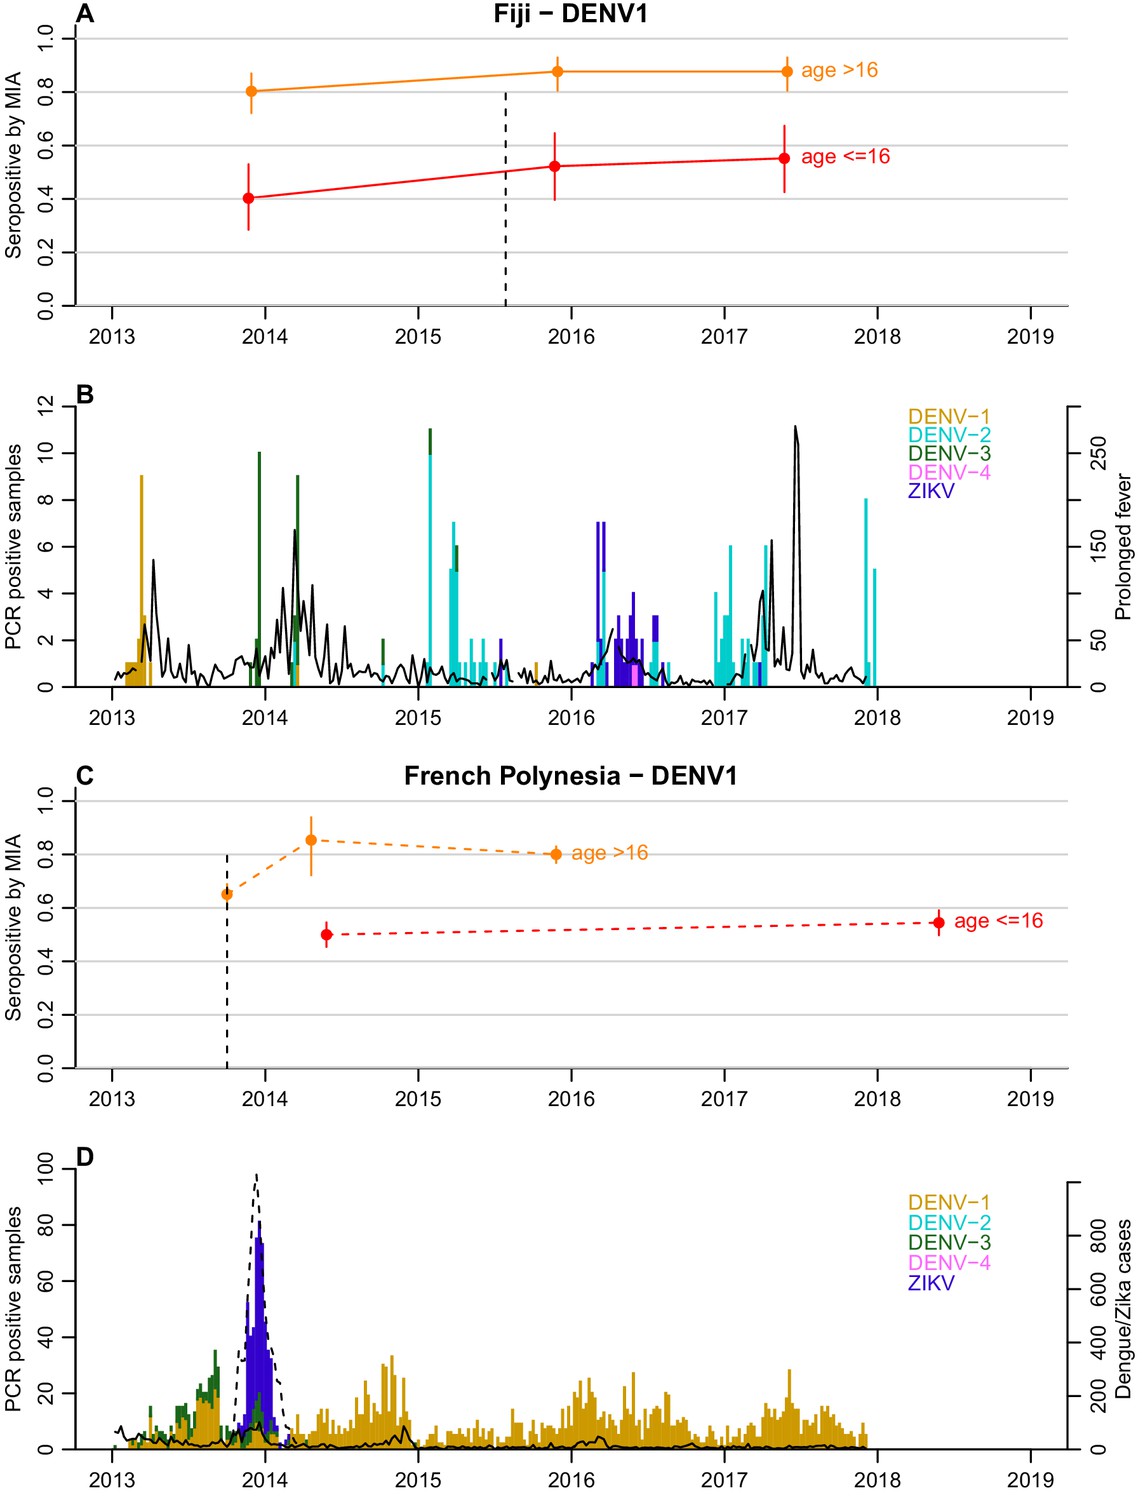
Seroprevalence against DENV-1 in Fiji and French Polynesia, by age group.
Figure colour scheme and data characteristics are same as in Figure 1.
Figure 1—figure supplement 2
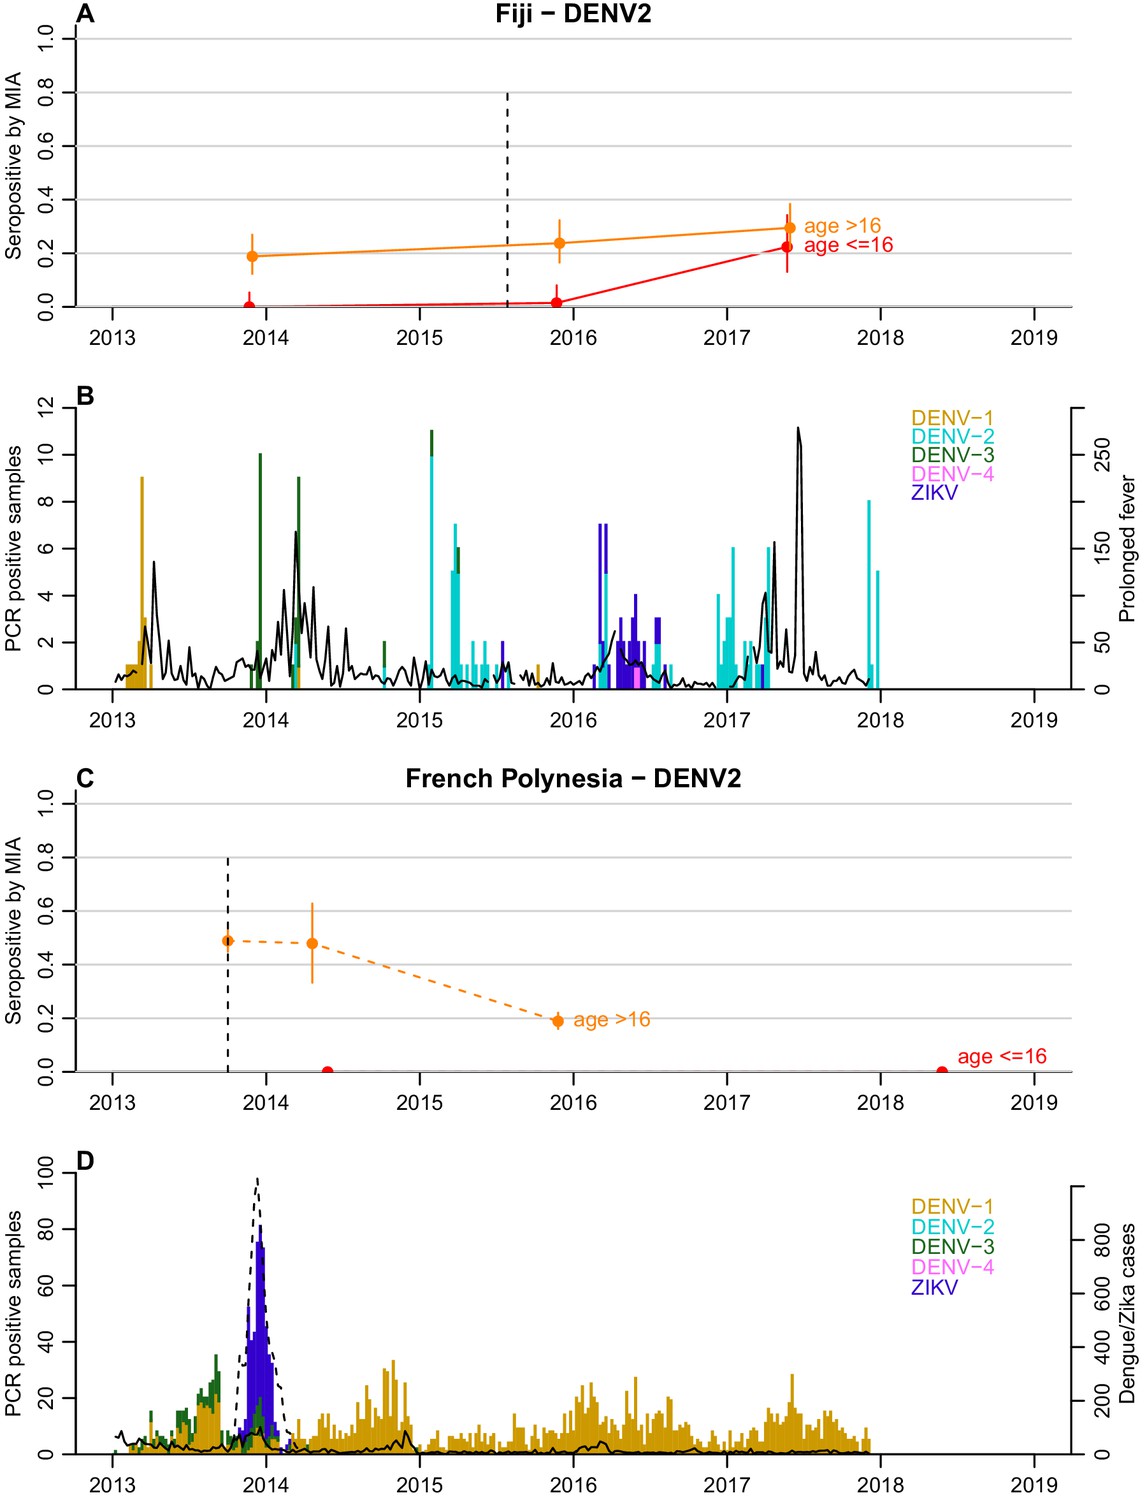
Seroprevalence against DENV-2 in Fiji and French Polynesia, by age group.
Figure colour scheme and data characteristics are same as in Figure 1.
Figure 1—figure supplement 3
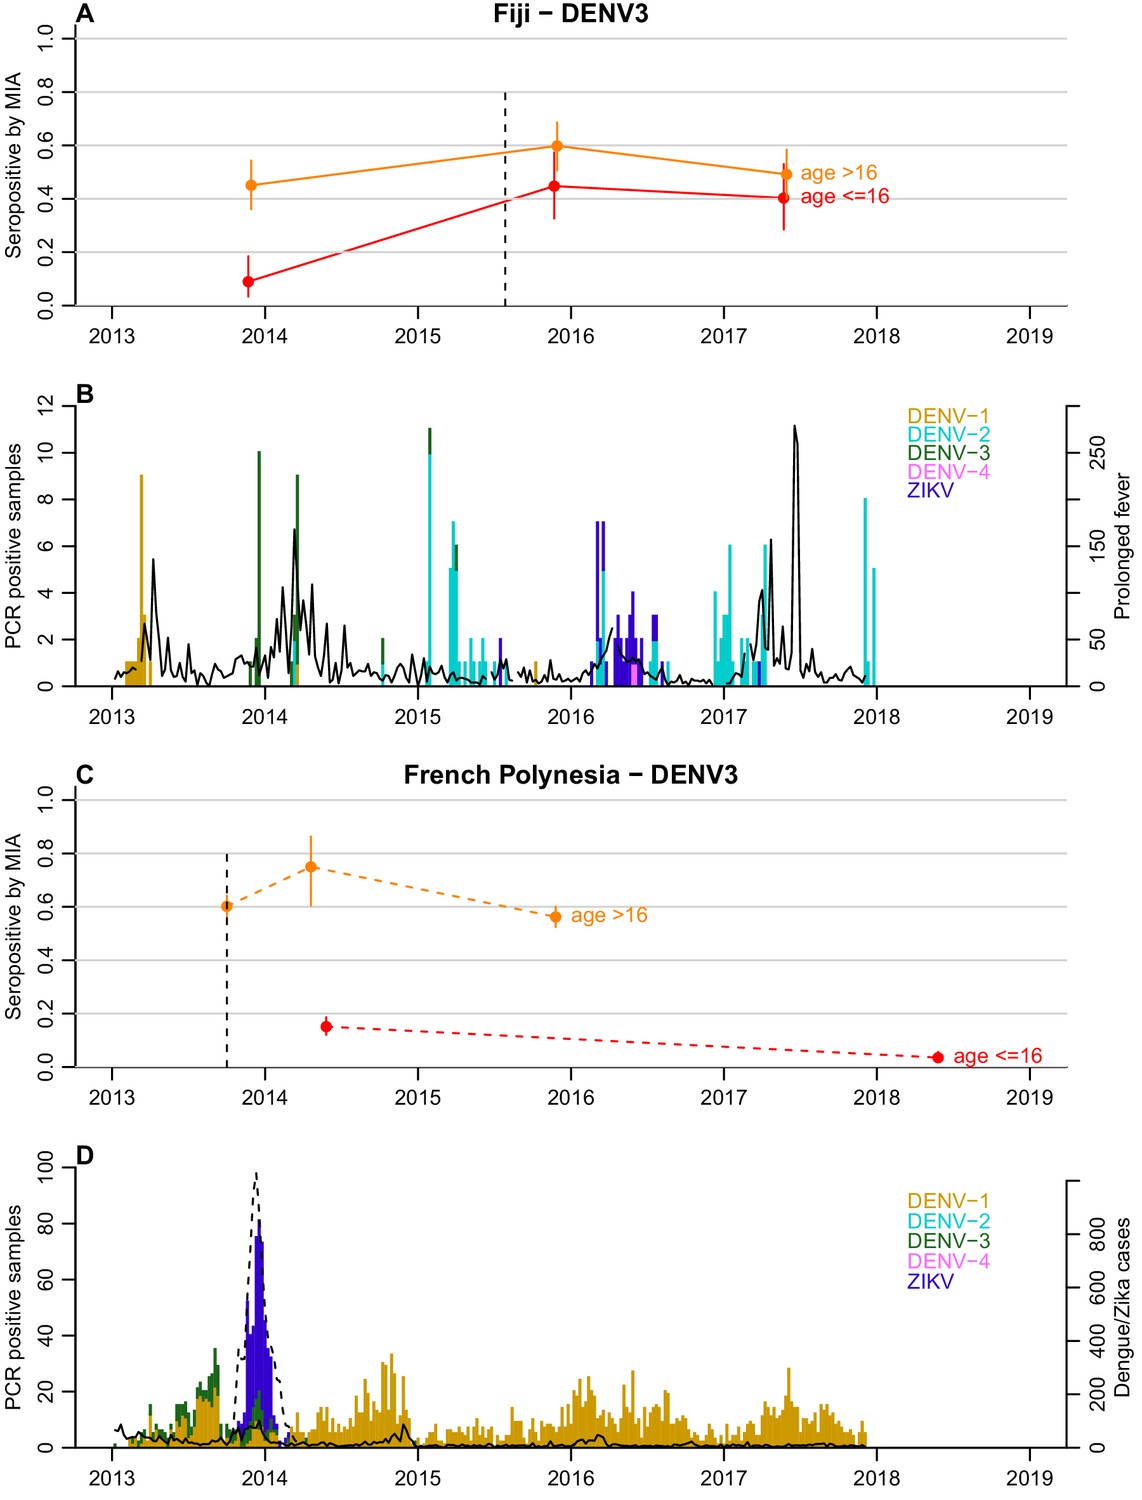
Seroprevalence against DENV-3 in Fiji and French Polynesia, by age group.
Figure colour scheme and data characteristics are same as in Figure 1.
Figure 1—figure supplement 4

Seroprevalence against DENV-4 in Fiji and French Polynesia, by age group.
Figure colour scheme and data characteristics are same as in Figure 1.
Figure 2 with 2 supplements
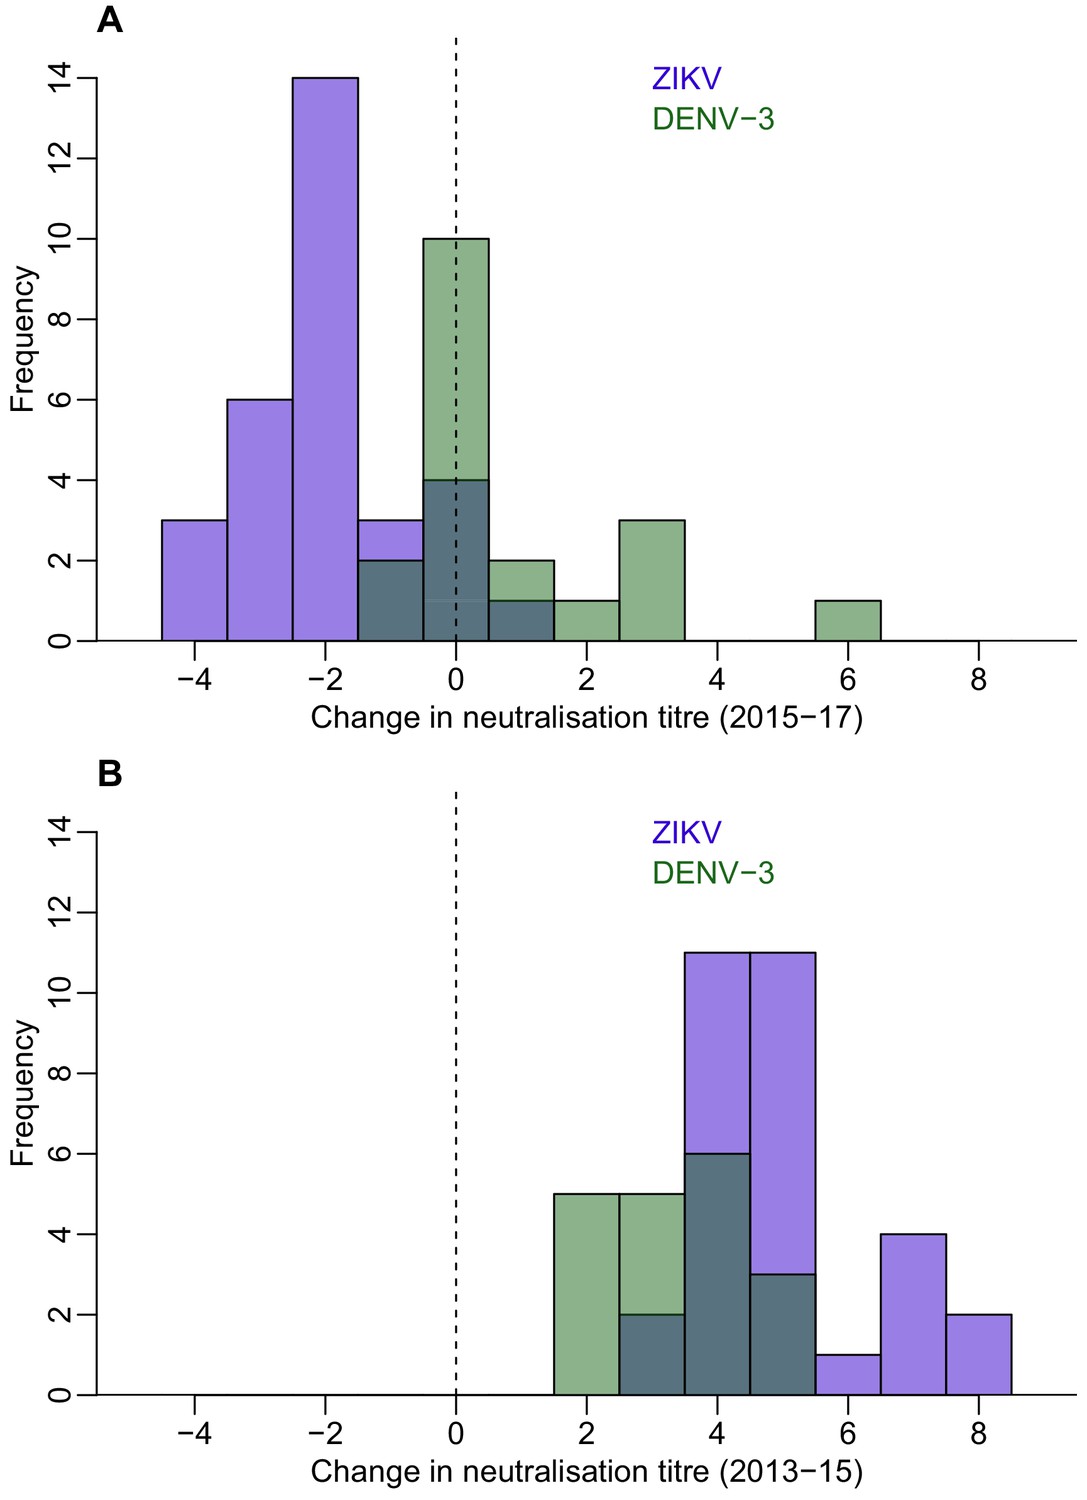
Waning of neutralizing antibody responses against ZIKV and DENV-3 in Fiji for participants who were seronegative to each virus in 2013 and seroconverted in 2015.
(A) Histogram of change in neutralization assay log titre against DENV-3 (n = 19) and ZIKV (n = 31) between 2015–2017 for individuals who seroconverted to these respective viruses between 2013–2015 (i.e. log titre < 2 in 2013 and log titre ≥ 2 in 2015). (B) Histogram of change in log titre against DENV-3 and ZIKV for individuals who seroconverted to these respective viruses during 2013–2015.
Figure 2—figure supplement 1
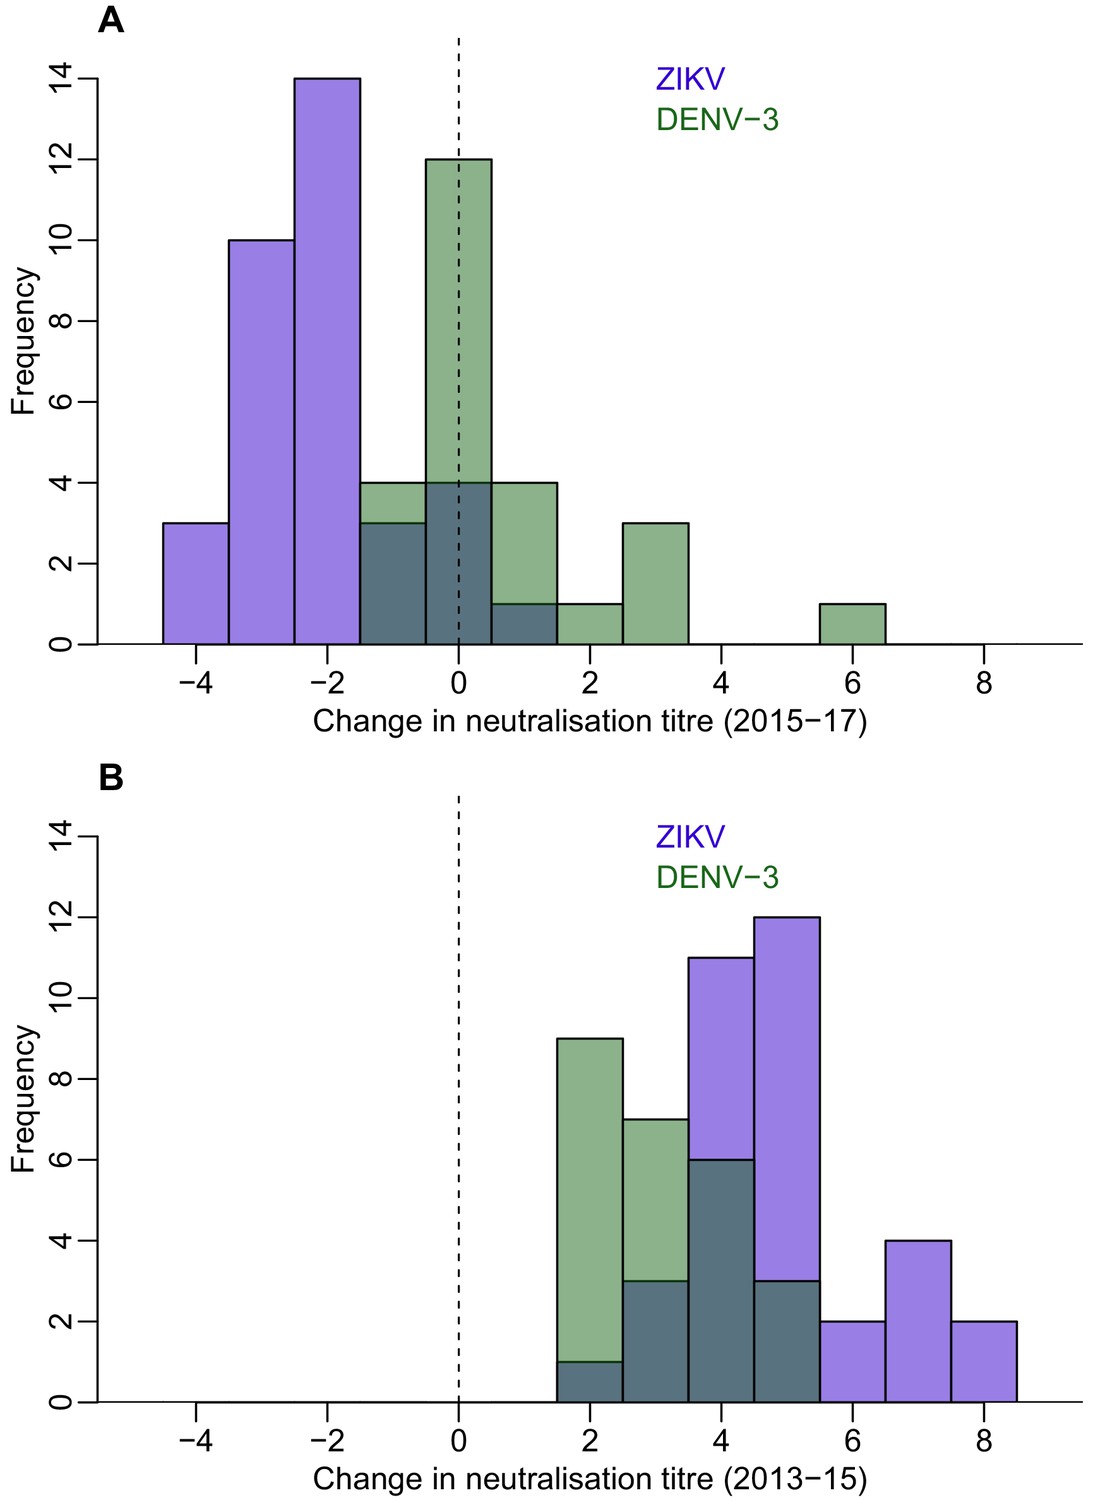
Waning of neutralizing antibody responses against ZIKV and DENV-3 in Fiji for participants who had a four-fold rise between 2013 and 2015.
Histogram of change in neutralization assay log titre against DENV-3 (n = 25) and ZIKV (n = 35) between 2015–2017 for individuals who had a rise in log titre of at least two to these respective viruses between 2013–2015. (B) Histogram of change in log titre between 2013–2015 against DENV-3 and ZIKV for individuals who had a rise of at least two during this period.
Figure 2—figure supplement 2
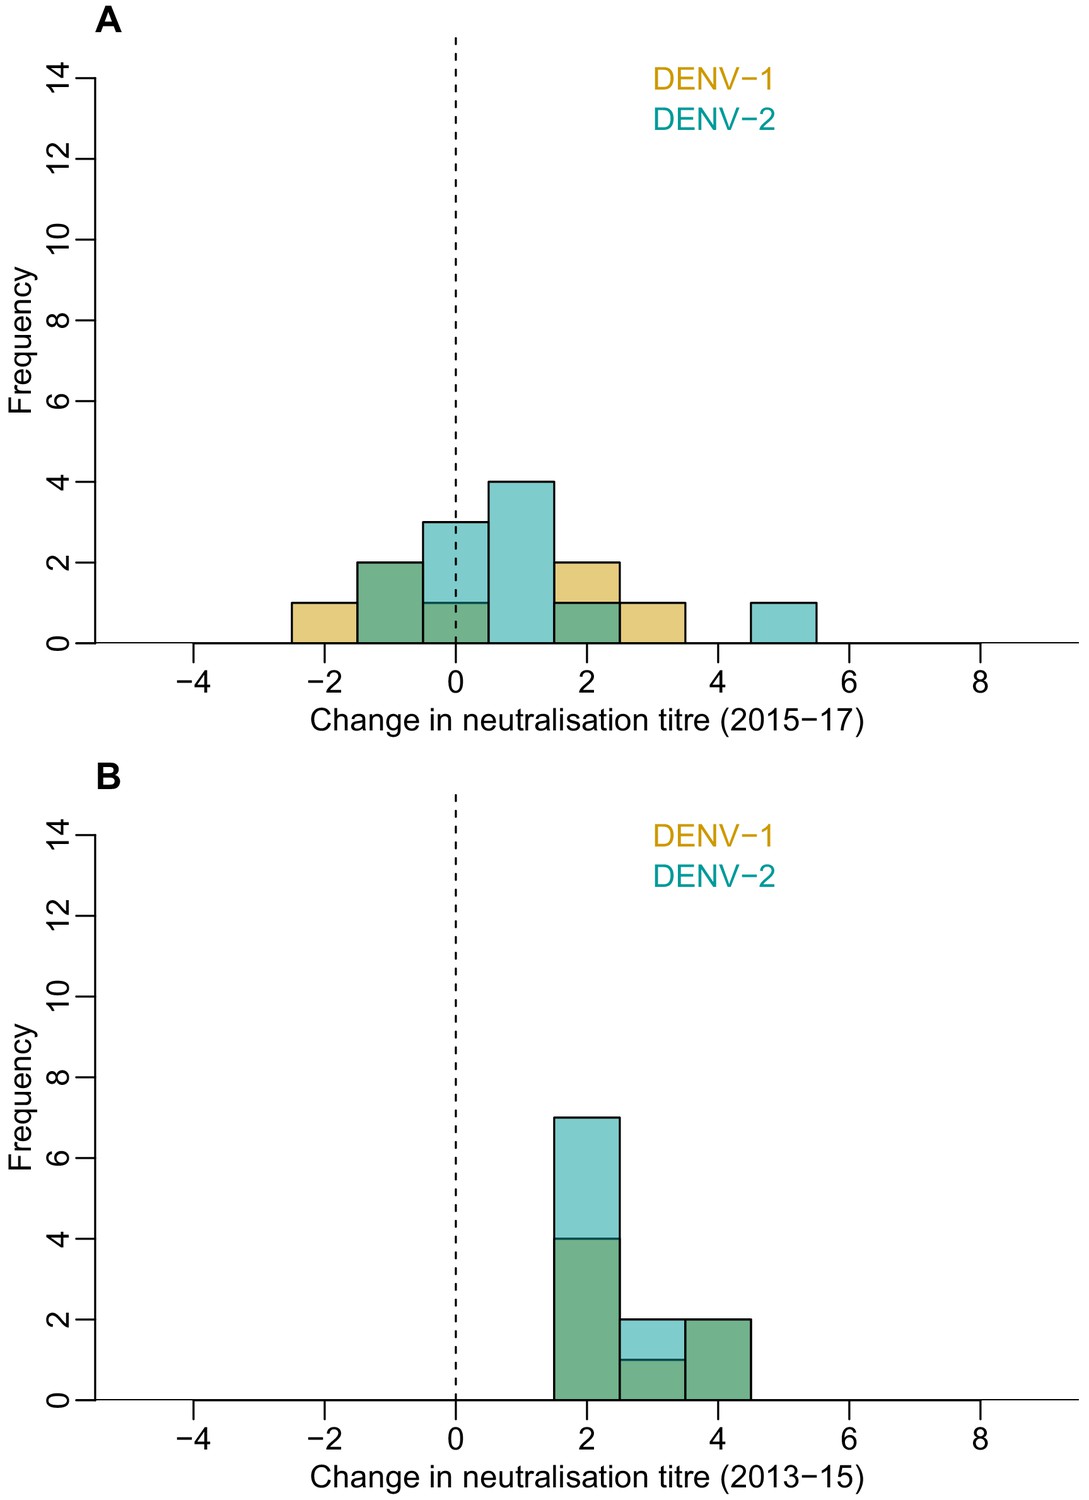
Waning of neutralizing antibody responses against DENV-1 and DENV-2 in Fiji for participants who were seronegative in 2013 and seroconverted in 2015.
Histogram of change in neutralization assay log titre against DENV-1 (n = 26) and ZIKV (n = 18) between 2015–2017 for individuals who seroconverted between 2013–2015 (i.e. log titre <2 in 2013 and log titre ≥2 in 2015). (B) Histogram of change in log titre against DENV-1 and DENV-2 for individuals who seroconverted to these respective viruses during 2013–2015.
Figure 3
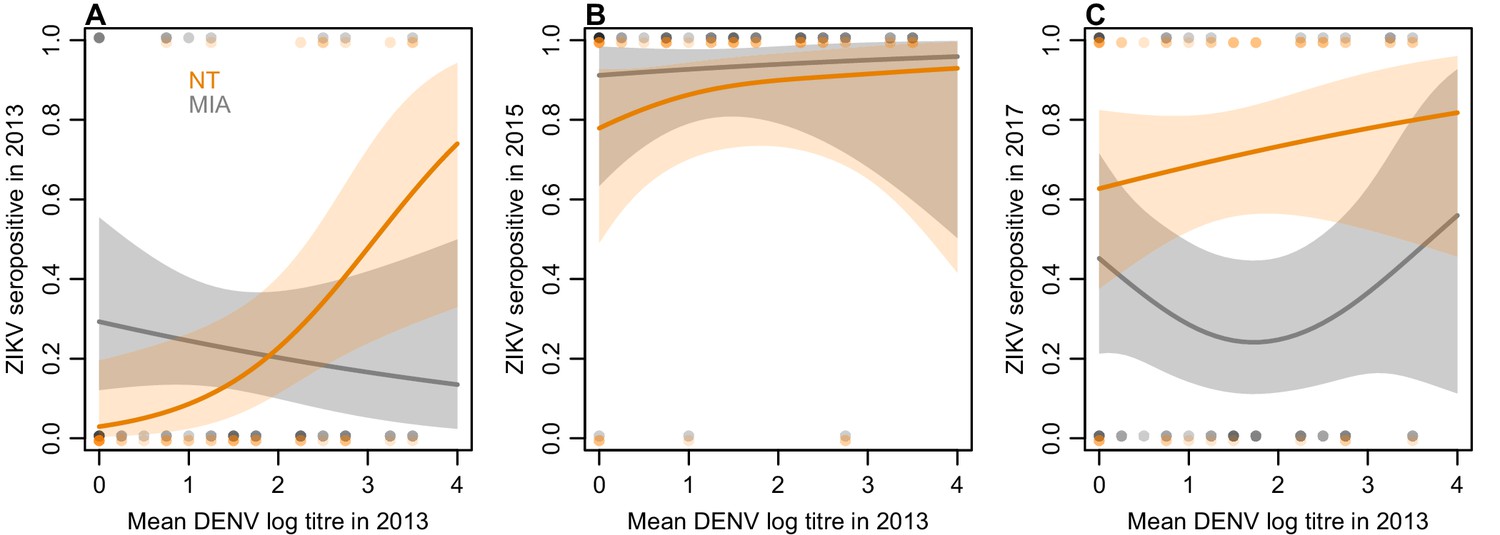
Relationship between mean DENV log neutralization titre across the four serotypes in 2013 and ZIKV seroprevalence using different assays, in a subset of 45 participants.
(A) Seroprevalence by MIA, shown in grey, and neutralization test (NT), shown in orange, for sera collected in 2013. Line shows prediction from GAM fitted to each dataset, with shaded region showing 95% CI, and points show raw data. (B) Seroprevalence for sera collected from the same participants in 2015. (C) Seroprevalence for sera collected from the same participants in 2017.
Figure 4 with 3 supplements
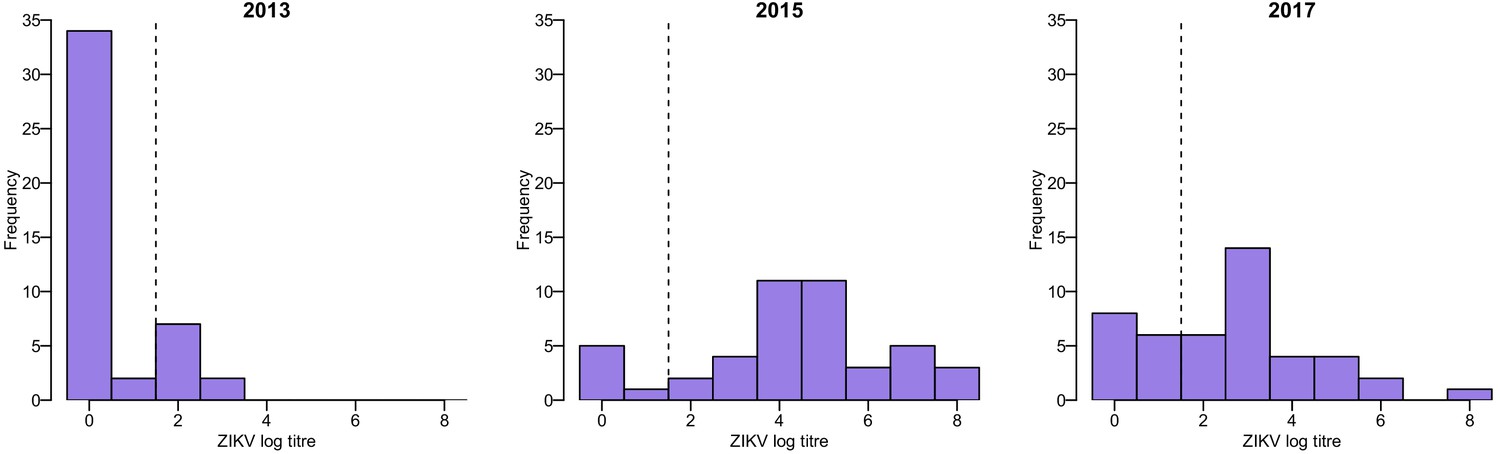
Distribution of ZIKV neutralization titres in the Fiji serosurveys.
Results shown for 45 participants who had samples available from 2013, 2015, and 2017. Dashed line shows the threshold used to define seropositivity.
Figure 4—figure supplement 1
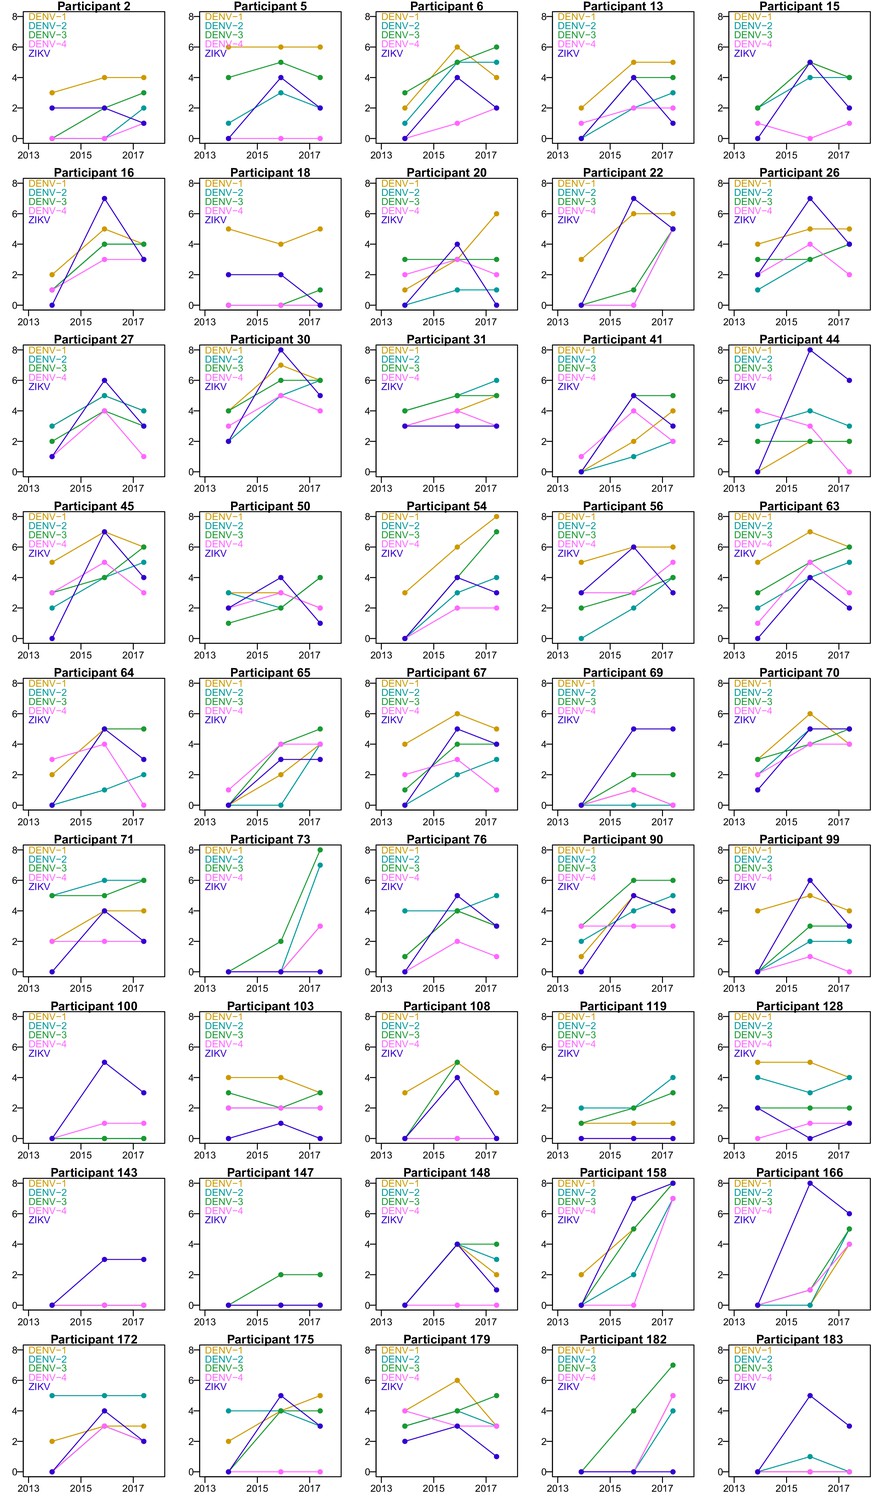
Individual-level neutralization log titres against the four DENV serotypes and ZIKV in Fiji.
Points show assay results in the 2013, 2015 and 2017 sample collections for each participant, coloured by virus (n = 45).
Figure 4—figure supplement 2
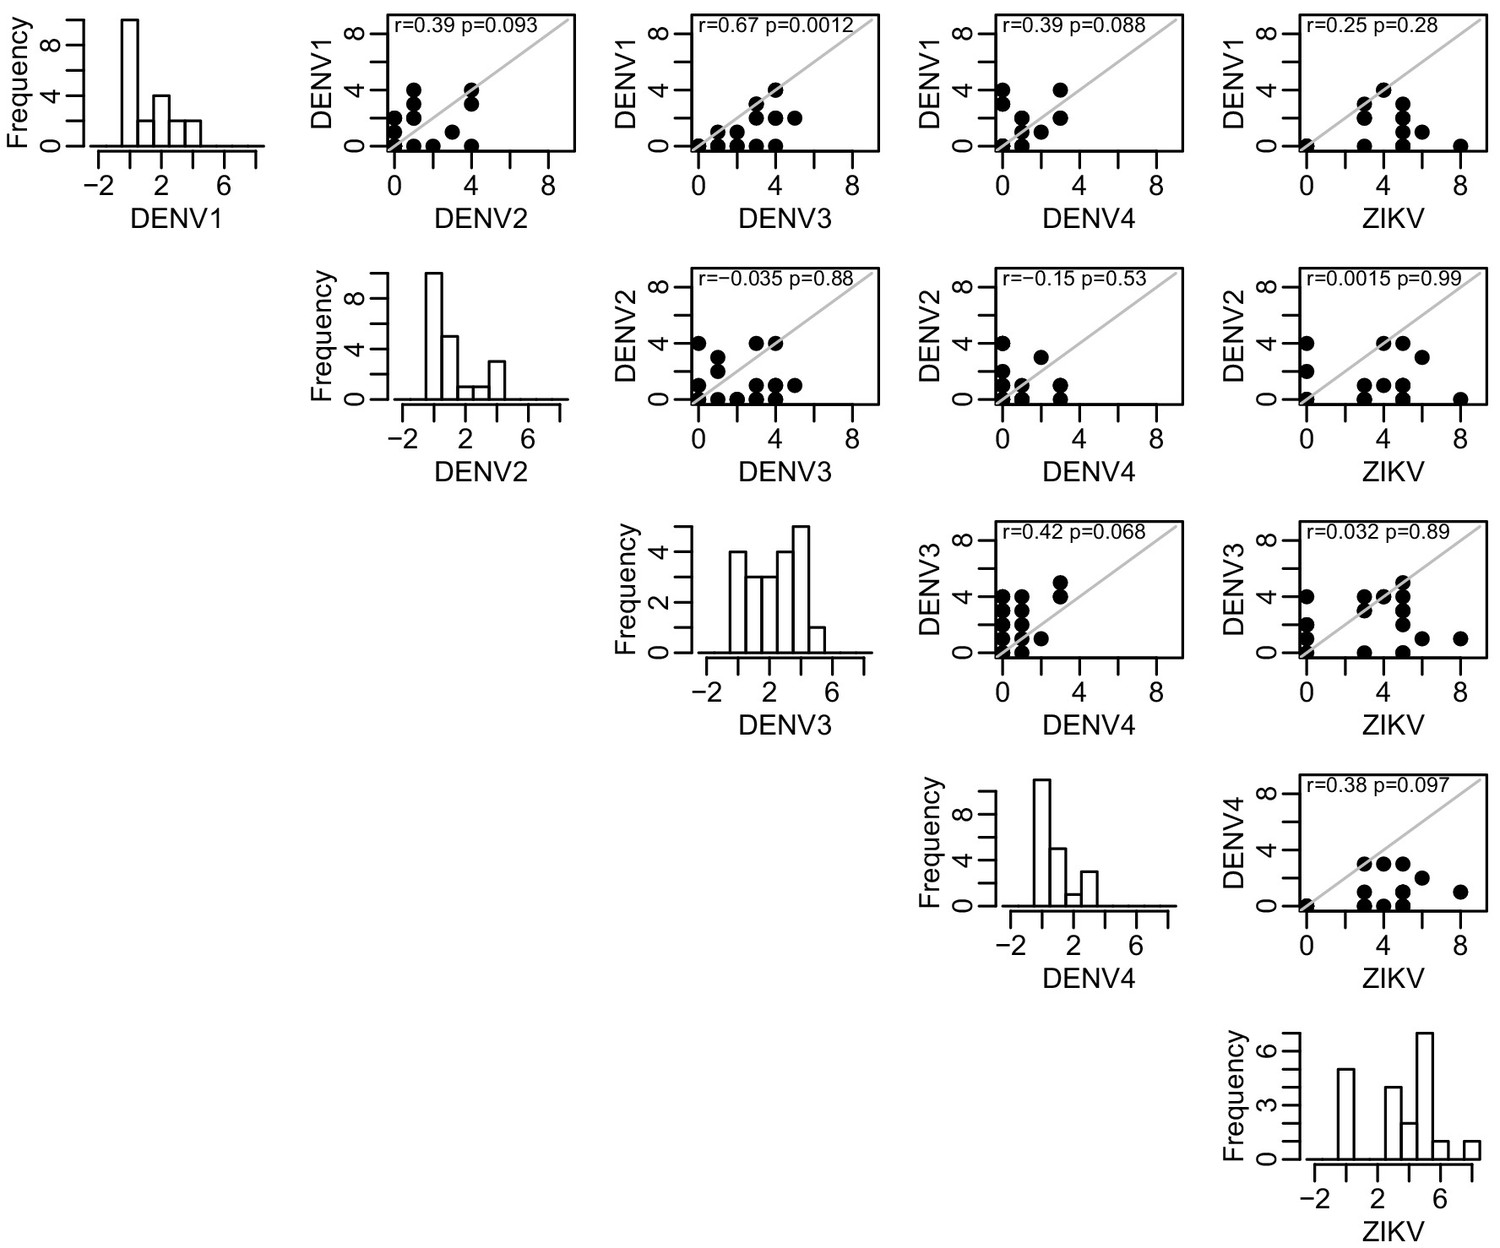
Correlation between rise in DENV and ZIKV neutralization log titres between 2013–2015 for participants who were initially seronegative (i.e. log titre <2) to all five viruses in 2013 (n = 20).
There is significant correlation between DENV-1 and DENV-3 viruses (top row, p=0.0012), suggesting likely cross-reactive responses. However, changes in ZIKV titres were not associated with responses to any of DENV viruses (far right column), which strongly indicates that the ZIKV results were genuine infections..
Figure 4—figure supplement 3
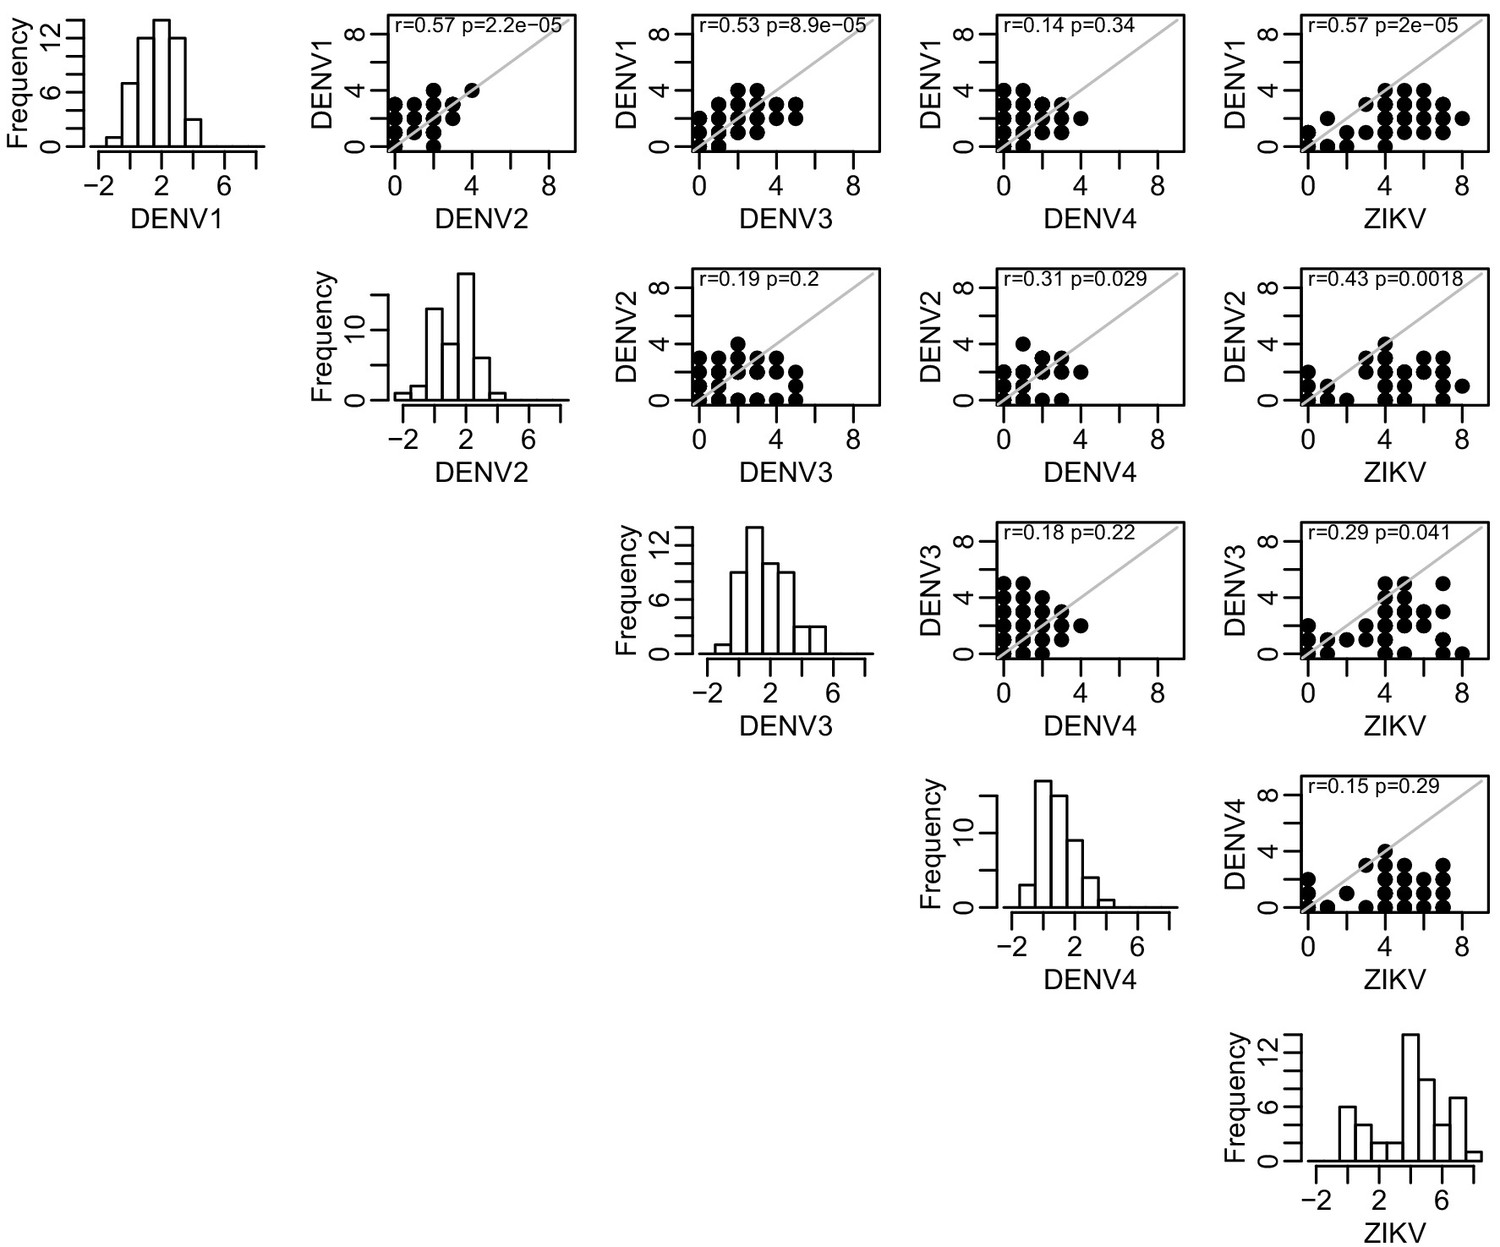
Correlation between change in DENV and ZIKV log titres between 2013–2015 for participants who were initially seropositive (i.e. log titre ≥2) to at least one DENV virus in 2013 (n = 49).
There is significant correlation between ZIKV and other DENV viruses, suggesting likely cross-reactive responses. However, there was limited circulation of viruses such as DENV-1 and DENV-2 during 2013–15 (Figure 1), suggesting that it was infection with ZIKV that generated a cross-reactive response against these viruses, rather than the other way around.
Tables
Table 1
Seroprevalence of ZIKV among participants in five serological surveys in French Polynesia and three serological surveys in Fiji, conducted between July 2011 and June 2018.
| Date | Country | Population and assay used | Age range (median) | Total no. seropositive/total no. tested | Seroprevalence % [95% CI] |
|---|---|---|---|---|---|
| French Polynesia - General Population | |||||
| Jul 2011-Oct 2013 | Society Islands, French Polynesia | Blood donors, ELISA | 18–75 (36) | 5/593 | 0.8 [0.3–2.0] |
| Nov 2013 | First confirmed local transmission of ZIKV in French Polynesia | ||||
| Feb-Mar 2014 | Society Islands, French Polynesia | General, ELISA | 13–77 (47) | 18/49 | 37 [26-47]* |
| Sep-Nov 2015 | Society Islands, French Polynesia | General, MIA | 4–88 (43) | 154/700 | 22 [16-28]* |
| French Polynesia - schoolchildren | |||||
| May-Jun 2014 | Society Islands, French Polynesia | School children, ELISA | 6–16 (11) | 312/476 | 66 [60-71]* |
| Jun-2018 | Society Islands, French Polynesia | School children, MIA | 6–16 (11) | 291/457 | 64 [58-69]* |
| Fiji | |||||
| Oct-Nov 2013 | Central Division, Fiji | General, MIA | 2–78 (24) | 12/189 | 6.3 [3.3–11] |
| Jul 2015 | First confirmed local transmission of ZIKV in Fiji | ||||
| Nov-2015 | Central Division, Fiji | General, MIA | 4–80 (26) | 45/189 | 24 [18-31] |
| Jun-2017 | Central Division, Fiji | General, MIA | 6–82 (28) | 23/189 | 12 [7.9–18] |
-
* CIs were calculated taking into account the cluster sampling design (Aubry et al., 2017) and using the Fisher exact test.
MIA – microsphere immunoassay.
Table 2
Age-adjusted seroprevalence by MIA in participants aged over 16 in the general population of the Society Islands in French Polynesia, based on serosurveys conducted in 2014 (n = 48) and 2015 (n = 672).
| Virus | 2014 seroprevalence (95% CI) | 2014 age-adjusted seroprevalence (95% CI) | 2015 seroprevalence (95% CI) | 2015 age-adjusted (95% CI) |
|---|---|---|---|---|
| DENV1 | 85 (72–94) | 83 (55–100) | 80 (77–83) | 80 (71–91) |
| DENV2 | 48 (33–62) | 50 (28–87) | 19 (16–22) | 21 (15–21) |
| DENV3 | 75 (60–86) | 72 (47–100) | 56 (52–60) | 55 (48–64) |
| DENV4 | 63 (47–76) | 65 (40–100) | 42 (38–46) | 45 (38–54) |
| ZIKV | 35 (22–50) | 32 (16–62) | 21 (18–25) | 26 (20–34) |
-
*chi-squared test comparing 2014 bootstrap estimates with 2015 results.
Table 3
Detection of IgG by MIA against ZIKV in the paired samples from participants aged under and over 16 years recruited during October-November 2015 and June 2017 in the Central division in Fiji (n = 189).
Age groups are defined using age of participants when recruited to the study in 2013.
| 2015 | 2017 | |||||
|---|---|---|---|---|---|---|
| ≤16 years | >16 years | Total participants | ||||
| ZIKV+ | ZIKV- | ZIKV+ | ZIKV- | ZIKV+ | ZIKV- | |
| ≤16 years | ||||||
| ZIKV+ | 10 | 5 | ‒ | ‒ | ‒ | ‒ |
| ZIKV- | 4 | 48 | ‒ | ‒ | ‒ | ‒ |
| >16 years | ||||||
| ZIKV+ | ‒ | ‒ | 7 | 23 | ‒ | ‒ |
| ZIKV- | ‒ | ‒ | 2 | 90 | ‒ | ‒ |
| Total Participants | ||||||
| ZIKV+ | ‒ | ‒ | ‒ | ‒ | 17 | 28 |
| ZIKV- | ‒ | ‒ | ‒ | ‒ | 6 | 138 |
Table 4
Age distribution and profile of DENV exposure history in two cross-sectional surveys conducted in the general population from the Society Islands, French Polynesia, in 2014 and 2015.
While the age distribution is similar in both studies, the sample in 2014 has a higher proportion of individuals who have tested positive for infection from all four DENV serotypes by MIA.
| Variable | 2014 (n = 49) | 2015 (n = 700) |
|---|---|---|
| Age distribution (median [IQR]) | 47 [29-56] | 43 [29-57] |
| Number of DENV serotypes positive at time of sample collection (n [%]) | ||
| 0 | 3 [0.061] | 118 [0.17] |
| 1 | 6 [0.12] | 163 [0.23] |
| 2 | 11 [0.22] | 159 [0.23] |
| 3 | 11 [0.22] | 154 [0.22] |
| 4 | 18 [0.37] | 106 [0.15] |
Table 5
Bootstrap estimated seroprevalence for each of the four DENV serotypes and ZIKV adjusted for sampling bias in two cross-sectional surveys conducted in the general population from the Society Islands, French Polynesia, in 2014 and 2015.
Results from the cross-sectional surveys in the Society Islands, French Polynesia, in 2014 and 2015 show a decline in seroprevalence by MIA against all 4 DENV serotypes and ZIKV. However, the 2014 sample included more individuals that tested positive for >1 DENV serotype and are assumed to be a higher risk group. We used a bootstrap method with 10,000 iterations which estimated seroprevalence from a sample of the 2014 dataset, taken with replacement, weighted by the exposure distribution to other DENV viruses in the 2015 survey. After adjusting for the sample bias, there was no evidence of a decline in seroprevalence for DENV-1, DENV-3, or DENV-4, which had circulated in the years preceding the 2014 sample collection (World Health Organisation, 2019), but there remained strong evidence that ZIKV seroprevalence declined between 2014–15.
| Virus | 2014 seroprevalence (95% CI) (n = 49) | 2014 bootstrap estimates of seroprevalence (95% CI) | 2015 seroprevalence (95% CI) (n = 700) | p-value* |
|---|---|---|---|---|
| DENV1 | 86 (73–94) | 74 (61–86) | 80 (77–83) | 0.36 |
| DENV2 | 47 (33–62) | 38 (24–53) | 18 (15–21) | 0.0008 |
| DENV3 | 76 (61–87) | 64 (51–78) | 55 (51–59) | 0.21 |
| DENV4 | 63 (48–77) | 50 (37–65) | 42 (38–46) | 0.42 |
| ZIKV | 37 (23–52) | 42 (29–55) | 22 (19–25) | 0.0047 |
-
*chi-squared test comparing 2014 bootstrap estimates with 2015 results.
Table 6
Change in neutralization titre between 2013–2017 in a cohort of 45 study participants in Fiji.
ZIKV and DENV-3 both circulated in Fiji between the collection of samples in 2013 and 2015, with ZIKV first reported in July 2015 and DENV-3 circulating between October 2013 and January 2015. Neutralization titre levels rose significantly over this period. Between 2015 and 2017, DENV-3 titre levels still increased with a mean change in tire of 0.89. By contrast, the mean change in ZIKV titre over this period decreased (−1.9).
| Virus | 2013–2015 change, Mean [95% CI] | p-value* | 2015–2017 change, Mean [95% CI] | p-value* |
|---|---|---|---|---|
| ZIKV (=31) | 5 [4.5, 5.5] | <0.0001 | −1.9 [-2.4,–1.5] | <0.0001 |
| DENV3 (=19) | 3.4 [2.9, 3.9] | 0.89 [0.046, 1.7] |
-
* t-test comparing change in neutralization titre for ZIKV and DENV-3 between 2013–2015, and 2015–2017.
Table 7
Age distribution of study population in French Polynesia.
Overall population distribution shown, along with total samples collected in each age group in 2014 and 2015 serosurveys.
| Age range | Population estimate (2017) | Samples in 2014 study | Samples in 2015 study |
|---|---|---|---|
| 0–9 | 42,770 | 0 | 0 |
| 10–19 | 43,705 | 3 | 22 |
| 20–29 | 48,914 | 10 | 135 |
| 30–39 | 42,144 | 5 | 131 |
| 40–49 | 40,886 | 8 | 119 |
| 50–59 | 34,478 | 15 | 128 |
| 60–69 | 21,099 | 2 | 85 |
| 70–79 | 10,481 | 5 | 46 |
| 80–89 | 3773 | 0 | 9 |
| 90+ | 416 | 0 | 0 |
Additional files
Download links
A two-part list of links to download the article, or parts of the article, in various formats.
Downloads (link to download the article as PDF)
Open citations (links to open the citations from this article in various online reference manager services)
Cite this article (links to download the citations from this article in formats compatible with various reference manager tools)
Zika seroprevalence declines and neutralizing antibodies wane in adults following outbreaks in French Polynesia and Fiji
eLife 9:e48460.
https://doi.org/10.7554/eLife.48460


