Regulated spindle orientation buffers tissue growth in the epidermis
- Duke University, United States
Figures
Figure 1 with 3 supplements
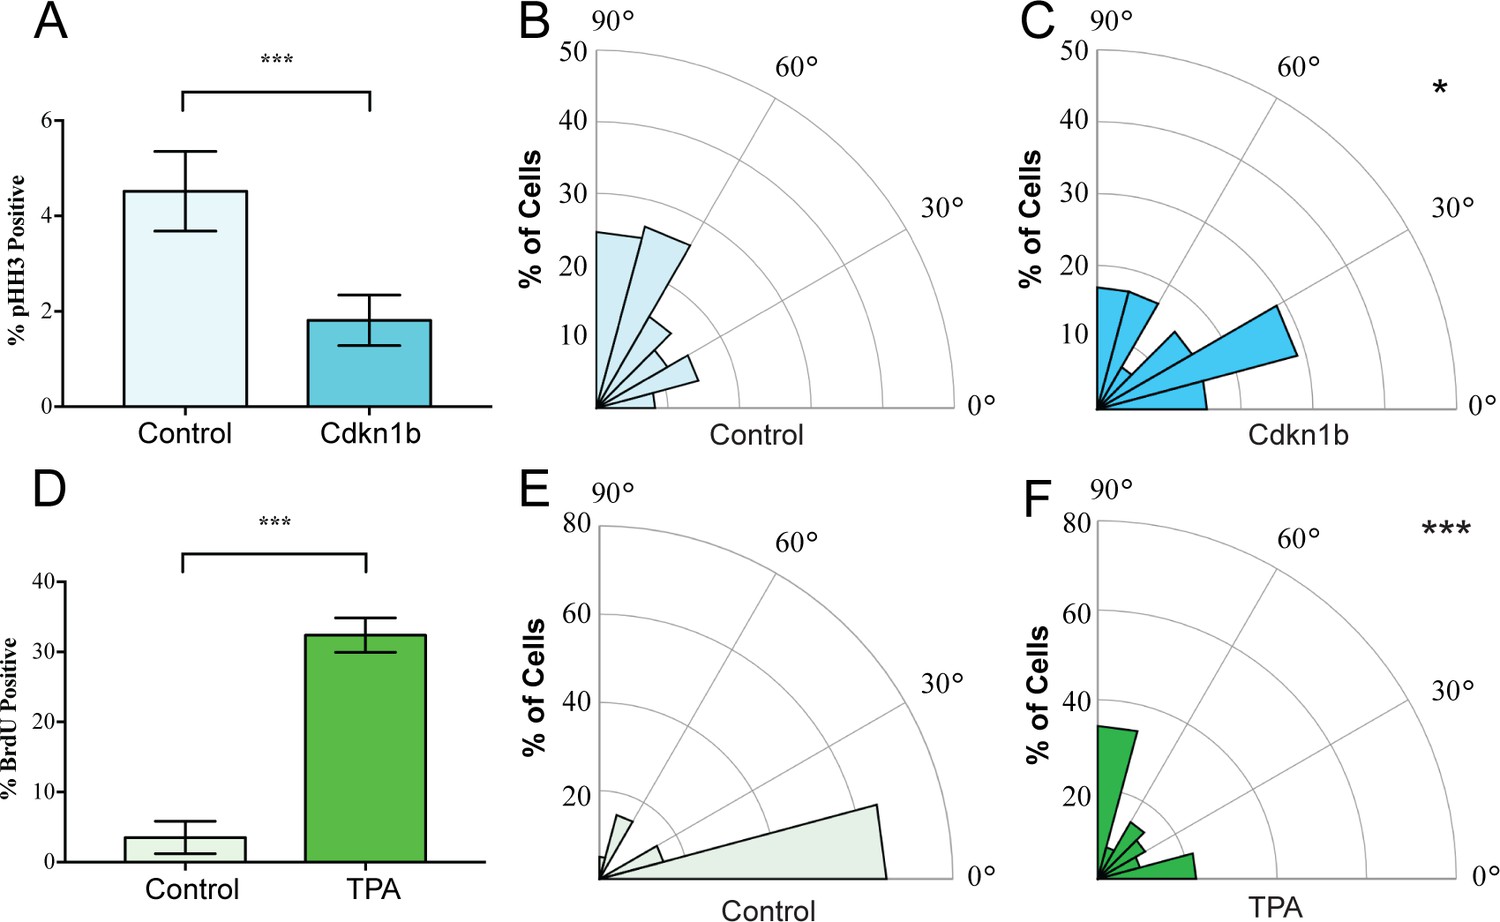
Mitotic spindles reorient in response to changes in proliferation.
(A) Proliferation of control and K14-rtTA;TRE-Cdkn1b embryonic epidermis measured by pHH3 incorporation after treatment with doxycycline from e14.5–16.5. (B–C) Radial histograms of mitotic spindle orientation for e16.5 control (n = 61) and Cdkn1b (n = 59) embryonic epidermis. (D) Proliferation of adult backskin epidermis, control or TPA-treated (10 μl of 0.4 mM TPA, applied daily for 5 days), as measured by BrdU incorporation. n > 150 for each of three mice. (E–F) Radial histograms of mitotic spindle orientation for control (n = 20) and TPA-treated (n = 41) epidermis. Three or more mice were examined for each condition. *p<0.05, ***p<0.001.
Figure 1—figure supplement 1
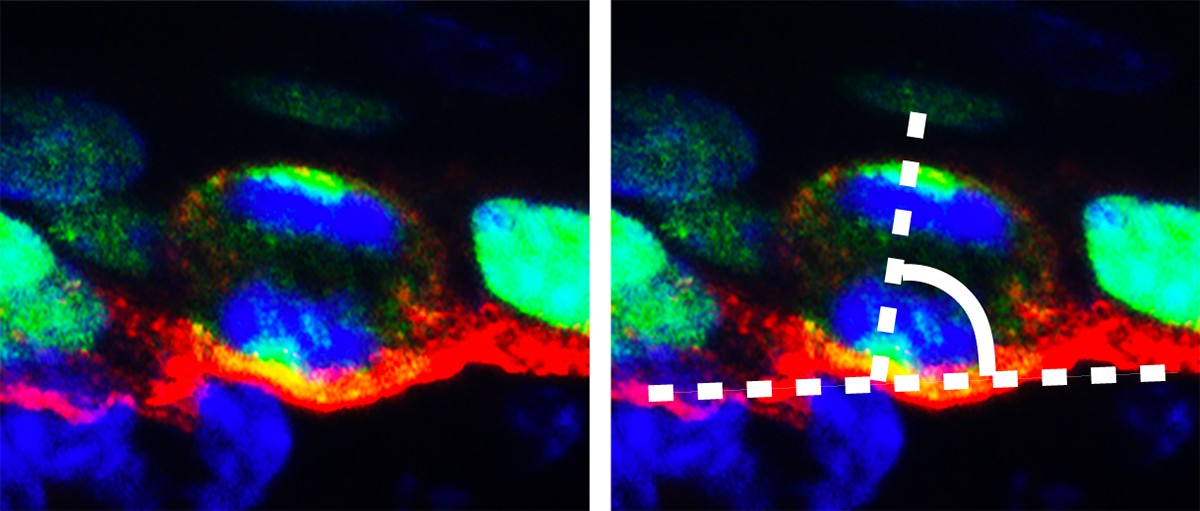
Image of a dividing basal epidermal cell demonstrating the method of spindle angle measurement.
We measure the angle formed by a line through the spindle poles and one along the basement membrane.
Figure 1—figure supplement 2
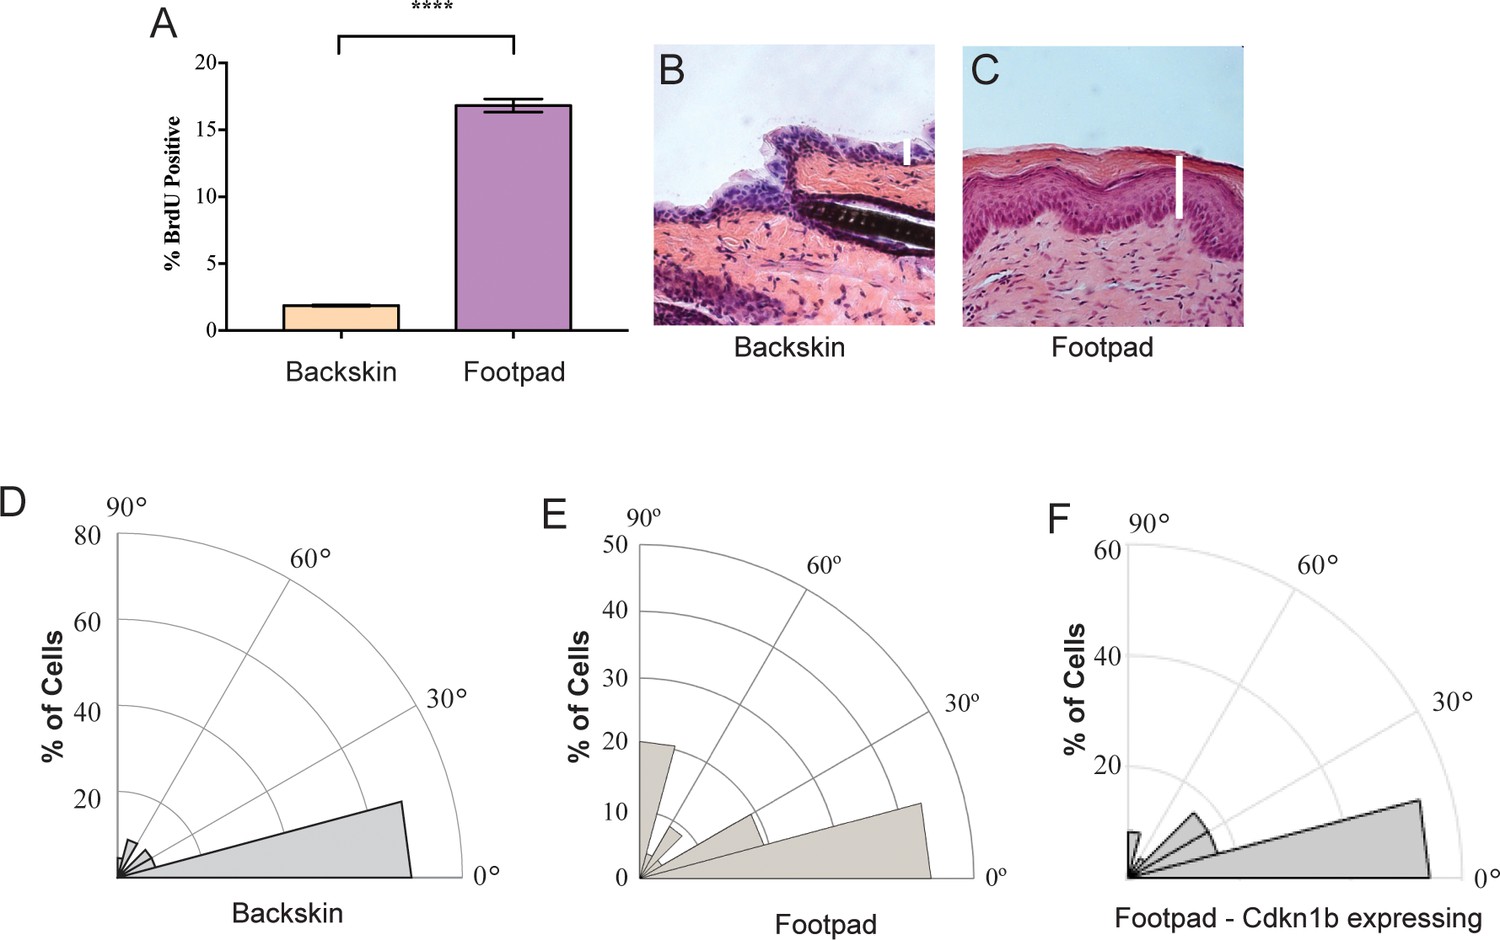
Proliferation and spindle orientation differences between back and footpad skin.
(A) Proliferation in WT backskin and footpad as measured by BrdU incorporation. n > 300 cells for each of 3 mice. p<0.001. (B,C) H and E images of WT backskin and footpad epidermis, showing their difference in thickness. (D–F) Radial histograms of mitotic spindles in WT backskin (n = 22), footpad (n = 78), and footpad from a K14-rtTA;TRE-Cdkn1b (n = 24) mouse epidermis. Note that the data in (D) is the same as the data presented in Figure 2A.
Figure 1—figure supplement 3
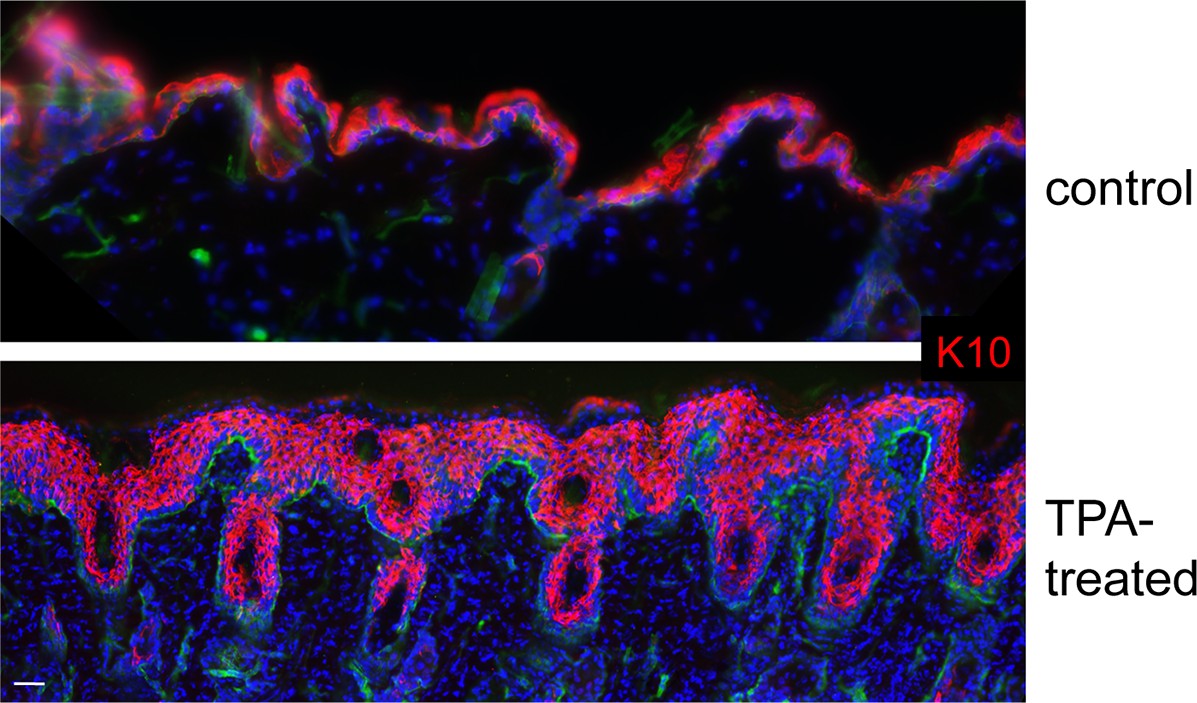
Expansion of keratin 10 (K10) positive cell layers in epidermis treated with TPA.
K10 (red), nuclei (blue), and the basement membrane is marked by β4-integrin staining in green.
Figure 2 with 1 supplement
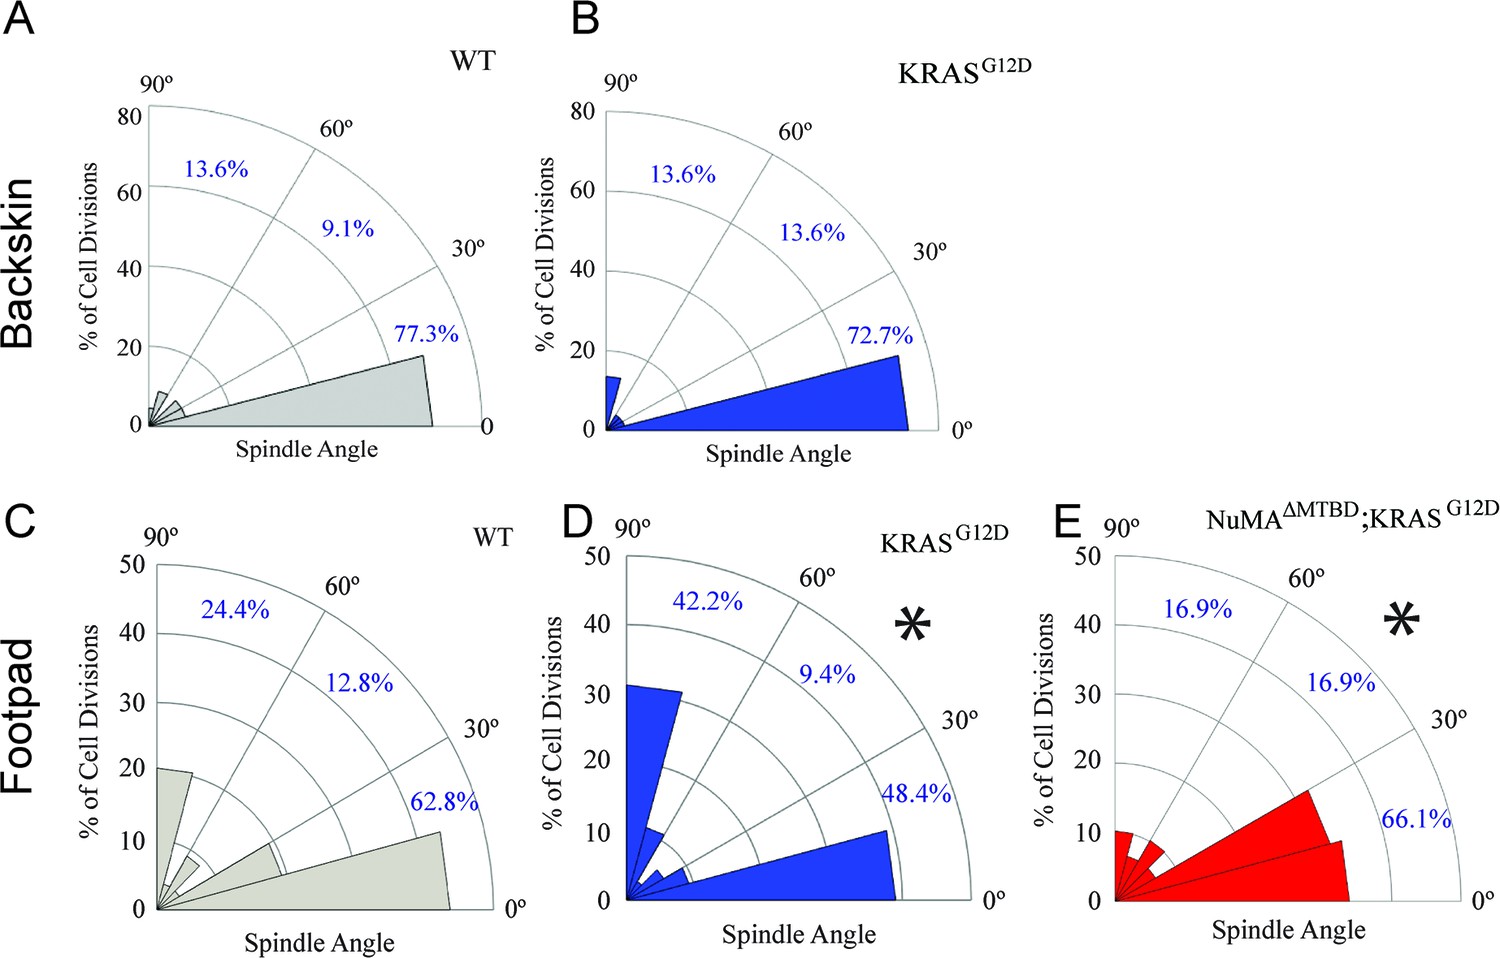
Oncogenic KRAS alters footpad epidermis spindle orientation in a NuMA-dependent manner.
(A,B) Radial histogram of mitotic spindles in adult backskin 21 days after tamoxifen-induced recombination in control (A) and K5CreER; KRASG12D mice (B). (C,D) Radial histogram of mitotic spindles in adult footpad epidermis, 21 days after tamoxifen-induced recombination in control (C) and K5CreER; KRASG12D mice, (n = 78 cells), and (D) (n = 64 cells). (E) Radial histogram of mitotic spindles in adult footpad 21 days after tamoxifen-induced recombination in K5CreER; KRASG12D;NuMAΔMTBD mice (n = 57 cells). Note that the data in 2C is the same as that presented in Figure 1—figure supplement 2E.
Figure 2—figure supplement 1
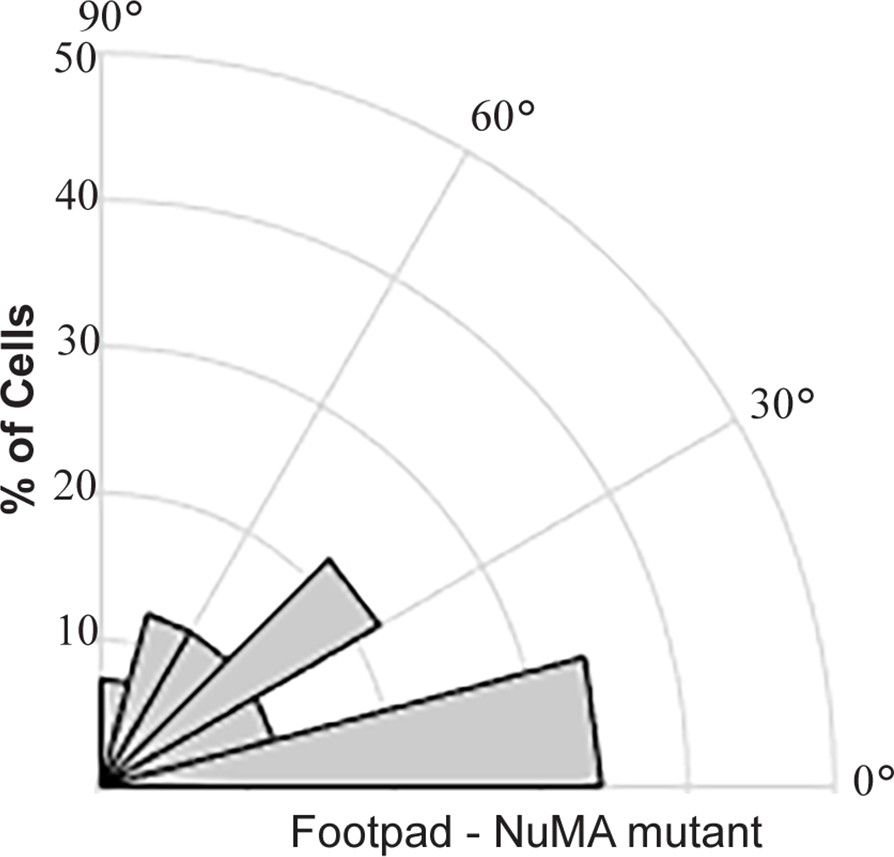
Radial histogram of cell division orientation in the footpad epidermis from NuMA mutant mice (K14-Cre;NuMAMTBD/MTBD).
n = 41 cells.
Figure 3 with 1 supplement
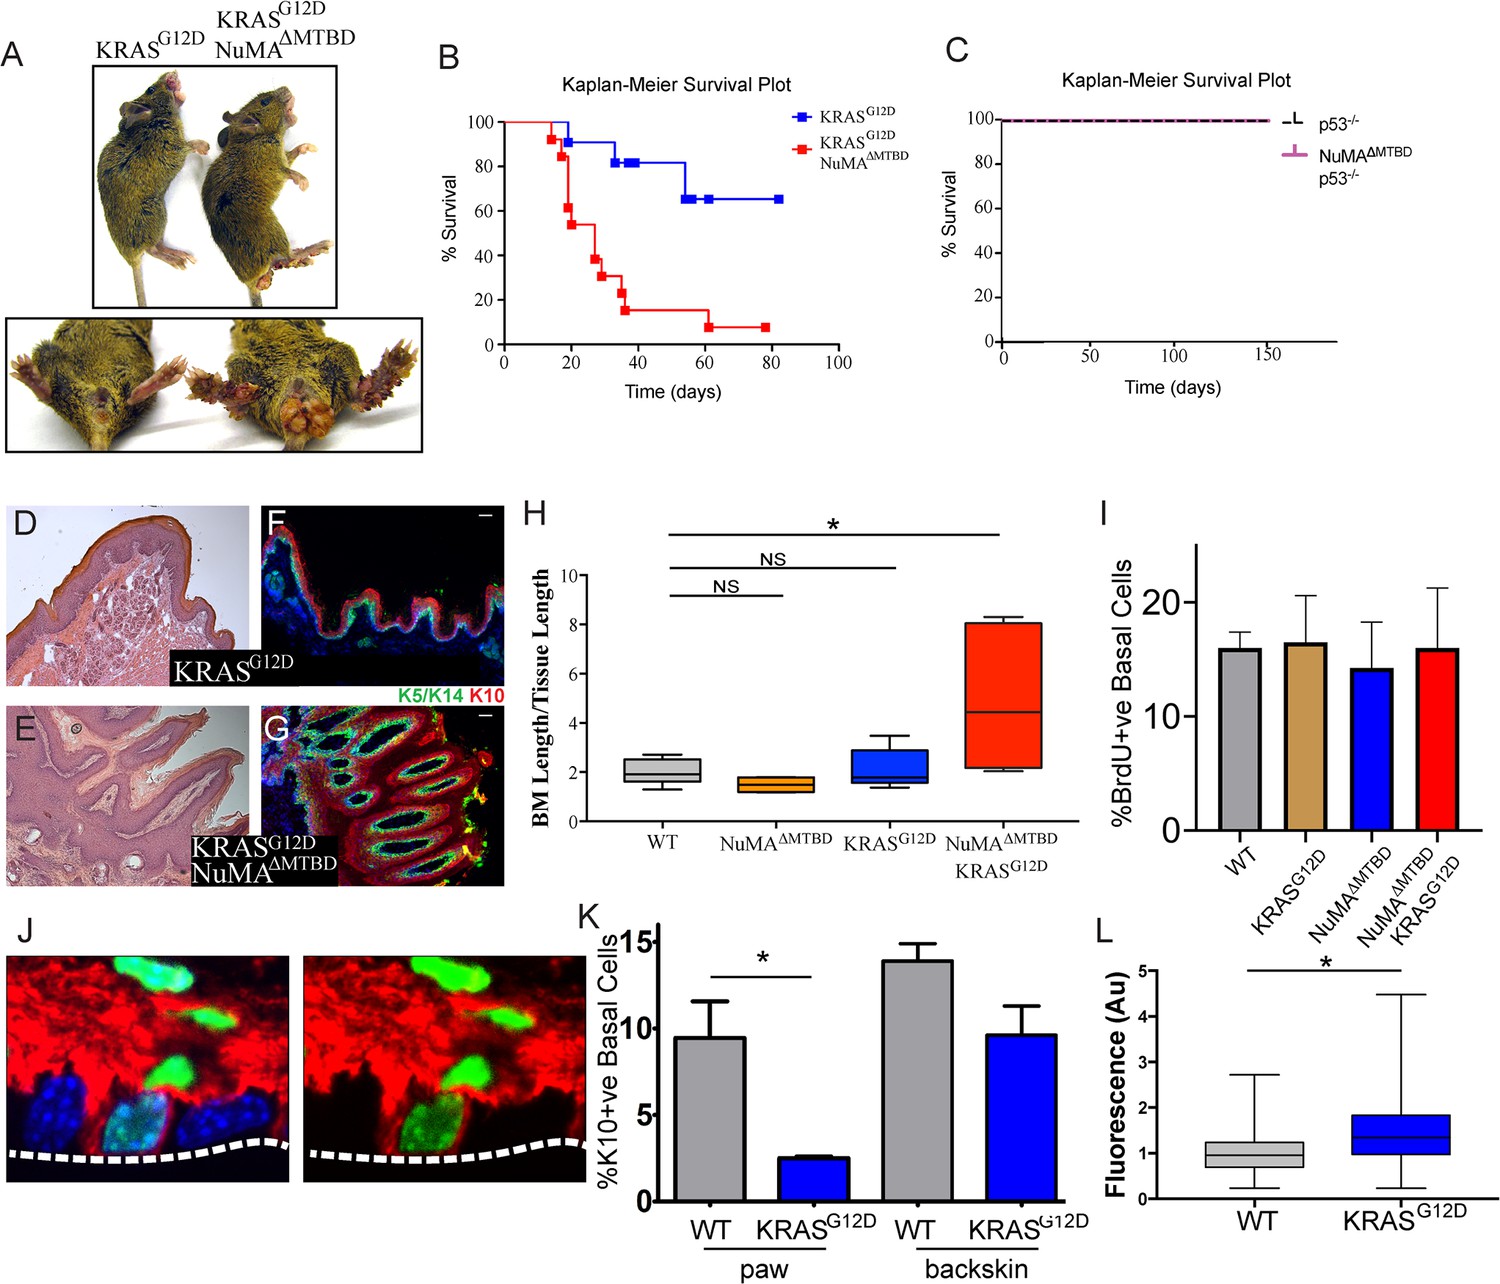
Loss of regulated spindle orientation synergizes with oncogenic KRAS to cause tissue overgrowth.
(A) Images of K5CreER; KRASG12D and K5CreER; NuMAΔMTBD; KRASG12D mice 21 days after recombination with tamoxifen, with inset of footpad and anal-genital region. (B,C)) Kaplan-Meier Survival plot of K5CreER; KRASG12D and K5CreER; NuMAΔMTBD; KRASG12D mice (B) and K5CreER; p53-/- and K5CreER; p53-/-; NuMAΔMTBD mice (C). n = 12 mice for K5CreER; NuMAΔMTBD; KRASG12D and 10 for other genotypes. (D,E) H and E images of K5CreER; KRASG12D (D) and K5CreER; NuMAΔMTBD; KRASG12D (E) footpad epidermis. (F,G) Immunofluorescence images of K5CreER; KRASG12D (F) and K5CreER; NuMAΔMTBD; KRASG12D (G) footpad epidermis showing localization of K5/K14+ basal and K10+ suprabasal epidermal layers. Scale bar = 50 μm. (H) Quantitation of basement membrane length divided by tissue length in indicated genotypes (n = 3 mice/condition). (I) Quantitation of proliferation, as assayed by BrdU incorporation, in control and KRASG12D mice. (n > 300 cells, three mice/condition). (J) Image showing co-localization of keratin 10 (red) and histone H2B (green) in a basal cell from a K10-rtTA; TRE-H2B-GFP mouse. (K) Quantitation of Keratin 10 positive basal cells in paw and backskin with indicated genotypes. n > 300 cells/mouse, three mice/condition. (L) Fluorescence intensity (normalized) of β4-integrin in control and KRASG12D expressing footpad epidermis (n = 3 mice/condition).
Figure 3—figure supplement 1
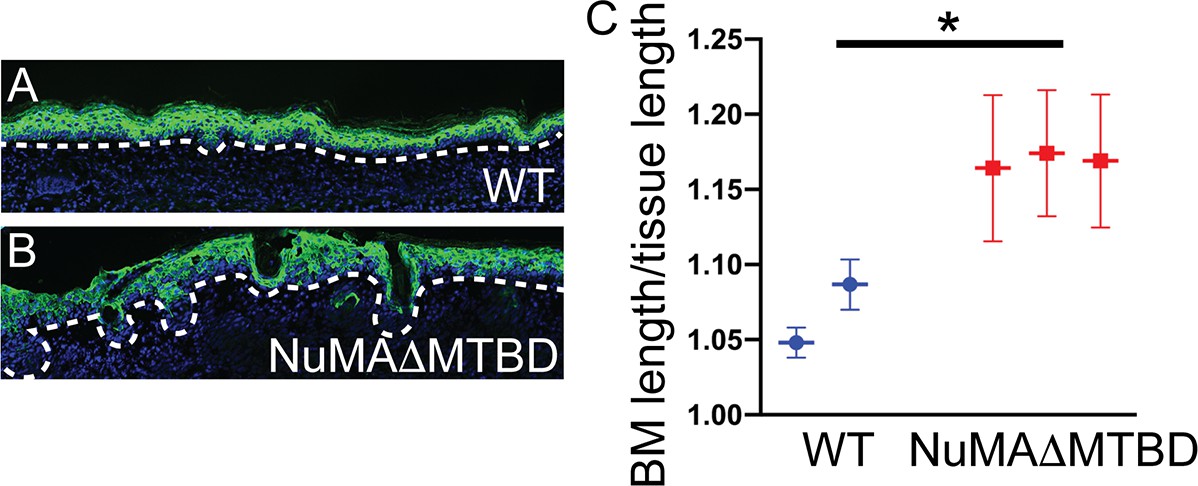
Effect of TPA treatment on control and NuMAΔMTBD ear skin.
Images show K10 (green) stained ear skin epidermis with the basement membrane noted with a dotted line. These mice were topically treated with TPA for ten days (treatment every second day). The graph indicates the basement membrane length/tissue length of the skin.
Author response image 1
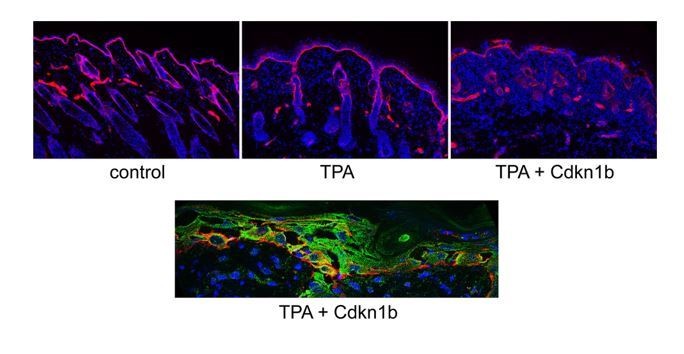
Effect of combined TPA treatment and Cdkn1b expression on the epidermis.
Top – Basement membrane (red) and nuclei (blue) staining of control, TPA-treated, and TPA-treated/Cdkn1b-expressing epidermis. Note the increased thickness of the epidermis with TPA treatment and the dramatic changes in tissue architecture when in TPA + Cdkn1b. Bottom – Image showing the epidermal integrity defects in the TPA + Cdkn1b treated skin (basement membrane is red, krt14 is green, and nuclei are blue).
Additional files
-
Transparent reporting form
- https://doi.org/10.7554/eLife.48482.010
Download links
A two-part list of links to download the article, or parts of the article, in various formats.
Downloads (link to download the article as PDF)
Open citations (links to open the citations from this article in various online reference manager services)
Cite this article (links to download the citations from this article in formats compatible with various reference manager tools)
Regulated spindle orientation buffers tissue growth in the epidermis
eLife 8:e48482.
https://doi.org/10.7554/eLife.48482


