Efficient conversion of chemical energy into mechanical work by Hsp70 chaperones
- ETH Zürich, Switzerland
- Universidad Autónoma de Madrid, Spain
- École Polytechnique Fédérale de Lausanne (EPFL), Switzerland
- Yorktown Heights, United States
- University of Zurich, Switzerland
- Ecole Polytechnique Fédérale de Lausanne (EPFL), Switzerland
- INSERM, CNRS, Université de Montpellier, France
Figures
Figure 1
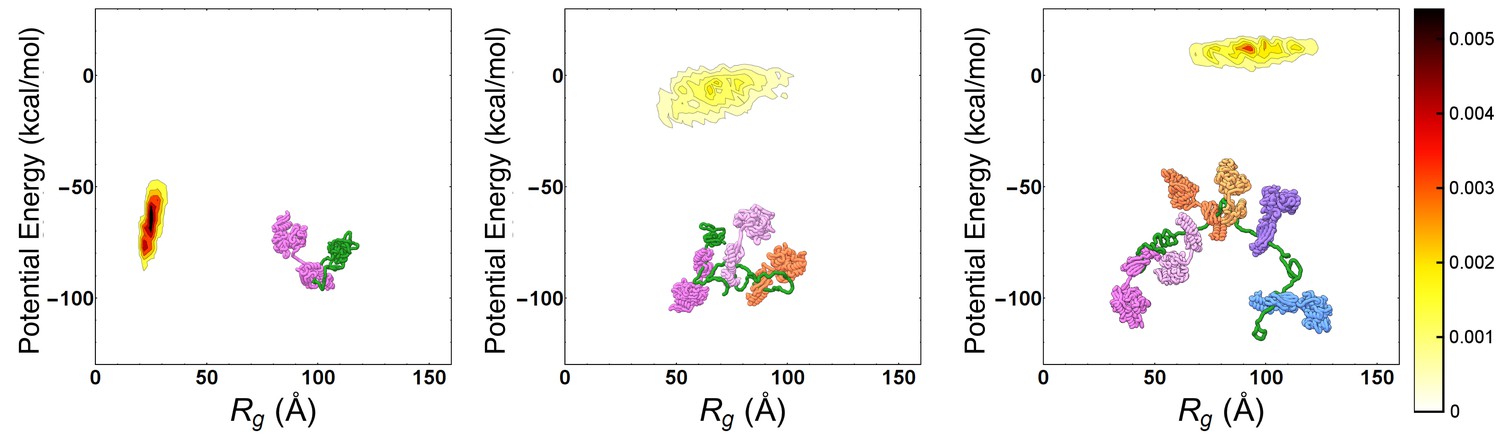
Progressive expansion of substrate by multiple Hsp70 binding.
Probability density maps of substrate potential energy and radius of gyration for representative Hsp70/rhodanese complexes with one (left), three (center) and six (right) bound chaperones. The different Hsp70 chaperones have been represented with different colors to ease their discernibility.
-
Figure 1—source data 1
Text files containing the data used to generate the probability density maps in Figure 1.
- https://cdn.elifesciences.org/articles/48491/elife-48491-fig1-data1-v2.zip
Figure 2 with 1 supplement
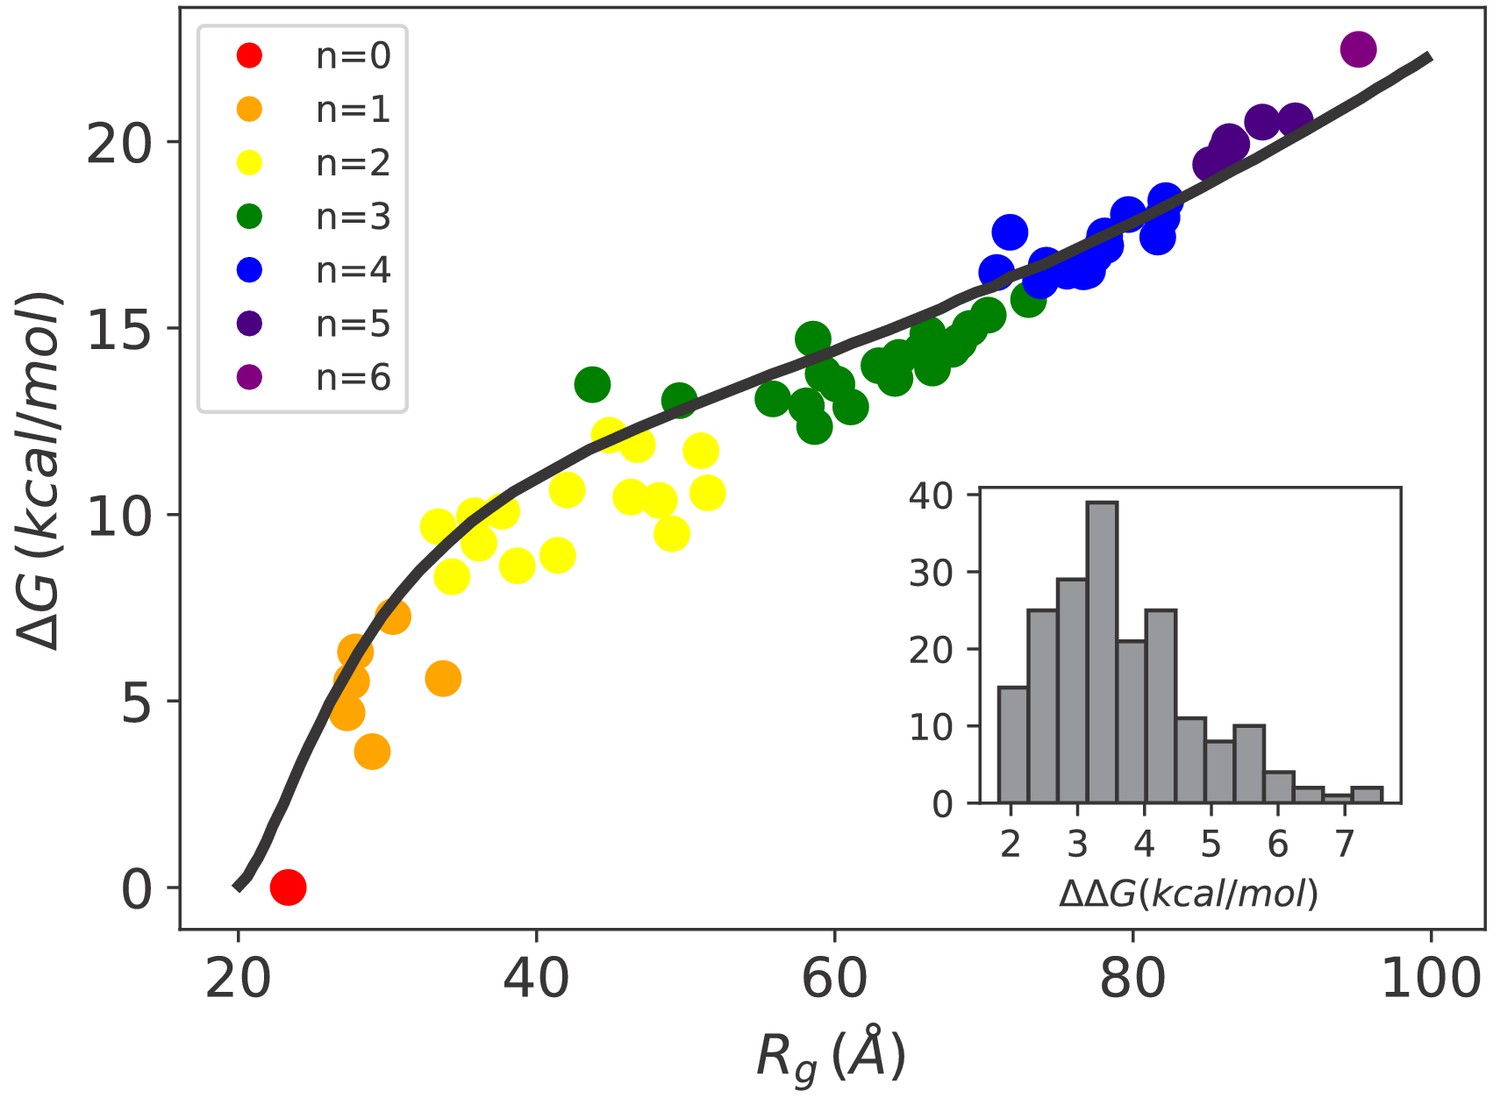
Hsp70-induced swelling increases the conformational free energy of the system.
Conformational free-energy differences of the Hsp70/rhodanese complexes with respect to the unbound substrate (n = 0) plotted as a function of the corresponding radius of gyration . Each point represents one of the 64 possible binding configurations with color code indicating the number of bound chaperones. The black curve was obtained using the model in Sanchez (1979) (see Appendix 2). (inset) Distribution of corresponding to the free-energy cost for binding an additional Hsp70 to a chaperone/substrate complex.
-
Figure 2—source data 1
Data from simulation results and Sanchez theory used to generate the plot in Figure 2 and the histogram in the inset of Figure 2.
- https://cdn.elifesciences.org/articles/48491/elife-48491-fig2-data1-v2.zip
Figure 2—figure supplement 1
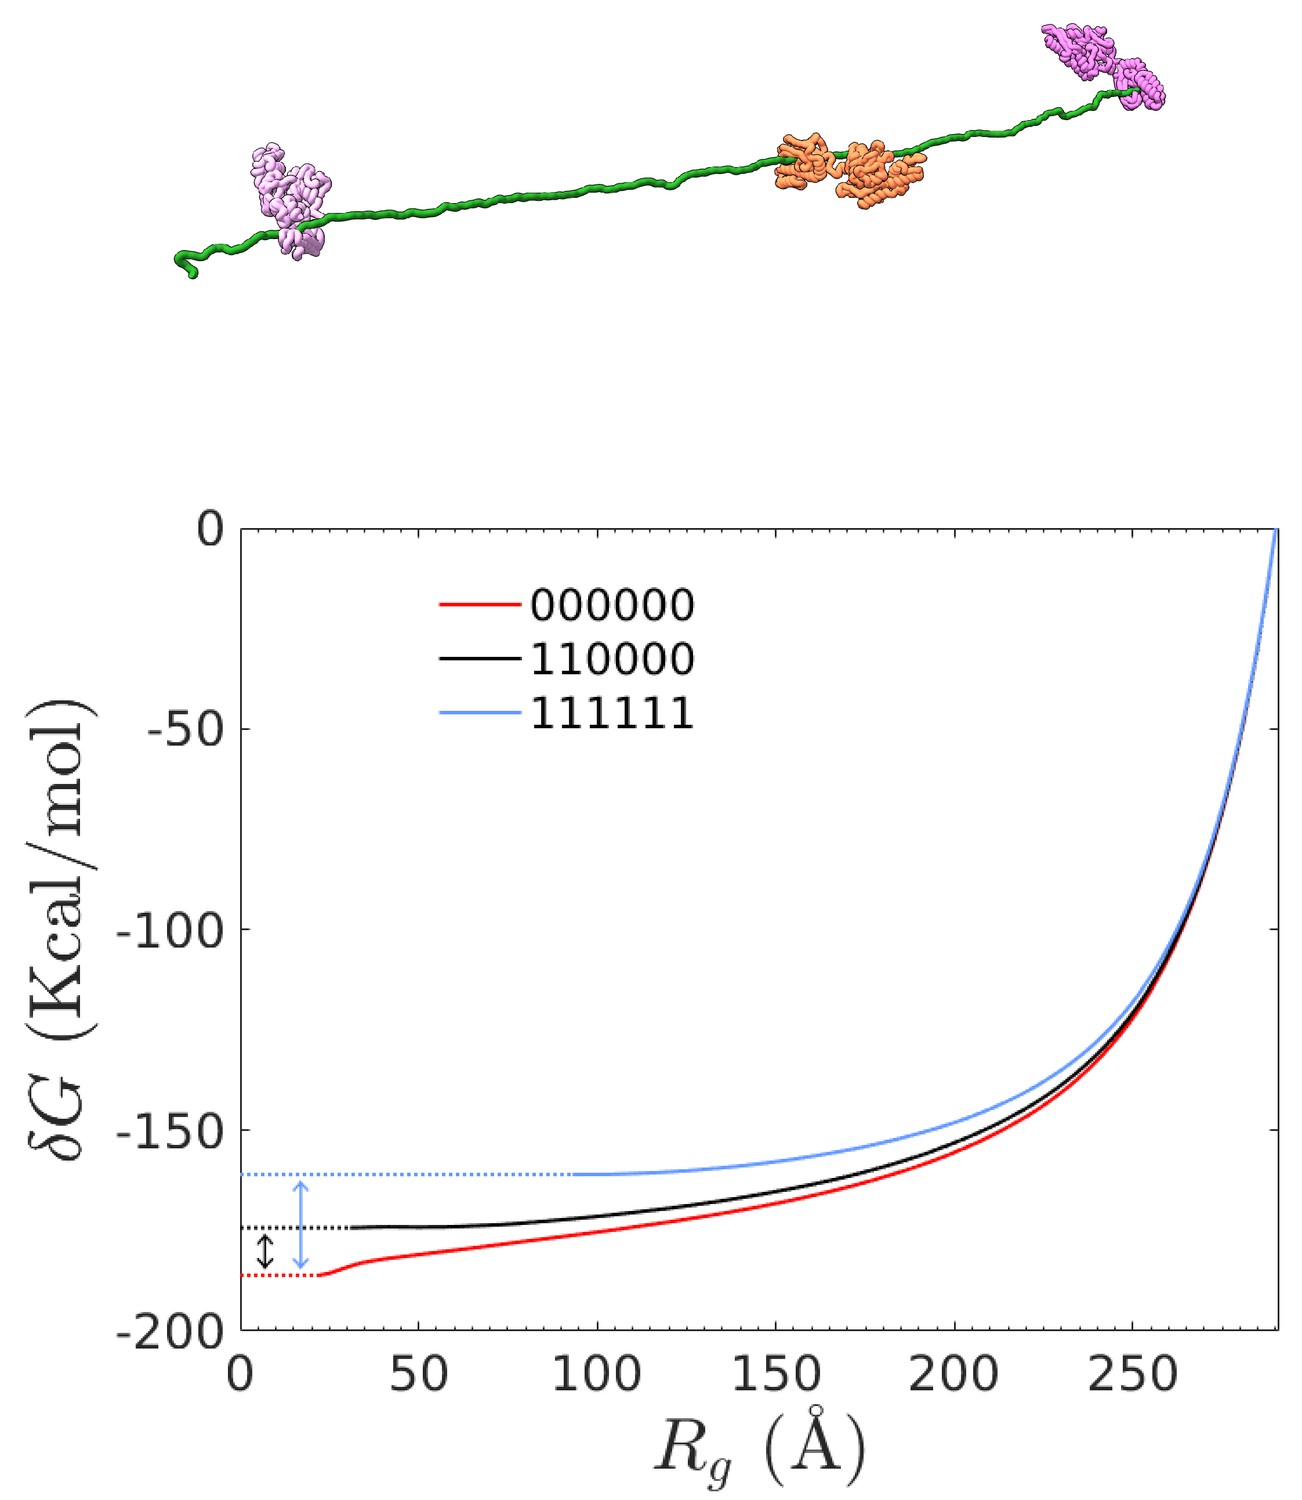
Free energy computation of different combinations of bound chaperones from steered MD simulations.
Top: representative chaperone/rhodanese complex in the fully-stretched conformation. Bottom: Free-energy difference between equilibrium conformations and the fully-stretched state for rhodanese (red line) and two representative chaperone/rhodanese complexes. The double arrows indicate the final value of for the corresponding complex.
-
Figure 2—figure supplement 1—source data 1
Simulation data used to generate the free energy plots; the work performed by the pulling force for each trajectory is also included in the subfolders.
- https://cdn.elifesciences.org/articles/48491/elife-48491-fig2-figsupp1-data1-v2.zip
Figure 3
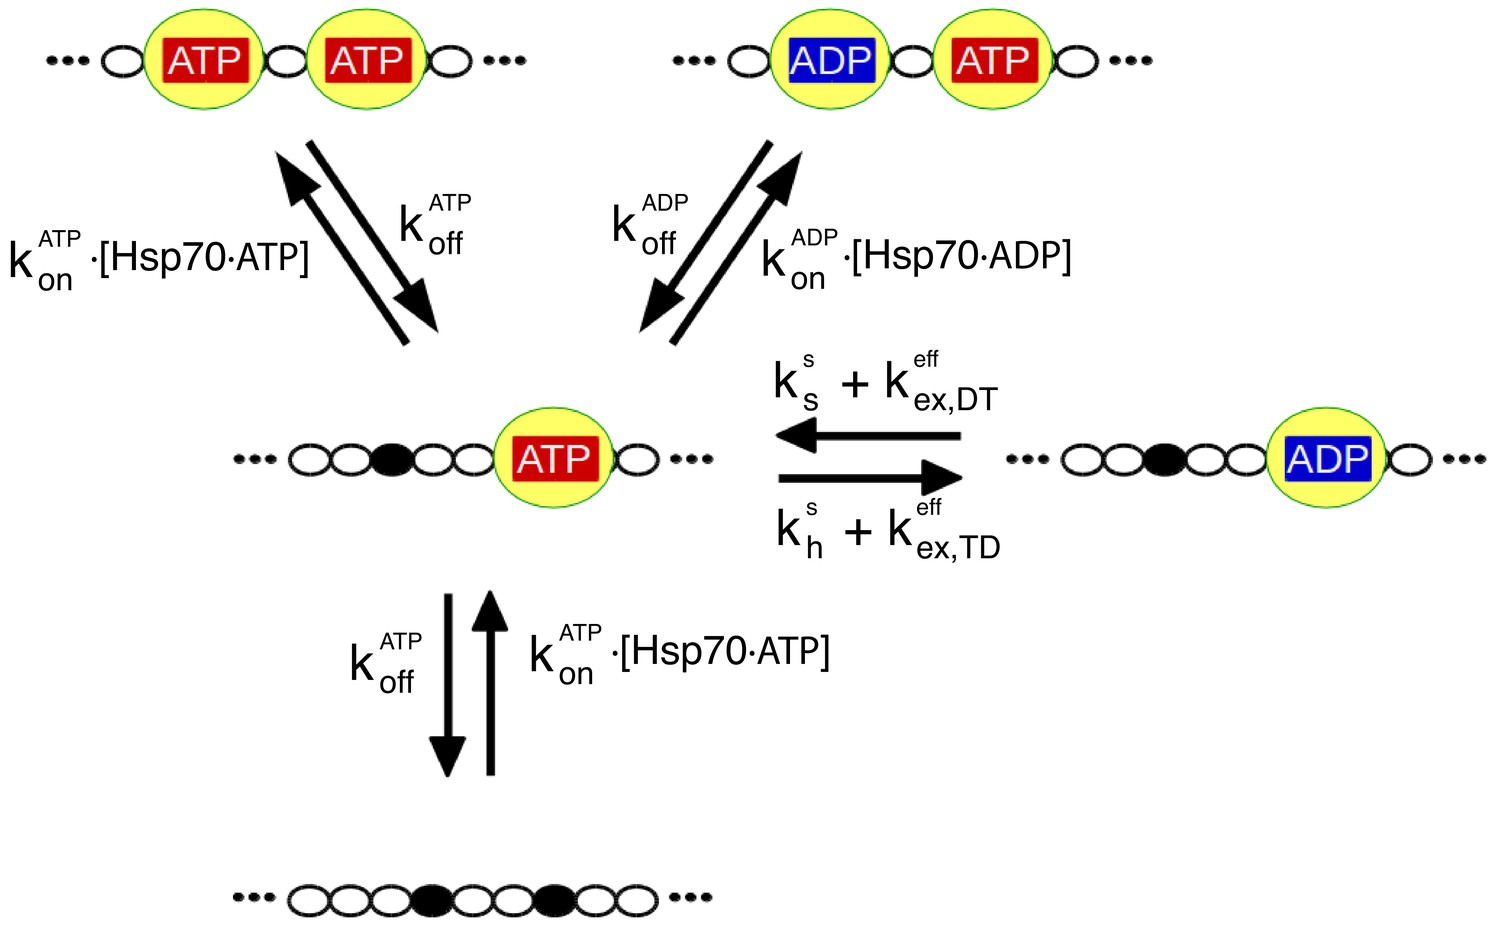
The relevant biochemical reactions of the Hsp70/rhodanese system can be described by a rate model.
Each chaperone binding site on rhodanese (black dots) can be either free or occupied by an Hsp70 (yellow), which in turn can be either ADP- or ATP-bound. We depict here for the sake of clarity only a representative portion of the full model, which takes into account six binding sites. The reaction cycle is governed by the rates for chaperone binding/unbinding to the substrate () and for hydrolysis (), synthesis () and exchange ( of nucleotides bound to the chaperones (see Materials and methods for further details). Importantly, the binding rate constants, and , take into account the conformational free energies, according to Equation (1).
Figure 4
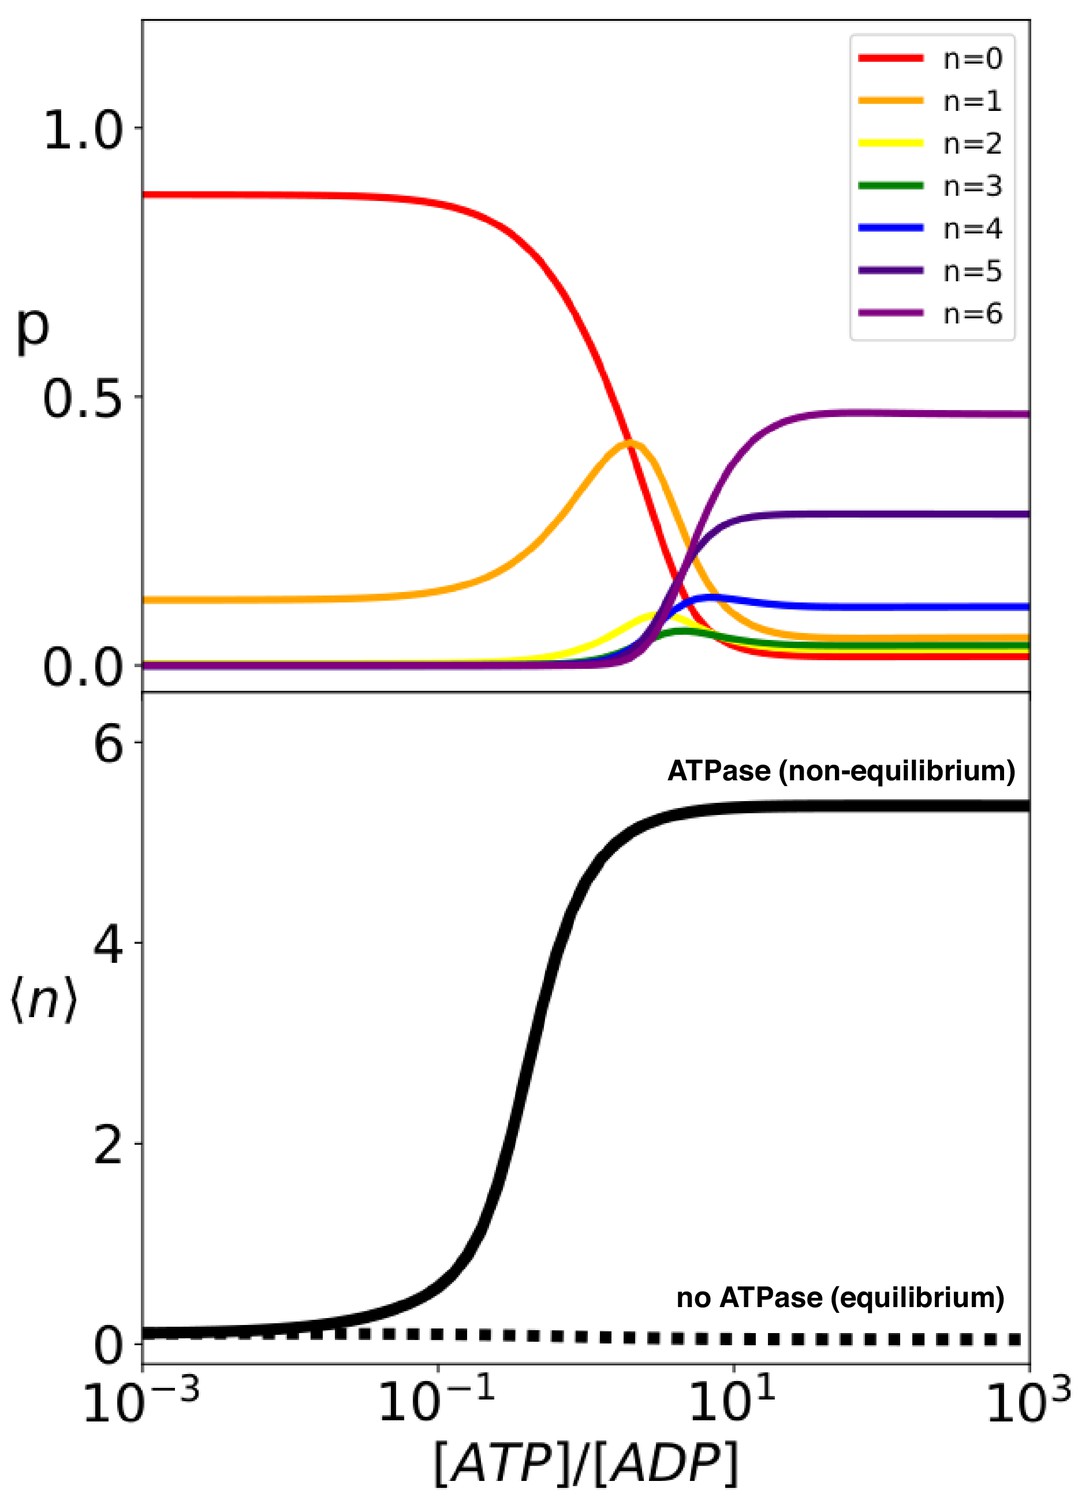
Hsp70 binding is a non-equilibrium process that depends on ATP hydrolysis.
(Top) compound probabilities for Hsp70/substrate complexes with given number of bound chaperones as a function of [ATP]/[ADP]. (Bottom) Mean value as a function of [ATP]/[ADP] with (solid line) and without (dashed line) ATP hydrolysis.
-
Figure 4—source data 1
Data from rate model employed to generate the plots in Figure 4.
- https://cdn.elifesciences.org/articles/48491/elife-48491-fig4-data1-v2.zip
Figure 5
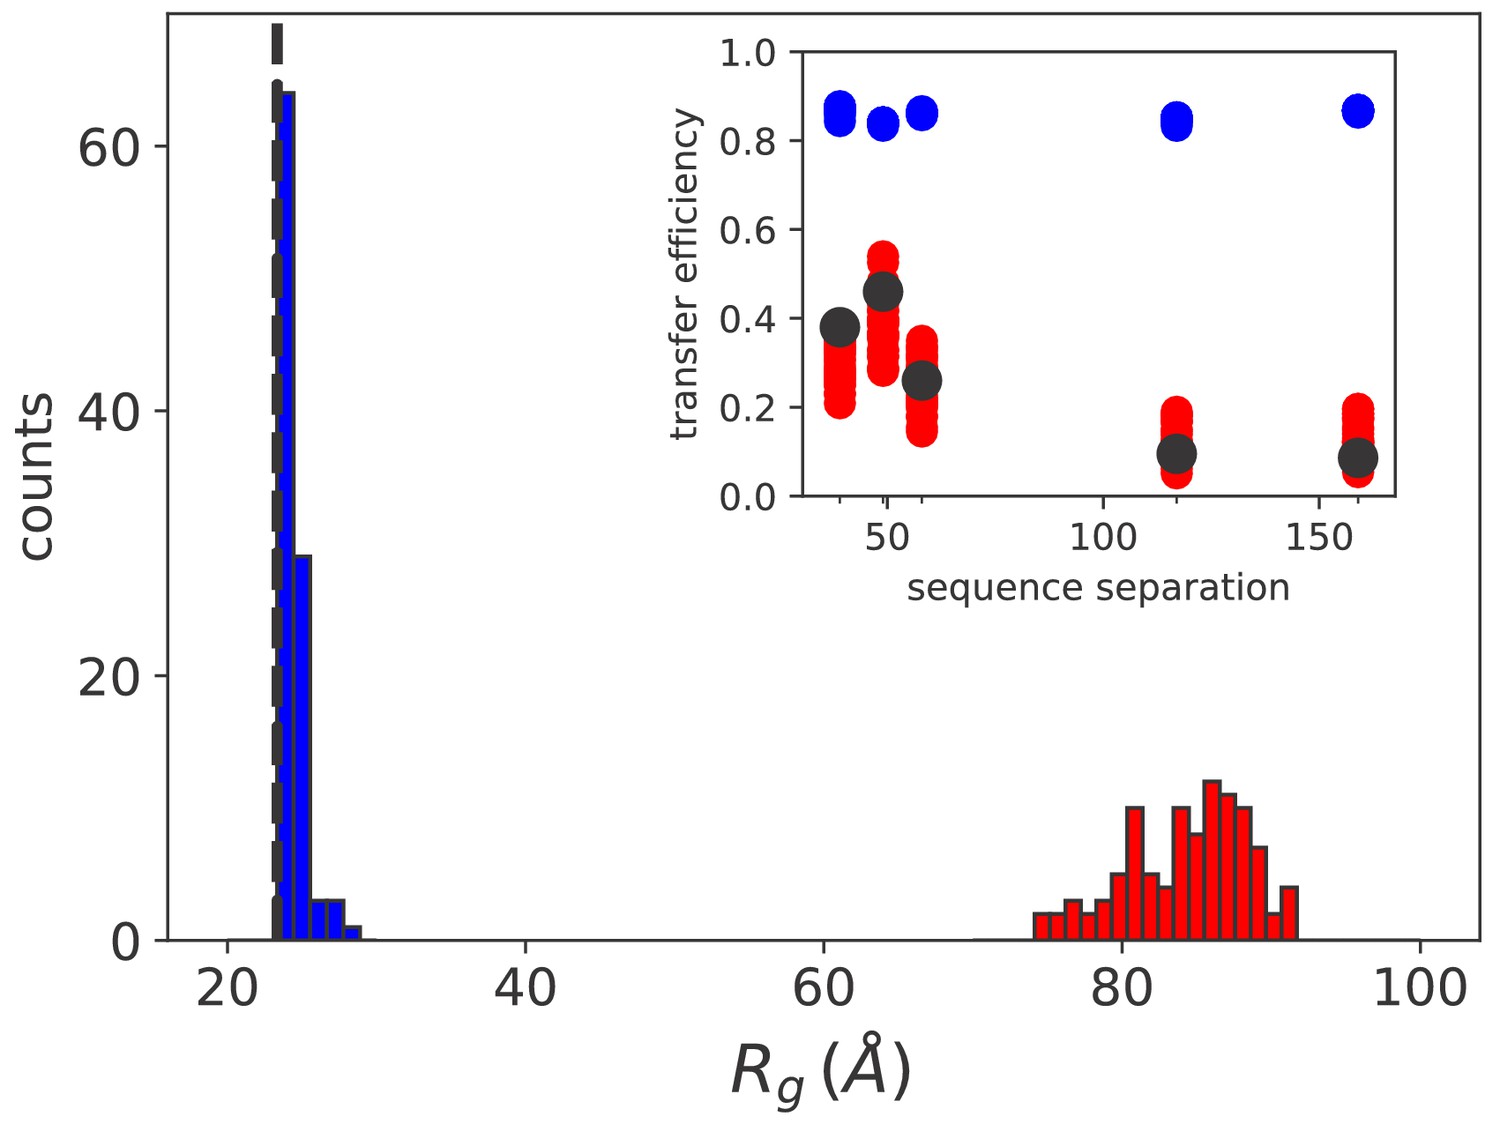
Simulation results match sm FRET experimental data.
Histograms of the radius of gyration for equilibrium (blue) and non equilibrium (red) values of [ATP]. The black dashed line indicates the average radius of unbound rhodanese. (inset) FRET transfer efficiencies as a function of the sequence separation between the fluorescent dyes. The black circles correspond to the experimental values (Kellner et al., 2014). Calculated efficiencies taking into account uncertainties are reported as blue (equilibrium conditions) and red circles (ATP excess).
-
Figure 5—source data 1
Molecular simulation data used to generate the plots in Figure 5.
- https://cdn.elifesciences.org/articles/48491/elife-48491-fig5-data1-v2.zip
Figure 6
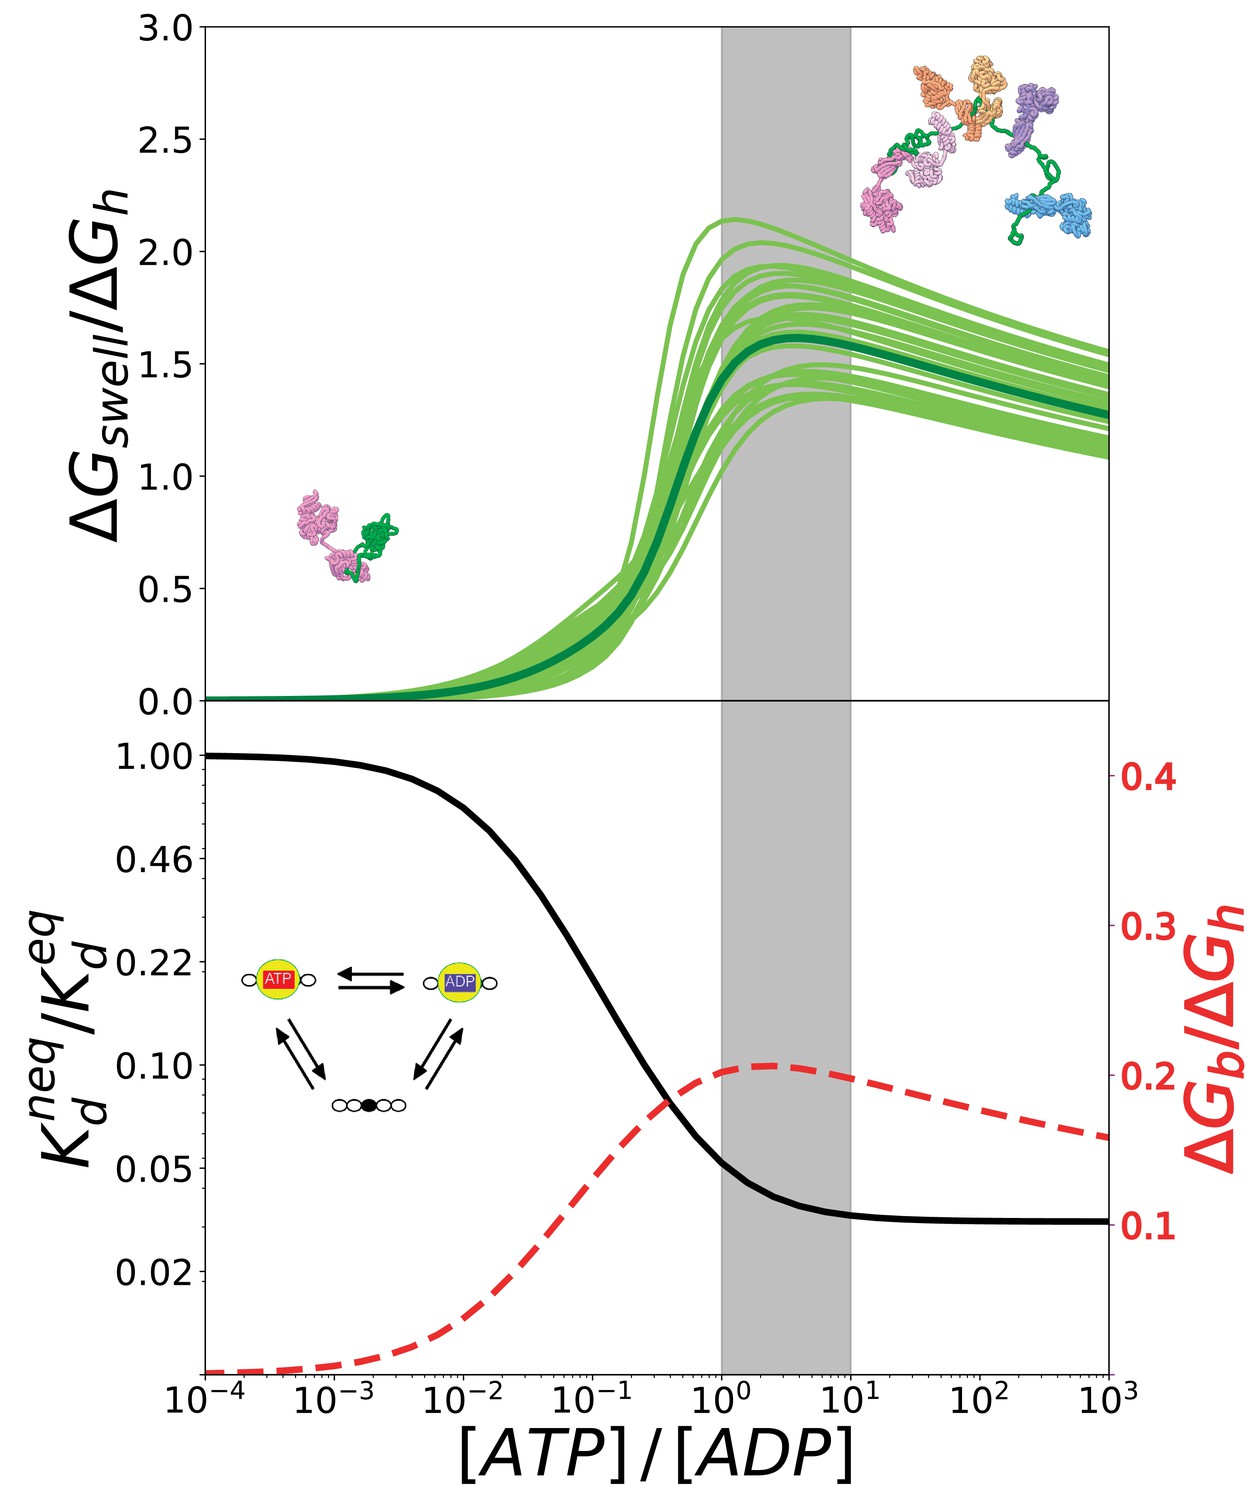
The conversion of chemical energy into mechanical work by Hsp70s is optimal in cellular conditions thanks to the chaperone intrinsic rates.
(Top) Ratio between the conformational free energy and the free energy of ATP hydrolysis, as a function of [ATP]/[ADP]. Dark green curve results from data from molecular simulations and light green curves takes into account normally-distributed uncertainties on calculated . (Bottom) Effective dissociation constant in the case of a single binding site normalized with respect to the corresponding value in equilibrium, as a function of [ATP]/[ADP] (solid black line). Ratio between the non-equilibrium excess of binding free energy and the free energy of ATP hydrolysis , as a function of [ATP]/[ADP] (dashed red line). The gray region indicates the interval corresponding to physiological conditions.
-
Figure 6—source data 1
Free-energy curves used to generate the plots in Figure 6.
- https://cdn.elifesciences.org/articles/48491/elife-48491-fig6-data1-v2.zip
Appendix 1—figure 1

Normalized FRET efficiency histograms of the variant Δ39 (K135C/K174C).
Experiments were performed in the presence of 10 μM DnaK, 500 nM DnaJ, 1 mM ATP and either 5 mM (grey curves) or 100 mM (red curves) of KCl.
-
Appendix 1—figure 1—source data 1
Experimental data employed to generate the FRET histograms reported in the Appendix 1—figure 1.
- https://cdn.elifesciences.org/articles/48491/elife-48491-app1-fig1-data1-v2.zip
Additional files
-
Source data 1
Auxiliary files for molecular dynamics simulations.
- https://cdn.elifesciences.org/articles/48491/elife-48491-data1-v2.zip
-
Transparent reporting form
- https://cdn.elifesciences.org/articles/48491/elife-48491-transrepform-v2.pdf
-
Appendix 1—figure 1—source data 1
Experimental data employed to generate the FRET histograms reported in the Appendix 1—figure 1.
- https://cdn.elifesciences.org/articles/48491/elife-48491-app1-fig1-data1-v2.zip
Download links
A two-part list of links to download the article, or parts of the article, in various formats.
Downloads (link to download the article as PDF)
Open citations (links to open the citations from this article in various online reference manager services)
Cite this article (links to download the citations from this article in formats compatible with various reference manager tools)
Efficient conversion of chemical energy into mechanical work by Hsp70 chaperones
eLife 8:e48491.
https://doi.org/10.7554/eLife.48491


