Repressive H3K9me2 protects lifespan against the transgenerational burden of COMPASS activity in C. elegans
- Emory University School of Medicine, United States
Figures
Figure 1 with 3 supplements
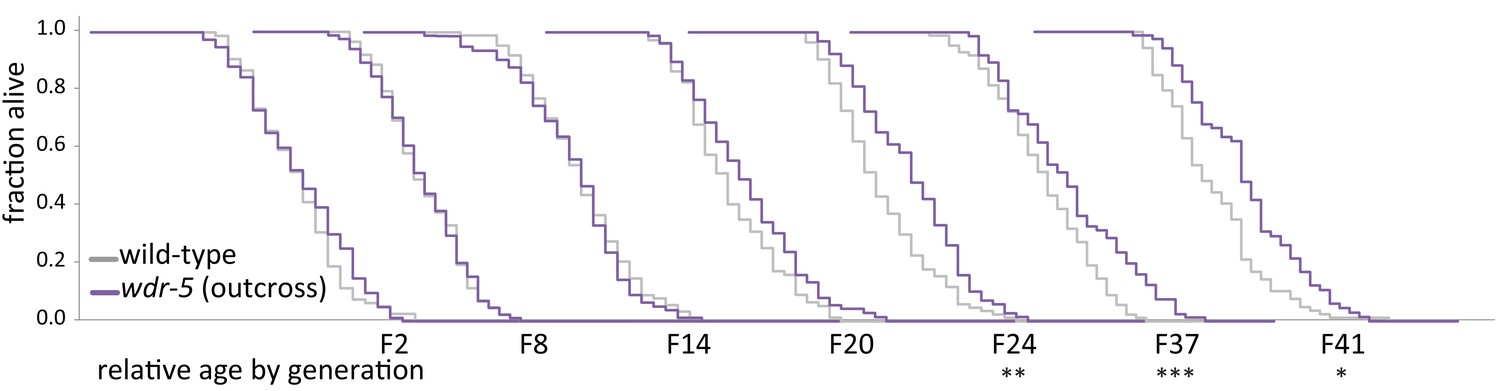
Longevity takes many generations to manifest in wdr-5 mutants.
Analysis of relative lifespan between wild-type (gray) and wdr-5 mutants (purple) across generational time. P0 wild type was descended from animals recovered from a thaw. P0 wdr-5 mutants were the first homozygous mutants after maintenance as heterozygotes for five generations. For each generation, the x-axis is 40 days. *p<0.05, **p<0.01, ***p<0.001 compared to wild-type from the same generation with log-rank test. Median lifespan and statistics are presented in supplementary file 1. Additional replicates shown in Figure 1—figure supplement 1 and supplementary file 3.
Figure 1—figure supplement 1
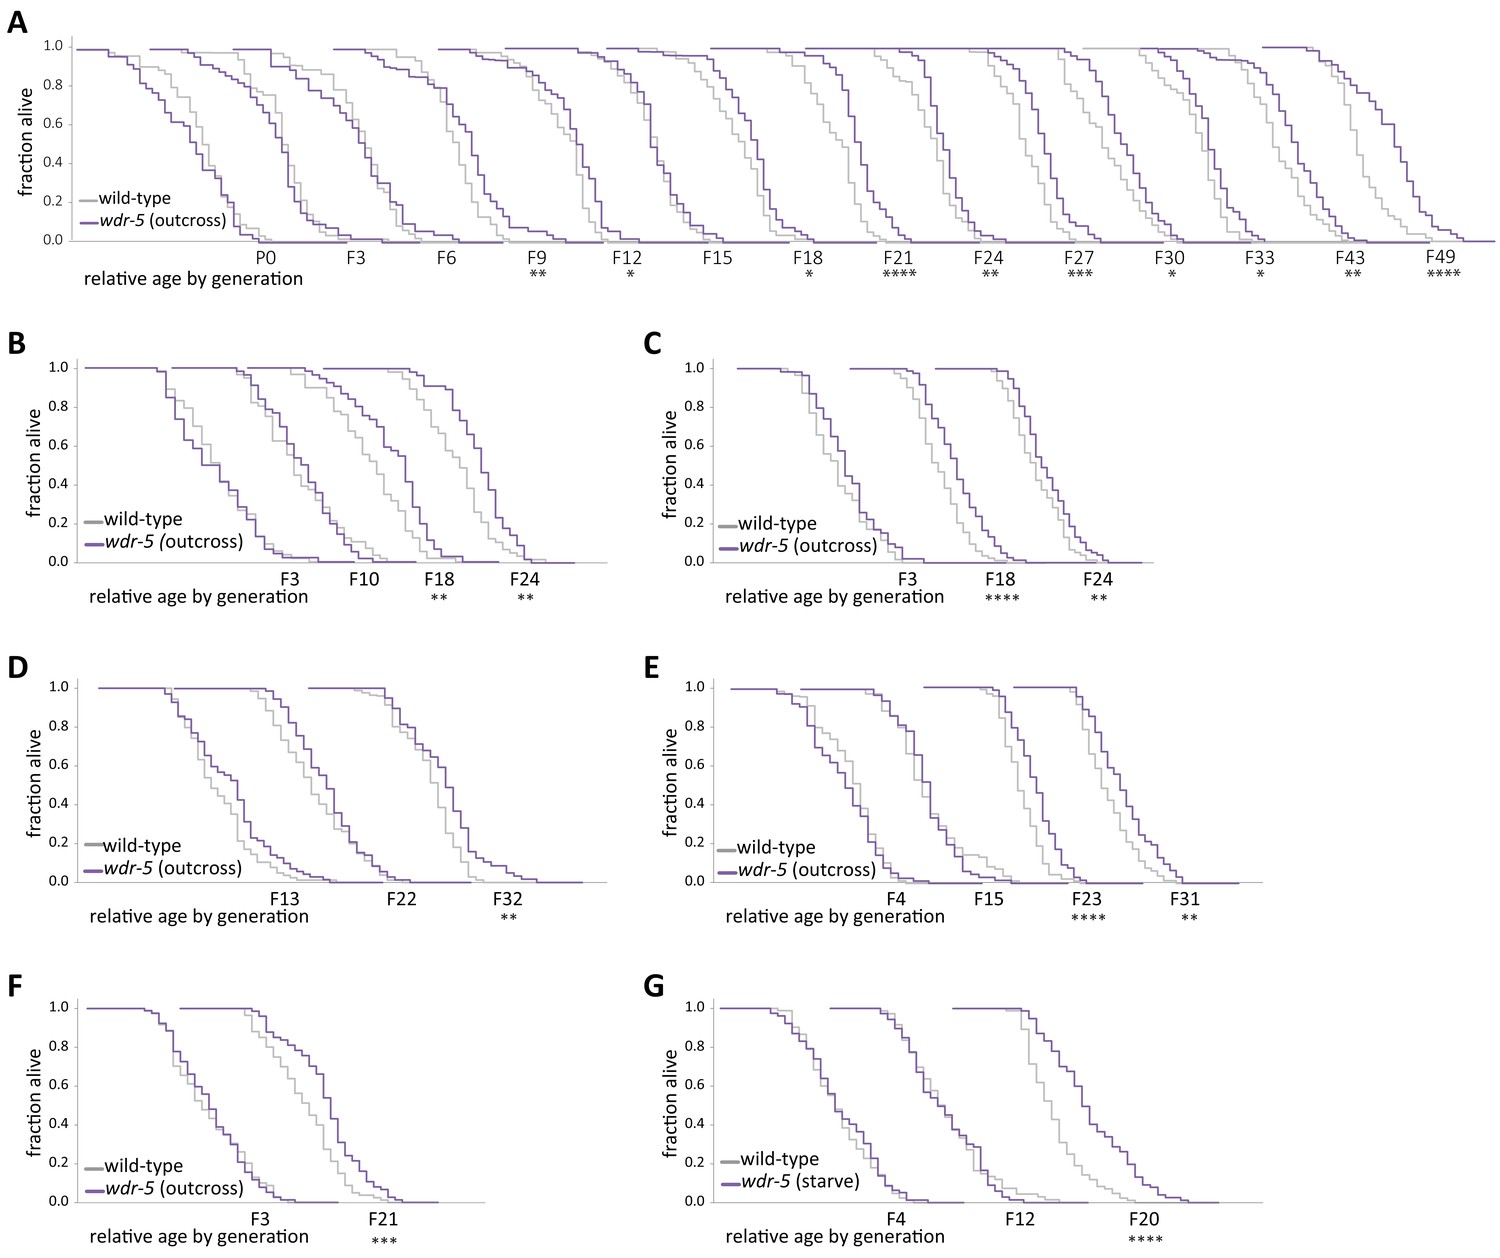
Longevity in wdr-5 mutants reproducibly takes many generations to manifest.
(A–G) Analysis of relative lifespan between wild-type (gray) and wdr-5 mutants (purple) in seven independent transgenerational experiments. wdr-5 mutant populations were either reset by being maintained as heterozygotes for five generations following an outcross or by starving, as indicated in graph legend. Replicates (E), and (F), along with replicate shown in Figure 1, were used for ChIP-seq analysis. For each generation, the x-axis is 40 days. *p<0.05, **p<0.01, ***p<0.001, and ****p<0.0001 compared to wild-type from the same generation with log-rank test. Mean lifespan and statistics are presented in supplementary file 3.
Figure 1—figure supplement 2
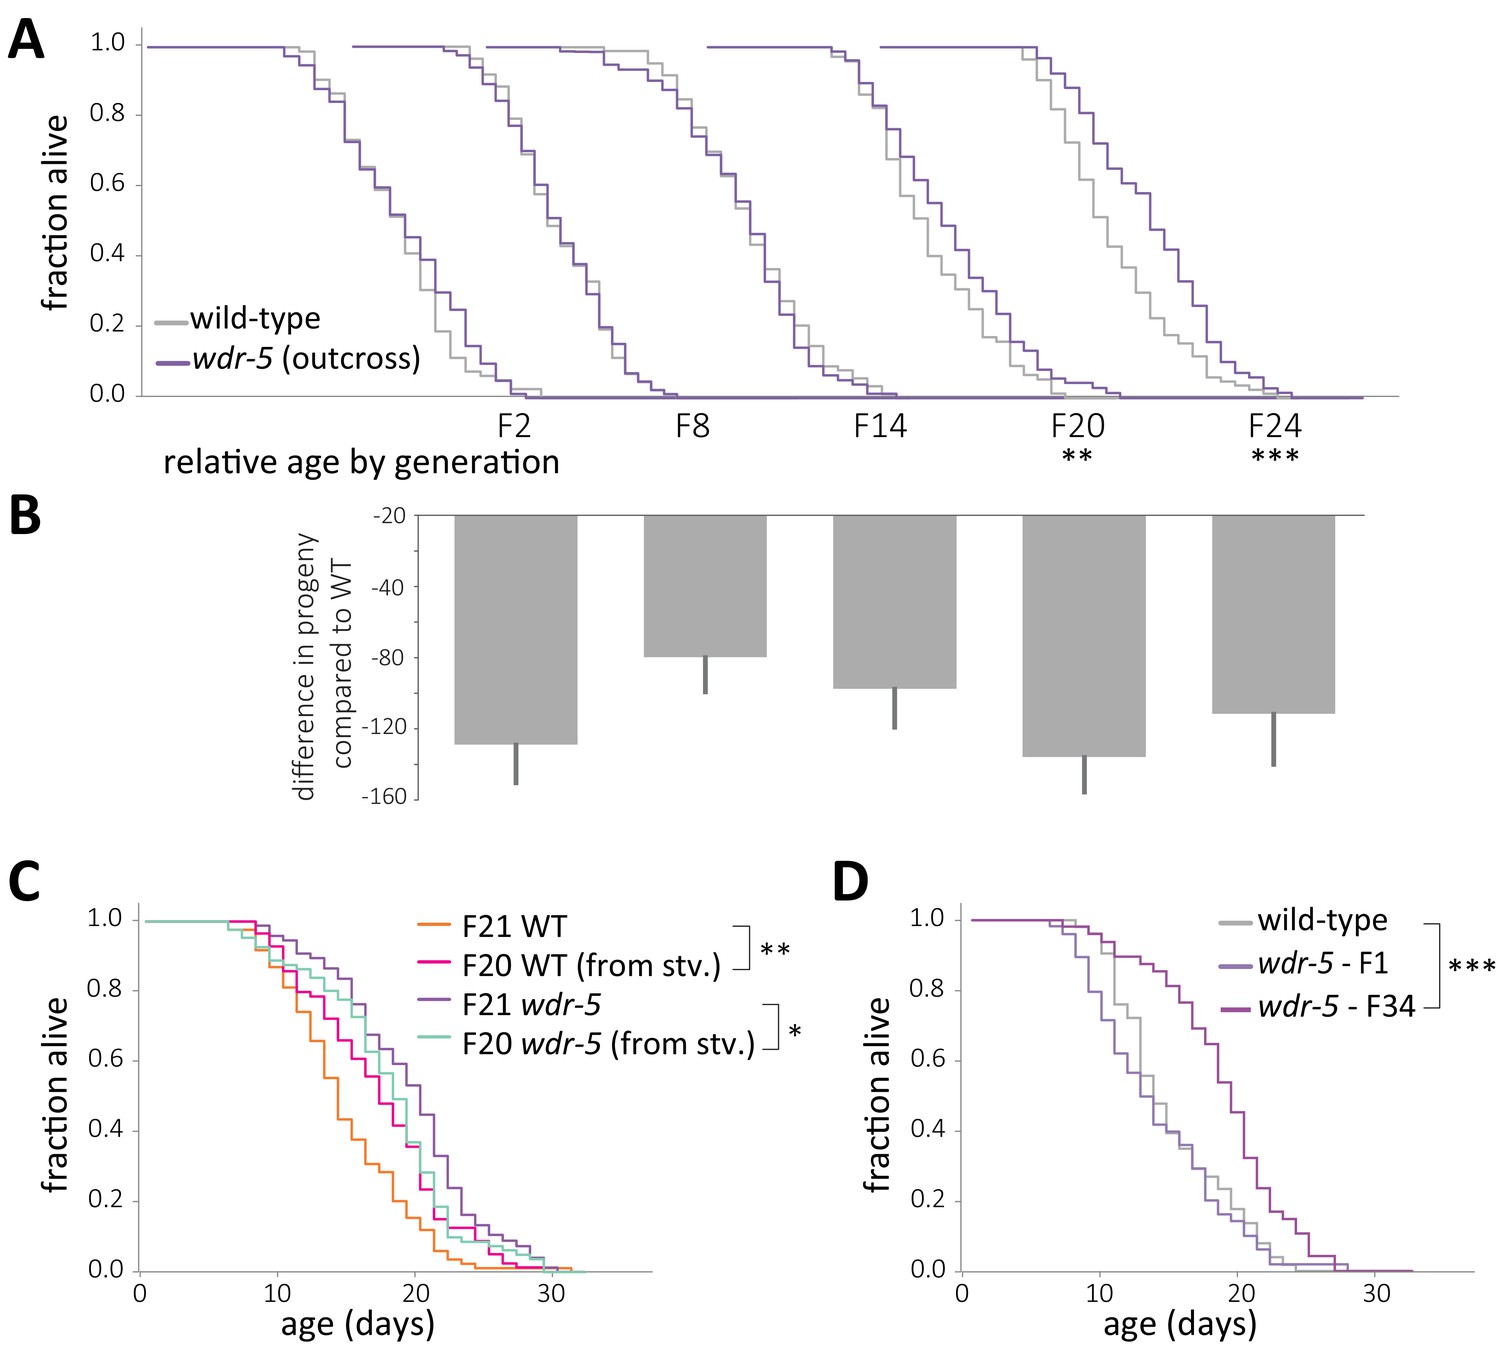
Longevity is not caused by decreased fecundity or by background mutations.
(A) Comparison of relative lifespan between wild-type (gray) and wdr-5 mutant (purple) populations over generational time. For each generation, the x-axis is set at is 40 days. (B) Difference in progeny number between wild type and wdr-5 mutants for populations shown in (A). Each generation in (B) is shown directly under the corresponding generation in (A). (C) Comparison of lifespan in fed descendants from starved or fed late-gen populations of either wdr-5 mutants (purple and cyan, respectively) or wild type (orange and pink, respectively). (D) Lifespan of early-gen wdr-5 mutants (purple) derived from outcrossing late-gen wdr-5 mutants compared to the corresponding un-outcrossed late-gen wdr-5 mutant population (plum) and mid-gen wild-type animals (gray). *p<0.06, **p<0.01 and ***p<0.001 compared to the wild-type population in the same assay with log-rank test. Progeny data and an additional replicate are presented in supplementary file 2. Median lifespan, statistics, and additional replicates are presented in supplementary file 3.
Figure 1—figure supplement 3

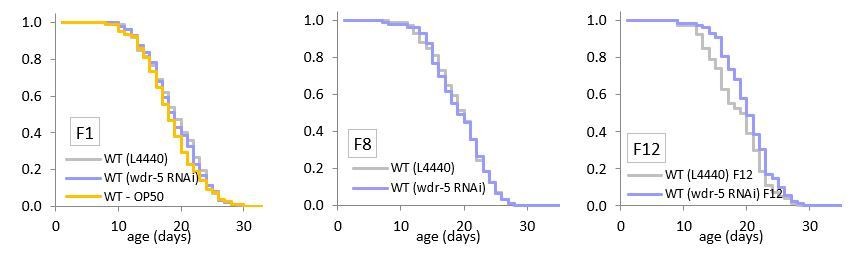
Depletion by RNAi does not increase lifespan within twelve generations.
Comparison of relative lifespan between wild-type animals on an empty vector control (gray) and wild-type animals on wdr-5 RNAi (dark purple) populations over generational time. For each generation, the x-axis is set at is 35 days. *p<0.05 compared to the wild-type population fed an empty vector control with log-rank test. Median lifespan and statistics are presented in supplementary file 3.
Figure 2 with 1 supplement
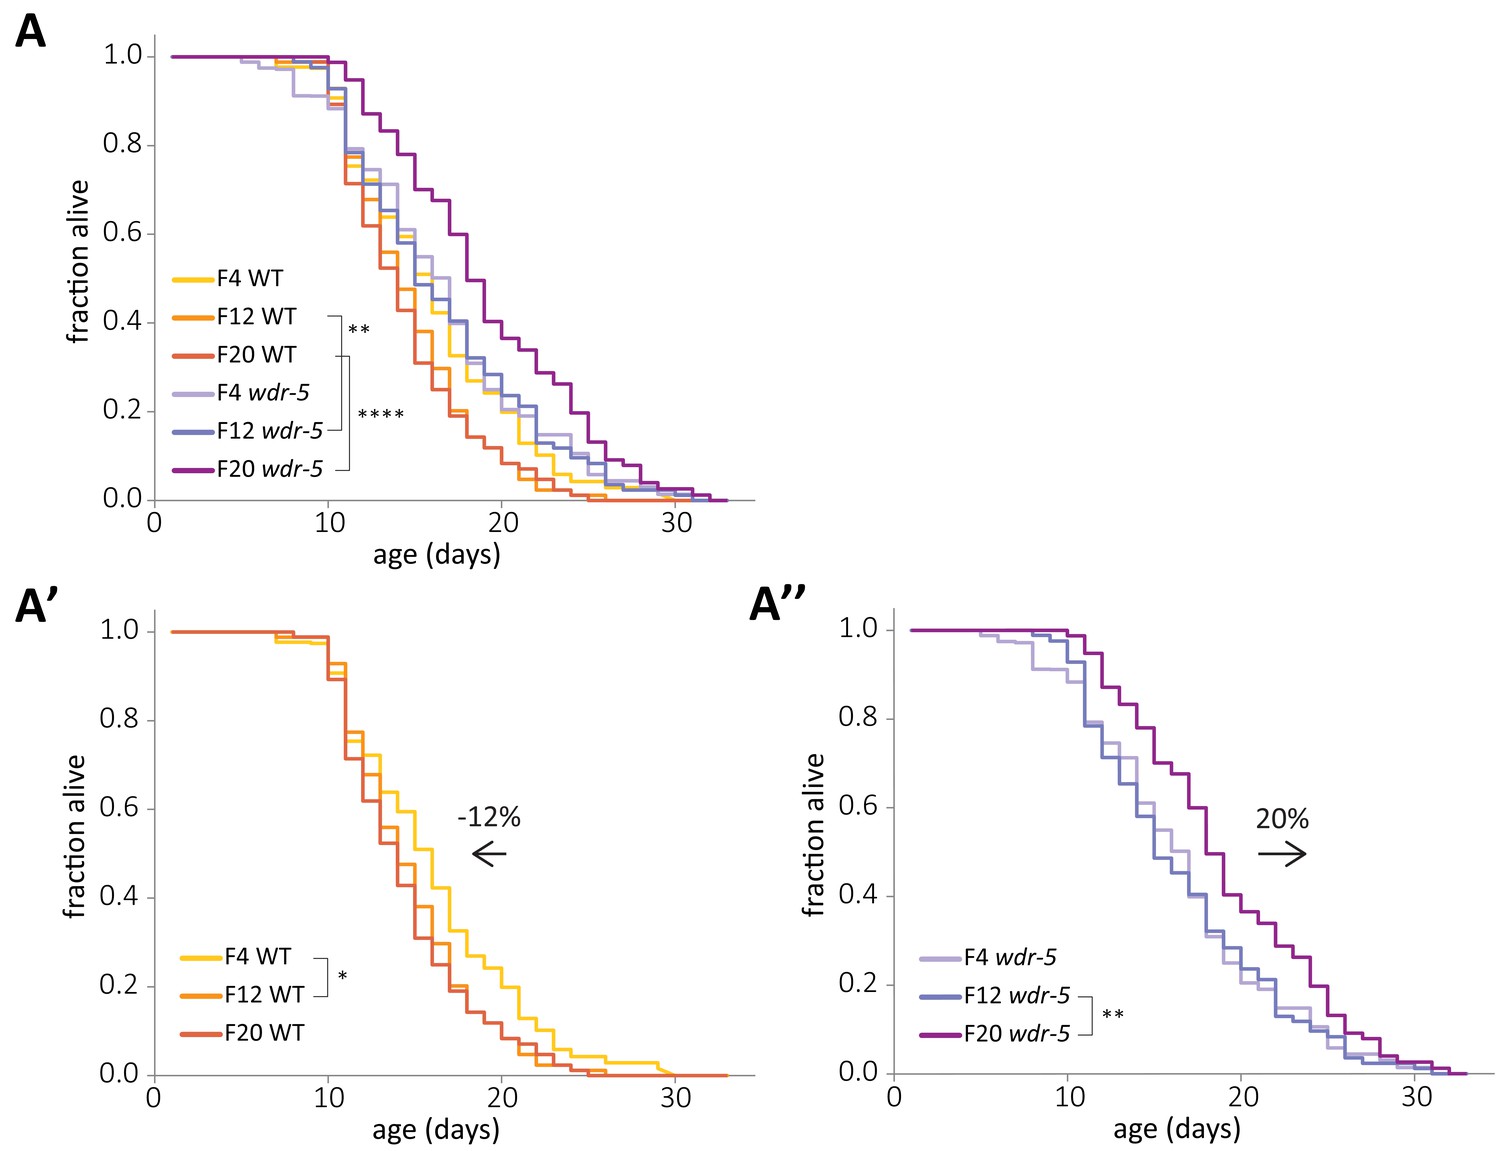
Concurrent and opposite changes in lifespan account for the full wdr-5 mutant lifespan extension.
(A) Lifespan of early-, mid-, and late-gen wild-type (yellow, tangerine, and burnt orange, respectively) and wdr-5 mutant populations (lavender, purple, and plum, respectively) descended from animals recovered from a thaw. Data are also shown separated into wild-type (A’) and wdr-5 mutant populations (A’’). Percentage difference in median lifespan between early- and late-gen is indicated above arrow. p<0.05, **p<0.01, and ****p<0.0001 using log-rank test. Median lifespan and statistics are presented in supplementary file 1. Additional replicates are included in supplementary file 3.
Figure 2—figure supplement 1
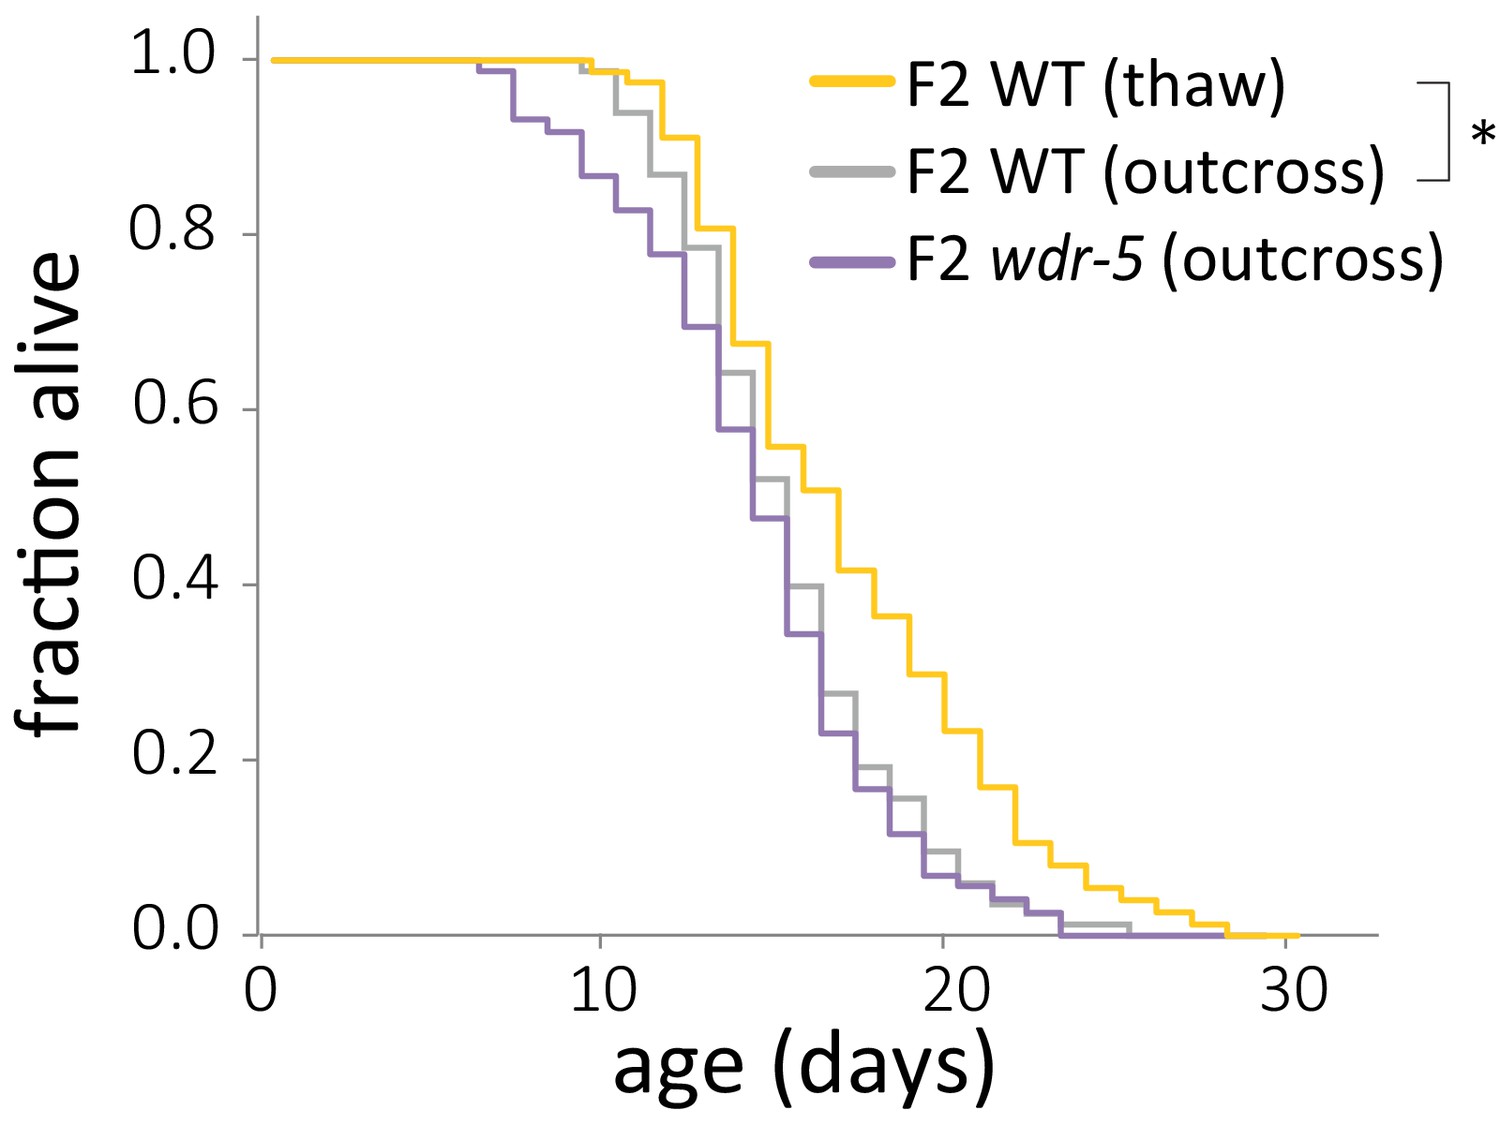
Lifespan does not differ between populations descended from the same outcross.
Lifespan comparison of early-gen wild-type animals from a thaw (gold) to early-gen wild-type (gray) and wdr-5 mutant (purple) populations, both derived from outcrossing late-gen wdr-5 mutants and maintaining the population as heterozygotes for five generations. *p<0.05 between both wild-type populations using log-rank test. Median lifespan, statistics, and additional replicates are presented in supplementary file 3.
Figure 3 with 1 supplement

Long-lived wdr-5 mutants have more H3K9me2 enrichment than wild type.
(A) Immunoblot comparing H3K9me2 protein levels in late-gen wild type to late-gen wdr-5 mutants and late-gen met-2 mutants (representative of two independent experiments). Actin is used as a loading control. (B, D, E) Metaplots of averaged z-score H3K9me2 ChIP-seq signal across H3K9me2 peaks (B), all genes (D), or germline genes (E) in early-, mid-, and late-gen populations of wild type (yellow, orange, and red, respectively) and wdr-5 mutants (lavender, purple, and plum, respectively). Line shows mean ChIP-seq signal. Data in (B) are also shown separated into wild type (B’) and wdr-5 mutants (B’’). Plots are centered on peak centers (B, B’, B’’) or pseudoscaled over genes to 1 kb with 500 bp borders on either side, indicated by vertical gray lines (D–E). (C) H3K9me2 ChIP-seq ratios of wdr-5 mutant coverage over wild-type coverage at each H3K9me2 peak (N = 10,457). Coverage is normalized to RPM. Thick line shows mean and whiskers show standard deviation. Green dots represent peaks that fall beyond y-axis scale (two peaks in mid-gen and 33 peaks in late-gen). ****p<0.0001 with paired t-test.
Figure 3—figure supplement 1
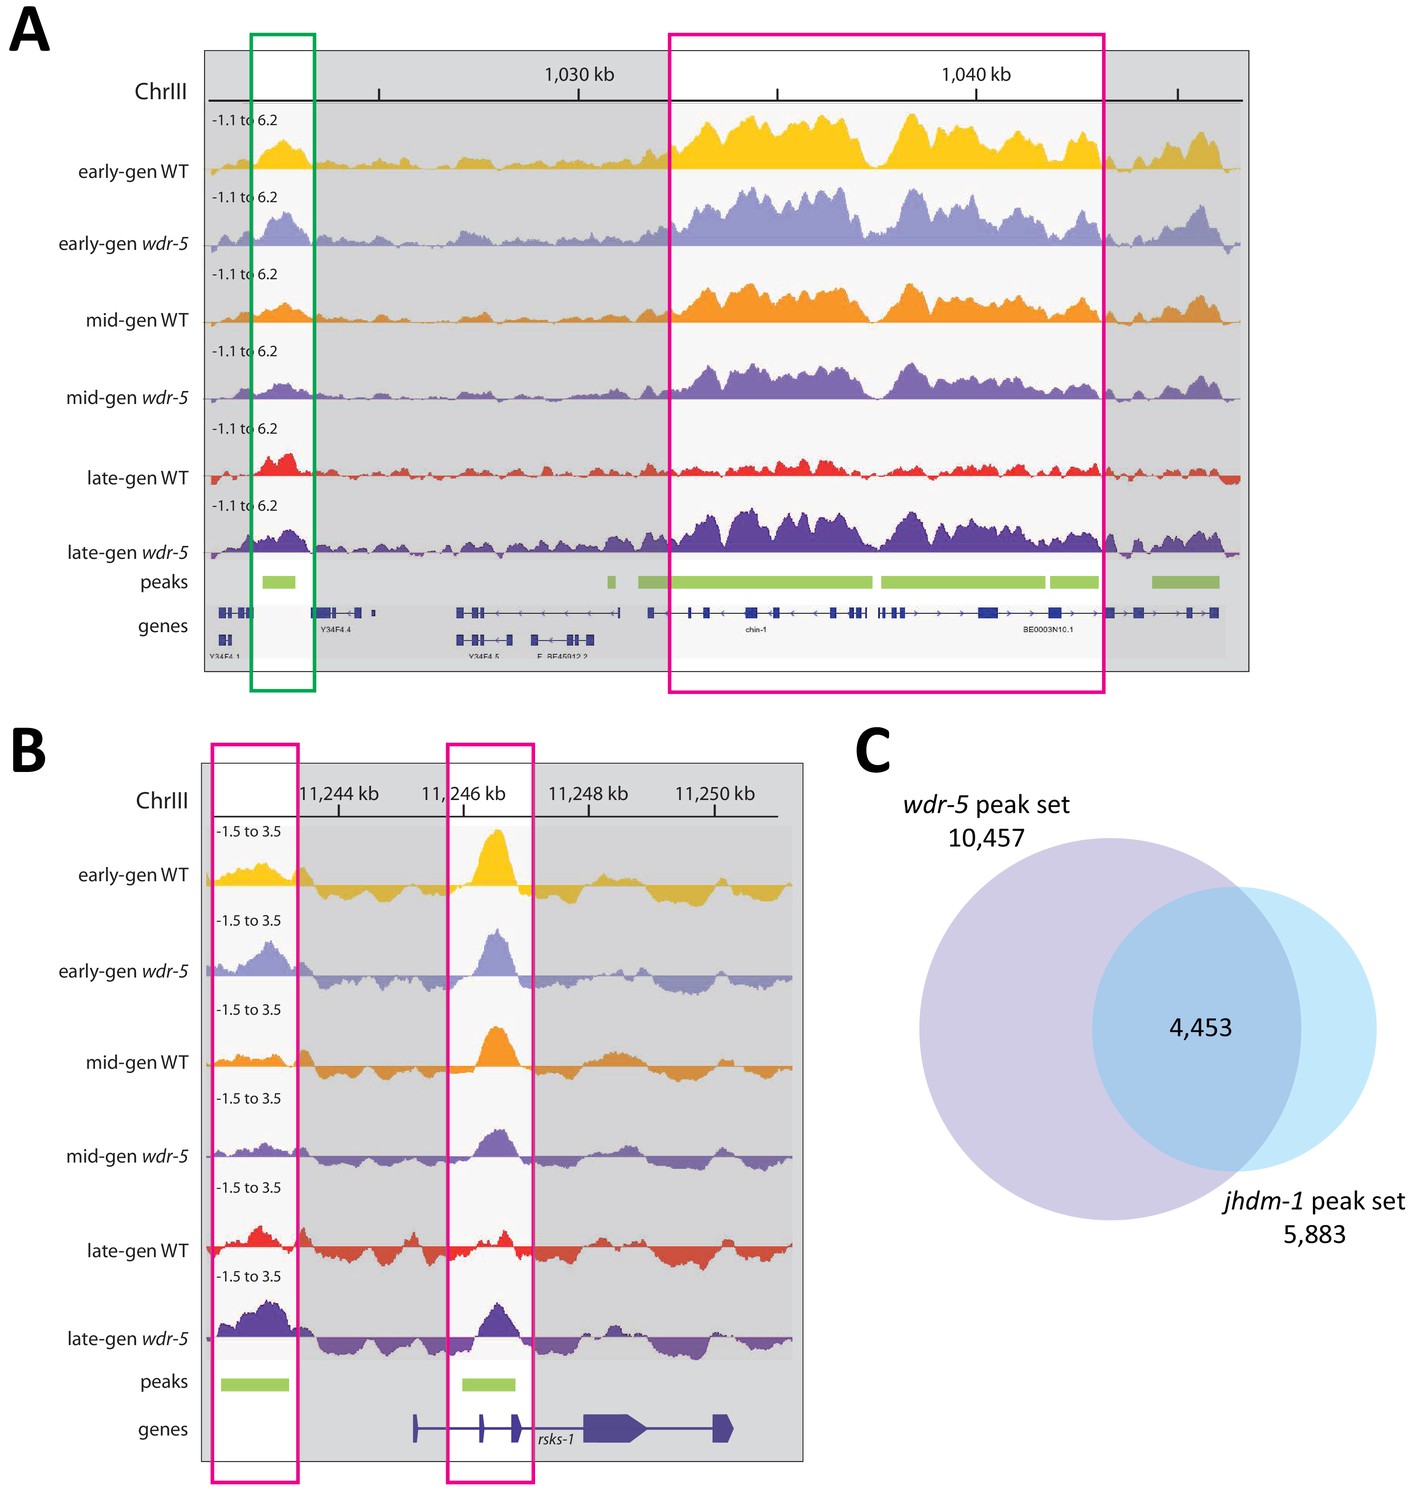
Long-lived wdr-5 mutants have more H3K9me2 than wild type.
(A)-(B) Representative H3K9me2 enrichment profiles in an IGV browser screenshot over a 26 kb region of Chr. III (A) and the rsks-1 locus (B). Average z-scored ChIP-seq tracks for H3K9me2 signal in early-gen wild type (yellow), early-gen wdr-5 mutants (lavender), mid-gen wild type (orange), mid-gen wdr-5 mutants (purple), late-gen wild type (red), and late-gen wdr-5 mutants (plum). All coverage tracks are shown on the same scale, −1.1 to 6.2 (A) or −1.5 to 3.5 (B). Below the tracks, H3K9me2 ChIP-seq peaks are shown in green, and genes are shown in blue. Highlighted region outlined in green shows a peak where mutant/wild type coverage ratios do not change over generational time. Highlighted regions outlined in pink show peaks where the ratio increases in late-gen populations. (C) Overlap between peaks called in transgenerational ChIP-seq experiments of wdr-5 mutants (Figure 3) or jhdm-1 mutants (Figure 4).
Figure 4 with 1 supplement
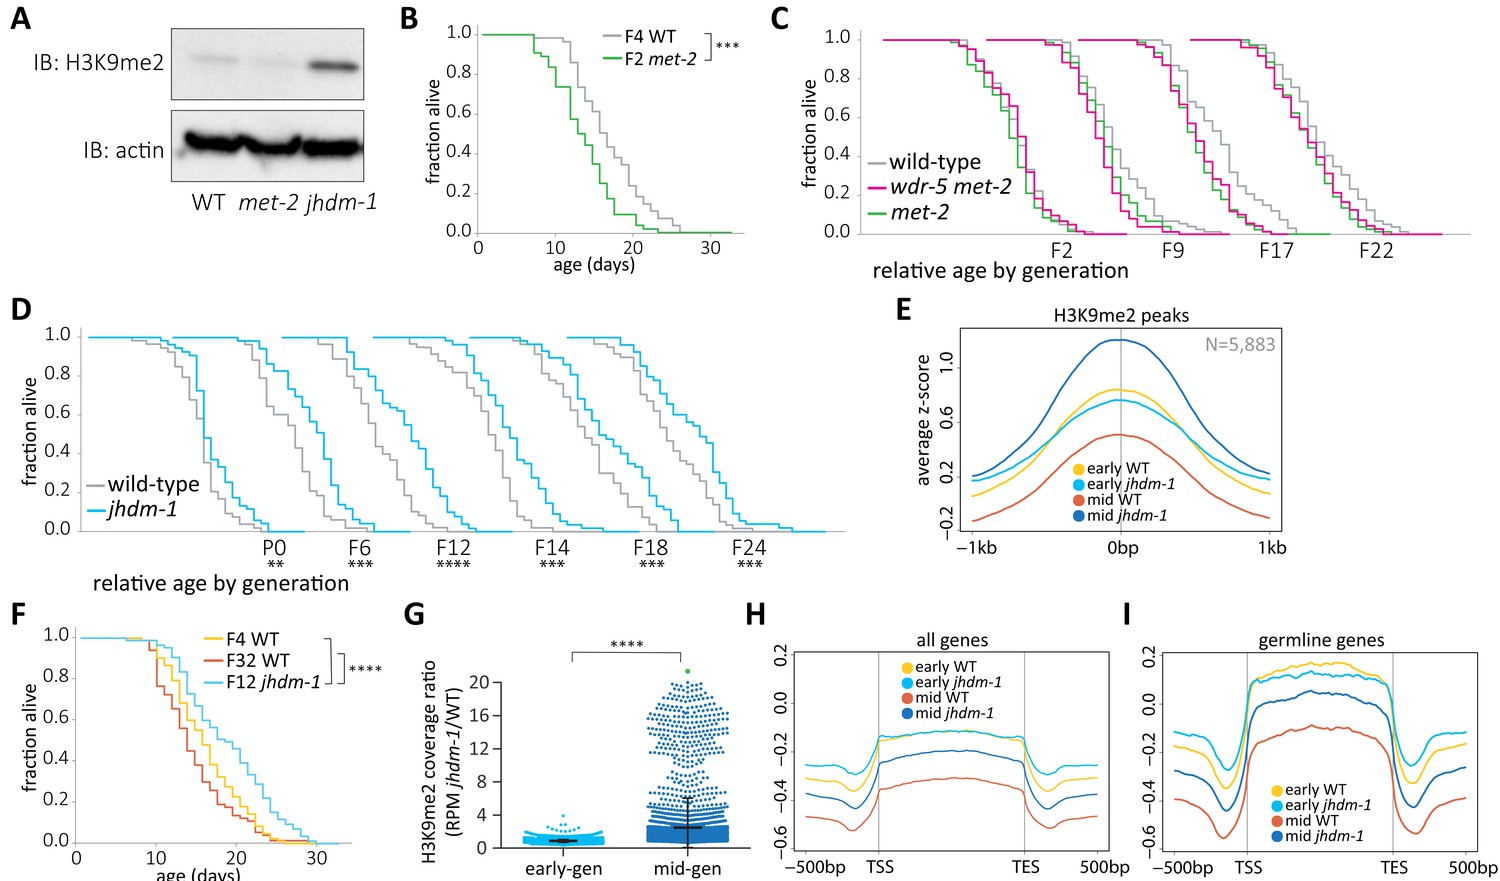
wdr-5 mutant lifespan extension requires H3K9me2.
(A) Immunoblot comparing H3K9me2 protein levels in mid-gen mixed-stage wild type to mid-gen jhdm-1 and mid-gen met-2 mutants (representative of two independent experiments). Actin is used as a loading control. (B, F) Lifespan of early-gen met-2 mutants (green) and wild type (gray) (B) or mid-gen jhdm-1 mutants (blue) compared to early- (yellow) and late-gen (orange) wild type (F). (C–D) Generational analysis comparing relative lifespan in wdr-5 met-2 double mutants (pink) and met-2 single mutants (green) (C) or jhdm-1 mutants (blue) (D) to late-gen wild type (gray). The generation below each assay refers only to mutant populations. For each generation, the x-axis is set at is 40 days. (E, H, I) Metaplots of averaged z-score H3K9me2 ChIP-seq signal across H3K9me2 peaks (E), all genes (H), or germline genes (I) in early- and mid-gen populations of wild type (yellow and orange, respectively) and jhdm-1 mutants (blue and navy, respectively). Line shows mean ChIP-seq signal. Plots are either centered on peak centers (E) or pseudoscaled over genes to 1 kb with 500 bp borders on either side, indicated by vertical gray lines (H– I). (G) H3K9me2 ChIP-seq ratios of jhdm-1 mutant coverage over wild-type coverage at each H3K9me2 peak. Coverage for each sample is normalized to RPM. Thick line shows mean and whiskers show standard deviation. Green dot represents 65 peaks that lie beyond y-axis scale. *p<0.05, **p<0.01, ***p<0.001, and ****p<0.0001 compared to wild-type with log-rank test for lifespan assays or with paired t-test for coverage ratios. Median lifespan and statistics are presented in supplementary file 1, with additional replicates included in supplementary file 3.
Figure 4—figure supplement 1
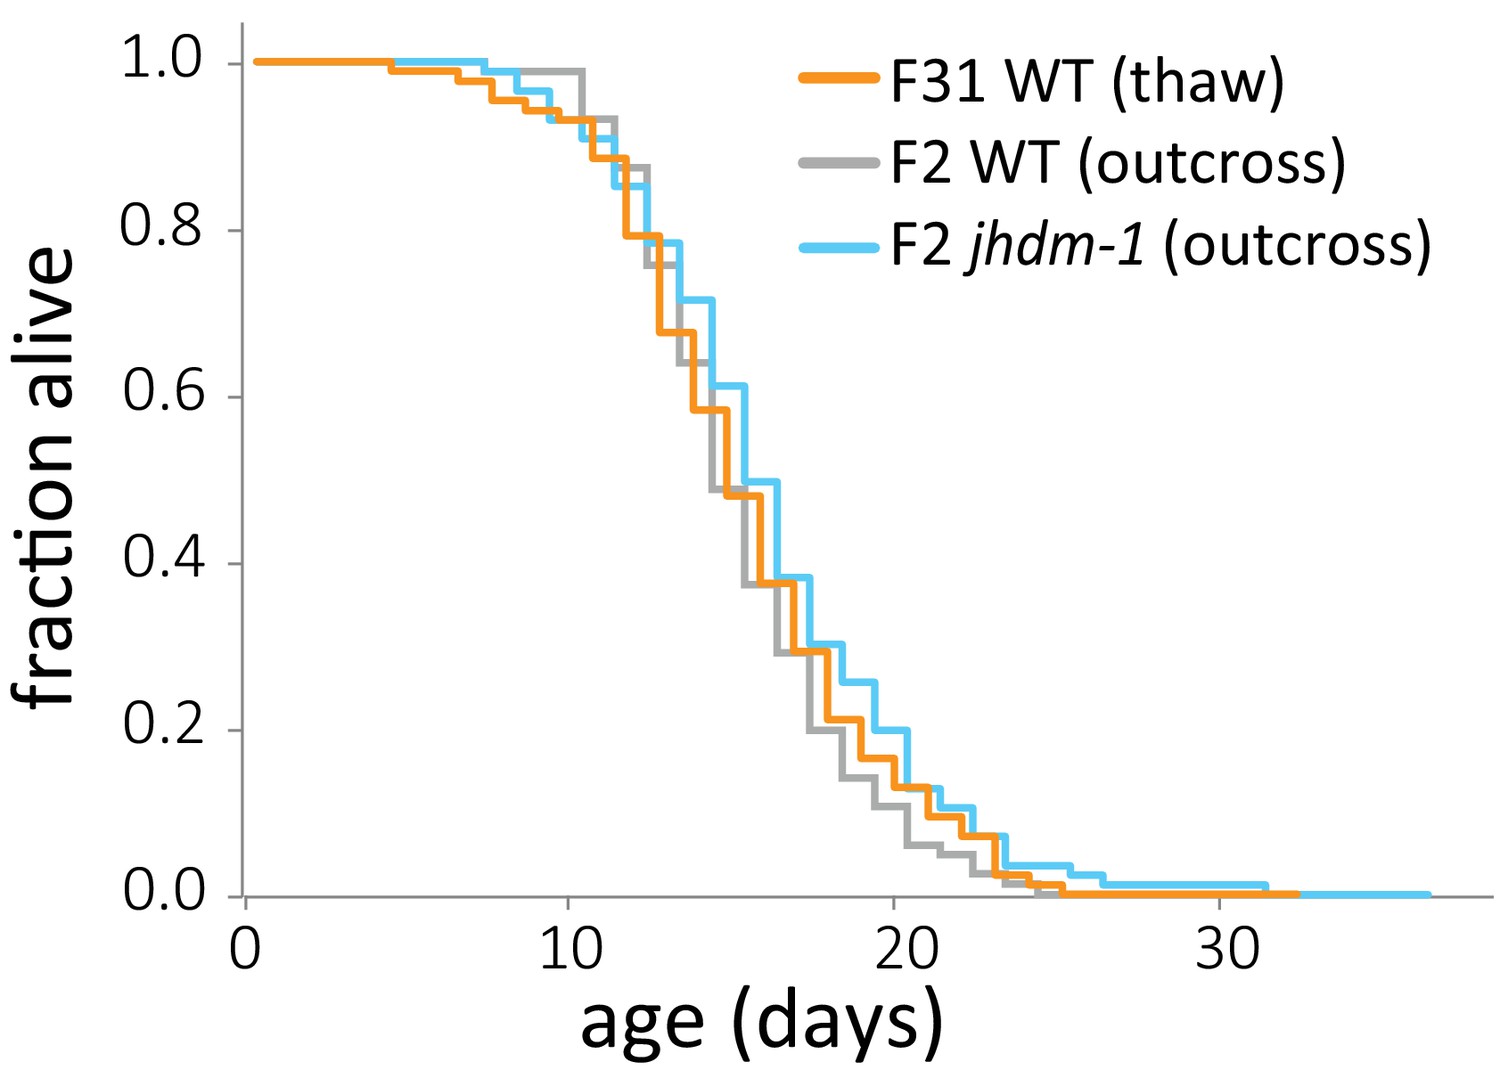
Lifespan does not differ between populations descended from the same outcross.
Lifespan of late-gen wild-type animals from a thaw (orange) compared to early-gen wild-type (gray) and jhdm-1 mutant (blue) populations, both derived from outcrossing mid-gen jhdm-1 mutants and maintaining the population as heterozygotes for five generations. Lifespan did not significantly differ, by log-rank test. Median lifespan, statistics, and additional replicates are presented in supplementary file 3.
Figure 5 with 2 supplements

H3K9me2 facilitates the inheritance of longevity by wild-type descendants.
(A, D) Genetic schemes for generating wild-type descendants from single mutants (A) or met-2 mutant descendants from long-lived wdr-5 met-2/wdr-5 + mutants (D). (B–C) Lifespan of genetically wild-type F3 (B) or F5 (C) descendants of long-lived wdr-5 mutants (WT (wdr-5), pink), compared to wdr-5 mutants (wdr-5 (wdr-5), teal)) and descendants of wild-type animals (WT (WT), gray). (E) Lifespan of F3 met-2 mutants (met-2 (‘wdr-5’), gold) and genetically wild-type mutants (WT (‘wdr-5’), purple)) descended from long-lived wdr-5 met-2/+ wdr-5 mutants compared to descendants of wild-type animals (WT (WT), gray). (F–G) Lifespan of genetically wild-type F3 (F) or F5 (G) descendants of long-lived jhdm-1 mutants (WT (jhdm-1), pink), compared to jhdm-1 mutants (jhdm-1 (jhdm-1), teal) and descendants of wild-type animals (WT (WT), gray). *p<0.05, **p<0.01 ****p<0.0001 compared to WT (WT) using log-rank test. Median lifespan and statistics are presented in supplementary file 1, with additional replicates included in supplementary file 3. (H) Fold enrichment of H3K9me2 ChIP compared to input measured by qPCR at six peaks enriched for H3K9me2 in mid-gen jhdm-1 ChIP-seq. Two ChIP replicates are shown. Samples were mixed-stage animals from wild-type descendants of wild-type animals (WT (WT), gray), F4 and F7 genetically wild-type descendants from mid-gen jhdm-1 mutants (WT (jhdm-1), dark and light pink respectively), and F4 and F7 jhdm-1 mutants descended from mid-gen jhdm-1 mutants (jhdm-1 (jhdm-1), dark and light teal, respectively). Relative DNA quantities used to calculate fold enrichment are included in supplementary file 4.
Figure 5—figure supplement 1
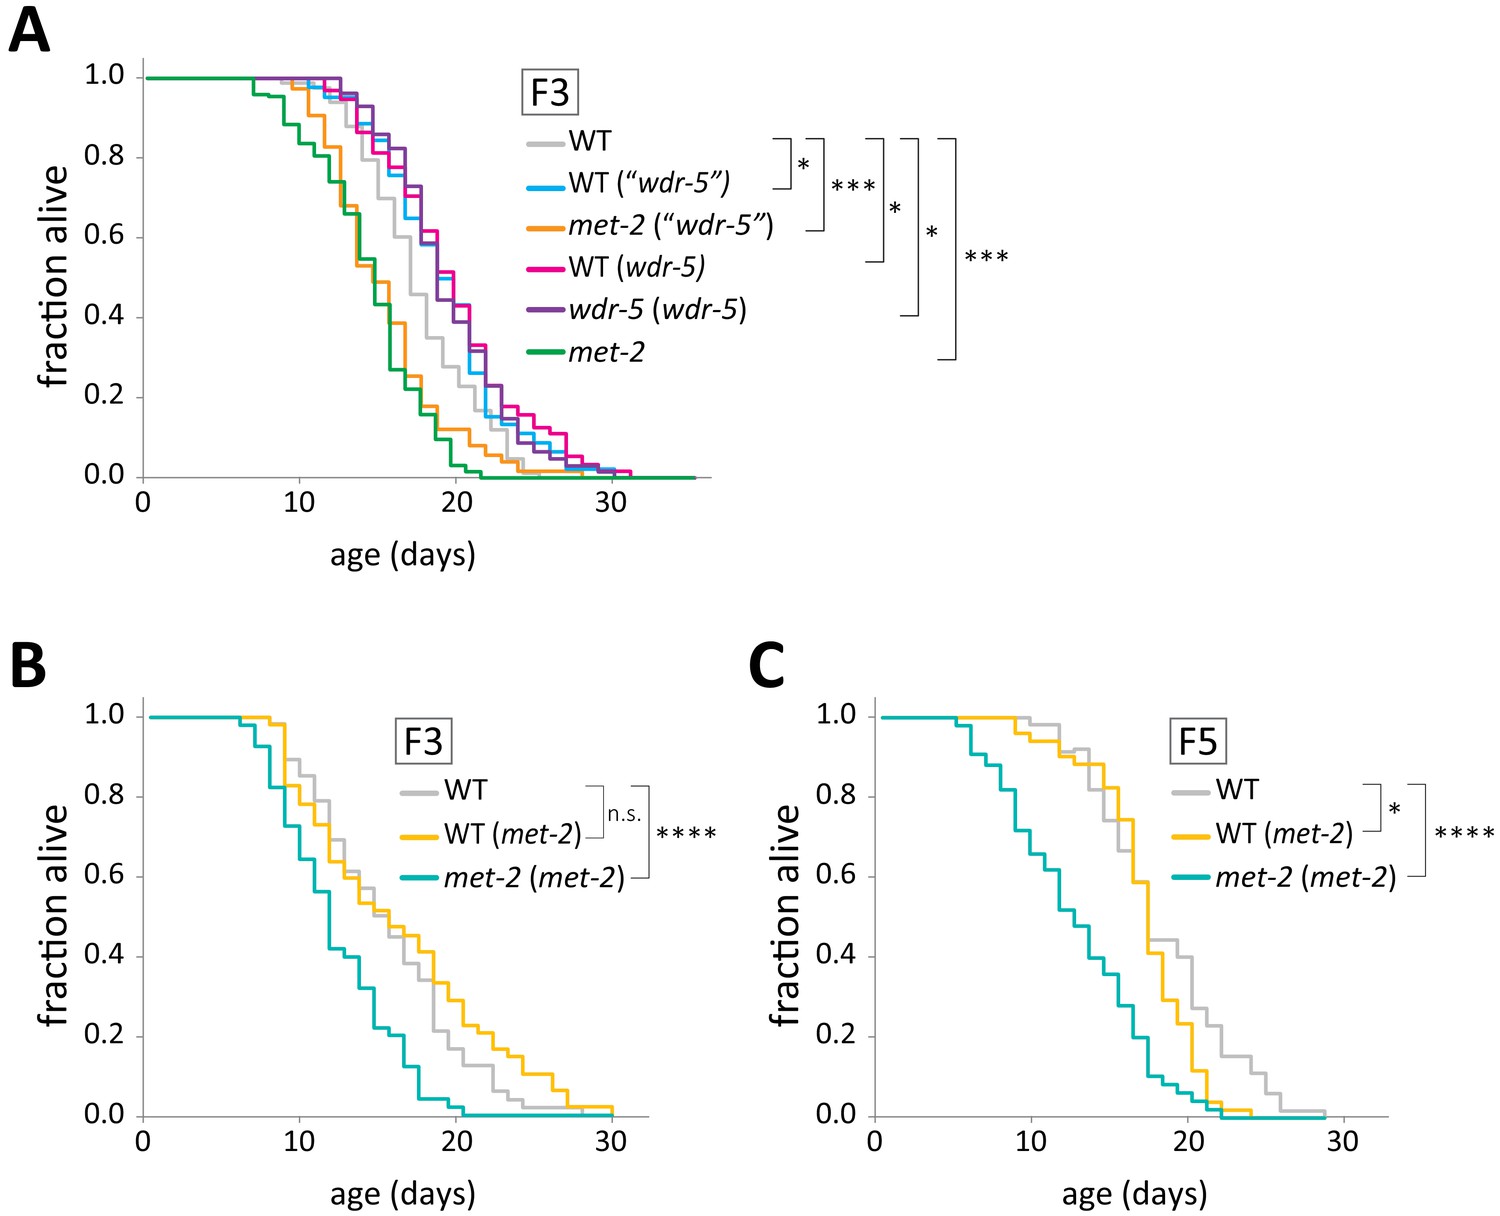
The short lifespan of met-2 mutants is not heritable.
(A) Lifespan of F3 met-2 mutants (met-2 (‘wdr-5’), orange) and genetically wild-type mutants (WT (‘wdr-5’), blue)) descended from long-lived wdr-5 met-2/+ wdr-5 mutants, as well as genetically wild-type descendants of long-lived wdr-5 mutants (WT (wdr-5) pink) and wdr-5 mutants (wdr-5 (wdr-5), purple), compared to descendants of wild-type animals (WT (WT), gray) and to late-gen met-2 mutants (green). (B–C) Lifespan of genetically wild-type F3 (B) or F5 (C) descendants of short-lived met-2 mutants (WT (met-2), gold) compared to met-2 mutants descended from the same parental population (met-2 (met-2), teal) and descendants of wild-type animals (WT (WT), gray). Genetic scheme follows that used in Figure 5A. *p<0.05, ***p<0.001, and ****p<0.0001 with log-rank test. Median lifespan, statistics, and an additional replicate for (B–C) are presented in supplementary file 3.
Figure 5—figure supplement 2
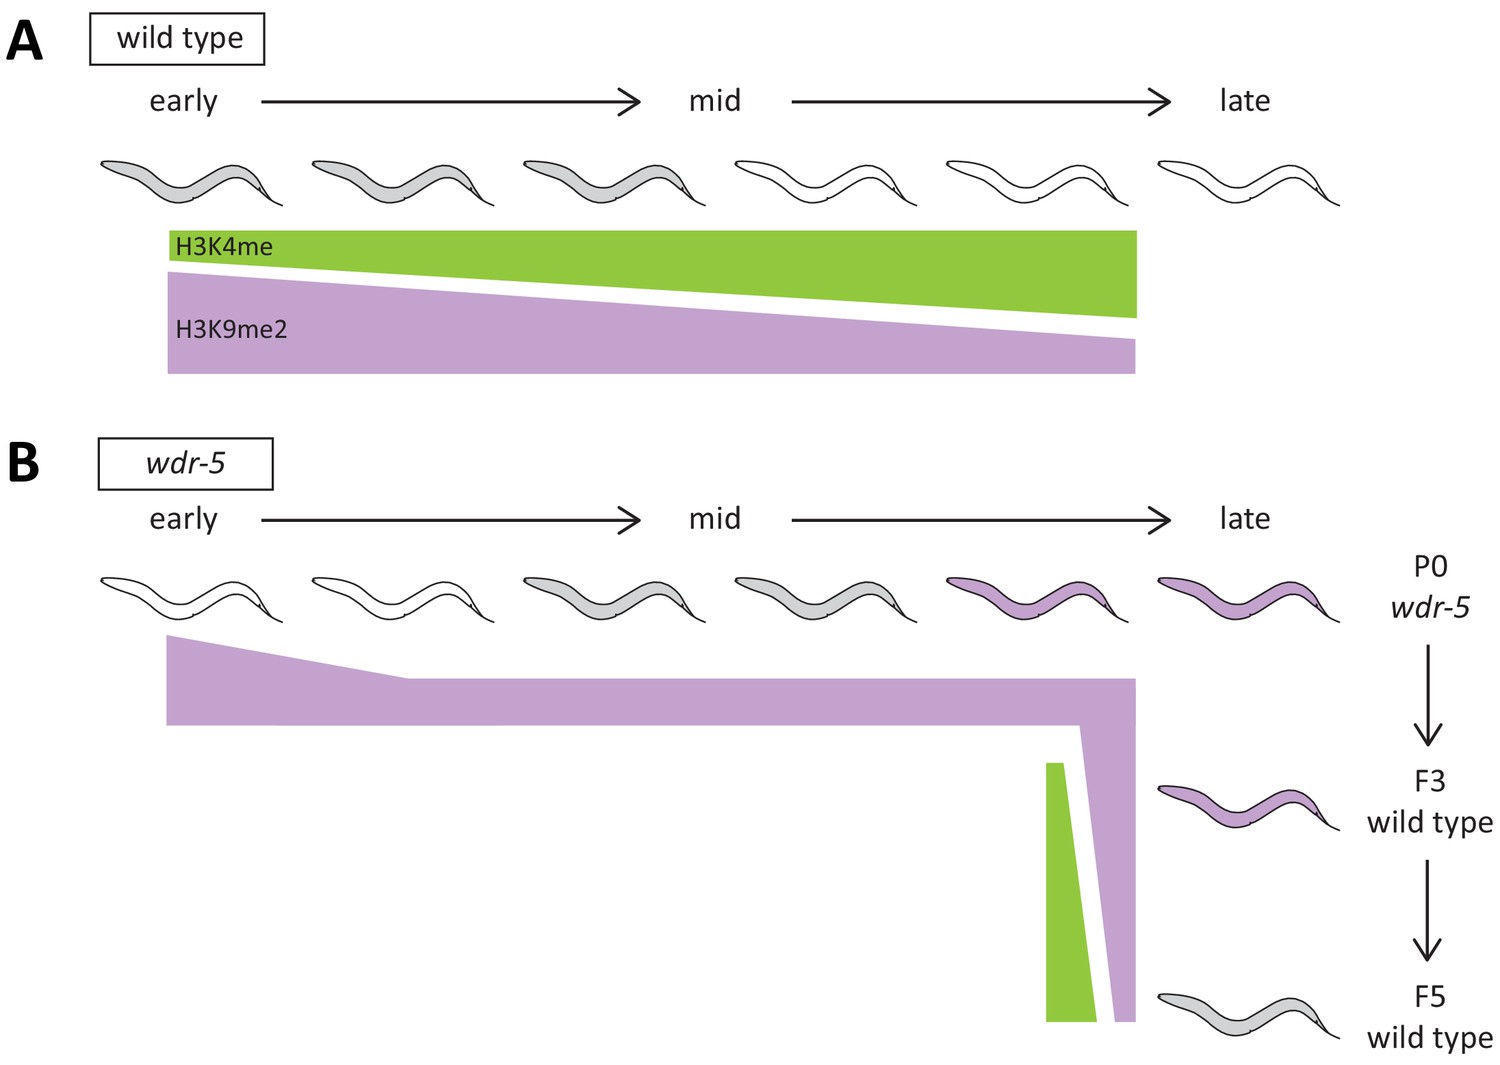
Summary figure of model.
(A–B) Representation of genomic H3K4me (green) and H3K9me2 (purple) through generational time as lifespan changes in wild type (A) or wdr-5 mutants (B). Color of animal represents lifespan: white indicates short-lived, gray indicates normal, and purple indicates long-lived. In (A), lifespan is compared to P0 wild-type animals recovered from a thaw. In (B), lifespan is compared to wild type of the same generation. After wdr-5 mutants become long-lived in late-gen populations (B), their genetically wild-type descendants inherit both elevated H3K9me2 and longevity. By the fifth generation, genomic H3K4me and H3K9me2 levels are rebalanced and lifespan reverts to normal.
Author response image 1
Tables
Key resources table
| Reagent type (species) or resource | Designation | Source or reference | Identifiers | Additional information |
|---|---|---|---|---|
| Genetic reagent (Caenorhabditis elegans, hermaphrodite) | N2 wild type | Wormbase | WB Cat# N2_(ancestral), RRID:WB-STRAIN:N2_(ancestral) | |
| Genetic reagent (C. elegans, hermaphrodite) | wdr-5 (ok1417) III | Wormbase | WB Cat# RB1304; RRID:WB-STRAIN:RB1304 | |
| Genetic reagent (C. elegans, hermaphrodite) | met-2 (n4256) III | Wormbase | WB Cat# MT13293; RRID:WB-STRAIN:MT13293 | |
| Genetic reagent (C. elegans, hermaphrodite) | jhdm-1 (ok2364) III | Wormbase | WB Cat# RB1826, RRID:WB-STRAIN:RB1826 | |
| Genetic reagent (C. elegans, hermaphrodite) | wdr-5 (ok1417) met-2 (n4256)/qC1 qIs26 [lag-2::GFP + pRF4 rol-6(su1006)] III | this paper | recombinant chromosome III isolated by crossing MT13293 and RB1304, then crossed to KW2203 to maintain over qC1 balancer | |
| Antibody | Mouse monoclonal anti-H3K9me2 | Abcam | Abcam:ab1220; RRID:AB_449854 | WB: 1:500 |
| Antibody | Mouse monoclonal anti-actin | Millipore/Upstate | Millipore:MAB1501; RRID:AB_2223041 | WB: 1:5000 |
| Antibody | rabbit polyclonal secondary anti-mouse IgG (HRP) | Abcam | Abcam:ab6728; RRID:AB_955440 | WB: 1:3000 |
| Commercial assay or kit | ECL Plus | Amersham Biosciences | Amersham Biosciences:RPN2106 | |
| Commercial assay or kit | Chromatin Immunoprecipitation Assay Kit | EMD Millipore | EMD Millipore:17–295 | |
| Commercial assay or kit | iO SYBR Green Supermix | Bio-Rad | Bio-Rad:1708882 | |
| Software | Bowtie2 | PMID: 22388286 | RRID:SCR_005476 | |
| Software | MACS v2.1.1 | PMID: 22936215 | RRID:SCR_013291 | |
| Software | deepTools2 | PMID: 27079975 | RRID:SCR_016366 | |
| Software | Integrated Genome Viewer (IGV) | PMID: 22517427 | ||
| Software | SeqPlots | PMID: 27918597 | ||
| Software | BEDtools v2.27.1 | PMID: 20110278 | RRID:SCR_006646 |
Additional files
-
Supplementary file 1
Summary statistics for lifespan data in Figures 1–5.
Shading indicates groupings of populations assessed in a single lifespan assay. Median lifespan was calculated from Kaplan-Meier survival curves and P values were calculated using a log-rank test *p<0.05, **p<0.01, ***p<0.001, ****p<0.0001. N indicates the number of observed dead animals at the end of the experiment, with the initial number of living animals indicated in parentheses. The difference corresponds to the number of individuals censored for deaths via matricide, vulval rupture, or desiccation from crawling off the plate. Figure panels for specific experiments are indicated in column 8. Replicate number is indicated in column 9.
- https://cdn.elifesciences.org/articles/48498/elife-48498-supp1-v2.xlsx
-
Supplementary file 2
Summary statistics for progeny number and embryonic lethality used in supplementary figure 2.
Percent survival was calculated from counting the number of embryos laid and the number of surviving adults. Each experiment started with at least five broods; broods were censored if mother died by matricide or vulval rupture.
- https://cdn.elifesciences.org/articles/48498/elife-48498-supp2-v2.xlsx
-
Supplementary file 3
Summary statistics for lifespan data in figure supplements and additional replicates of lifespan assays.
Shading indicates groupings of populations assessed in a single lifespan assay. Median lifespan was calculated from Kaplan-Meier survival curves and P values were calculated using a log-rank test *p<0.05, **p<0.01, ***p<0.001, ****p<0.0001. N indicates the number of observed dead animals at the end of the experiment, with the initial number of living animals indicated in parentheses. The difference corresponds to the number of individuals censored for deaths via matricide, vulval rupture, or desiccation from crawling off the plate. Figure panels for specific experiments are indicated in column 8. If data are not represented in a figure, the figure that shows its replicate is indicated. Replicate number is indicated in column 9.
- https://cdn.elifesciences.org/articles/48498/elife-48498-supp3-v2.xlsx
-
Supplementary file 4
Relative DNA quantifies of samples used to calculate fold enrichment by H3K9me2 ChIP-qPCR.
Two biological replicates of H3K9me2 ChIP were conducted for each condition (each with three technical replicates). Error shown is standard deviation of the technical replicates. Fold enrichment was calculated using the following formula: ((Ab ChIP/Ab input) / (no-Ab ChIP/no Ab input)).
- https://cdn.elifesciences.org/articles/48498/elife-48498-supp4-v2.xlsx
-
Transparent reporting form
- https://cdn.elifesciences.org/articles/48498/elife-48498-transrepform-v2.docx
Download links
A two-part list of links to download the article, or parts of the article, in various formats.
Downloads (link to download the article as PDF)
Open citations (links to open the citations from this article in various online reference manager services)
Cite this article (links to download the citations from this article in formats compatible with various reference manager tools)
Repressive H3K9me2 protects lifespan against the transgenerational burden of COMPASS activity in C. elegans
eLife 8:e48498.
https://doi.org/10.7554/eLife.48498


