Bacterial survival in microscopic surface wetness
- Hebrew University, Israel
Figures
Figure 1
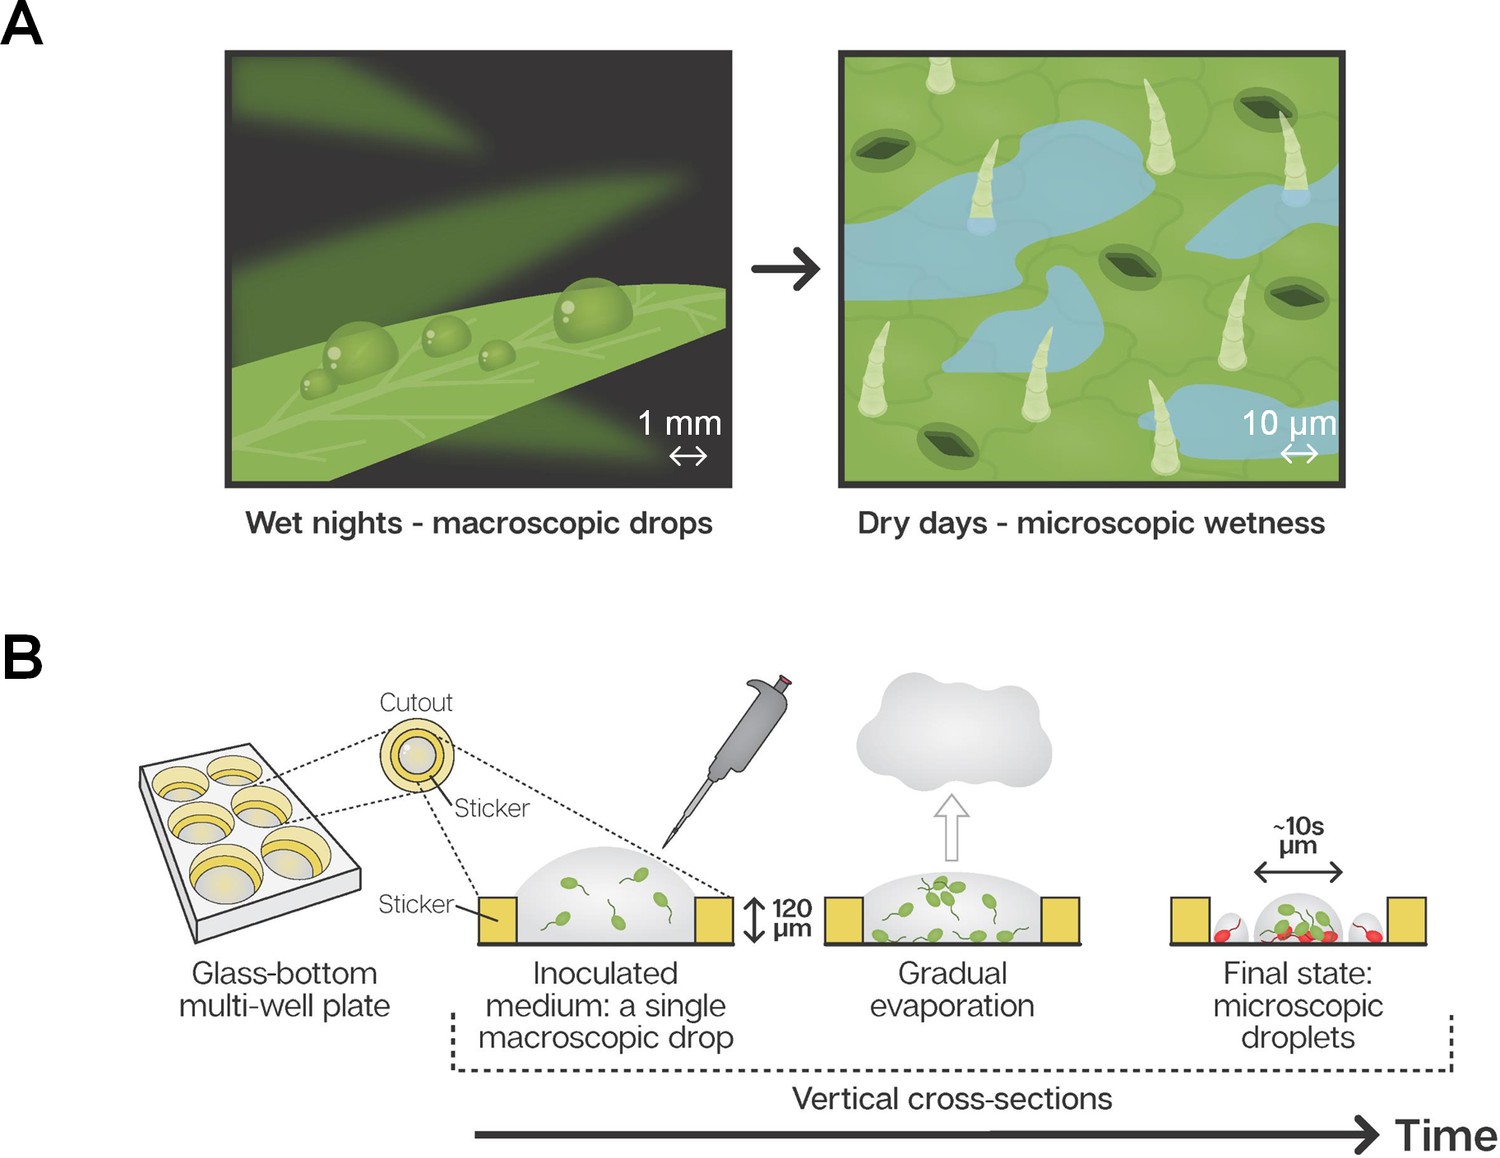
Microscopic wetness: Experimental setup.
(A) Plant leaf surfaces are usually wet at night with visible macroscopic wetness (e.g. dewdrops). During the day, leaf surfaces are typically dry, with microscopic wetness invisible to the naked eye. (B) A thin, round sticker is placed in the center of each well in a glass-bottom, multi-well plate. The hollow part of the sticker is loaded with a medium containing suspended bacteria cells. The well-plate is placed under constant temperature, RH, and air circulation. Water gradually evaporates from the medium while bacteria grow, divide, and colonize the surface of the well until the surface becomes macroscopically dry and microscopic surface wetness forms.
Figure 2 with 4 supplements
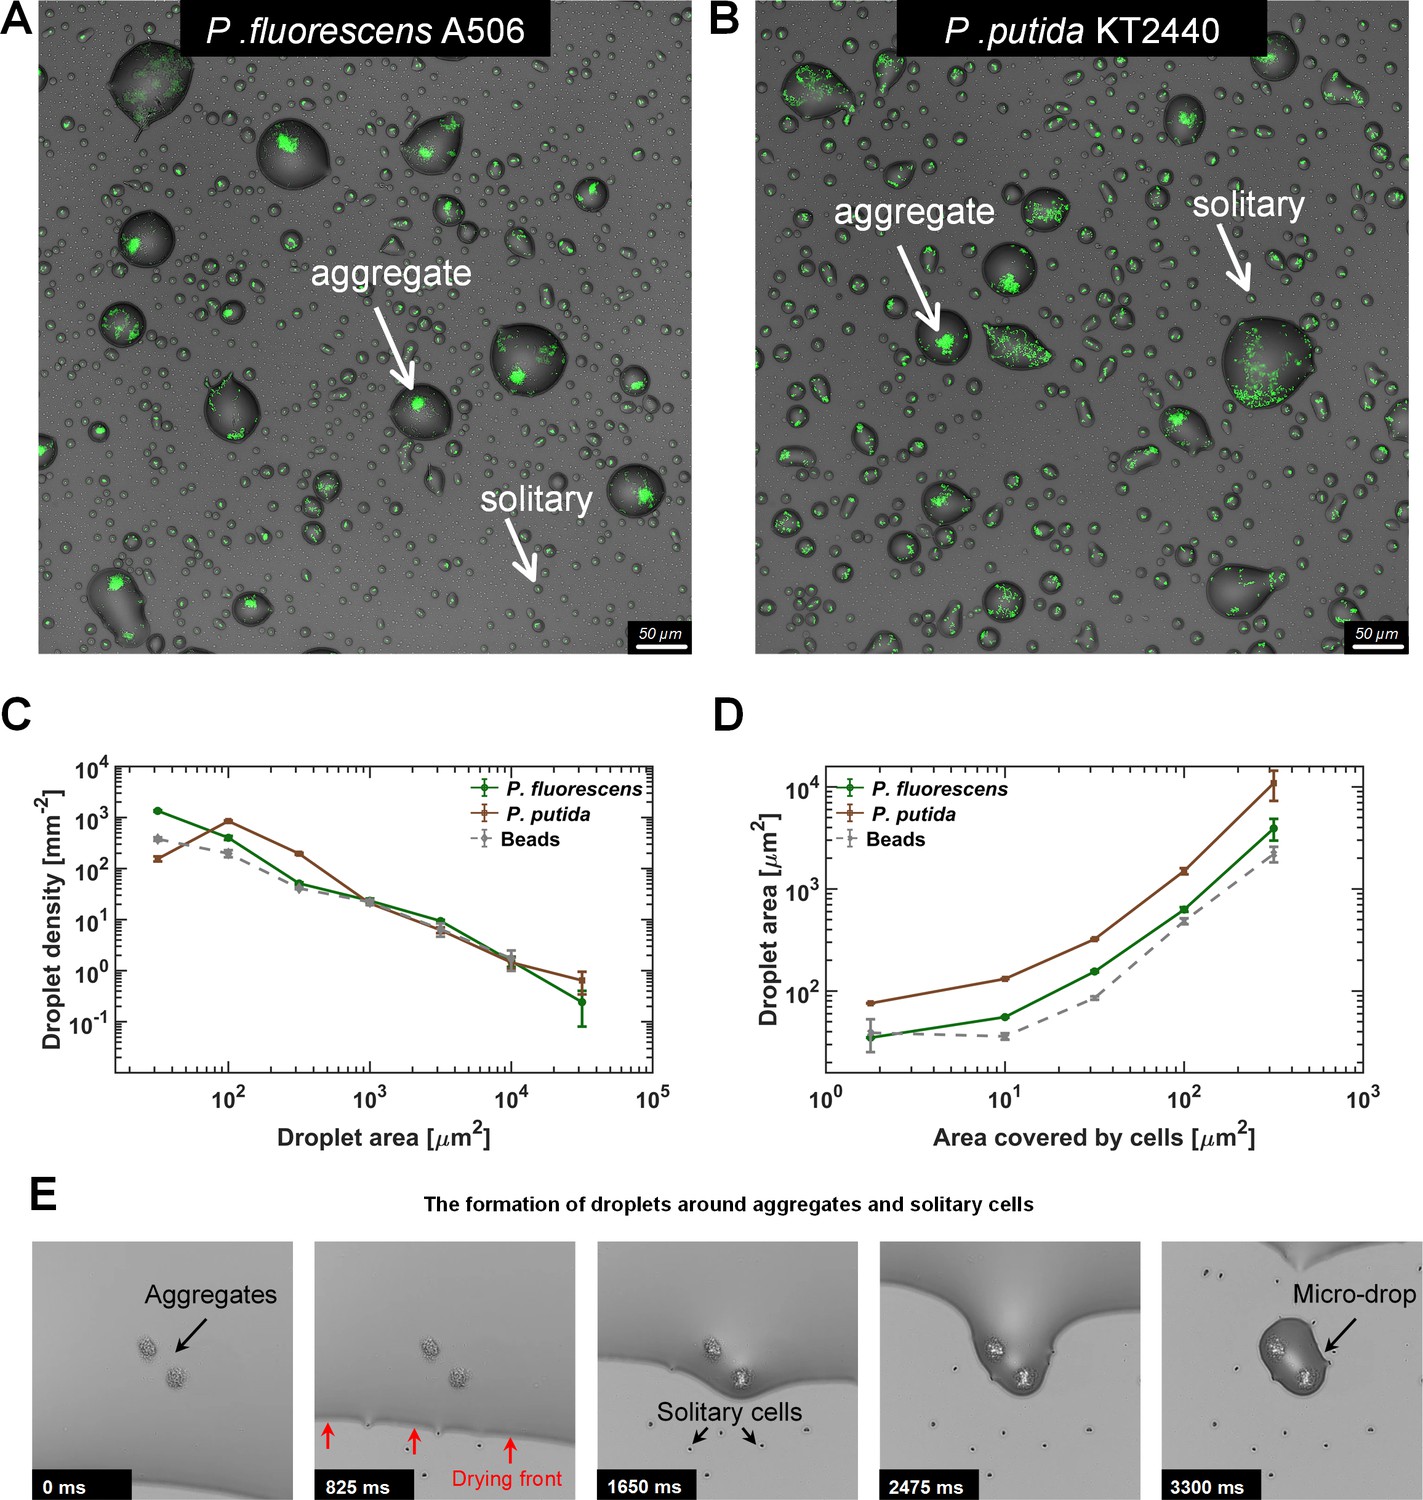
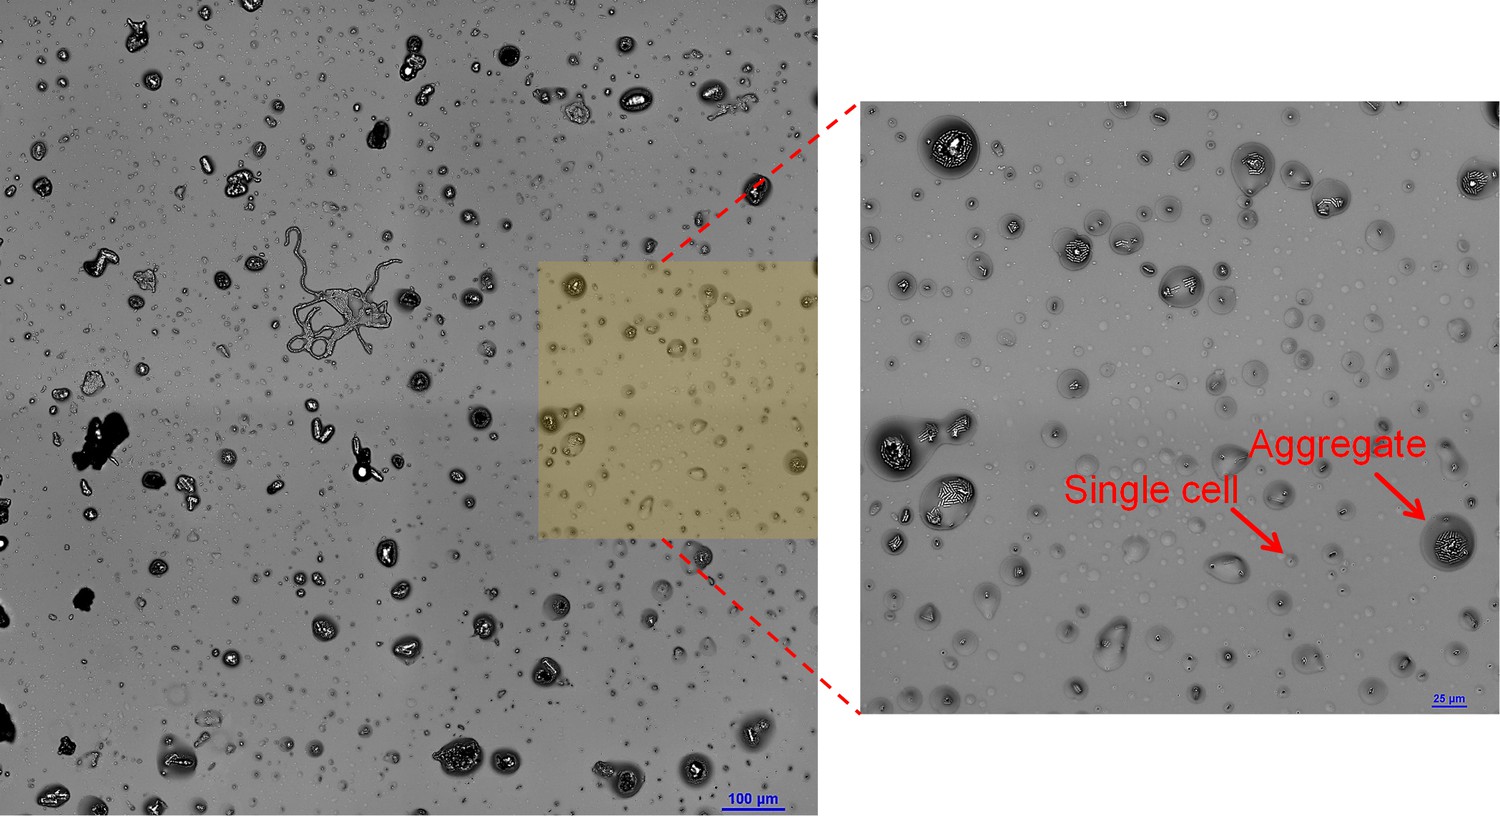
Microdroplets form around bacterial cells and aggregates.
(A–B) Representative sections of the surface imaged 24 hr after macroscopically dry conditions were established. Bacterial cells (pseudo color in green) that colonized the surface during the wet phase of the experiment are engulfed by microdroplets, while uncolonized portions of the surface appear to be dry. Solitary cells are engulfed by very small microdroplets, while large aggregates are engulfed by larger droplets (white arrows). Images show a 0.66 × 0.66 mm section from an experiment with P. fluorescens (A) and P. putida (B). (C) Droplet-size distributions at 24 hr: Droplets from both strains show power law distributions with relatively similar exponents (γ = −1.2 ± 0.15 (mean ± SEM) and −1.0 ± 0.45 for P. fluorescens and P. putida, respectively). (D) Droplet size as a function of cell abundance within the droplet (estimated by area covered by cells): Droplet size increases with cell abundance within the droplet. Error bars in (C) and (D) are standard errors. (E) A time-lapse series capturing the formation of microdroplets around bacterial aggregates: The thin (a few µms) liquid receding front clears out from the surface, leaving behind microdroplets whenever it encounters bacterial cells or aggregates (see also Videos 1–3).
-
Figure 2—source data 1
Droplet size distributions and their relation to area covered by cells.
Figure 2C: Droplet count within per mm2 of surface. Droplet count within a scale of area ranges, per mm2 of surface - mean value and standard error calculated for data groups. Raw data: Each row represents a single droplet. Droplet areas are given in μm2. 'repeat' values are the identifiers of the specific field of view. Figure 2D: Mean value and standard error of droplet area, binned by the area covered by cells within host droplet. Raw data: droplet area vs area covered by cells inside the droplet. Areas are given in μm2.
- https://doi.org/10.7554/eLife.48508.011
Figure 2—figure supplement 1

The formation of microdroplets on polystyrene substrate.
(A) Drying surface experiment with P. fluorescens on a polystyrene 6-well plate (Costar 6-well Plate, Corning). Representative sections of the surface imaged 48 hr after macroscopically dry conditions were established. Solitary cells are engulfed by small-size droplets, while aggregates are found in larger droplets. (B) Same as in (A) but with P. putida.
Figure 2—figure supplement 2
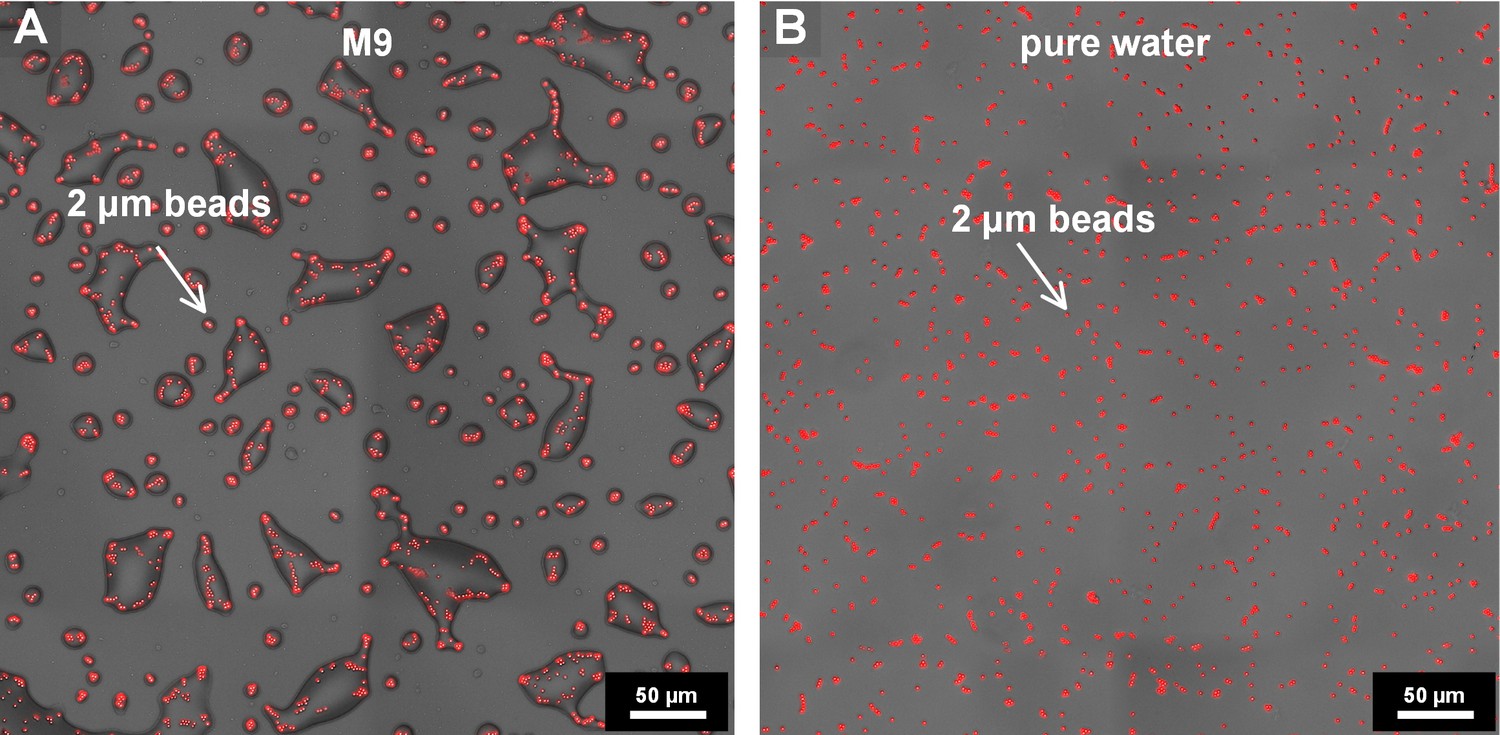
Drying surface experiment with fluorescent beads (2 μm in diameter).
(A) Drying experiments were performed under same conditions as the experiments with bacteria (M9 diluted 0.5x, 28°C, 85% RH; see Materials and methods). (B) Drying experiment with fluorescent beads suspended in pure water (28°C, 85% RH). In the absence of deliquescent substrates, no droplets formed.
Figure 2—figure supplement 3
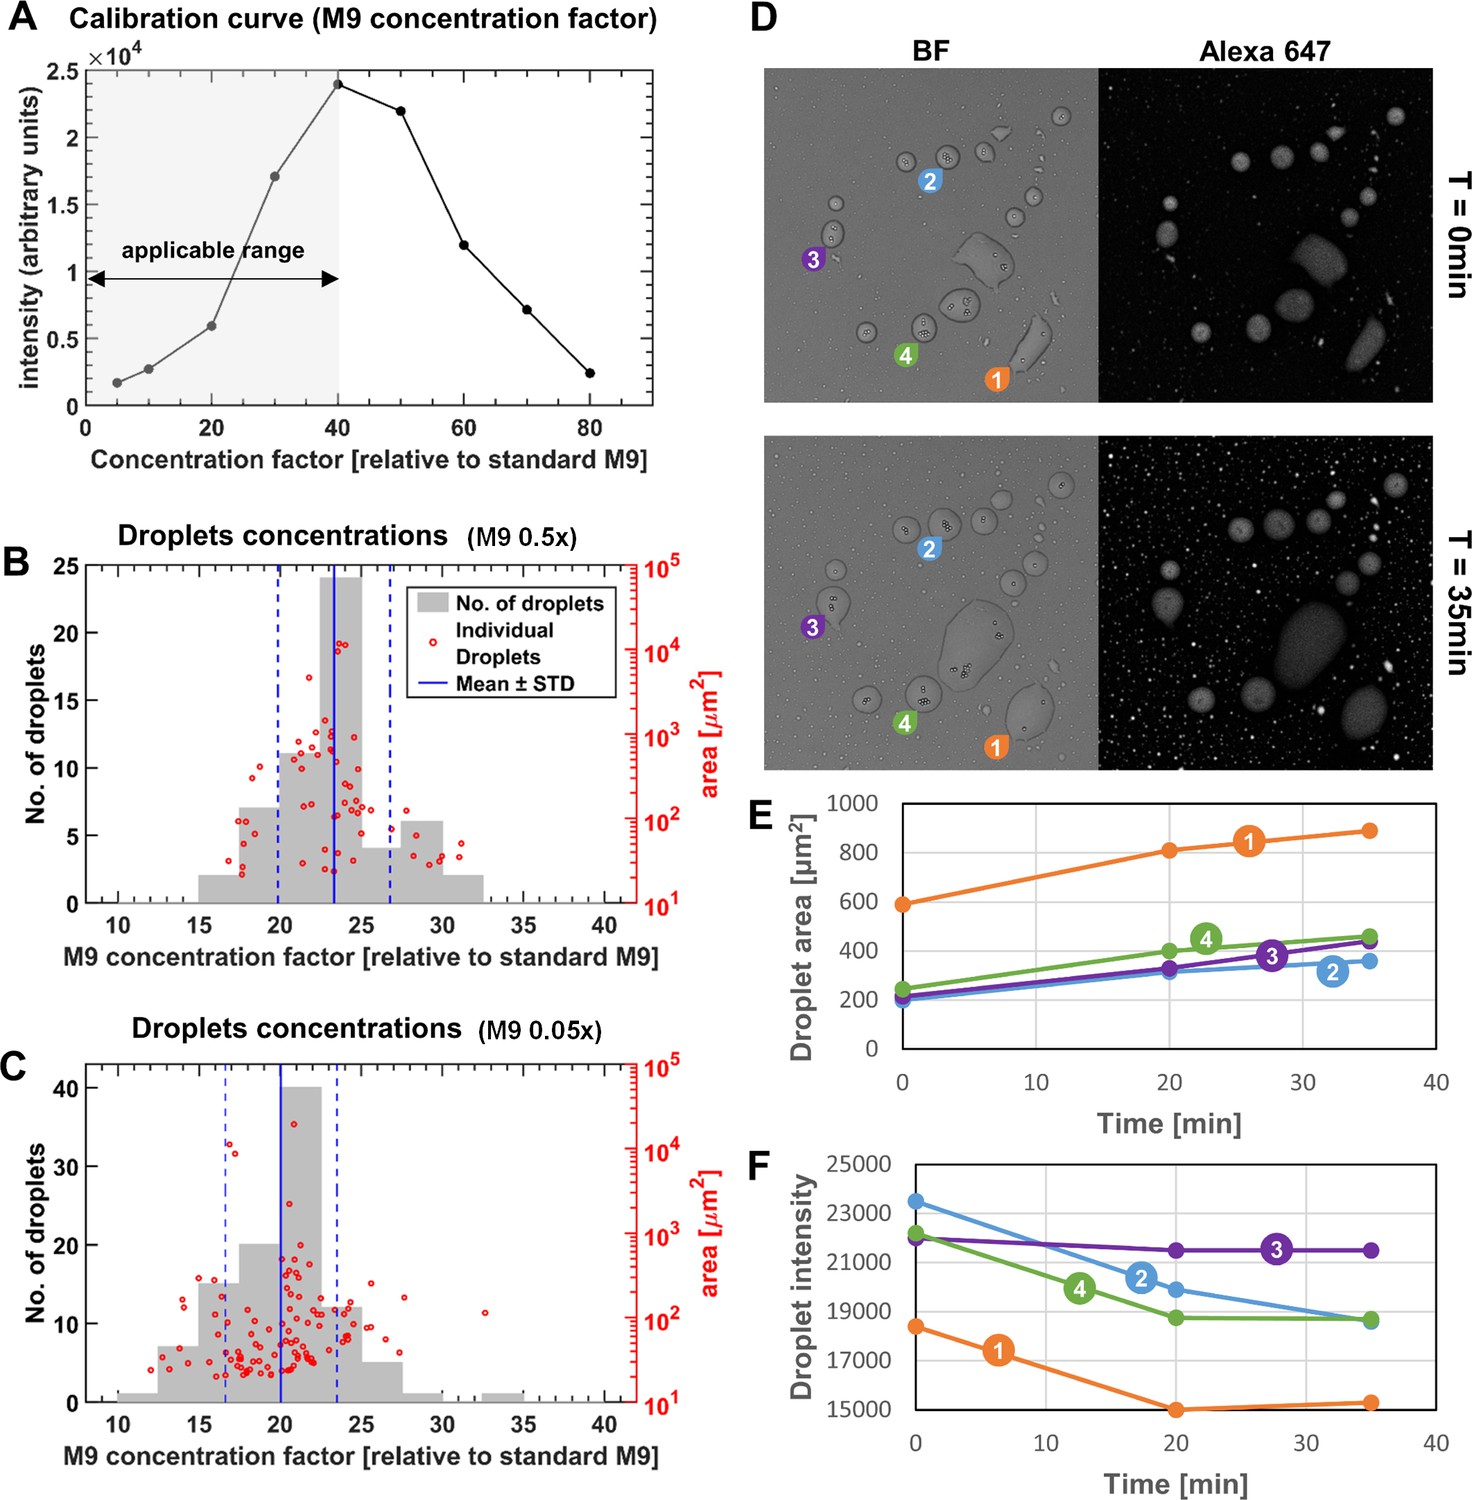
Estimating the solute concentrations in microdroplets in comparison to standard M9 medium.
(A) In order to estimate the solute concentrations in the microdroplets, several drops of M9 medium concentrated to known ‘concentration factors’ (relative to standard M9) were imaged by a confocal microscope, and their mean intensities were measured (see Materials and methods). The relationship between the drop concentration and fluorescence intensity constituted the calibration curve. (B–C) Microdroplet concentration factor was estimated by extracting the mean intensity of the microdroplets formed on a drying surface with beads, and interpolating the corresponding M9 concentration factors. The concentration factor and area of the individual microdroplets are shown as red circles; the concentration factor’s histogram is shown in gray bars. (B) Initial medium was half-strength M9 (diluted 0.5x), similarly to the experiments presented in Results. Microdroplet concentration factor was 23.3 ± 3.5 (Mean ± SD) relative to standard M9. Pearson correlation coefficient of droplet area and concentration is 0.005 (p-value=0.97). (C) Initial medium was 0.05x diluted M9. Microdroplet concentration factor was 20.0 ± 3.4 (Mean ± SD) relative to standard M9. Pearson correlation coefficient of droplet area and concentration is 0.05 (p-value=0.64). (D–F) The M9 calibration curve in (A) is not monotonous over the entire concentration factor range, and changes from increasing intensities for concentration factors < 40, to decreasing at >40 (likely due to one or more of the medium substrates that affect fluorescence intensity). The appropriate range for calibration was determined by testing whether the intensity increases or decreases following induced changes to concentration factors. To that end, stable microdroplets that formed at 85% RH were placed under higher RH conditions (~95%). (D) Bright field and Alexa fluorescence images at t = 0 and t = 35 min following raise in RH. Four droplets (marked by numbers 1 to 4) at t = 0, 20, 35 min after the change in RH. (E) Microdroplet areas (and presumably volumes) increased by absorbing water from the environment, and (F) Microdroplet mean intensities decreased (line colors match the microdroplet tags in (D)). This result indicates that, at these settings, correlation between intensities and concentration is positive, in turn indicating that the appropriate calibration range is for concentration factors below 40, relative to standard M9.
-
Figure 2—figure supplement 3—source data 1
M9 calibration: relation between concentration factor relative to standard M9 vs intensity.
M9 0.5x, M9 0.05x: distribution of droplets' concentration (for corresponding initial concentration). Raw data: concentration factor vs area [um^2] for all droplets.
- https://doi.org/10.7554/eLife.48508.008
Figure 2—figure supplement 4
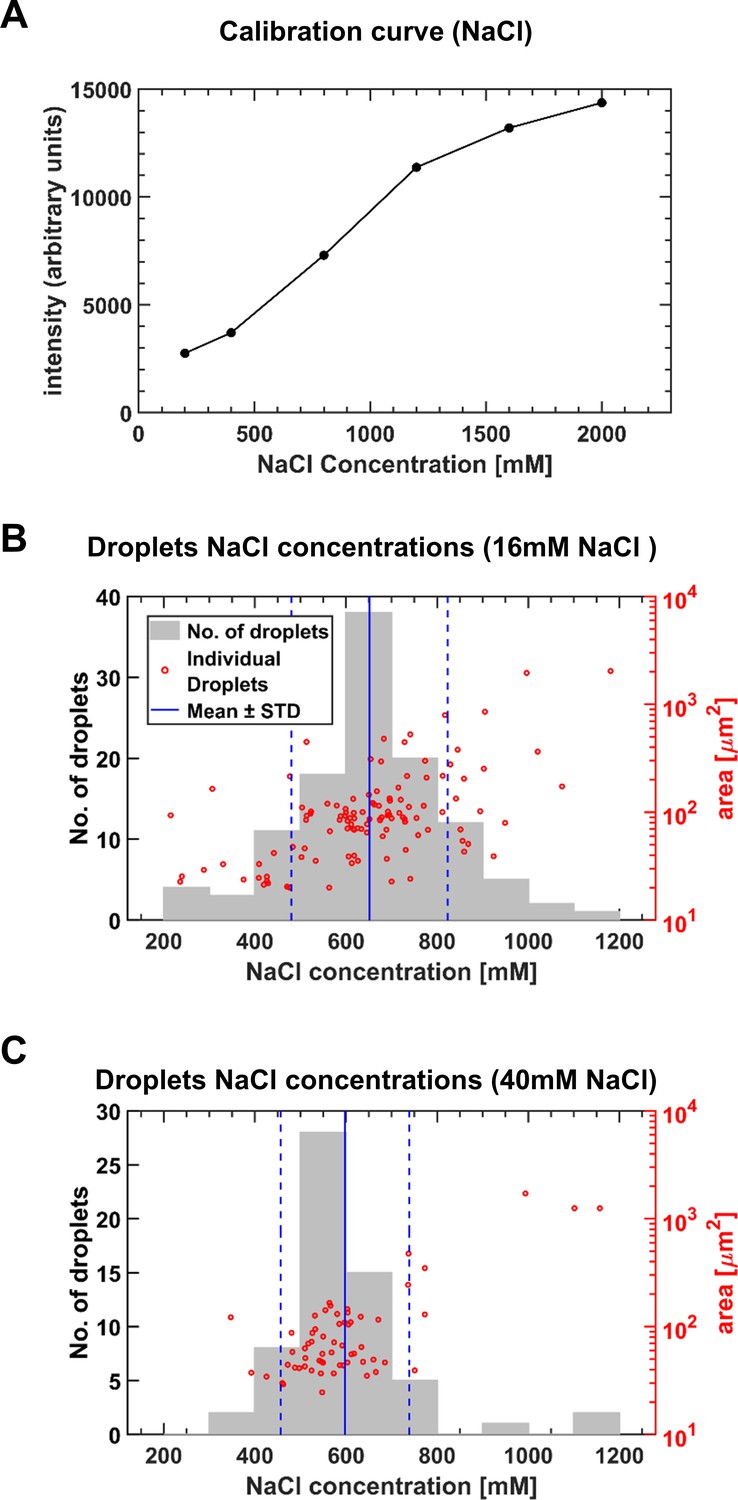
Estimating NaCl concentrations in microdroplets (medium containing diH2O + NaCl only).
(A) In order to estimate the concentration of NaCl in the microdroplets, several drops of known NaCl concentrations were imaged by a confocal microscope, and their mean intensity was measured (see Materials and methods). The relationship between the drop concentration and fluorescence intensity constituted the calibration curve. (B–C) Microscopic droplet concentration factor was estimated by extracting the mean intensity of the microdroplets formed on a drying surface with beads, and interpolating the corresponding NaCl concentration. The concentration factor and area of the individual droplets are shown as red circles; the concentration factors histogram is shown in gray bars. (B) Initial NaCl medium concentration was 16 mM. NaCl concentrations in microdroplets was 650 ± 170 mM (Mean ± SD). Pearson correlation coefficient of microdroplet area and concentration was 0.47 (p-value<0.01). (C) Initial NaCl concentration was medium was 40 mM. NaCl concentrations in microdroplets was 600 ± 140 mM (Mean ± SD). Pearson correlation coefficient of microdroplet area and concentration is 0.8 (p-value<0.01). These results were in contrast to the lack of concentrations <>area correlations in experiments with M9. Further research is required to understand what factors determine these differences in correlations.
-
Figure 2—figure supplement 4—source data 1
NaCl calibration: relation between concentration [mM] vs intensity.
NaCl 16 mM, NaCl 40 mM: distribution of droplets' concentration (for corresponding initial concentration). Raw data: concentration [mM] vs area [um^2] for all droplets.
- https://doi.org/10.7554/eLife.48508.010
Figure 3 with 5 supplements
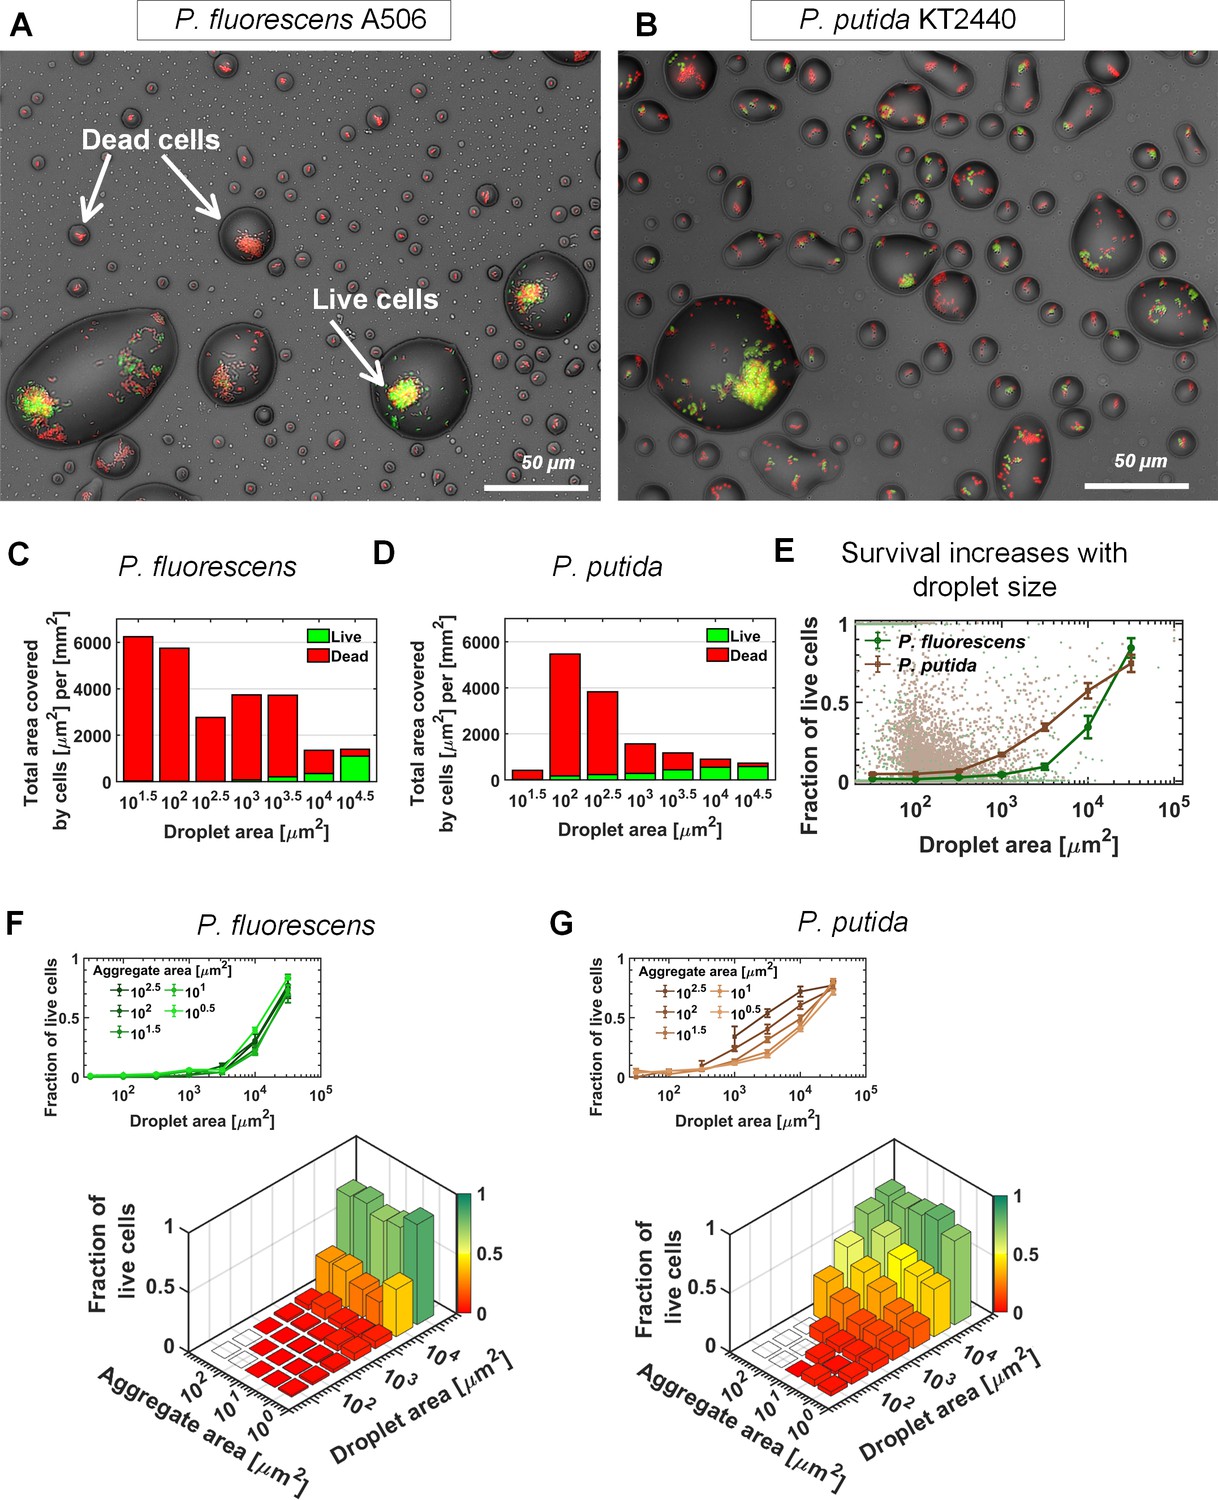
Bacterial survival increases with droplet size.
(A–B) A section of the surface covered with droplets (experiment with P. fluorescens (A) and P. putida (B), 24 hr after macroscopic drying): Live cells are green, and dead cells (cells with damaged membrane) are red. Live cells were mostly observed in large droplets. (C–D) P. fluorescens (C) and P. putida (D) cell distributions, binned by droplet size: The green and red colored bars indicate the fraction of live and dead cells respectively. (E) Fraction of live cells as a function of droplet size. Survival rate increases with droplet size in both studied strains. Error bars represent standard errors. Each dot in the background represents a single droplet. (F) P. fluorescens survival rates as a function of aggregate size and droplet size: The height of the bars indicates all cellular-object (aggregates or solitary cells) mean survival rates within a given bin of aggregate and droplet size. The inset above shows the same data, but presented differently, with each line representing an aggregate-size bin. Note that there is no pronounced difference between lines, indicating that aggregate size has only minor effect on P. fluorescens survival. (G) Same as (F) but for P. putida: Note the pronounced difference between lines, indicating that aggregate size contributes to P. putida’s survival (larger aggregates have higher survival); yet droplet size contributes to survival more profoundly than does aggregation (see also Figure 3—figure supplement 3).
-
Figure 3—source data 1
Survival rates and their relation to droplet and aggregate size.
Figure 3C: Total area covered by cells per mm2, binned by host droplet area. Raw data: droplet area [μm2] vs total live cell area [μm2] and total dead cell area [μm2] for P. fluorescens Figure 3D: Total area covered by cells per mm2, binned by host droplet area. Raw data: droplet area [μm2] vs total live cell area [μm2] and total dead cell area [μm2] for P. putida Figure 3E: Mean survival and standard error of survival rates within droplets, binned by host droplet area. Raw data: droplet area μm2] vs total live cell area μm2] and total dead cell area μm2] for P. fluorescens, P. putida Figure 3F: Mean survival and standard error of P. fluorescens survival rates within aggregates, binned by host droplet area and aggregate area. Raw data: survival rate vs droplet area vs aggregate area for P. fluorescens Figure 3G: Mean survival and standard error of P. putida survival rates within aggregates, binned by host droplet area and aggregate area. Raw data: survival rate vs droplet area vs aggregate area for P. putida. All droplets and aggregates areas are in [μm2].
- https://doi.org/10.7554/eLife.48508.024
Figure 3—figure supplement 1
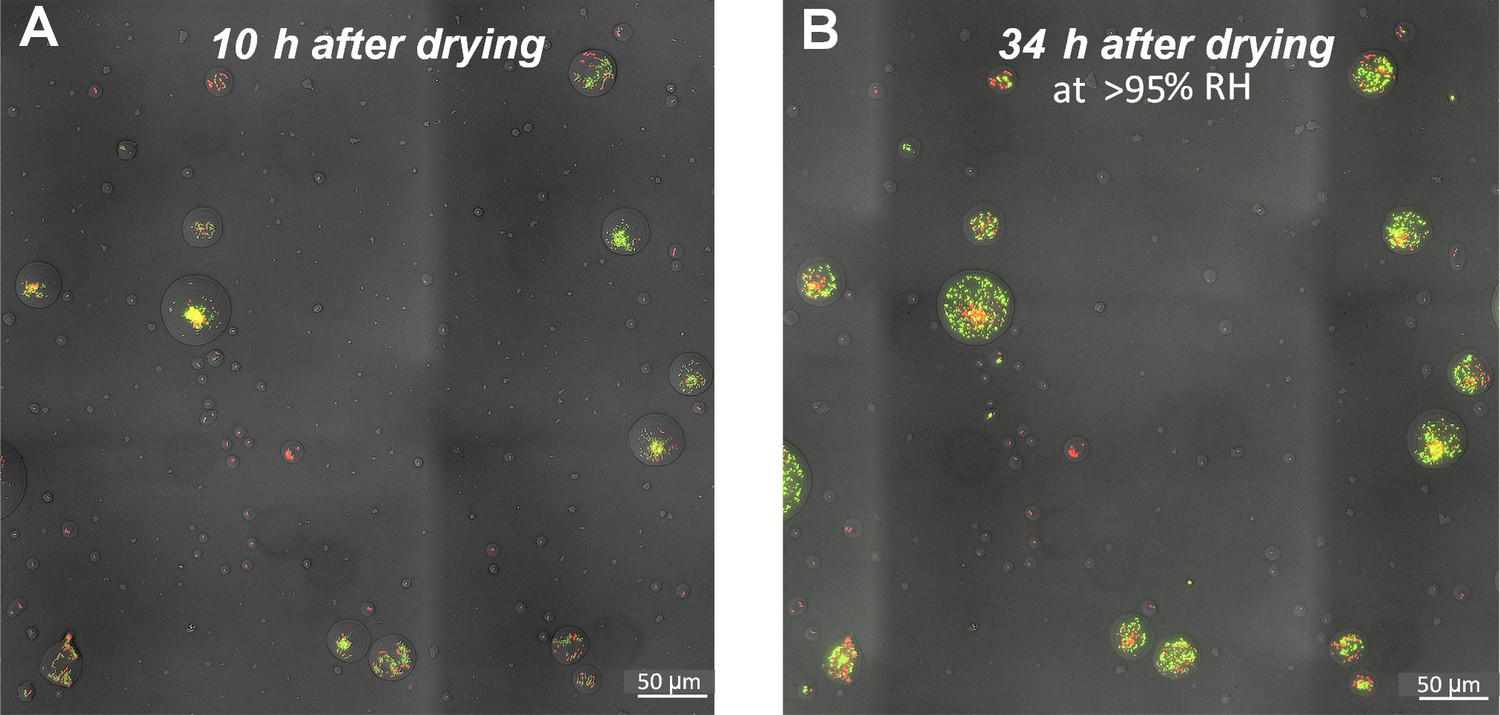
Viability of cells within microdroplets.
(A) A section of the surface covered with droplets (experiment with P. fluorescens, 10 hr after macroscopic drying 28°C, 70% RH). Live cells are green; dead cells (cells with damaged membranes) are red. Live cells were mostly observed in large droplets. (B) Same section of the surface 34 hr after drying, incubated at 28°C, >95% RH. Red cells in small droplets remain red (dead), while green cells within large droplets disperse (within the droplet boundaries) and divide (though slowly – division time was 23 hr ± 2).
Figure 3—figure supplement 2
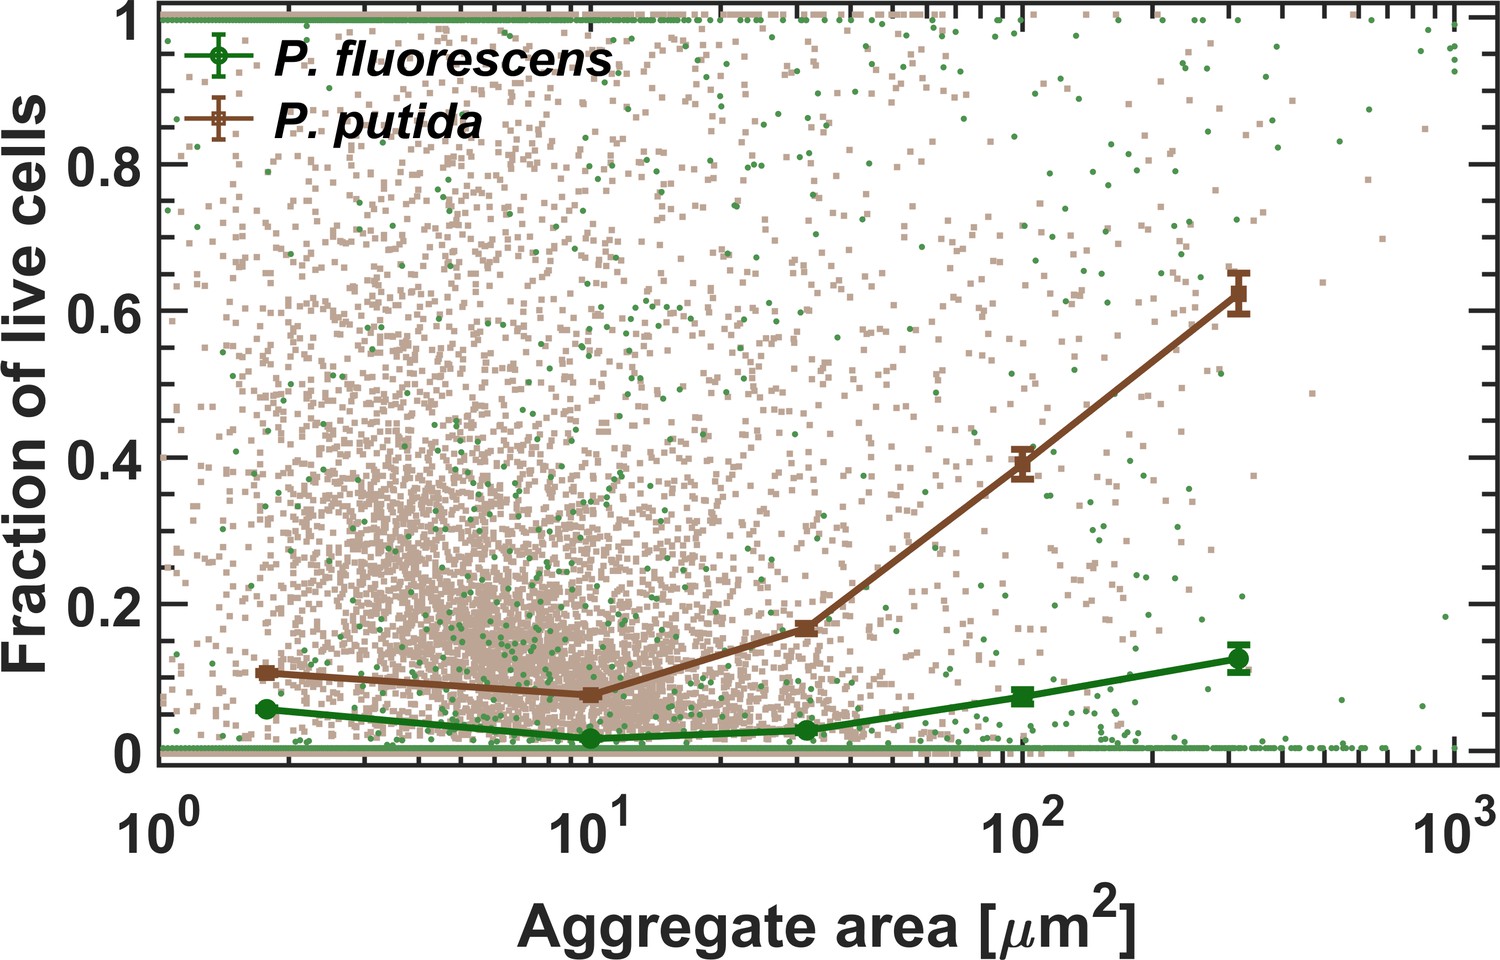
Survival as a function of aggregate size.
Survival rate increases with aggregate size in both studied strains. Standard errors are calculated for all aggregates within each bin (size range of aggregates) of the combined data of the five surface sections (each of an area = 2.5 mm2). Each dot in the background represents a single aggregate (solitary cells are aggregates of size ~1–2 μm2).
-
Figure 3—figure supplement 2—source data 1
Mean survival and standard error of survival rates within aggregates, binned by aggregate area.
Raw data: Aggregate area (in μm2) vs survival rate for P. fluorescens, P. putida.
- https://doi.org/10.7554/eLife.48508.018
Figure 3—figure supplement 3
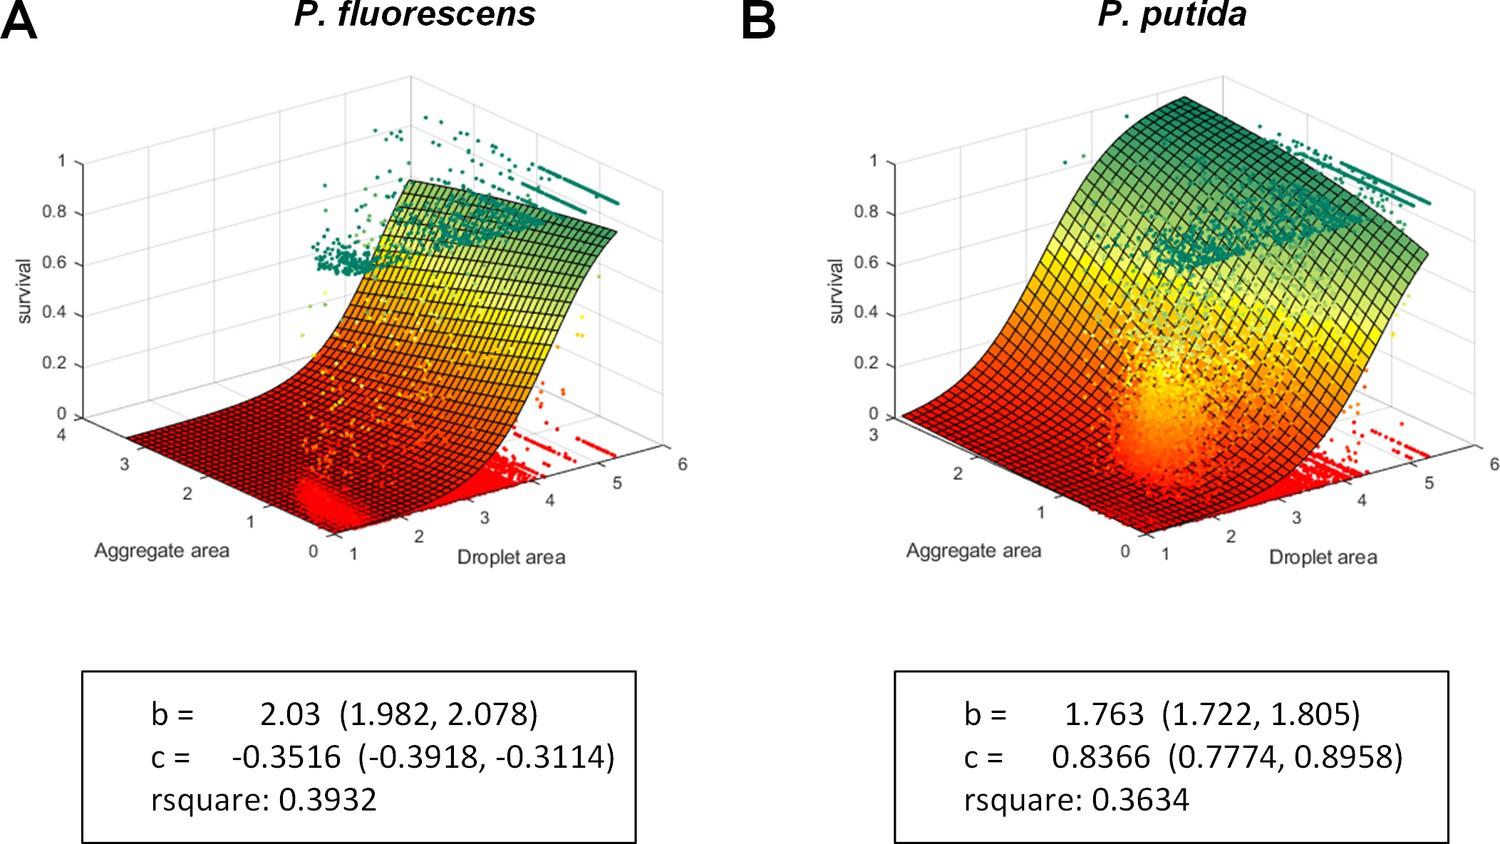
Multinomial logistic regression model.
Multinomial logistic regression model was fitted to the data. Each data point is an aggregate. The model is defined as z = 1/(1+exp(a - b*x - c*y)) where x is log10(host droplet size), y is log10(aggregate size), and z is survival rate within the aggregate. The fitted points were weighted by the relative area of the aggregate, in order to approximate the distribution of cells. The model is fitted by MATLAB’s Fit function. It can be seen via the fitted model outputs that droplet size had a larger coefficient (in absolute values) than did aggregate size for both strains, indicating that droplet size contributes more to survival.
Figure 3—figure supplement 4
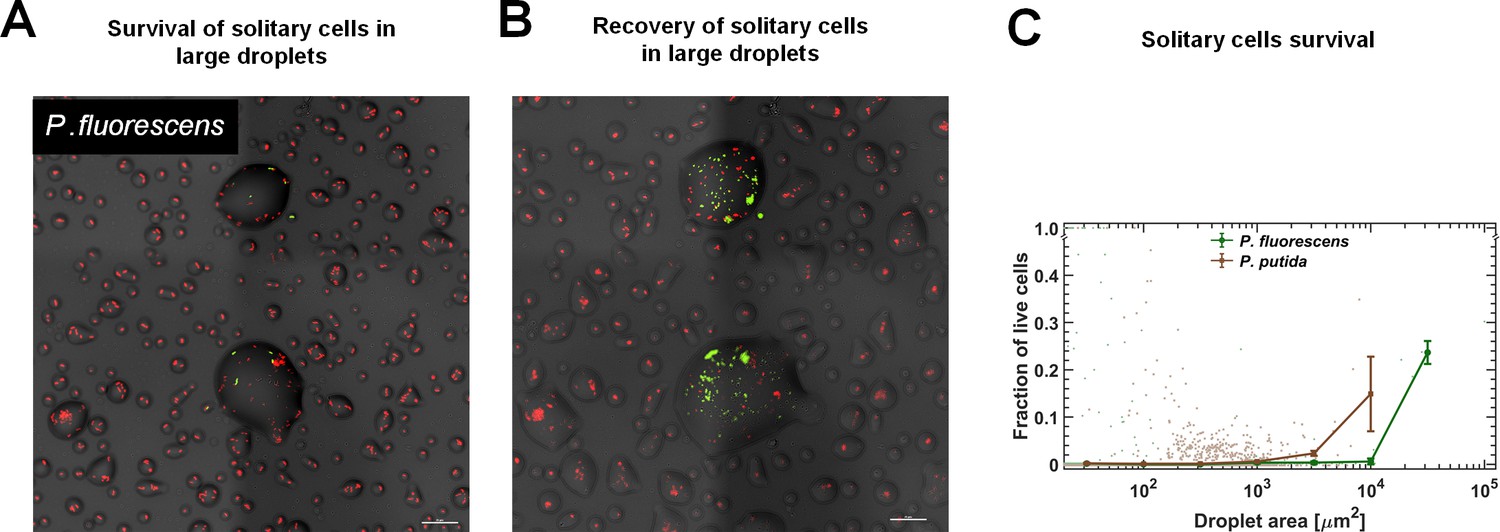
Survival rate of solitary cells increases with droplet size.
In this experiment, cells were inoculated at a later stage, close to macroscopic drying (at time = 10 hr from the beginning of the experiment), and thus did not have enough time to form large aggregates. (A) A section of the surface covered with droplets (experiment with P. fluorescens, 24 hr after macroscopic drying). Live cells are green and dead cells (cells with damaged membranes) are red. (B) The same section of the surface following another 30 hr at high RH (~95%). Cell recovery was mostly observed in large droplets. (C) Survival rate of solitary cells (of both strains) increases with droplet size. Note that overall survival in these experiments was much lower than in the original experiment, pointing to the contribution of aggregation (or self-organization in general) and/or physiological acclimation to overall survival. Standard errors are calculated for all aggregates within each bin of the combined data of the five surface sections (each of an area = 2.5 mm2).
-
Figure 3—figure supplement 4—source data 1
Mean survival and standard error of survival rates within droplets, binned by host droplet area.
Raw data: droplet area (in μm2) vs survival rate for solitary P. fluorescens, solitary P. putida.
- https://doi.org/10.7554/eLife.48508.021
Figure 3—figure supplement 5
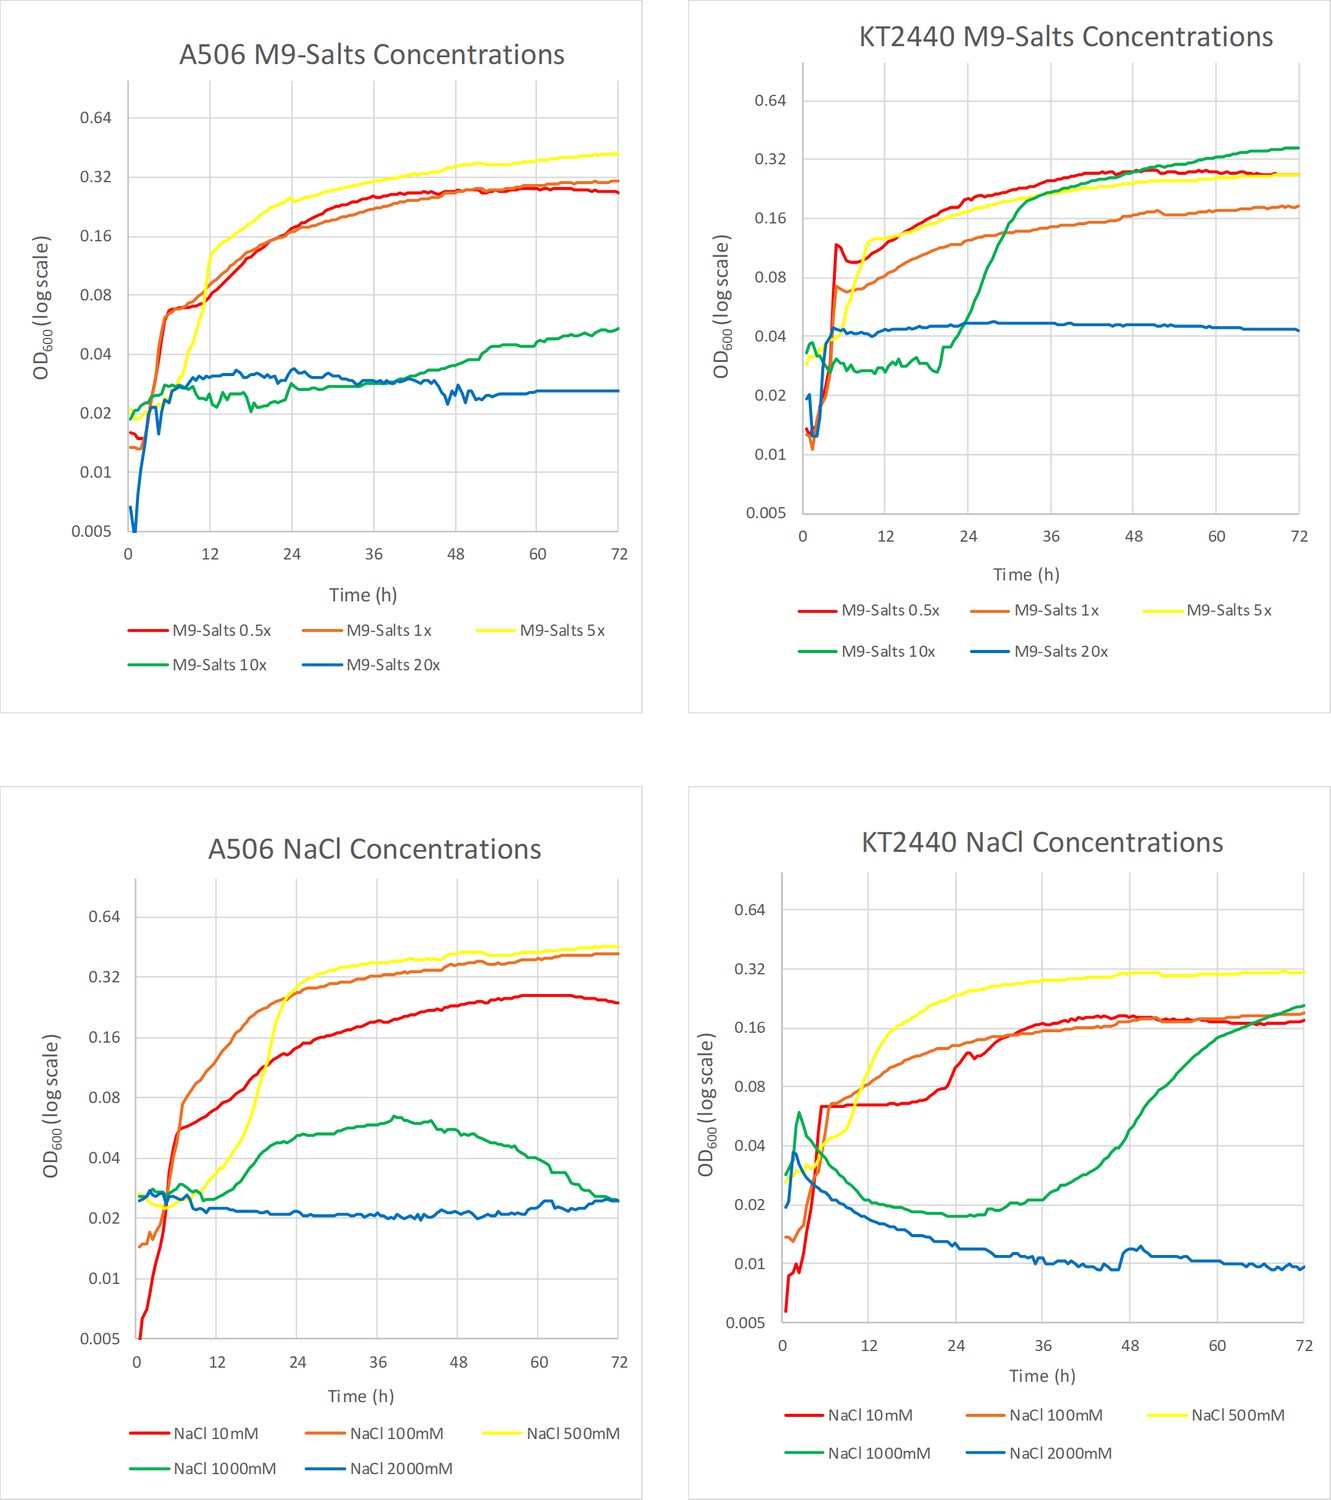
Growth curves of P. fluorescens A506 and P. putida KT2440 under various M9 dilutions/concentrations and under various NaCl concentrations.
A 50x M9 medium (2385 mM Na2HPO4, 1100 mM KH2PO4, 427.75 mM NaCL, 935 mM NH4Cl, 100 mM MgSO4, 10 mM CaCl2) was prepared and diluted to the following concentrations; 40x, 30x, 20x, 10x, 5x, 1x, 0.5x. A final concentration of 2 mM glucose was added to each dilution. No growth was observed at 30x, 40x M9 (data not shown). For the experiment with NaCl concentrations, an M9 1x (47.7 mM Na2HPO4, 22 mM KH2PO4, 8.55 mM NaCL, 18.7 mM NH4Cl, 2 mM MgSO4, 0.2 mM CaCl2) was prepared with NaCl added to the following final concentrations: 2000 mM, 1000 mM, 500 mM, 100 mM, 10 mM. A final concentration of 2 mM glucose was added to each dilution. P. fluorescens A506 YFP and P. putida KT2440 YFP were grown overnight in LB gen 30µg/ml at 28°C, 300 RPM. 3 mL LB gen 30µg/ml was inoculated with 100μls of the overnight stock and grown until OD ~1.0. The bacteria were centrifuged, resuspended in DiH20, and diluted 1:20 once loaded into the 96-well plate. There were triplicates of each condition for A506 YFP and KT2440 YFP, and duplicates for the controls. Estimated growth rates, lag times, and maximal OD, based on the growth curves, are shown in Supplementary file 2.
-
Figure 3—figure supplement 5—source data 1
Growth curves for P. fluorescens and P. putida strains under various M9/NaCl concentrations.
96-well plate contents - relating plate reader info to experimental setting in each well. Raw data: generated by Gen5 3.05 plate reader.
- https://doi.org/10.7554/eLife.48508.023
Figure 4 with 1 supplement
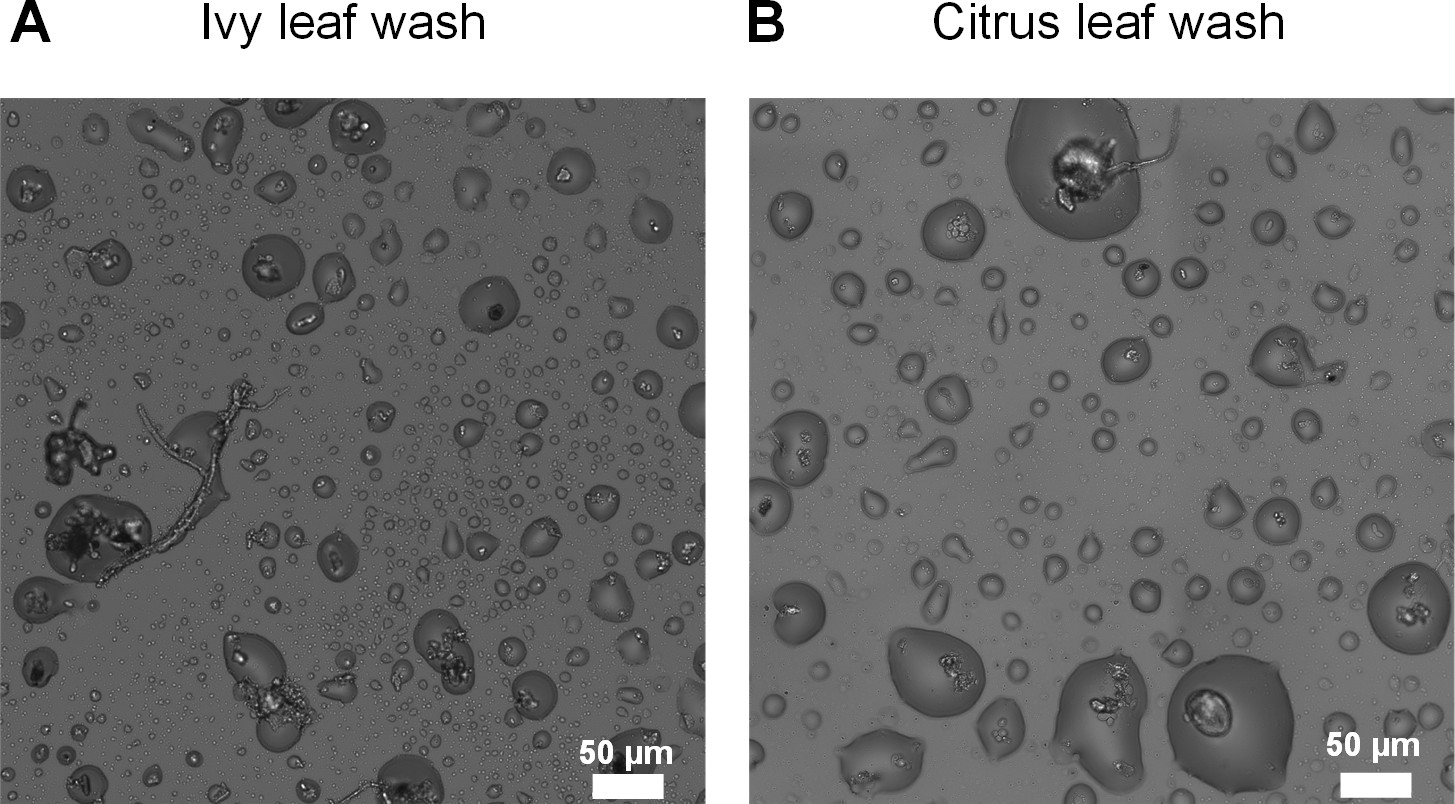
Microscopic wetness forming with natural leaf washes.
(A) ivy leaf wash. (B) orange leaf wash. In both leaf washes, droplet formation around microbiota cells including fungi, yeast, and bacteria can be observed. Leaf wash protocols and drying conditions are described in Materials and methods.
Figure 4—figure supplement 1
Microscopic surface wetness forming with natural leaf washes.
A few diH20 drops were loaded onto the abaxial surface of an ivy leaf, and left for 2 hr at room temperature. A volume of 340 µl was aspired with a pipette, transferred to our standard surface drying platform, and left to dry using our described protocol (28°C, 85% RH, see Materials and methods). The plate surface was imaged ~5 hr after macroscopic drying of the well.
Figure 5 with 1 supplement
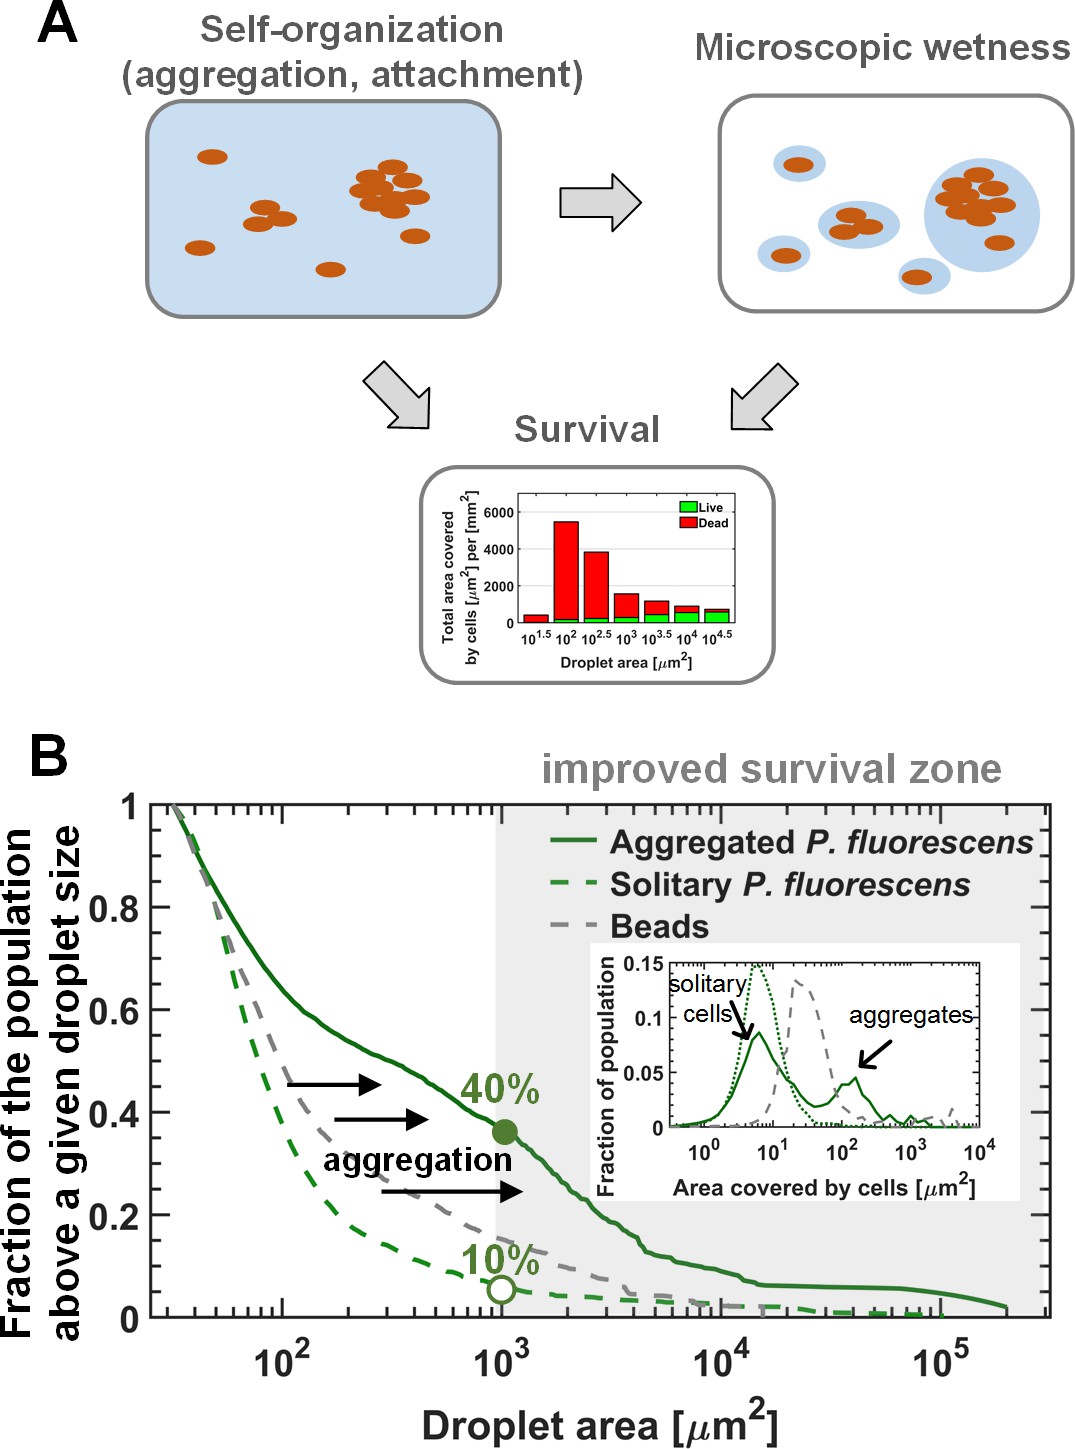
The interplay between self-organization, waterscape, and survival.
(A) Suggested conceptual model: The self-organization of cells on the surface affects the microscopic waterscape and the microscopic hydration conditions around cells, which in turn, together with cellular organization (i.e. aggregation) affects survival. (B) The three lines represent the fraction of the population residing above a given droplet size (i.e. the ratio between the area covered by cells residing in droplets larger than a given size, to the total area covered by cells) of the solitary (late-inoculation) experiment, the bead experiment, and the standard “aggregated “experiment on P. fluorescens. Inset: Aggregate-size distributions of these three experiments. Aggregation results in a larger fraction of the population ending up in large droplets with increased survival rates for cells therein.
-
Figure 5—source data 1
Figure 5B: Fraction of cells or beads(estimated by area) residing above a given droplet size.
The droplet sizes are 100 evenly spaced (logarithmic scale) values between 101.5 μm2 and maximal droplet size. Raw data: droplets area μm2] vs inhabiting aggregate area [μm2] for aggregated P. fluorescens, solitary P. fluorescens, beads Figure 5B inset: Aggregate area distribution. Distribution bins are 45 evenly spaced (logarithmic scale) values between 10−0.5 μm2 and 104 μm2.
- https://doi.org/10.7554/eLife.48508.033
Figure 5—figure supplement 1
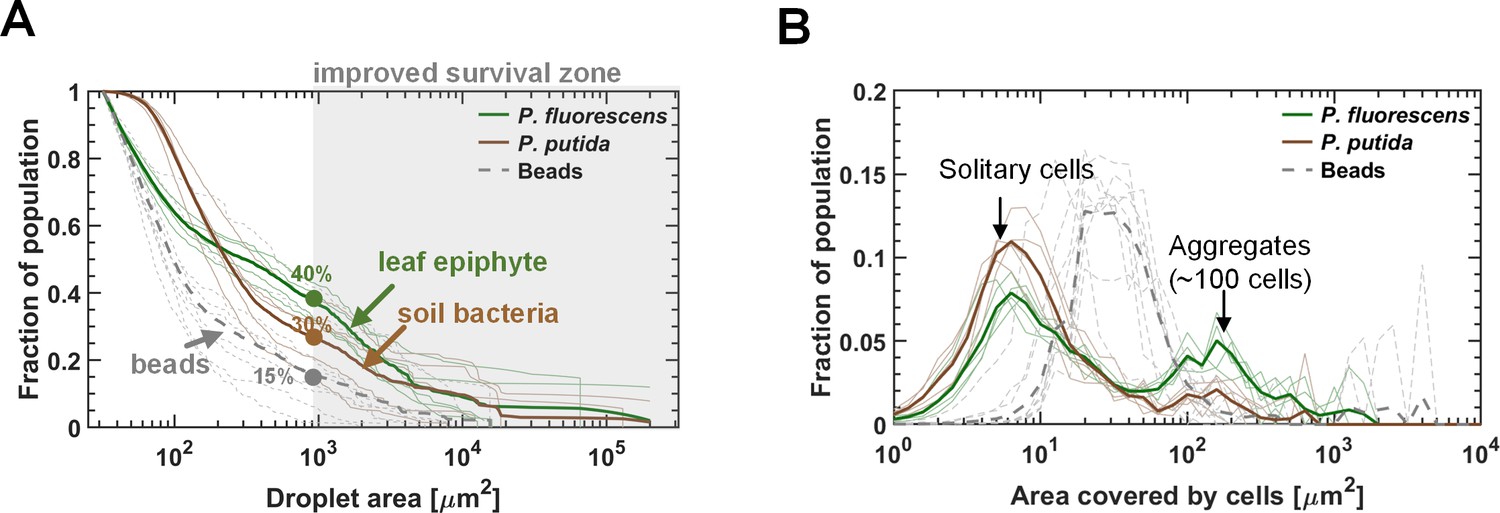
Aggregation and self-organization affect survival.
(A) The cumulative cell abundance distribution residing above a given droplet size. (B) Aggregate-size distributions. In both (A) and (B), the bold lines represent combined data of all five surface sections (nine in case of the beads experiment), while the thin lines represent individual surface sections.
-
Figure 5—figure supplement 1—source data 1
Fraction of the population residing above a given droplet size.
Figure 5—figure supplement 1A: Area fraction of cells (or beads) residing above a given droplet size. The droplet sizes are 100 evenly spaced (logarithmic scale) values between 101.5 μm2 and maximal droplet size (collective for all groups). Raw data: droplet area [μm2] vs cell area [μm2] and 'repeat' represents different field of views (each field of view is represented by a thin line in the plot), for P. fluorescens, P. putida, beads. Figure 5—figure supplement 1B: Aggregate area distribution of cells and beads. Bins are 45 evenly spaced (logarithmic scale) values between 10−0.5 μm2 and 104 μm2 (collective for all groups). Raw data: aggregate area [μm2] , grouped by field of view ('repeat') for P. fluorescens, P. putida, beads.
- https://doi.org/10.7554/eLife.48508.032
Videos
Video 1
The formation of microdroplets around bacterial cells.
The thin (a few μm thick) liquid’s receding front clears out from the surface, leaving behind microdroplets whenever it encounters solitary cells, surface-attached aggregates, or floating pellicles. Videos taken from an experiment with P. fluorescens cells. Video was imaged with a 20x objective. The video plays at real-time speed.
Video 2
The formation of microdroplets around bacterial cells.
The thin (a few μm thick) liquid’s receding front clears out from the surface, leaving behind microdroplets whenever it encounters solitary cells, surface-attached aggregates, or floating pellicles. Videos taken from an experiment with P. fluorescens cells. Video was imaged with a 40x objective. The video plays at real-time speed.
Video 3
The formation of microdroplets around bacterial cells.
The thin (a few μm thick) liquid’s receding front clears out from the surface, leaving behind microdroplets whenever it encounters solitary cells, surface-attached aggregates, or floating pellicles. Videos taken from an experiment with P. fluorescens cells. Video was imaged with a 10x objective. The video plays at real-time speed.
Video 4
Viability of cells within a microdroplet.
Some P. fluorescens cells can be seen swimming, confined within the droplet. Cells were recovered for 84 hr at 95% RH after our standard surface drying experiment (85% RH). The video plays at real-time speed.
Video 5
Viability of cells within a microdroplet.
Some P. fluorescens cells can be seen swimming, confined within the droplet. Cells were recovered for 48 hr at 95% RH after our standard surface drying experiment (85% RH). The video plays at real-time speed.
Tables
Table 1
Strains used in this study.
‘Aggregation’ was determined as ‘yes’ if the majority of cells (>~50%) were observed in clusters of more than five individual cells, and ‘no’ otherwise. Survival level was estimated as follows: ‘low’: almost no survival (<3% of cells); ‘medium’: survival of 3% to 50% of the cells; ‘high’:>50% of all cells survived.
| Genus | Species | Strain | Gram +/- | Major habitat | Aggregation | Survival at 24 hr | Gifted from |
|---|---|---|---|---|---|---|---|
| Pseudomonas | syringae | B728a | - | phyllosphere | No | low | S. Lindow |
| Pseudomonas | syringae | DC3000 | - | phyllosphere | No | low | O. Bahar |
| Pseudomonas | fluorescens | A506 | - | phyllosphere | Yes | medium | S. Lindow |
| Pseudomonas | fluorescens | NT133 | - | rhizosphere | Yes | low | D. Minz |
| Pseudomonas | putida | KT2440 | - | soil | Yes | medium | Purchased from ATCC |
| Pseudomonas | putida | KT2442 | - | soil | Yes | medium | Y. Friedman |
| Pseudomonas | putida | IsoF101 | - | soil | Yes | medium | L. Eberl |
| Pseudomonas | citronellolis | 13674 (ATCC) | - | soil | Yes | low | Y. Friedman |
| Pseudomonas | aurantiaca | 33663 (ATCC) | - | soil | Yes | medium | Y. Friedman |
| Pseudomonas | veronii | 700474 (ATCC) | - | water | Yes | high | Y. Friedman |
| Pantoea | agglomerans | 299 r | - | phyllosphere | No | low | S. Lindow |
| Pantoea | agglomerans | BRT98 | - | soil | Yes | high | Z. Cardon |
| Escherichia | coli | K-12 MG1655 | - | human gut | No | medium | Y. Helman |
| Xanthomoas | campestris | 85–10 | - | phyllosphere | No | low | G. Sessa |
| Burkholderia | cenocepacia | H111 | - | human | Yes | low | Y. Helman |
| Acidovorax | citrulli | M6 | - | phyllosphere | No | low | S. Burdman |
| Bacillus | subtilis | 3610 | + | soil | No | low | Y. Helman |
| Clavibacter | michiganensis | + | soil | Yes | low | S. Burdman |
Key resources table
| Reagent type (species) or resource | Designation | Source or reference | Identifiers | Additional information |
|---|---|---|---|---|
| Strain, strain background (Pseudomonas fluorescens) | A506 | DOI:10.17660/ActaHortic.1993.338.51 | Gifted from S. Lindow lab | |
| Strain, strain background (Pseudomonas putida) | KT2440 | ATCC | 47054 | |
| Recombinant DNA reagent | pUC18T-mini-Tn7T-Gm-eyfp (plasmid) | Addgene | 65031 | |
| Recombinant DNA reagent | pTNS1 (plasmid) | Addgene | 64967 | |
| Software, algorithm | NIS Elements 5.02 | Nikon Instruments | RRID:SCR_014329 | |
| Software, algorithm | MATLAB | MathWorks | RRID:SCR_001622 | |
| Other | propidium iodide stain | Invitrogen | L-7012 | component B, LIVE/DEAD Bac-Light Bacterial Viability Kit |
| Other | fluorescent beads | FLUKA | 94009 | rhodamine-tagged micro particles (2 µm) |
| Other | Alexa Fluor 647 Carboxylic Acid, tris (triethylammonium) salt | Invitrogen | A33084 | |
| Other | Sticker; SecureSeal Imaging spacers | Grace Bio-Labs | SS1 × 20 |
Additional files
-
Supplementary file 1
Molar concentration and osmolarity of M9 salts.
Calculated molarity and osmolarity of salt components in M9 medium at the standard concentration (M9 1x) and in estimated concentrations within microdroplets (M9 23.3x).
- https://doi.org/10.7554/eLife.48508.034
-
Supplementary file 2
Growth curve analysis of P. fluorescens A506 and P. putida KT2440 at various M9 concentrations and NaCl concentrations.
Plate Reader (Synergy H1, BioTek) screen results were analyzed using GrowthRate and GRplot programs (Mira, P., M. Barlow, and B. G. Hall. Statistical Package for Growth Rates Made Easy. Mol. Biol. Evol. 34:3303–3309, 2017). Results of zero growth were omitted from this table. In both strains, the general picture was that higher salt concentrations led to a decrease in growth rate, a decrease in final OD, and an increase in lag time. ‘*’: R is lower than 0.99.
- https://doi.org/10.7554/eLife.48508.035
-
Transparent reporting form
- https://doi.org/10.7554/eLife.48508.036
Download links
A two-part list of links to download the article, or parts of the article, in various formats.
Downloads (link to download the article as PDF)
Open citations (links to open the citations from this article in various online reference manager services)
Cite this article (links to download the citations from this article in formats compatible with various reference manager tools)
Bacterial survival in microscopic surface wetness
eLife 8:e48508.
https://doi.org/10.7554/eLife.48508


