Id4 promotes the elimination of the pro-activation factor Ascl1 to maintain quiescence of adult hippocampal stem cells
- The Francis Crick Institute, United Kingdom
- ICM, Inserm U 1127, CNRS UMR 7225, Sorbonne Université, France
- Erasmus MC, Netherlands
- Institute of Molecular Biotechnology (IMBA), Vienna Biocenter Campus (VBC), Austria
Figures
Figure 1
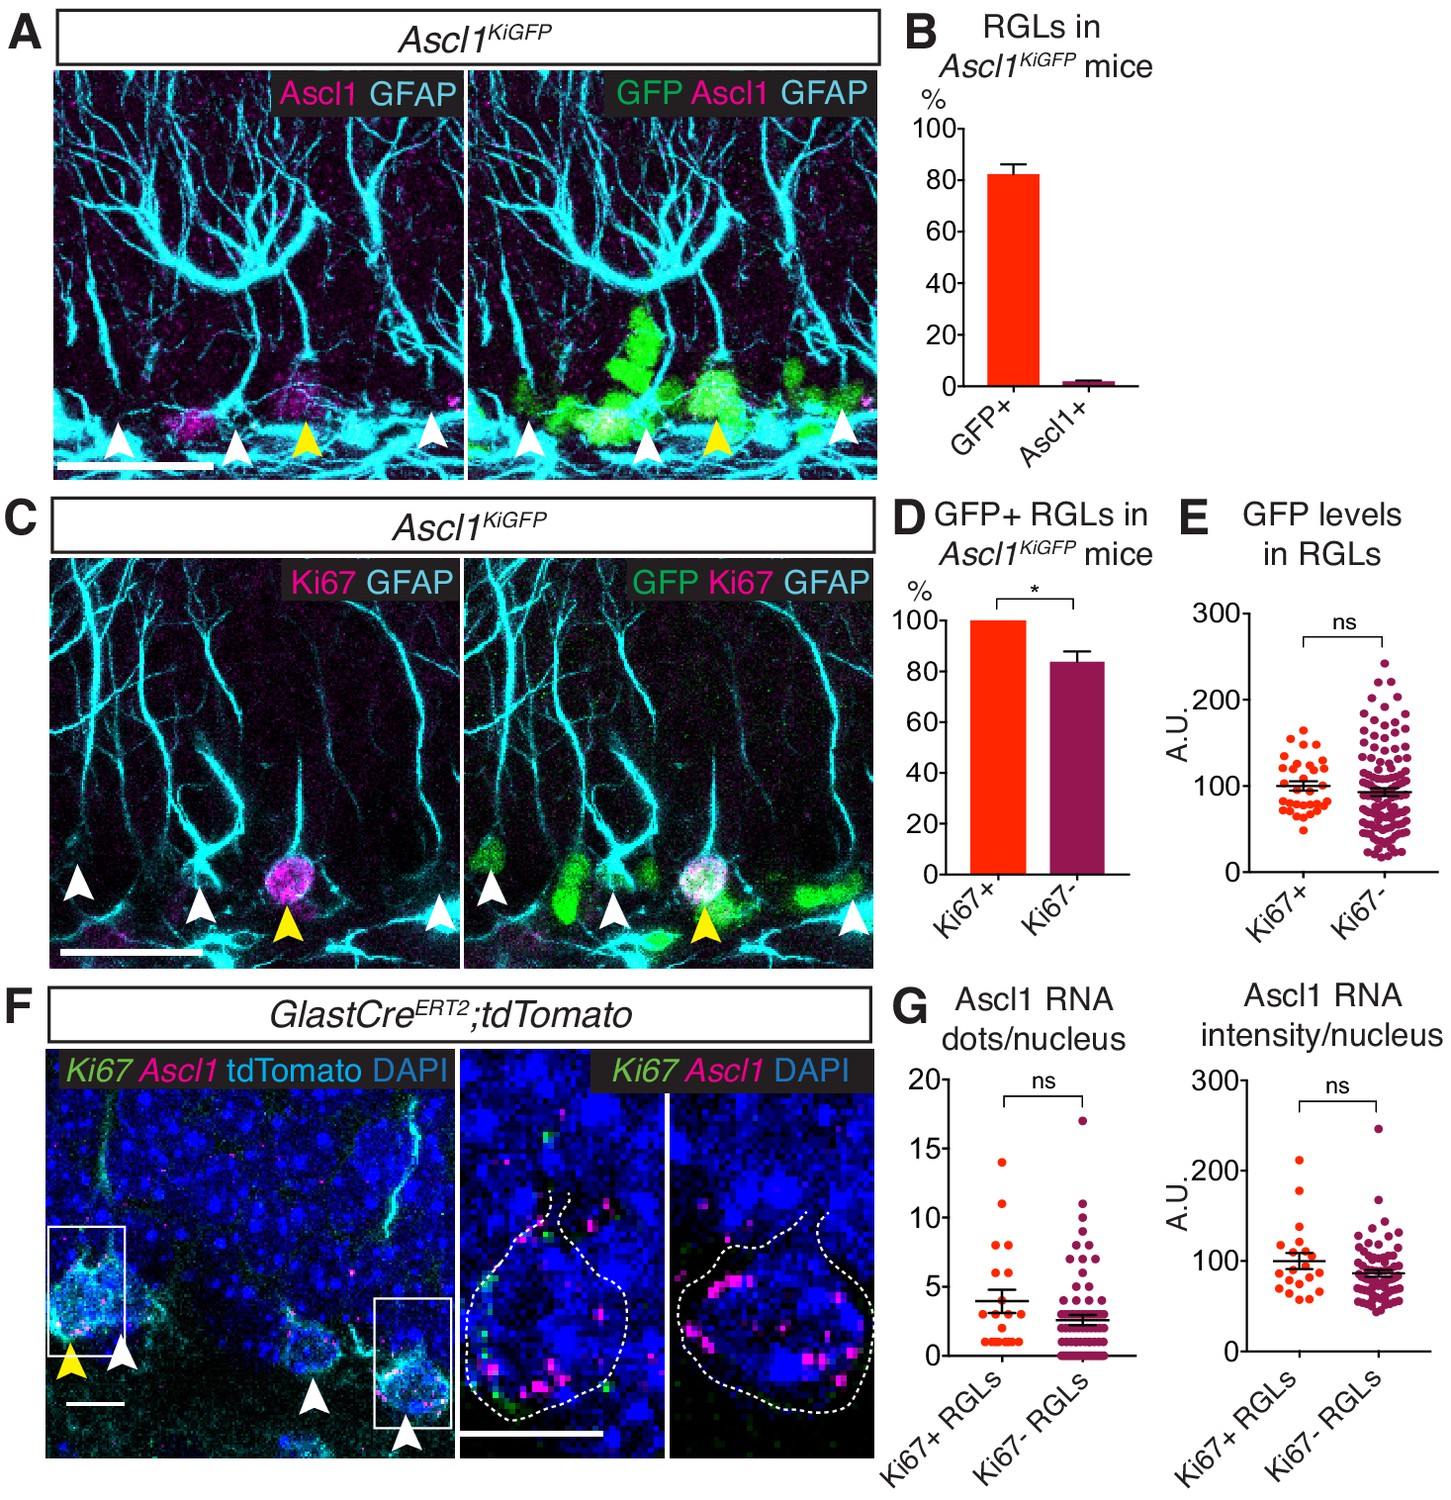
Ascl1 is transcribed in both quiescent and proliferating hippocampal stem cells.
(A) Immunolabeling for GFP, Ascl1 and GFAP in the subgranular zone (SGZ) of the dentate gyrus (DG) of Ascl1KIGFP reporter mice. White arrows indicate GFP+Ascl1- RGLs; yellow arrows indicate GFP+Ascl1+ RGLs. Scale bar, 30 µm. (B) Quantification of the data shown in (A). The widespread GFP expression indicates that Ascl1 is transcribed in most RGLs (radial GFAP+ cells) in Ascl1KIGFP mice while Ascl1 protein is only detectable in a small fraction of RGLs. n = 3. (C) Immunolabeling for GFP, Ki67 and GFAP in the SGZ of the DG of Ascl1KIGFP reporter mice. White arrows indicate GFP+Ki67- RGLs; yellow arrows indicate GFP+Ki67+ RGLs. Scale bar, 30 µm. (D, E) Quantification of the data in (C). Most quiescent (Ki67-) RGLs express GFP and therefore transcribe Ascl1 (p=0.017) (D) and the levels of GFP are not significantly different in quiescent and proliferating RGLs (p=0.429) (E), indicating that Ascl1 is transcribed uniformly in the two RGL populations. n = 3. (F) RNA in situ hybridization by RNAscope with an Ascl1 probe (magenta) and a Ki67 probe (green) and immunolabeling for tdTomato to mark RGLs in the SGZ of the DG. To label RGLs with tdTomato, Glast-CreERT2;tdTomato mice were injected once at P60 with 4-hydroxytamoxifen, and analyzed 48 hr later. White arrows indicate RGLs positive for Ascl1 RNA staining; yellow arrows show RGLs positive for both Ascl1 and Ki67 RNA. Magnifications of the RGLs marked by white boxes are shown on the right, highlighting an RGL positive for both Ascl1 and Ki67 RNA, and an RGL positive for only Ascl1 RNA. Dotted lines show the outline of the tdTomato signal. Scale bar, 10 µm. n = 5. (G) Quantification of the data in (F). Ascl1 transcripts are found at a similar level in quiescent (Ki67-) and proliferating (Ki67+) RGLs (dots/nucleus p=0.101; intensity/nucleus p=0.112). Note the high variability in the levels of Ascl1 mRNA, which could be a reflection of the oscillatory nature of Ascl1 expression (Imayoshi et al., 2013). n = 5. Error bars represent mean ± SEM. Significance values: ns, p>0.05; *, p<0.05; **, p<0.01; ***, p<0.001; ****, p<0.0001.
-
Figure 1—source data 1
Original quantification of Ascl1kiGFP, Ascl1 antibody staining and Ascl1 RNA in active and quiescent RGLs.
- https://doi.org/10.7554/eLife.48561.004
Figure 2 with 1 supplement
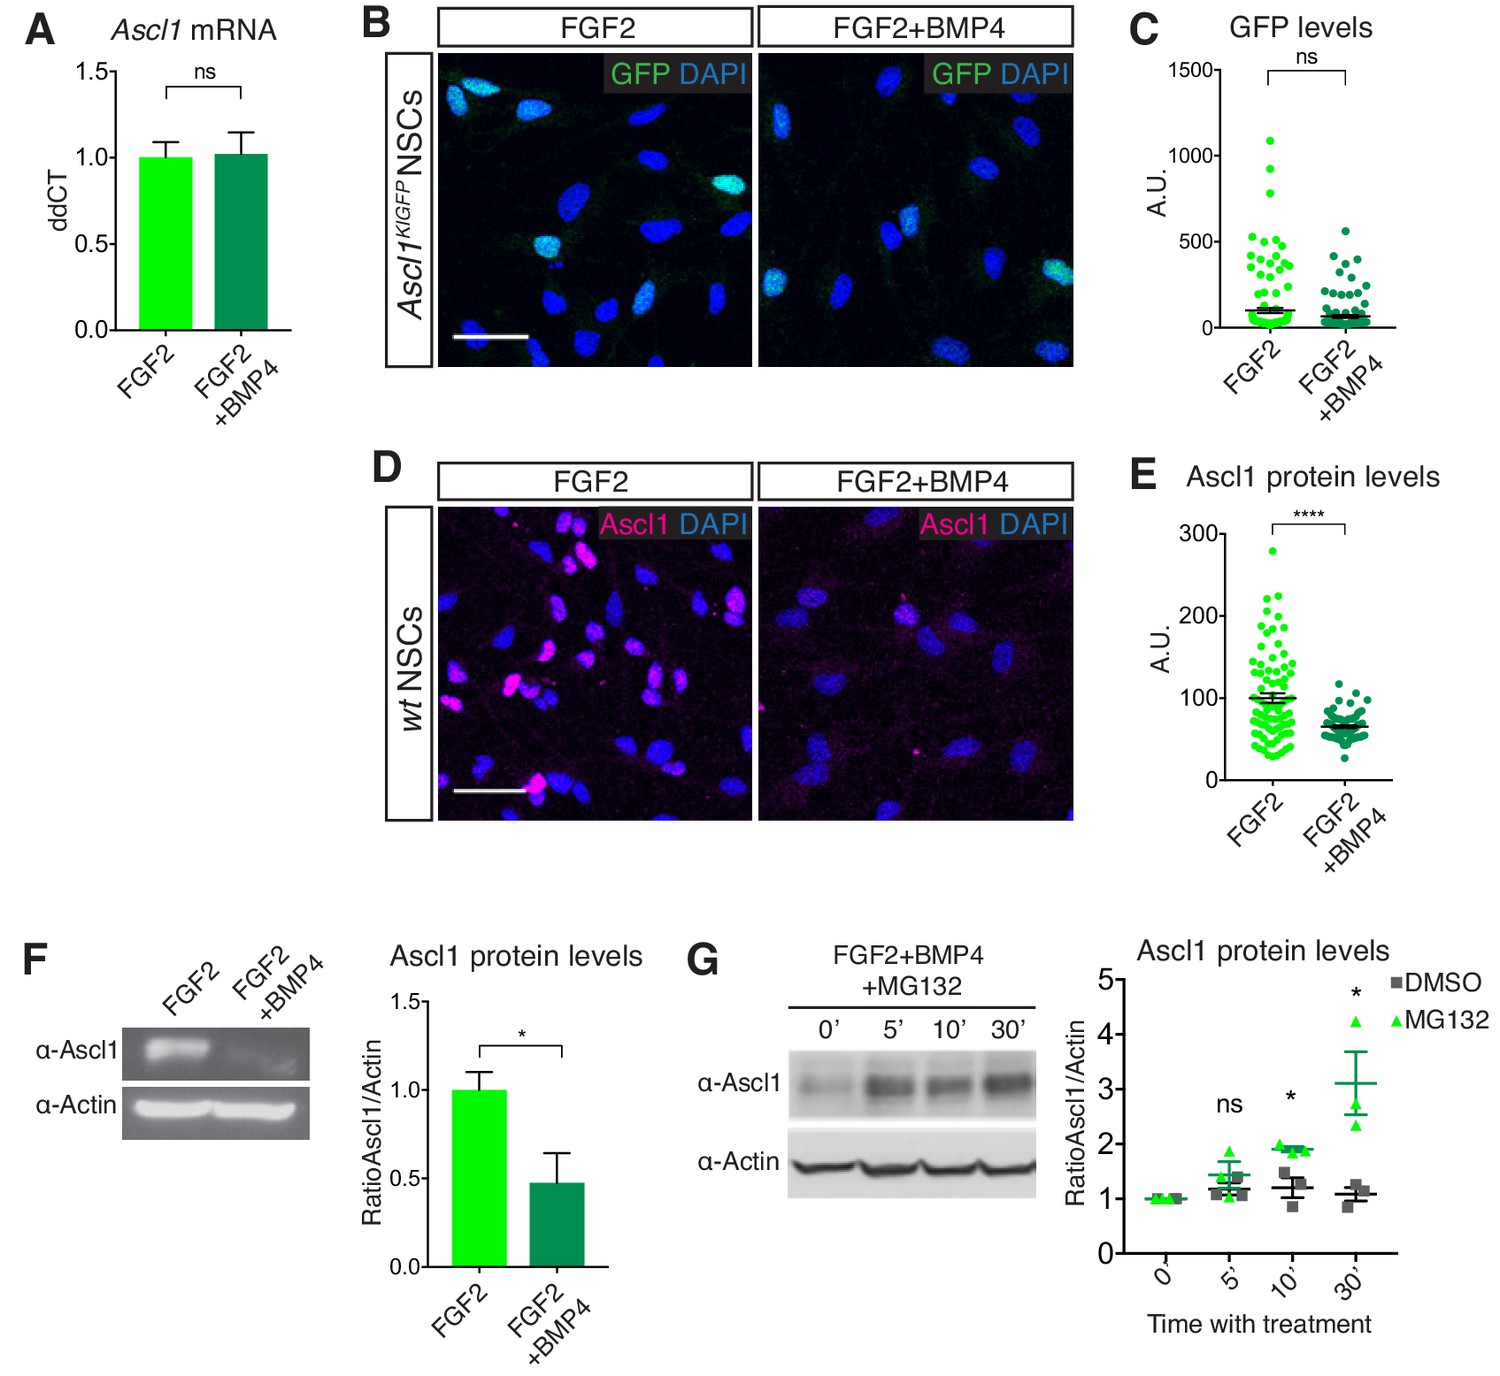
Ascl1 is regulated post-translationally in quiescent NSC cultures.
(A) Transcript levels for Ascl1 in DG-derived NSC cultures treated with FGF2 alone (proliferating NSCs) or FGF2 and BMP4 (quiescent NSCs) analyzed by QPCR. Ascl1 mRNA levels are unchanged in FGF2+BMP4-treated, quiescent NSCs (p=0.908). n = 3. (B) Immunolabeling for GFP and DAPI staining in FGF2 and FGF2+BMP4-treated NSC cultures originating from Ascl1KIGFP mice. Scale bar, 30 µm. (C) Quantification of the data in (B). GFP, which reports transcription of the Ascl1 gene, is expressed at similar levels in proliferating and quiescent NSCs (p=0.058). The data show one representative experiment of n = 3. (D) Immunolabeling for Ascl1 and DAPI staining in FGF2- and FGF2+BMP4-treated NSC cultures. Scale bar, 30 µm. (E) Quantification of the data in (D). Ascl1 levels are high in many proliferating NSCs and not detectable in most quiescent NSCs (p=7.09E-8). The heterogeneity of Ascl1 expression in proliferating NSCs most likely reflects its oscillatory behaviour. n = 3. (F) Western blot analysis and quantification of Ascl1 in FGF2-treated and FGF2+BMP4-treated NSCs. BMP4 suppresses Ascl1 protein expression (p=0.0363). n = 3. (G) Western blot analysis and quantification of Ascl1 in FGF2+BMP4-treated NSCs after treatment with the proteasome inhibitor MG132 for different durations or with DMSO vehicle as a control. Ascl1 can be detected after proteasome inhibition in quiescent NSCs and is significantly increased compared to DMSO conditions from 10mins after MG132 treatment (5’ p=0.387; 10’ p=0.020; 30’ p=0.026). n = 3. Significance calculated using Multiple t test Error bars represent mean ± SEM. Significance values: ns, p>0.05; *, p<0.05; **, p<0.01; ***, p<0.001; ****, p<0.0001. See also Figure 2—figure supplement 1.
-
Figure 2—source data 1
Original quantification of Ascl1 mRNA and protein in proliferating and quiescent NSCs.
- https://doi.org/10.7554/eLife.48561.007
Figure 2—figure supplement 1
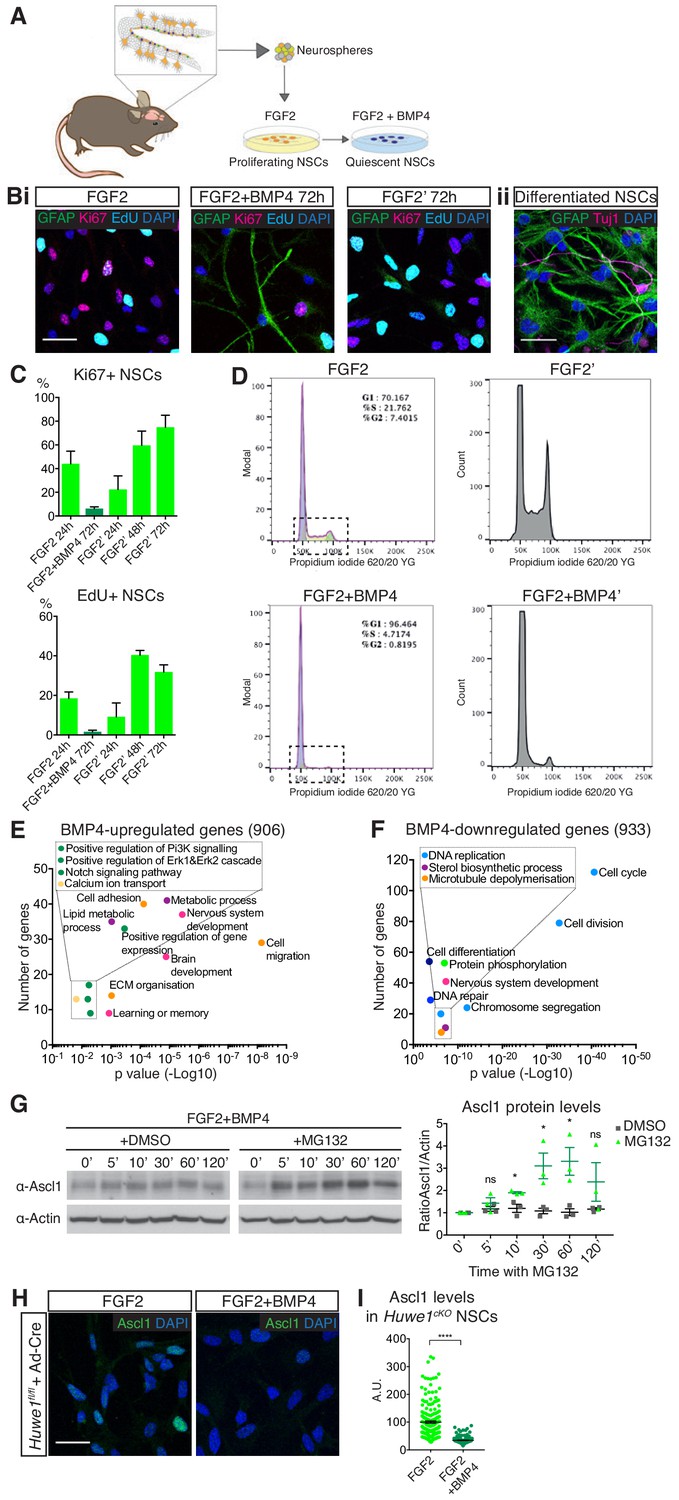
BMP4 induces reversible quiescence of adult hippocampal NSCs.
(A) Scheme of the generation of NSC cultures from the hippocampus of wildtype mice followed by the sequential exposure of NSCs to FGF2 alone and FGF2+BMP4 to induce quiescence. (B) (i) Immunolabeling for GFAP and Ki67, EdU incorporation and DAPI staining of NSC cultures treated sequentially with FGF2 (proliferating), FGF2+BMP4 for 72 hr (quiescent), and FGF2 for 72 hr (re-activated). ii) Immunolabeling for GFAP and Tuj1 and DAPI staining of re-activated NSC cultures treated with 2% fetal bovine serum for 72 hr (differentiated). Scale bar, 30 µm (C) Quantification of the data in (B). Proliferation of NSCs cultivated in FGF2 alone, FGF2+BMP4 and returned to FGF2 alone, measured by Ki67 expression and EdU incorporation. n = 3. (D) FACS-based propidium iodide cell cycle analysis of cultured NSCs in FGF2 (proliferating) and FGF2+BMP4 (quiescent) conditions demonstrates that 72 hr BMP4 treatment induces NSCs to arrest in the G0/G1 phase. FGF2’ and FGF2+BMP4’ show magnifications of the boxed areas in the FACS plots. One representative example shown of n = 3. (E–F) Gene Ontology terms associated with genes up- (E) or down-regulated (F) in FGF2+BMP4-treated, quiescent cultures (72 hr) compared with FGF2-treated, proliferating cultures. Number of genes regulated in each case are stated in parentheses. Dots are colored based on their ontology terms; light blue: cell cycle/division; dark blue: DNA repair/replication; light green: Protein phosphorylation/modification; dark green: signalling, transcription; orange: adhesion/cytoskeleton; yellow: ion-related; pink: brain/nervous system related; navy blue: development/differentiation; purple: metabolism. (G) Full version of Figure 2G: Western blot and quantification of Ascl1 protein levels in FGF2+BMP4-treated NSCs treated with either DMSO or the proteasome-inhibitor MG132 for different durations. Ascl1 protein is significantly increased in NSCs following 10-60mins of proteasome inhibition compared with DMSO conditions. n = 3. (H) Immunolabeling for Ascl1 and DAPI staining in FGF2-treated and FGF2+BMP4-treated NSC cultures originating from Huwe1flox/Y mice and treated with an adenovirus expressing Cre to inactivate Huwe1. Scale bar, 30 µm. (I) Quantification of the data in (H). Elimination of Ascl1 protein from BMP4-treated NSCs does not require Huwe1. Data shown from one experiment. Error bars represent mean ± SEM. Significance values: ns, p>0.05; *, p<0.05; **, p<0.01; ***, p<0.001; ****, p<0.0001.
Figure 3 with 2 supplements

Id4 is a candidate regulator of Ascl1 protein expression in quiescent hippocampal stem cells.
(A) Transcript levels for the four Id genes (Id1, Id2, Id3, Id4) in FGF2-treated and FGF2+BMP4-treated NSCs cultures analyzed by QPCR. BMP strongly induces the Id genes (Id1 p=0.032; Id2 p=0.074; Id3 p=7.29E-4; Id4 p=0.001). n = 3. (B) Western blot analysis of Id4 and E47 in FGF2-treated and FGF2+BMP4-treated NSCs. BMP4 upregulates Id4 protein expression; E47 expression is unchanged. n = 3. (C) Quantification of Id4 protein levels shown in (B) (p=7.53E-4). n = 3. (D) Immunolabeling for Id4 and Ascl1 in FGF2-treated and FGF2+BMP4-treated NSCs. Scale bar, 30 µm. (E–F) Quantifications of the data in (D). (E) BMP4 treatment increases Id4 protein levels in NSCs, detected by immunofluorescence (p=2.32E-11). n = 3. (F) Id4 protein is expressed at high levels in NSCs expressing low levels of Ascl1 protein. n = 3. (G) Scheme for the in vitro competition-binding assay in HEK293T cells between overexpressed Ascl1, E47 and Id4 or its empty vector. Cells were independently transduced and lysates mixed prior to co-immunoprecipitation (co-IP). (H) Western blot analysis of the in vitro competition-binding assay. When Id4 is not present in the lysate, co-IP between Ascl1 and E47 is detected (yellow asterisks). The addition of excess Id4 disrupts in vitro binding of Ascl1 to E47 (red asterisks). Inputs show overexpression of Ascl1, E47 and Id4. (I) Immunolabeling for Id4, Ki67 and GFAP and staining for DAPI in hippocampal RGLs. White arrow indicates an Id4+Ascl1+ RGL. Scale bar, 30 µm. (J–K) Quantification of the data in (I). Id4 is expressed in the majority of RGLs (J), and at high levels in quiescent (Ki67-) RGLs and low levels or is not expressed in proliferating (Ki67+) RGLs (K) (p=8.4E-11). n = 3. Error bars represent mean ± SEM. Significance values: ns, p>0.05; *, p<0.05; **, p<0.01; ***, p<0.001; ****, p<0.0001. See also Figure 3—figure supplements 1 and 2.
-
Figure 3—source data 1
Original quantification of Id4 protein levels in proliferating and quiescent hippocampal NSCs and RGLs.
- https://doi.org/10.7554/eLife.48561.011
Figure 3—figure supplement 1
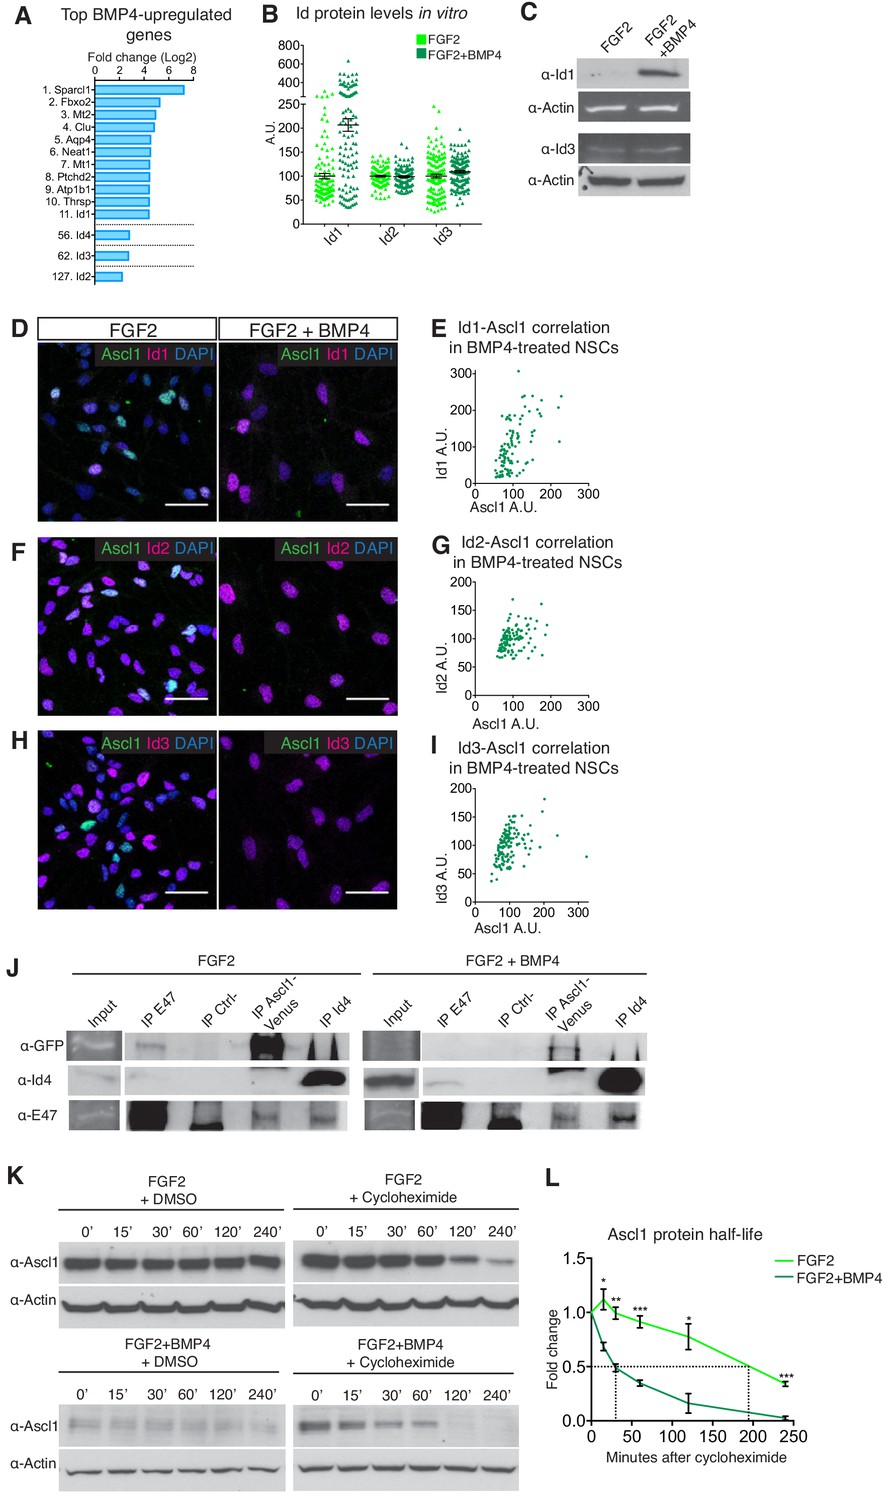
Dynamics of Id1-4 and Ascl1 expression in proliferating and quiescent NSCs.
(A) Gene expression changes for selected genes between FGF2+BMP4- and FGF2-treated NSCs extracted from the RNA-Seq analysis in Figure 2—figure supplement 1E, F. The number before the gene name indicates its rank in fold change of gene expression. The complete list of de-regulated genes can be found under accession number GSE116997 in the GEO database. (B) Quantification of Id1, Id2 and Id3 protein levels by immunofluorescence in FGF2-treated and FGF2+BMP4-treated NSC cultures. n = 3. (C) Western Blot analysis of Id1 and Id3 protein in FGF2- treated and FGF2+BMP4-treated NSC cultures. (D, F, H) Immunolabeling for Ascl1 with Id1, Id2 and Id3 (respectively) in FGF2-treated and FGF2+BMP4-treated NSC cultures. Scale bar, 30 µm. (E, G, I) Quantification of the data in FGF2+BMP4-treated NSC cultures shown in (D, F, H) presented as the correlation between relative intensity of Id1/Id2/Id3 and Ascl1 immunofluorescence. (J) Immunoprecipitation of the Ascl1 dimerization partner E47 from FGF2-treated and FGF2+BMP4-treated NSCs, followed by western blot analysis of Ascl1Venus(GFP) and Id4. E47 co-immunoprecipitates with GFP (Ascl1-Venus) in FGF2 conditions, but with Id4 in FGF2+BMP4 conditions. An antibody against V5 was used for the negative control. (K–L) Western blot analysis of Ascl1 protein half-life in FGF2-treated and FGF2+BMP4-treated NSCs. Cells were treated with cycloheximide to stop protein synthesis for different times, or with DMSO vehicle as a control. Quantification of the data in (K) shows Ascl1 protein half-life is significantly shorter in NSCs treated with FGF2+BMP4 compared to FGF2 alone. n = 3. Error bars represent mean ± SEM. Significance values: ns, p>0.05; *, p<0.05; **, p<0.01; ***, p<0.001; ****, p<0.0001.
Figure 3—figure supplement 2

Expression of Id1-4 and Tcf4 in RGLs in the dentate gyrus.
(A) Immunolabeling for Id1, Ki67 and GFAP in the DG. White arrows indicate Ki67+Id1+ RGLs. Scale bar, 30 µm. (B–C) Quantification of the data in (A). Id1 is expressed in around half of all RGLs (B) and is expressed in both quiescent (Ki67-) and proliferating (Ki67+) RGLs, with higher levels present in proliferating cells (C). n = 4. (D) Immunolabeling for Id2 and GFAP and DAPI staining in the DG. Id2 staining is mostly localized to granule neurons. Scale bar, 30 µm. (E–G) Immunolabeling for Id3, Ki67, GFAP and DAPI in the DG. Yellow arrows indicate Id3+Ki67- RGLs; the white arrow indicates an Id3-Ki67+ RGL. Id3 staining is found in a very small number of RGLs, quantified in (F), and is expressed at similar levels in proliferating (Ki67+; white arrow) and quiescent (Ki67-; yellow arrows) RGLs (G). Scale bar, 30 µm. n = 4. (H–I) Single molecule RNA in situ hybridization by RNAscope with an Ascl1 probe (magenta) and an Id4 probe (green) (H) shows the majority of Id4-expressing cells in SGZ of the DG co-express Ascl1 mRNA (yellow arrows), quantified as number of Ascl1 RNA dots/Id4+ nucleus (I). Scale bar, 30 µm. n = 3. (J–K) Immunolabeling and quantification for the Eein Tcf4 and tdTomato in the DG of tamoxifen-treated GlastCreERT2;tdTomato mice. The vast majority of RGLs express some Tcf4 protein (J). White arrows indicate Tcf4+tdTom+ RGLs, yellow arrow indicates a Tcf4-negative cell (K). Scale bar, 30 µm. n = 3. Error bars represent mean ± SEM. Significance values: ns, p>0.05; *, p<0.05; **, p<0.01; ***, p<0.001; ****, p<0.0001.
Figure 4 with 1 supplement
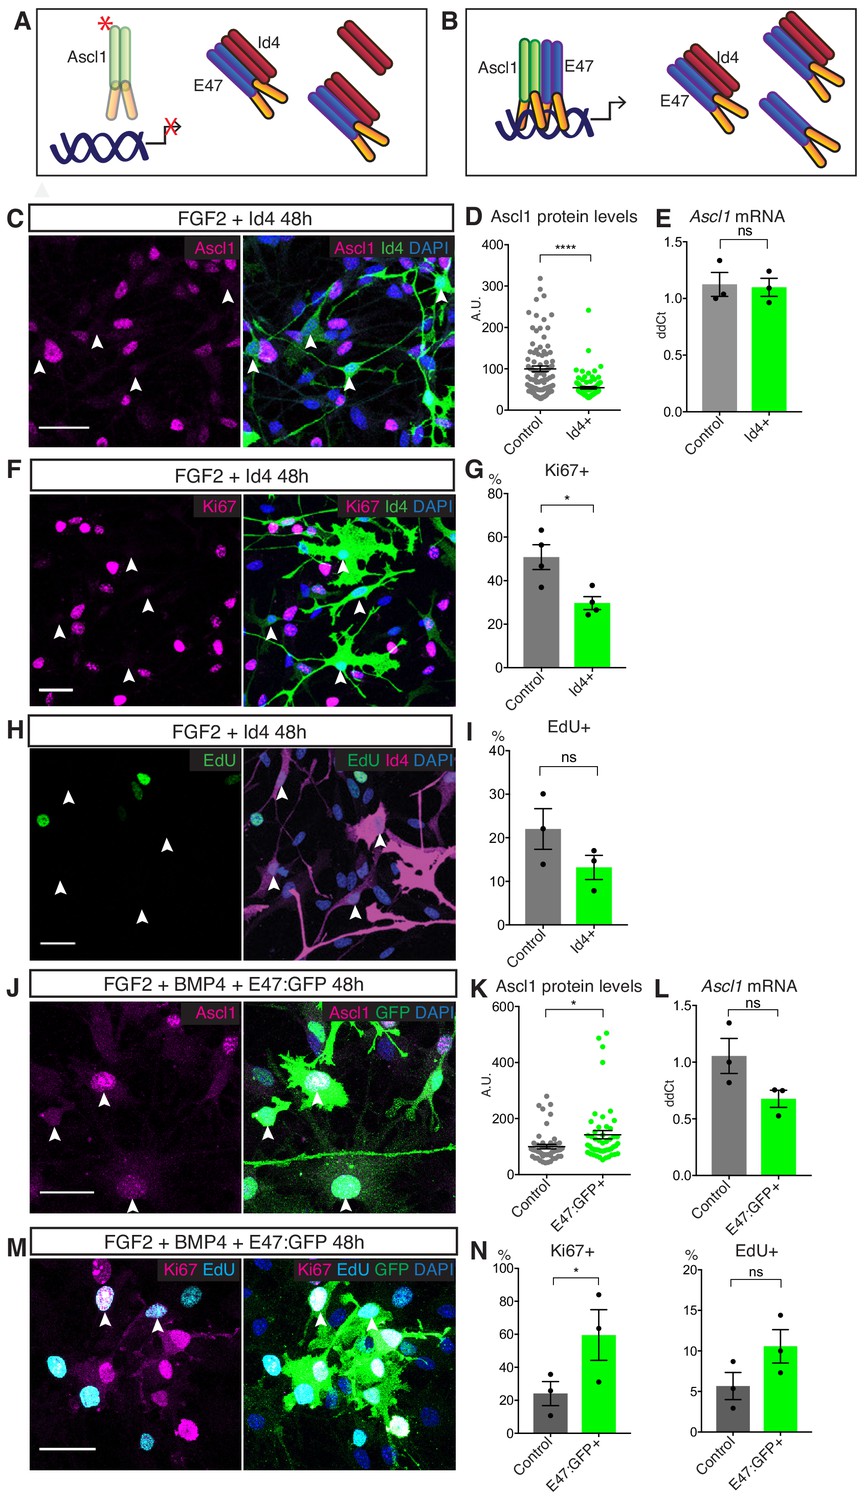
Id4 suppresses Ascl1 expression and cell proliferation in NSC cultures.
(A) Model of Ascl1 monomerization and elimination following Id4 overexpression in proliferating NSC cultures. (B) Model of Id protein titration by E47 overexpression in quiescent NSC cultures. (C) Immunolabeling for Ascl1 and Id4 and staining for DAPI in Id4-overexpressing, FGF2-treated NSCs. White arrows show low Ascl1 levels in Id4-overexpressing cells. Scale bar, 30 µm. (D) Quantification of the data in (C). Ascl1 protein expression is strongly reduced by Id4 overexpression. The data show one representative experiment, n = 3 (p=3.05E-9). (E) Ascl1 mRNA levels in FACS sorted FGF2-treated NSCs transfected with a GFP-expressing control or Id4-expression construct. Ascl1 mRNA levels are not changed by Id4 overexpression (p=0.873). n = 3. (F) Immunolabeling for Ki67 and Id4 in Id4-overexpressing, FGF2-treated NSCs. White arrows indicate absence of Ki67 in Id4-overexpressing cells. Scale bar, 30 µm. (G) Quantification of the data in (C). Id4 overexpression reduces NSC proliferation (p=0.050). n = 3. (H) Staining for EdU and immunolabeling for Id4 in Id4-overexpressing, FGF2-treated NSCs. EdU was administered to the cultured cells one hour before fixation. White arrows indicate absence of EdU in Id4-overexpressing cells. Scale bar, 30 µm. (I) Quantification of the data in (H). Id4 overexpression reduces the fraction of NSCs in S-phase (p=0.114). n = 3. (J) Immunolabeling for Ascl1 and GFP with DAPI staining, in E47:GFP-overexpressing, FGF2+BMP4-treated NSCs. White arrows indicate Ascl1-positive, E47-overexpressing quiescent cells. Scale bar, 30 µm. (K) Quantification of the data in (J) (p=0.013). (L) Titration of Id proteins by E47 results in a significant increase in Ascl1 protein expression without significant change in Ascl1 RNA levels (p=0.075). n = 3 (M) Immunolabeling for GFP and Ki67 and staining for EdU and DAPI in E47:GFP-overexpressing, FGF2+BMP4-treated NSCs. White arrows indicate E47-overexpressing quiescent cells positive for Ki67 and EdU. Scale bar, 30 µm. (N) Quantification of the data in (M). Titration of Id proteins by E47 reverts the proliferation arrest of BMP4-treated NSCs (%Ki67+ p=0.048; %EdU+ p=0.085). n = 3. Error bars represent mean ± SEM. Significance values: ns, p>0.05; *, p<0.05; **, p<0.01; ***, p<0.001; ****, p<0.0001. See also Figure 4—figure supplement 1.
-
Figure 4—source data 1
Original quantification of Ascl1, Ki67 and EdU in Id4- and E47-overexpressing NSCs.
- https://doi.org/10.7554/eLife.48561.014
Figure 4—figure supplement 1
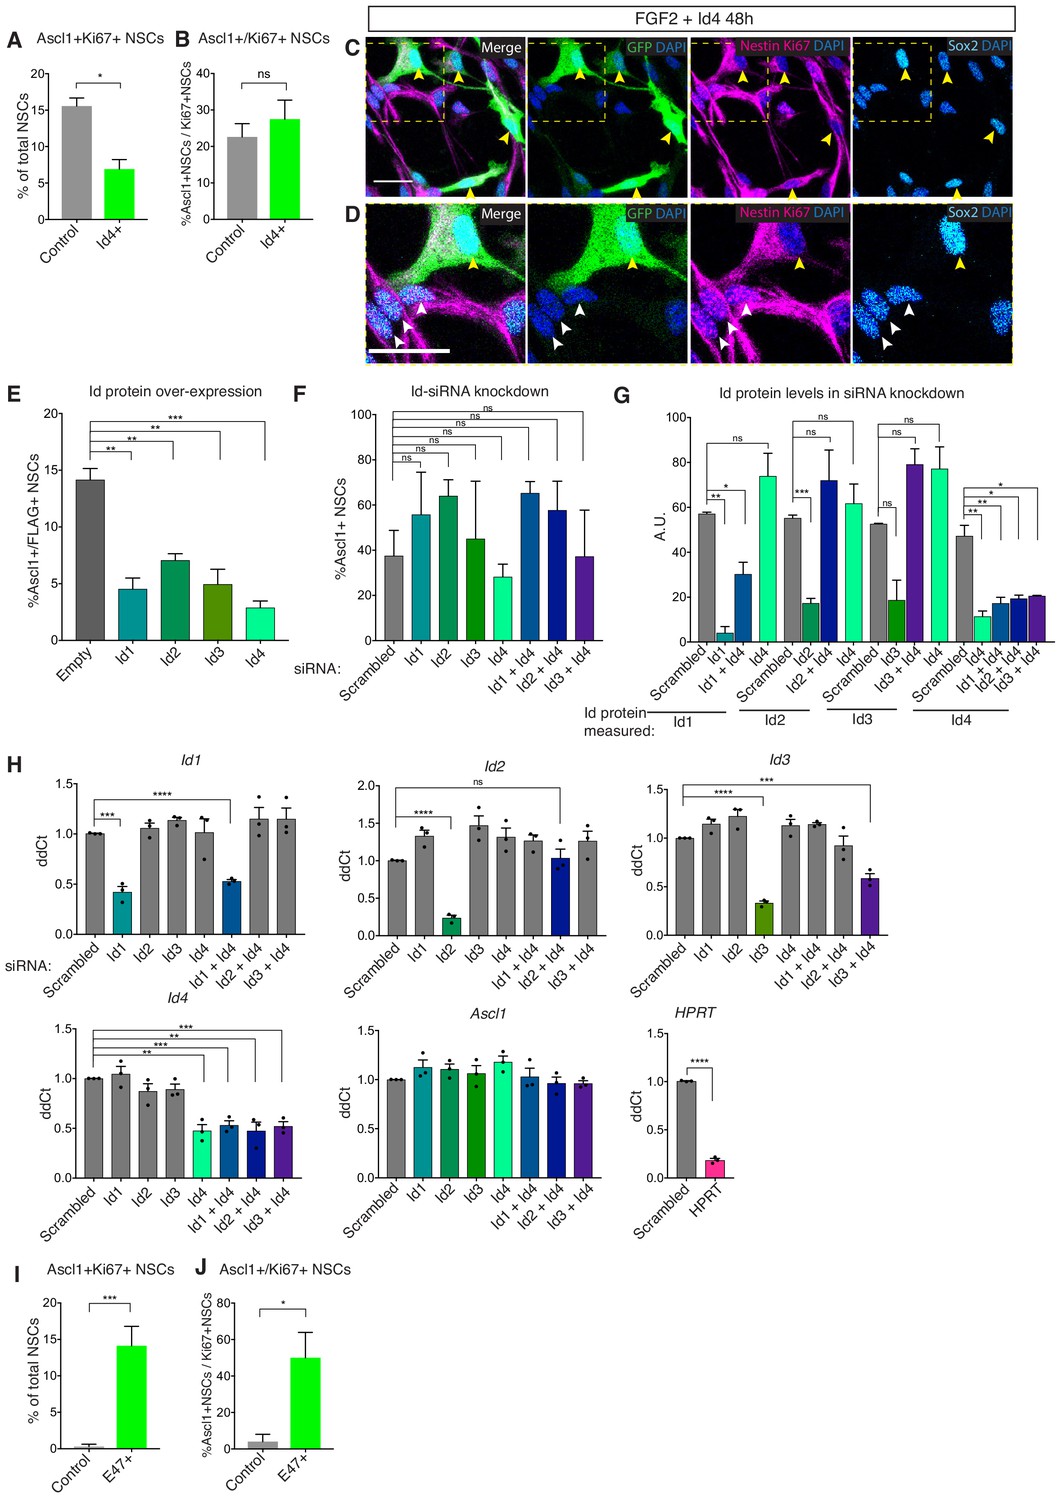
Analysis of Id1-4 overexpression and siRNA knockdown in NSCs.
(A) Quantification of the co-expression of Ascl1 and Ki67 in control and Id4-overexpressing FGF2-treated NSCs. Ascl1 and Ki67 are co-expressed in 15.5 ± 1.1% of control (Id4-negative) and 6.9 ± 1.3% of Id4-overexpressing NSCs. n = 3. (B) Quantification of the fraction of Ki67 positive NSCs that also express Ascl1, in control or Id4-overexpressing, FGF2-treated NSCs. Ascl1 is expressed in 22.6 ± 3.6% of control (Id4-negative) and 27.5 ± 5.2% of Id4-overexpressing, Ki67 positive NSCs. (Ascl1 expression oscillates and a fraction of Id4-negative, Ascl1-negative cells represent cells at a low point in these oscillations). n = 3. (C–D) Immunolabeling for Nestin, Ki67, Sox2 and GFP and DAPI staining in NSCs overexpressing Id4+GFP. A magnification of the yellow box in (C) is shown in (D). 48 hr post-transduction, Id4 (GFP)-positive NSCs are Ki67-negative but still express the stem cell markers Nestin and Sox2, indicating the cell cycle exit is not due to differentiation. Yellow arrows indicate Id4-overexpressing NSCs; white arrows indicate non-transduced NSCs positive for Ki67. Scale bar, 30 µm. One representative image shown of n = 3. (E) Transfection of proliferating NSCs with FLAG-tagged Id1, Id2, Id3 or Id4 resulted in a significant decrease in the percentage of FLAG+ NSCs that were Ascl1+ after 48 hr for all Ids, measured by immunostaining, compared to transfection with an empty vector. n = 3 (F) siRNA knockdown of Id1-4 or Id4+Id1/2/3 in quiescent (FGF2+BMP4) NSCs 48 hr post-transfection showed no significant effect on the percentage of NSCs expressing Ascl1 protein. n = 3. (G) Id1, Id3 and Id4 protein levels were significantly reduced following siRNA transfection (Id2 protein was non-significantly reduced), as measured by immunostaining. Id4 protein was also knocked-down when combined with Id1/2/3 siRNA, however Id1/2/3 proteins were not suppressed when combined with Id4 siRNA. Id1 and Id3 levels were increased in NSCs transfected with Id4 siRNA. n = 3. (H) Quantification of mRNA levels of Id1, Id2, Id3, Id4, Ascl1 and positive control HPRT by QPCR, following transfection with the indicated siRNAs. The siRNA transfection efficiently knocked down the target genes, and did not affect Ascl1 transcription. n = 3. (I) Quantification of the co-expression of Ascl1 and Ki67 in control or E47-overexpressing NSCs in FGF2+BMP4 conditions. Ascl1 and Ki67 are co-expressed in 0.3 ± 0.3% of control (E47-negative) and 14.1 ± 2.6% of E47-overexpressing NSCs. n = 3. (J) Quantification of the fraction of Ki67 positive NSCs that also express Ascl1, in control or E47-overexpressing, FGF2+BMP4-treated NSCs. Ascl1 is expressed in 4 ± 4% of control (Id4-negative) and 50 ± 13.9% of E47-overexpressing, Ki67 positive NSCs. n = 3. Error bars represent mean ± SEM. Significance values: ns, p>0.05; *, p<0.05; **, p<0.01; ***, p<0.001; ****, p<0.0001.
Figure 5 with 1 supplement
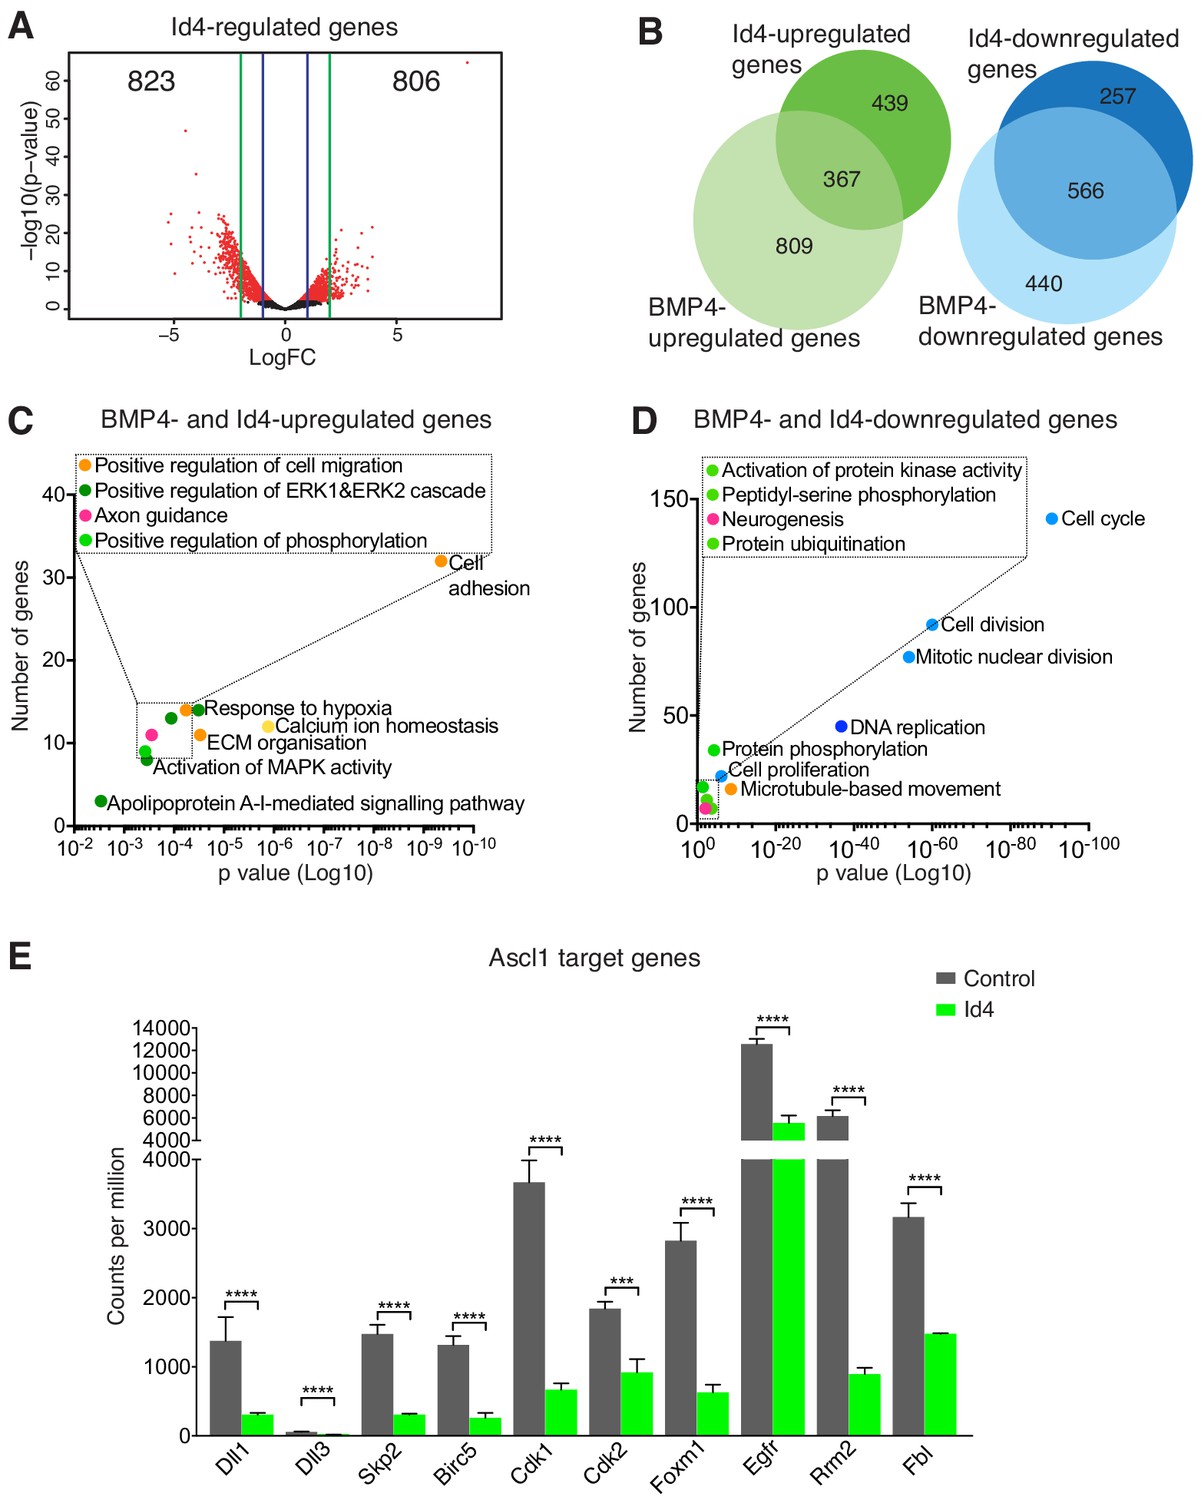
Id4 regulation of Ascl1 targets contributes to BMP-induced NSC quiescence.
(A) Volcano plot displaying gene expression changes between control and Id4-overexpressing FGF2-treated NSCs analyzed by RNA-Seq. (B) Venn diagrams indicating the number of genes up- and down-regulated by addition of BMP4 or Id4-overexpression or both in FGF2-treated NSCs. (C–D) Gene Ontology terms associated with genes up- or down-regulated by both addition of BMP4 and Id4-overexpression in FGF2-treated cultures. Dots are colored based on their ontology terms; light blue: cell cycle/division; dark blue: DNA repair/replication; light green: Protein phosphorylation/modification; dark green: signalling, transcription; orange: adhesion/cytoskeleton; yellow: ion-related; pink: brain/nervous system related. (E) Downregulation of Ascl1 target genes in FGF2-treated cultures overexpressing Id4 and analyzed by RNA-Seq, including canonical Ascl1 targets (Dll1 and Dll3), genes involved in cell cycle regulation (Skp2, Cdk1, Cdk2 and Foxm1), RGL activation (Egfr) and other Ascl1 targets previously identified in NSCs (Birc5, Rrm2 and Fbl). (p values in order of genes: 3.04E-11, 2.31E-6, 9.49E-18, 1.32E-12, 8.47E-19, 3.62E-4, 6.72E-14, 6.25E-6, 1.13E-23, 4.96E-6). n = 3. Error bars represent mean ± SEM. Significance values: ns, p>0.05; *, p<0.05; **, p<0.01; ***, p<0.001; ****, p<0.0001. See also Figure 5—figure supplement 1.
-
Figure 5—source data 1
Significantly regulated genes and gene ontology analysis, and CPM values for Ascl1 target genes in Id4-overexpressing NSCs.
- https://doi.org/10.7554/eLife.48561.017
Figure 5—figure supplement 1
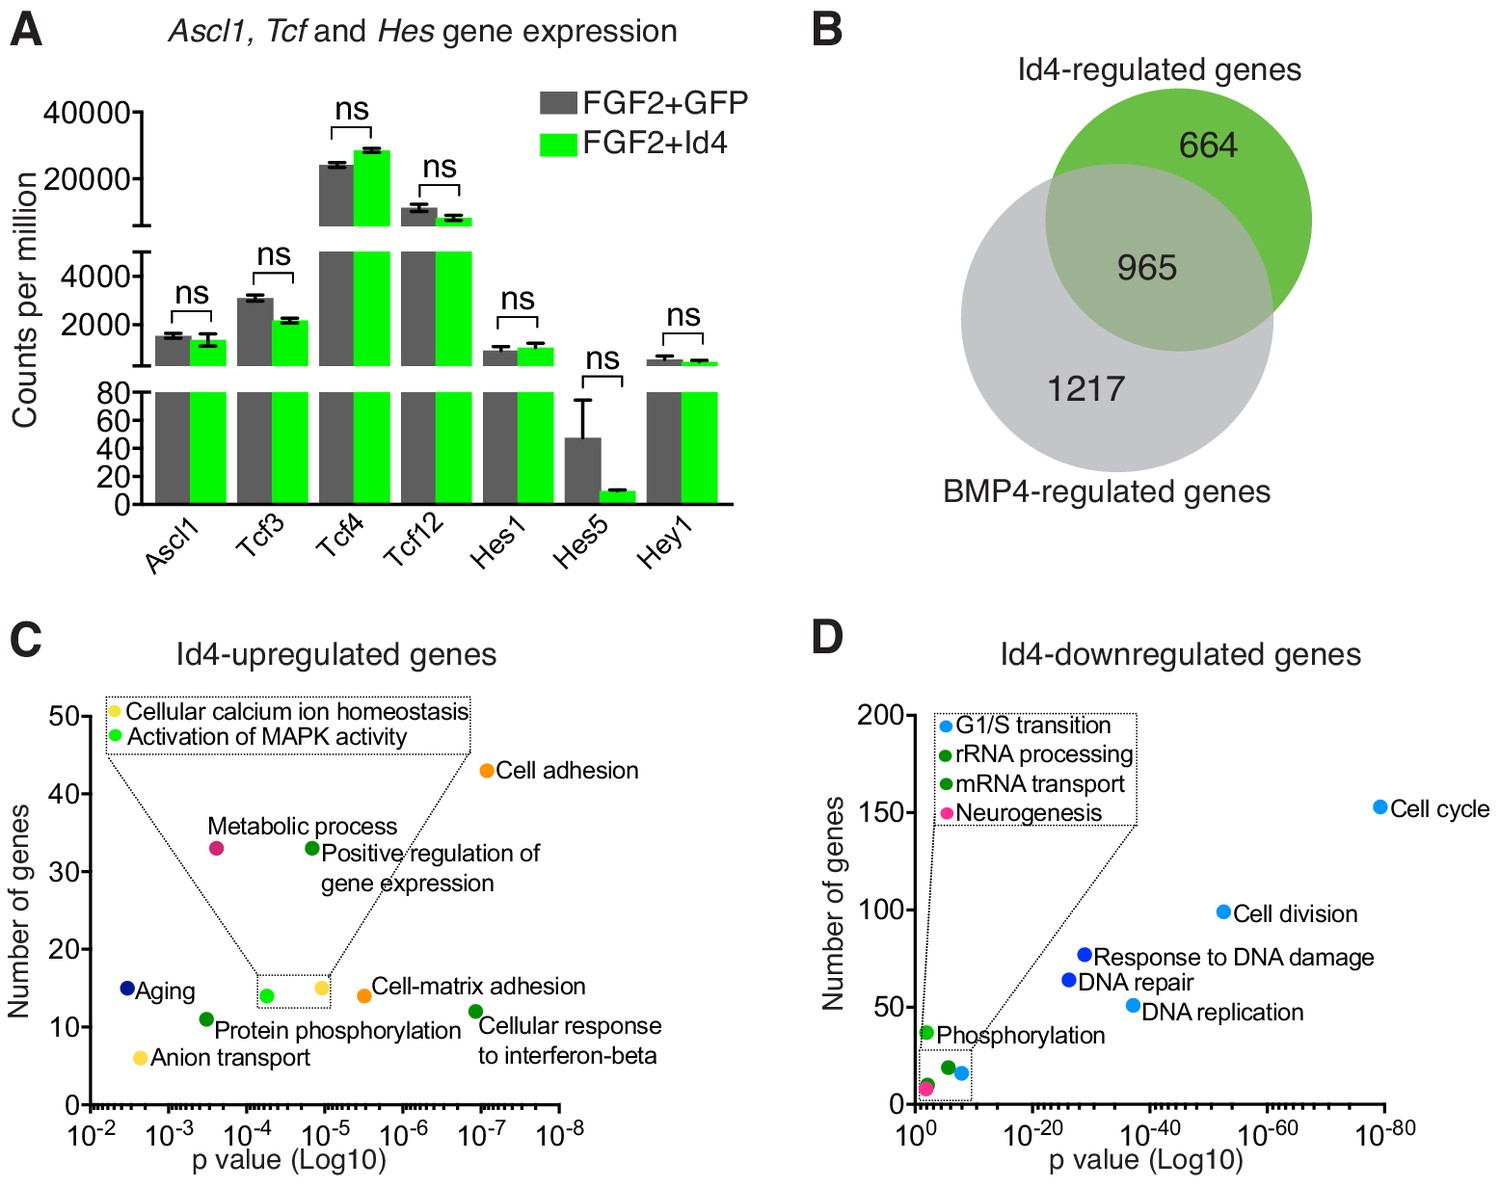
RNAseq analysis of proliferating NSCs overexpressing Id4.
(A) Normalized transcript numbers from RNA-seq data (counts per million) of Ascl1, Tcf3, Tcf4, Tcf12, Hes1, Hes5 and Hey1 are unchanged between FGF2-treated NSCs overexpressing GFP or Id4. n = 3. (B) Venn diagram indicating the number of genes regulated by BMP4 or Id4-overexpression, or both, in FGF2-treated NSCs. (C–D) Gene Ontology terms associated with genes up- (C) and downregulated (D) in Id4-overexpressing FGF2-treated NSCs. Dots are colored based on their ontology terms; light blue: cell cycle/division; dark blue: DNA repair/replication; light green: Protein phosphorylation/modification; dark green: signalling, transcription; orange: adhesion/cytoskeleton; yellow: ion-related; pink: brain/nervous system related; navy blue: development/differentiation; purple: metabolism; maroon: endo/exocytosis. Error bars represent mean ± SEM. Significance values: ns, p>0.05; *, p<0.05; **, p<0.01; ***, p<0.001; ****, p<0.0001.
Figure 6 with 1 supplement
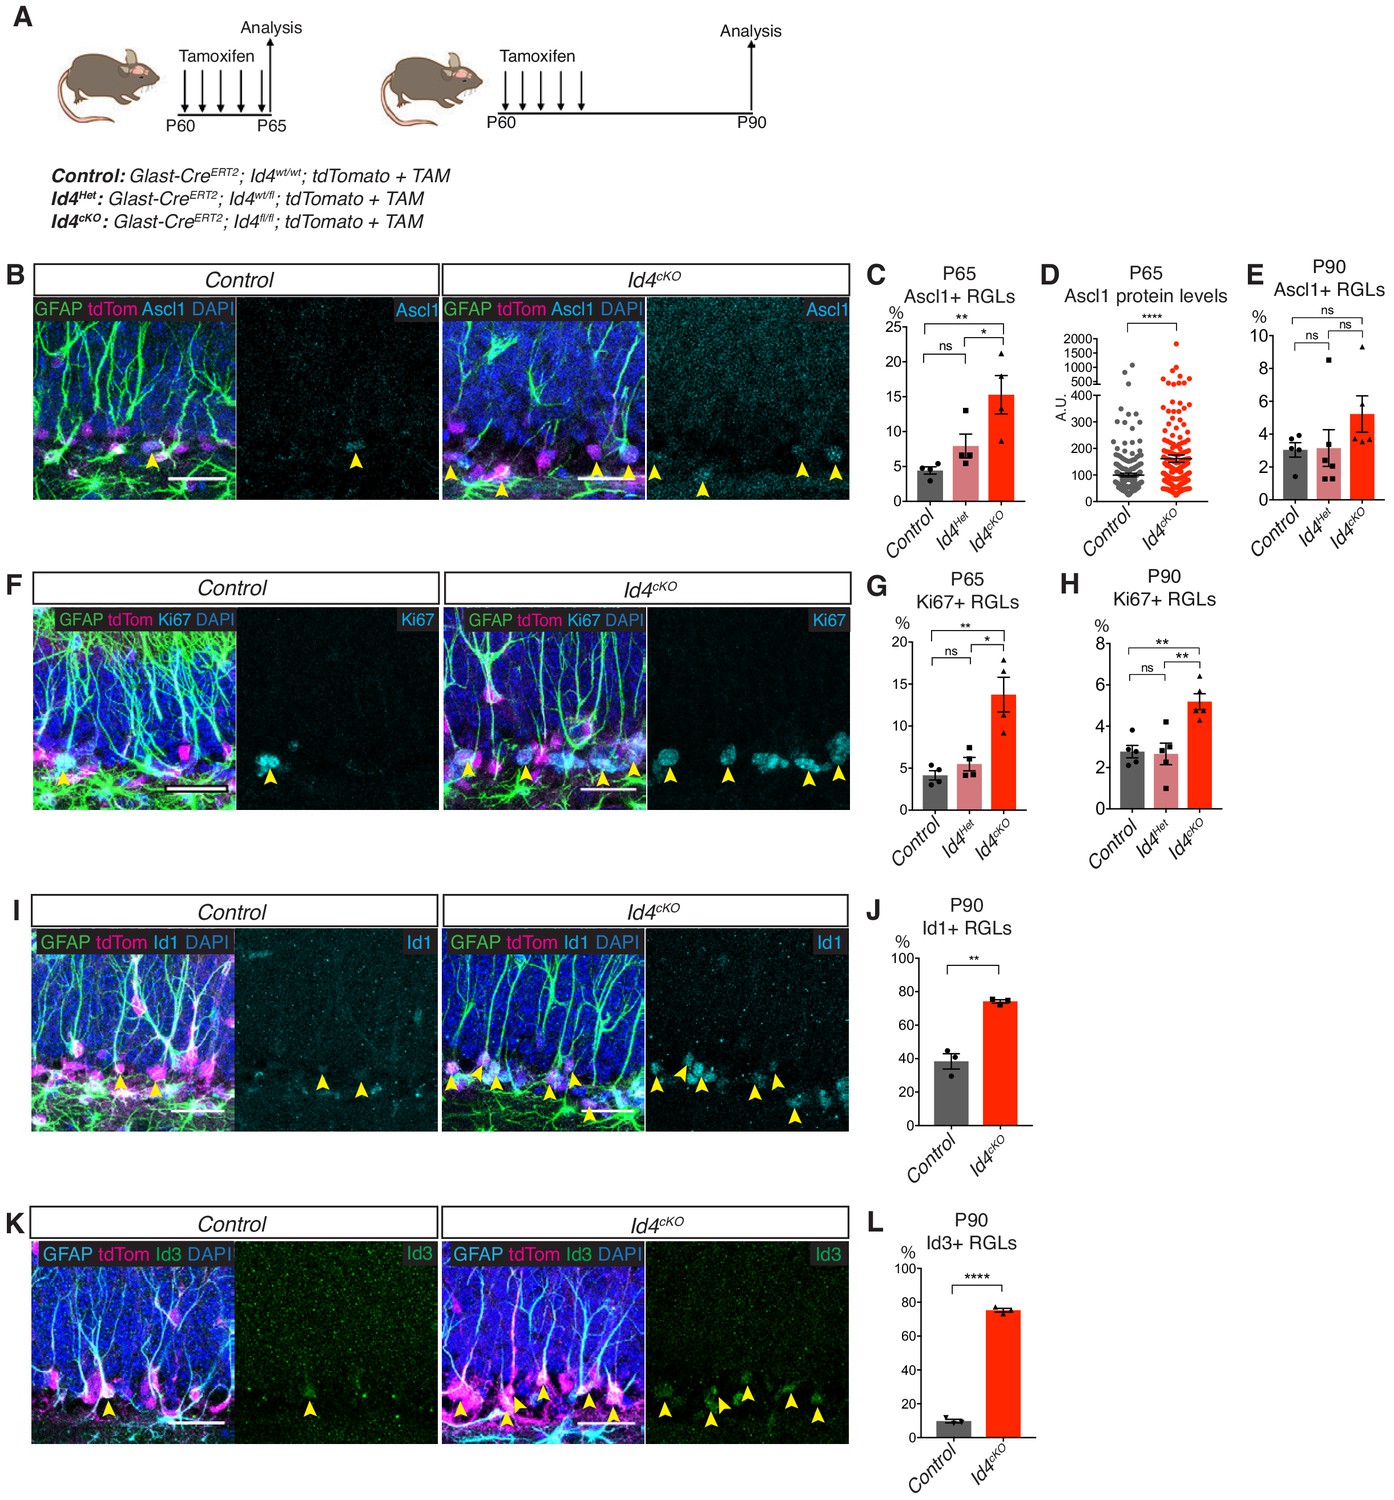
Loss of Id4 results in activation of quiescent RGLs in the adult hippocampus.
(A) Design of the experiment for acute and long-term deletion of Id4 from RGLs of the adult hippocampus using Id4cKO mice. (B) Immunolabeling for GFAP, tdTomato, Ascl1 and DAPI staining in control and Id4cKO mice after 5 days of tamoxifen administration. Yellow arrows indicate Ascl1-positive RGLs. Scale bar, 30 µm. (C–D) Quantification of Ascl1 protein in tdTomato+ RGLs in control, Id4Het and Id4cKO mice after 5 days of tamoxifen administration. Loss of both copies of Id4 results in increases in the number of Ascl1-expressing cells and in the levels of Ascl1 protein in RGLs (Control vs Het p=0.3276; Control vs cKO p=0.0067; Het vs cKO p=0.0381; protein levels p=2.01E-5). n = 4 for control, Id4Het and Id4cKO mice. (E) Quantification of Ascl1 protein in tdTomato+ RGLs control, Id4Het and Id4cKO mice 30 days after tamoxifen administration. The percentage of RGLs positive for Ascl1 is increased in Id4cKO mice compared with control mice 30 days after Id4 deletion (Control vs Het p=0.996; Control vs cKO p=0.311; Het vs cKO p=0.315). n = 5 for control and Id4Het mice, n = 6 for Id4cKO mice. (F) Immunolabeling for GFAP, tdTomato, Ki67 and DAPI staining in control and Id4cKO and control mice after 5 days of tamoxifen administration. Yellow arrows indicate Ki67-positive RGLs. Scale bar, 30 µm. (G–H) Quantification of the fraction of Ki67+ tdTomato+ RGLs in control, Id4Het and Id4cKO mice, 5 days (G) and 30 days (H) following tamoxifen administration. The percentage of Ki67+ tdTomato+ RGLs is strongly increased following acute deletion of both copies of the Id4 allele, and remained significantly increased, albeit to a lesser extent, following long-term deletion. (Control vs Het P65 p=0.7595, P90 p=0.980; Control vs cKO P65 p=0.0049, P90 p=0.0036; Het vs cKO p=0.0101, P90 p=0.0026). n = 4 for P65 control, Id4Het and Id4cKO mice at P65; n = 5 for P90 control, Id4Het and Id4cKO mice. (I) Immunolabeling for GFAP, tdTomato, Id1 and DAPI staining in control and Id4cKO and control mice 30 days after tamoxifen administration. Yellow arrows indicate Id1-positive RGLs. Scale bar, 30 µm. (J) Quantification of the fraction of Id1+ tdTomato+ RGLs 30 days after tamoxifen administration in control and Id4cKO mice. Loss of Id4 results in a 2-fold increase in the fraction of tdTomato+ RGLs positive for Id1 immunoreactivity, from 38.3 ± 4.5% to 74.1 ± 1.0% (p=0.0016). n = 3 for both control and Id4cKO. (K) Immunolabeling for GFAP, tdTomato, Id3 and DAPI staining in control and Id4cKO and control mice 30 days after tamoxifen administration. Yellow arrows indicate Id3-positive RGLs. Scale bar, 30 µm. (L) Quantification of the fraction of Id3+ tdTomato+ RGLs in (K). Id3 is increased by more than 8-fold in tdTomato+ RGLs following Id4 deletion, from 9.7 ± 1.0% to 75.3 ± 1.1% (p=1.87E-6). n = 4 for control mice and n = 3 for Id4cKO mice. Error bars represent mean ± SEM. Significance values: ns, p>0.05; *, p<0.05; **, p<0.01; ***, p<0.001; ****, p<0.0001. See also Figure 6—figure supplement 1.
-
Figure 6—source data 1
Original quantification of Ascl1, Ki67, Id1 and Id3 protein levels in RGLs following Id4 deletion.
- https://doi.org/10.7554/eLife.48561.020
Figure 6—figure supplement 1
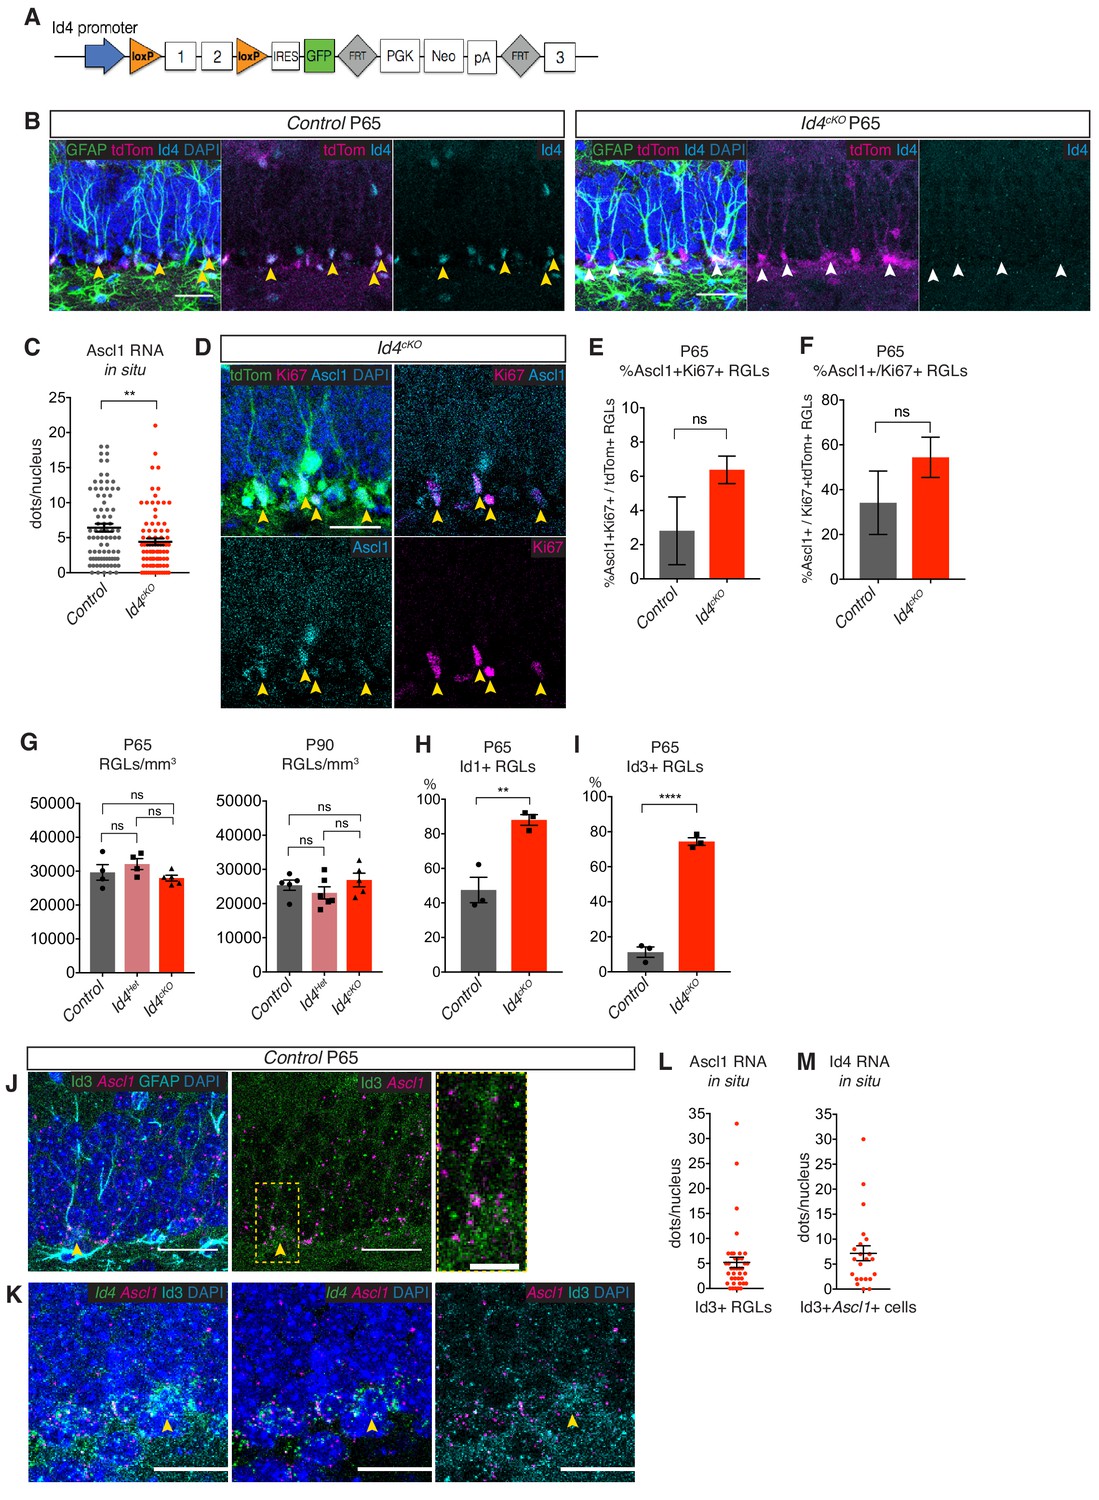
Expression of Id4, Ascl1, Ki67, Id1 and Id3 in RGLs following loss of Id4.
(A) Structure of the Id4flox allele. (B) Immunolabeling for GFAP, tdTomato, Id4 and DAPI staining in control and Id4cKO mice demonstrating Id4 elimination in Id4cKO mice after 5 days of tamoxifen administration. Yellow arrows indicate tdTom+Id4+ RGLs; white arrows indicate tdTom+Id4- RGLs. Scale bar, 30 µm. (C) Quantification of single molecule RNA in situ hybridization (RNAscope) for Ascl1 RNA in control and Id4cKO mice 5 days of tamoxifen administration. Ascl1 transcripts are decreased following Id4 deletion, suggesting the increased protein level is a result of post-transcriptional regulation. n = 2 mice for both control and Id4cKO. (D) Immunolabeling for tdTomato, Ascl1, Ki67 and DAPI staining in Id4cKO mice after 5 days of tamoxifen administration. Ascl1 and Ki67 are frequently co-expressed in tdTomato+ RGLs, as indicated by the yellow arrows. Scale bar, 30 µm. (E) Quantification of the co-expression of Ascl1 and Ki67 in control and Id4cKO mice 5 days of tamoxifen administration. The fraction of tdTomato+ RGLs expressing both Ascl1 and Ki67 is 2.8 ± 1.9% in control mice and 6.3 ± 0.8% in Id4cKO mice. n = 2. (F) Quantification of the fraction of proliferating (Ki67+) tdTomato+ RGLs co-expressing Ascl1 in control and Id4cKO mice 5 days of tamoxifen administration. 34.1 ± 14.1% of Ki67+tdTomato+ RGLs also express Ascl1 in control mice, which increases to 54.4 ± 8.9% in Id4cKO mice, indicating that Ascl1 and Ki67 expression are highly correlated. n = 2. (G) Quantification of the number of tdTomato+ RGLs per mm3 in the DG of control, Id4Het and Id4cKO mice 5 days and 30 days after tamoxifen administration shows no change in overall stem cell number following Id4 deletion at either time-point. Significance determined using ordinary one-way ANOVA. For control mice, n = 4 at P65 and n = 5 at P90; n = 4 for P65 and n = 6 for P90 Id4Het mice; n = 5 for Id4cKO mice at P65 and P90. (H–I) Quantification of the fraction of Id1-positive and Id3-positive tdTomato+ RGLs in Id4cKO mice compared with control mice 5 days after Id4 deletion shows both are strongly increased, from 47.4 ± 7.3% to 88.0 ± 3.1% for Id1 and 11.24 ± 2.9% to 74.4 ± 2.1% for Id3. n = 3 for control and Id4cKO mice. (J–M) Single molecule RNA in situ hybridization (RNAscope) for Ascl1 RNA (magenta) along with immunostaining for GFAP and Id3 in P65 control mice shows that most Id3+ RGLS express Ascl1 (J, yellow arrow; quantified in L) and the vast majority of Id3+Ascl1+ cells in the SGZ co-express Id4 (K, yellow arrow; quantified in M). Scale bar, 30 µm. Panel three in (J) shows magnification of yellow box; scale bar 10 µm. n = pooled data from three mice. Error bars represent mean ± SEM. Significance values: ns, p>0.05; *, p<0.05; **, p<0.01; ***, p<0.001; ****, p<0.0001.
Author response image 1

Id4 expression is absent in Id4floxed NSCs.
(A-B) Immunolabeling for Id4, Ascl1 and DAPI staining in Id4fl/fl NSCs in FGF2+BMP4 conditions, infected with either GFP-expressing or Cre-expressing adenovirus in order to delete Id4. No Id4 immunofluorescence was detectable in either control or Id4-deleted cells. Ascl1 levels were much high in both conditions, in contrast to wildtype cells in FGF2+BMP4 conditions. Scale bar, 30µm. (C) Quantification of Id4 expression levels by QPCR in wildtype (wt) control or Id4fl/fl NSCs. Id4 expression is detected and increases in wildtype cells following BMP4 treatment, but is not detected or is detected at very low levels in Id4fl/fl NSCs. n=1 for QPCR analysis; n=3 for RNAseq analysis.(D) Immunolabeling for Id1-4 in Id4fl/fl NSCs in FGF2 and FGF2+BMP4 conditions. Id1-3 are all detected in Id4fl/fl NSCs, but no signal for Id4 is detected. Scale bar, 30µm. (E) Immunolabeling for Id4 in Glastwt/wt;Id4fl/fl;tdTomatomice injected with tamoxifen for 5 days and analysed immediately. Id4 can be detected in many RGLs, suggesting they are not hypomorphic. Yellow arrows indicate Id4+tdtom+ RGLs. Scale bar, 30µm. Error bars represent mean ± SEM. Significance values: ns, p>0.05; *, p<0.05; **, p<0.01; ***, p<0.001; ****, p<0.0001.
Additional files
-
Source data 1
Transparent reporting summary statistics.
- https://cdn.elifesciences.org/articles/48561/elife-48561-data1-v2.pdf
-
Supplementary file 1
Key resources table.
- https://doi.org/10.7554/eLife.48561.021
-
Transparent reporting form
- https://doi.org/10.7554/eLife.48561.024
Download links
A two-part list of links to download the article, or parts of the article, in various formats.
Downloads (link to download the article as PDF)
Open citations (links to open the citations from this article in various online reference manager services)
Cite this article (links to download the citations from this article in formats compatible with various reference manager tools)
Id4 promotes the elimination of the pro-activation factor Ascl1 to maintain quiescence of adult hippocampal stem cells
eLife 8:e48561.
https://doi.org/10.7554/eLife.48561


