ML277 specifically enhances the fully activated open state of KCNQ1 by modulating VSD-pore coupling
- Washington University, United States
- Tencent AI Lab, China
Figures
Figure 1
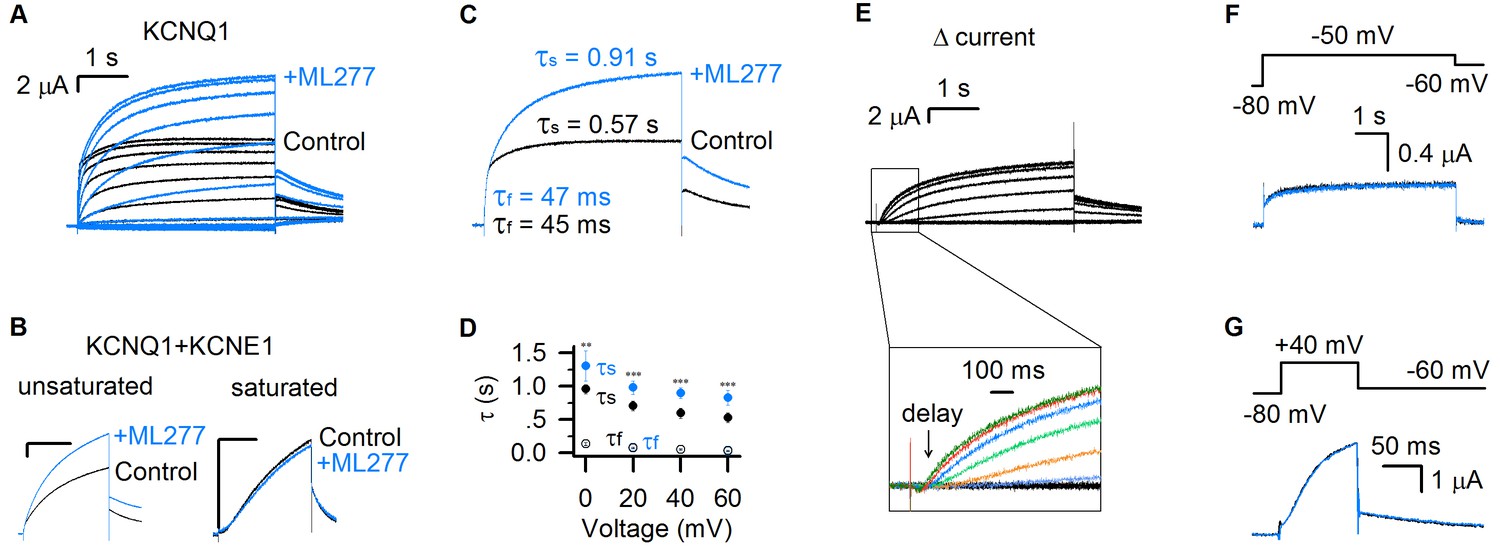
ML277 specifically changes the slow component of KCNQ1 currents.
(A) KCNQ1 currents from Xenopus oocytes recorded before (black) and after (blue) adding 1 µM ML277. The test voltages were from −120 mV to 80 mV with 20 mV increments, and then returned to −40 mV for measuring the tail currents. (B) 1 µM ML277 effects on KCNQ1 +KCNE1 channels with injected mRNA weight ratio of KCNQ1:KCNE1 = 300:1 (left, unsaturated KCNE1 binding) and 4:1 (right, saturated KCNE1 binding). The test voltages were 40 mV for 4 s, and then returned to −40 mV. (C) Activation time constants (τ) of KCNQ1 currents recorded at +40 mV before (black) and after (blue) adding ML277. The time constants of the fast component (τf) and slow component (τs) were 48 ± 3 ms and 0.60 ± 0.03 s for control, and 52 ± 3 ms and 0.99 ± 0.07 s for after adding ML277. The p values were 0.37 for τf, and 0.00091 for τs, t-test, n ≥ 4. (D) Averaged results of activation time constants (τf and τs) of KCNQ1 currents recorded at different voltages before (black) and after (blue) adding ML277. n ≥ 4. (E) The increased current by ML277 (IML277-IControl, Δ current) from panel A. The first 1 s activation currents were shown with insets of enlarged scales, and different colors were utilized to show the ‘delay’ of the increased currents at different voltages. (F–G) KCNQ1 currents recorded before (black) and after (blue) adding ML277 with 5 s time duration at −50 mV (F) and 100 ms time duration at +40 mV (G). The tail currents were recorded at −60 mV. Voltage protocols are shown on the top. All error bars in this and other figures are ± SEM.
Figure 2
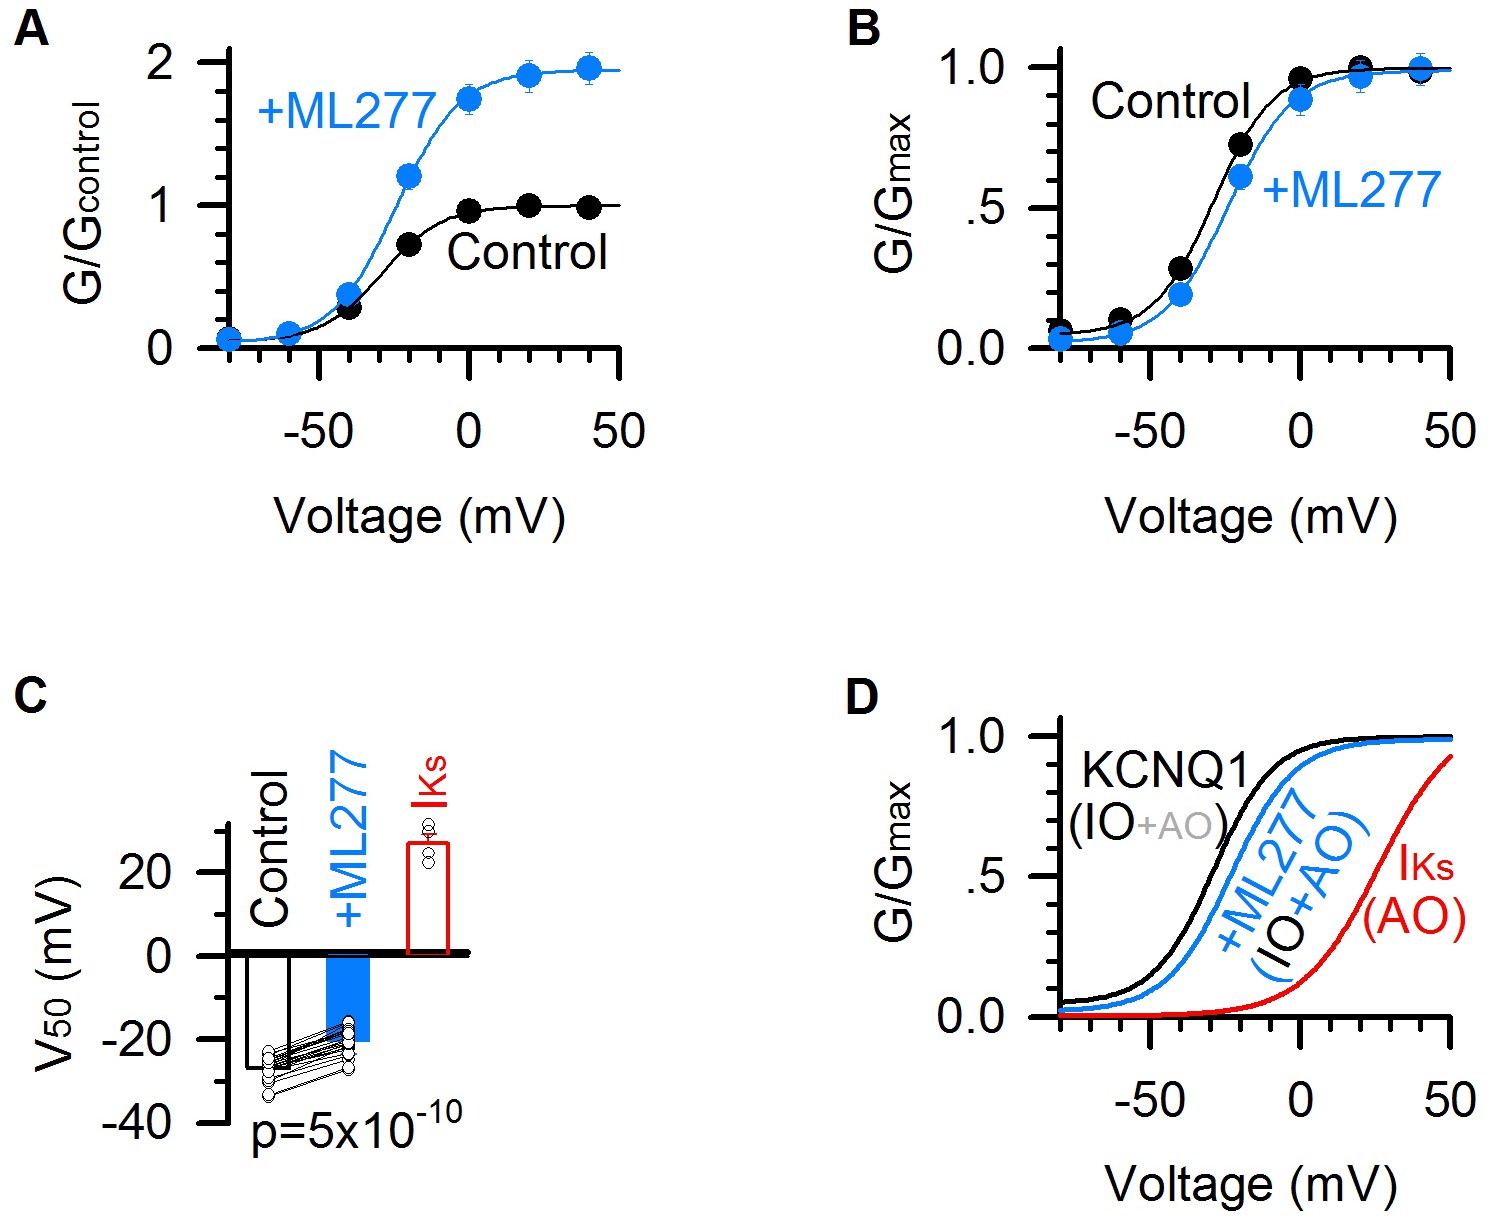
ML277 right shifts the G–V relationship of KCNQ1 channels.
(A) G–V relationships of KCNQ1 channels before (black) and after (blue) adding 1 µM ML277. Data points were fitted with a Boltzmann function. n = 25. (B) Normalized G–V relationships from panel A. (C) Averaged results of V50 of G–V relations (voltage at which the G–V is half maximal). The V50 for KCNQ1 channels is −26.8 ± 0.6 mV in control (black), and −20.3 ± 0.6 mV after adding ML277 (blue), with a significant difference (p=5×10⁻¹⁰, paired t test. n = 25). The V50 of IKs channels (KCNQ1 +KCNE1) (25.6 ± 3.1 mV, n = 4, red) is also for comparison. (D) G–V relationships of the KCNQ1 channels before (black) and after (blue) adding 1 µM ML277, and of IKs channels (red). IO/AO composition in each type of channels is indicated in parentheses.
Figure 3
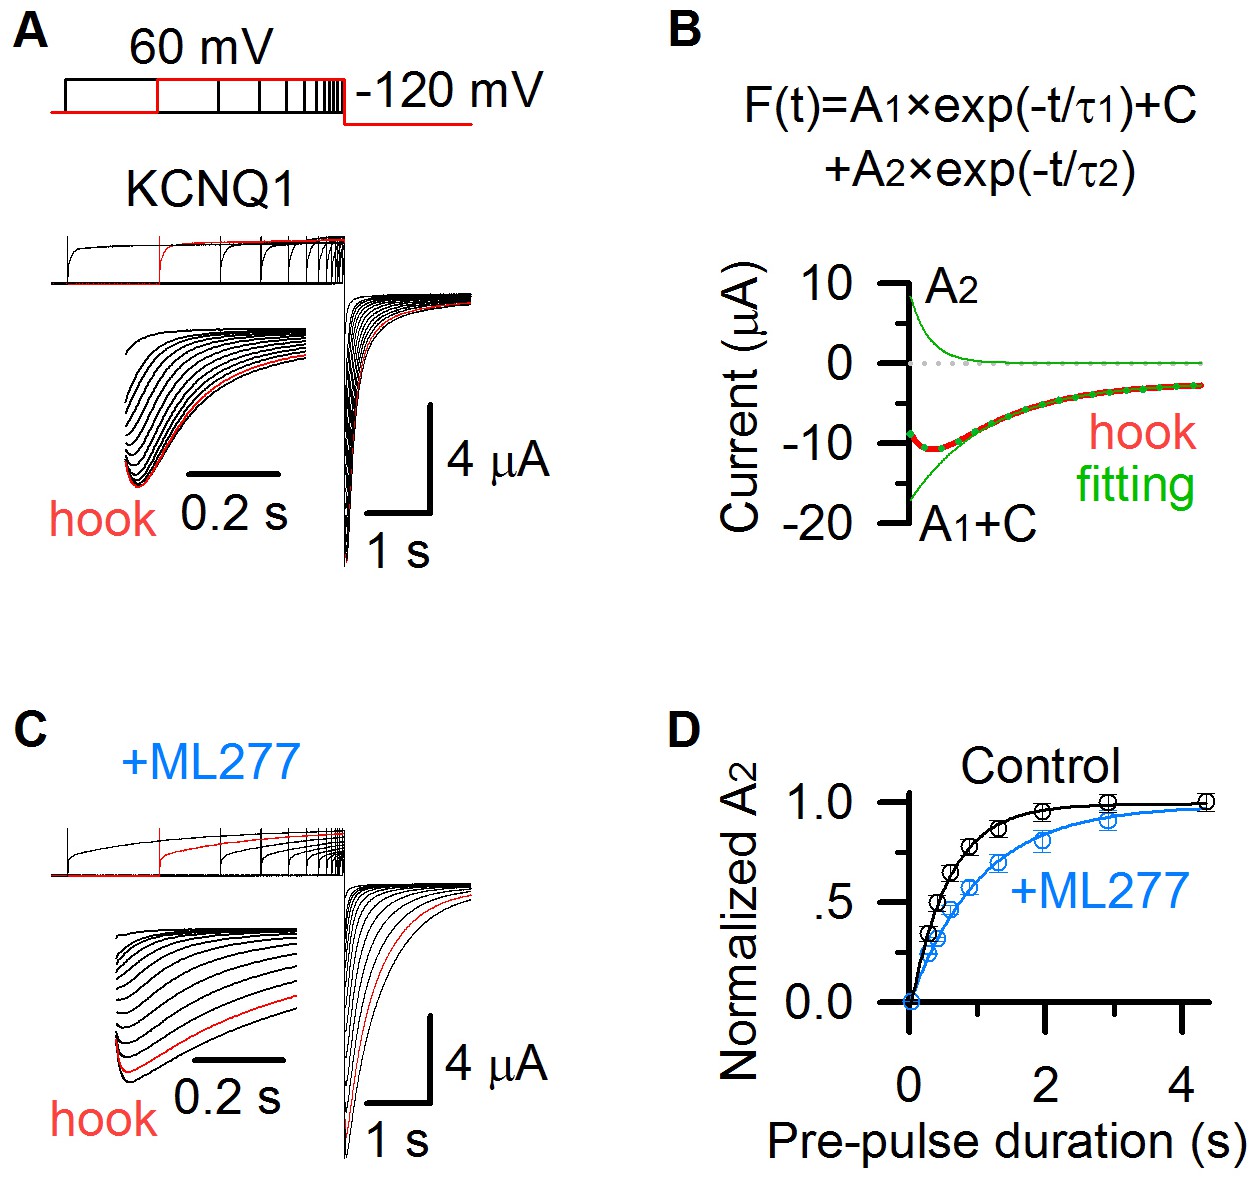
ML277 changes inactivation of KCNQ1 channels.
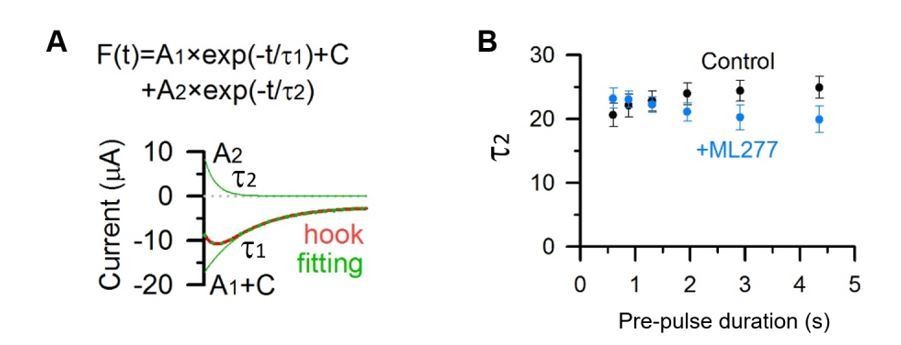
(A) KCNQ1 tail currents recorded with pre-pulses of increasing time duration in 100 mM K+ solution. The pre-pulses were +60 mV with time durations ranging between 0.03 and 4.355 s, and the test pulse was −120 mV for 2 s. The inset shows the hook in tail currents with an expanded time scale. The current recorded with a 2.913 s pre-pulse duration is shown in red. (B) KCNQ1 tail current recorded with a 2.913 s pre-pulse duration (red) was fitted with a double exponential function F(t) = A1×exp(−t/τ1)+ A2×exp(−t/τ2)+C (Hou et al., 2017). The fitting curve is shown in dotted green line, the deactivation component (A1 ×exp(−t/τ1)+C) and hook component (A2 ×exp(−t/τ2)) are shown in green lines. (C) KCNQ1 tail currents after applying ML277 recorded with pre-pulses of increasing time durations in 100 mM K+ solution, with the same voltage protocol shown as in panel A. The inset shows the hook in tail currents with an expanded time scale. The current recorded with a 2.913 s pre-pulse duration is shown in red. (D) Normalized A2 of KCNQ1 hook currents before (black) and after (blue) adding ML277 vs. time durations of the pre-pulse (n ≥ 4). Data are fitted with a single exponential function.
Figure 4

ML277 changes ion permeation of KCNQ1 channels.
(A) Currents from KCNQ1 channels before (left) and after (middle) adding 1 µM ML277, as well as IKs channels (KCNQ1 +KCNE1) (right) recorded in 100 mM K+ (black) or 100 mM Rb+ (gray) external solutions. The tail currents were elicited at −60 mV for 3 s from a pre-pulse of +60 mV for 5 s (top of left). (B) Averaged Rb+/K+ permeability ratios of tail current amplitudes for KCNQ1 before (3.1 ± 0.2, black) and after (1.1 ± 0.3) adding ML277, and for IKs channels (0.6 ± 0.1, red). All n ≥ 4.
Figure 5
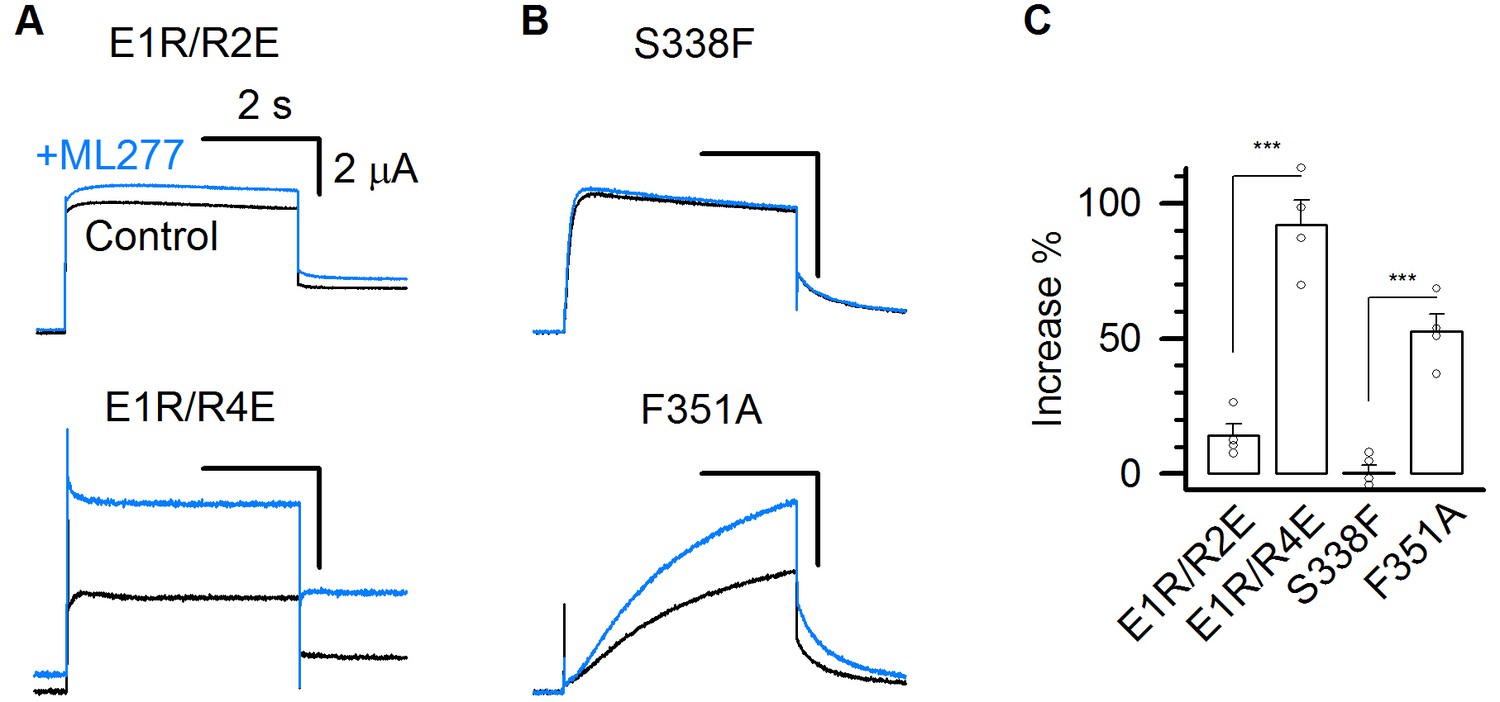
ML277 specifically increases the currents of mutant KCNQ1 channels that open only to the AO state.
(A–B) 1 µM ML277 effects on E1R/R2E, E1R/R4E, S338F, and F351A mutant KCNQ1 channels. Currents were elicited at +40 mV for 4 s and then returned to −40 mV to record the tail currents. (C) Averaged percentage of ML277 induced current increase on E1R/R2E (14.2 ± 4.2%), E1R/R4E (95.5 ± 8.5%), S338F (0.14 ± 3.1%), and F351A (52.5 ± 6.3%). n ≥ 4.
Figure 6
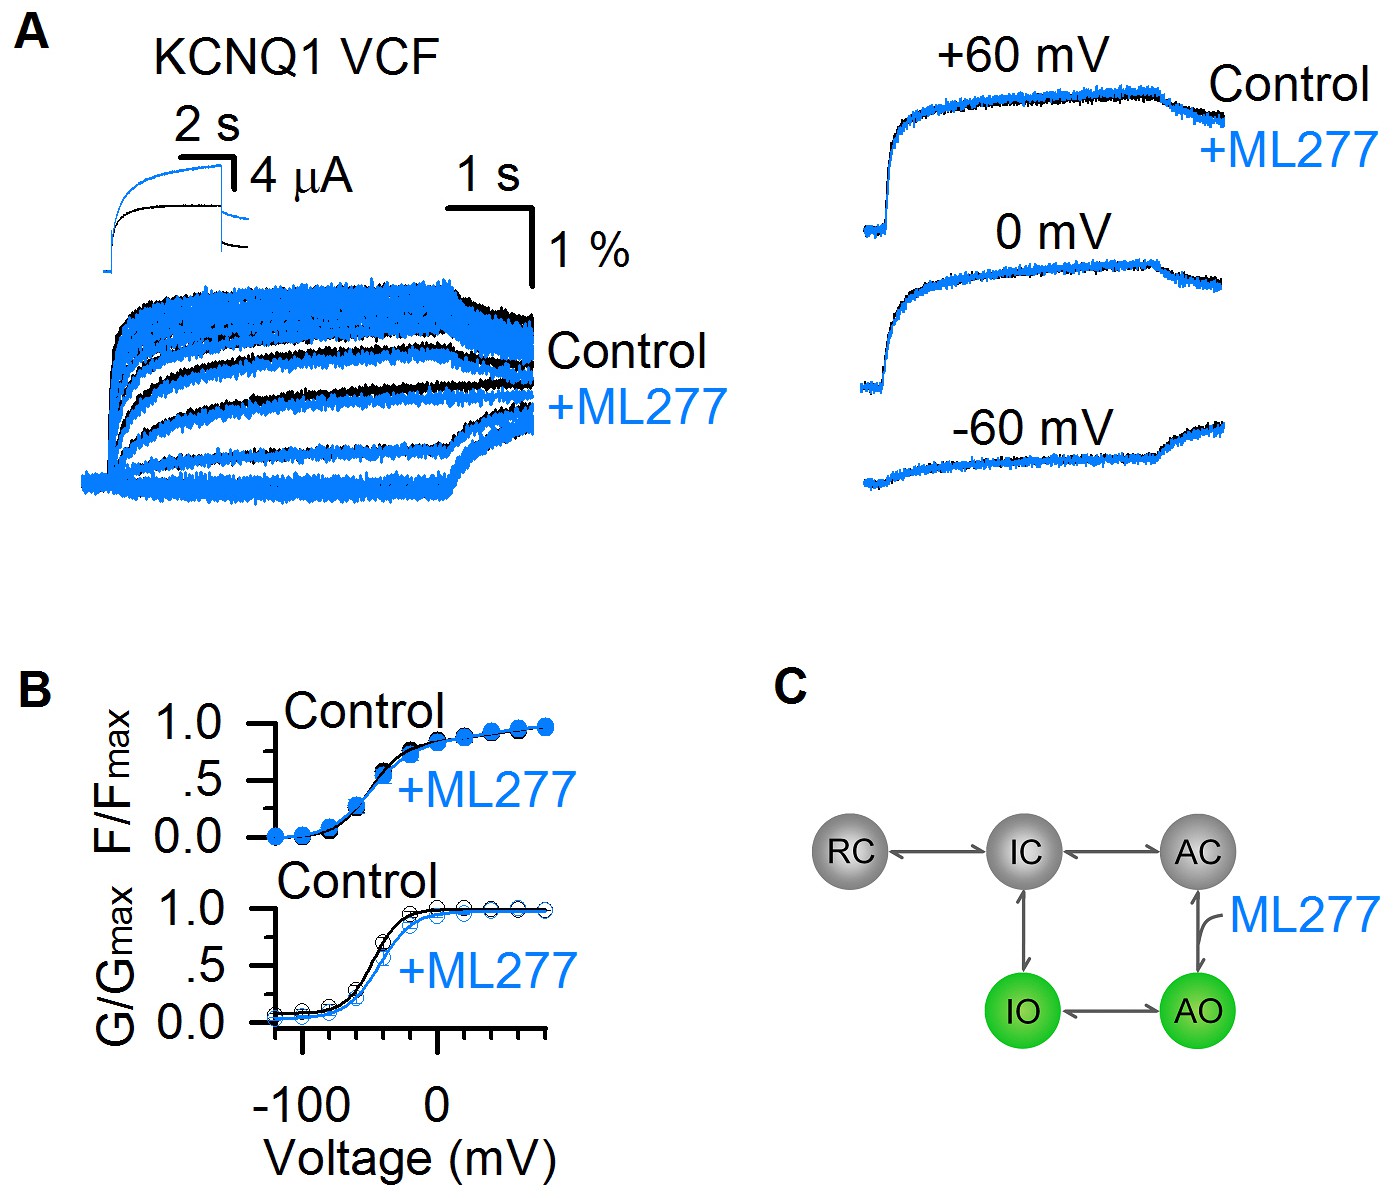
ML277 enhances currents of KCNQ1 channels but does not change VSD activation.
(A) Fluorescence signals showing voltage sensor activation of pseudo-WT KCNQ1 channel (KCNQ1-C214A/G219C/C331A) before (black) and after (blue) adding 1 µM ML277. The signals after applying ML277 were normalized to the peak from the control to correct the effects of photobleaching. Scale bars are for the fluorescence signals before ML277 application. Inset shows current traces of pseudo-WT KCNQ1 channel before (black) and after (blue) adding ML277 at +40 mV. Right panels show VCF results of pseudo-WT KCNQ1 channel before (black) and after (blue) adding ML277 recorded at −60 mV, 0 mV, and 60 mV. (B) Fluorescence-voltage (F–V, n = 4) and G–V (n = 3) relationships of pseudo-WT KCNQ1 before (black) and after (blue) adding ML277. (C) A cartoon scheme to illustrate that ML277 specifically enhances E-M coupling when the VSD is at the activated state.
Figure 7 with 1 supplement
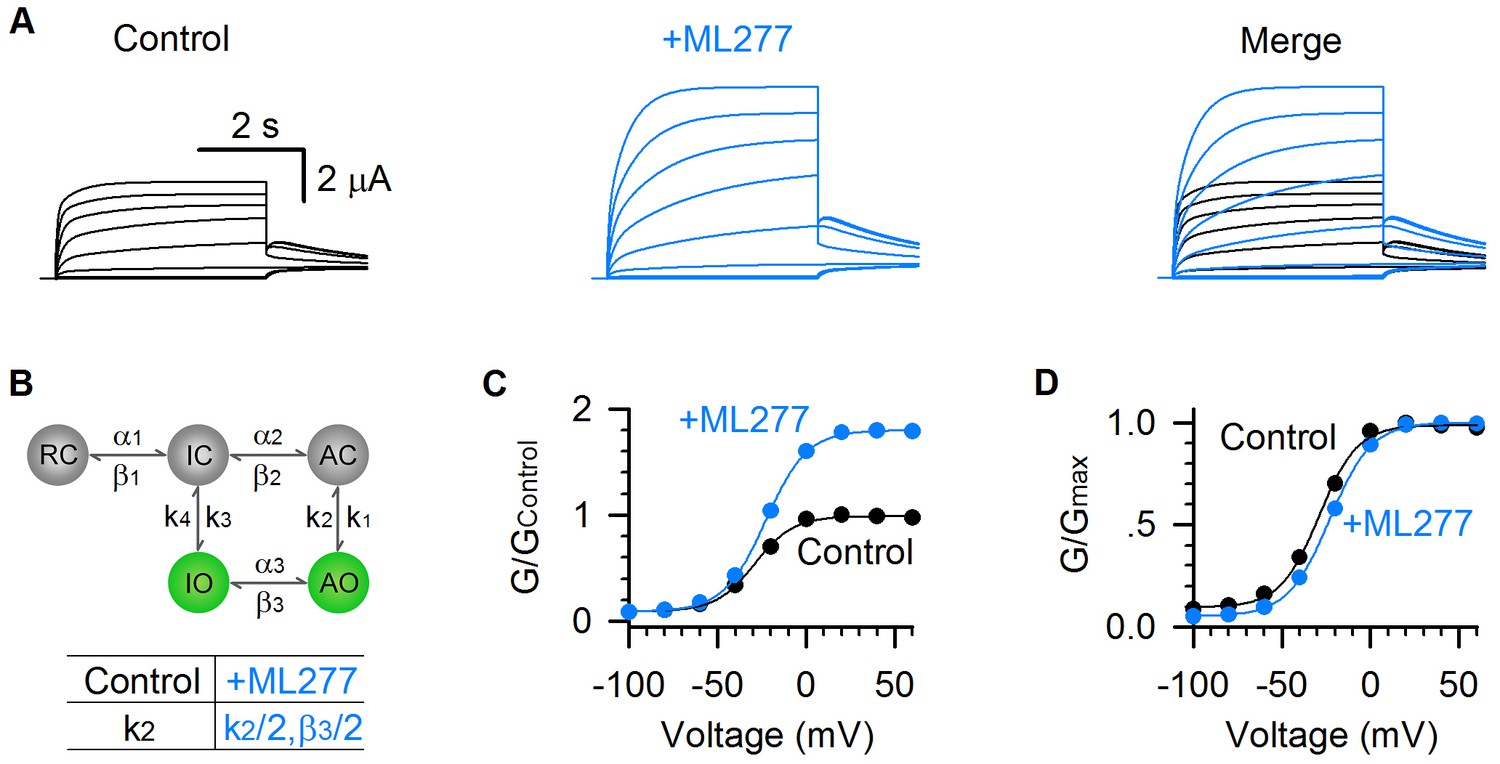
Model simulations of ML277 effects on KCNQ1 channels.
(A) Model simulations of KCNQ1 activation currents before (black) and after (blue) adding ML277. (B) Five-state Markov model to show the two open states gating processes of KCNQ1 channel. α and β are voltage-dependent transitions. k1-4 are E-M coupling rates (constant). Reducing the k2 by half (k2 = 853.08 for control, and k2 = 426.54 for adding ML277) can mimic the ML277 effects on KCNQ1 channel. To balance the model, β3 is also reduced by half for adding ML277 (see Materials and methods). (C–D) G–V relationships of simulated KCNQ1 before (black) and after (blue) adding ML277. Data points were fitted with a Boltzmann function.
Figure 7—figure supplement 1
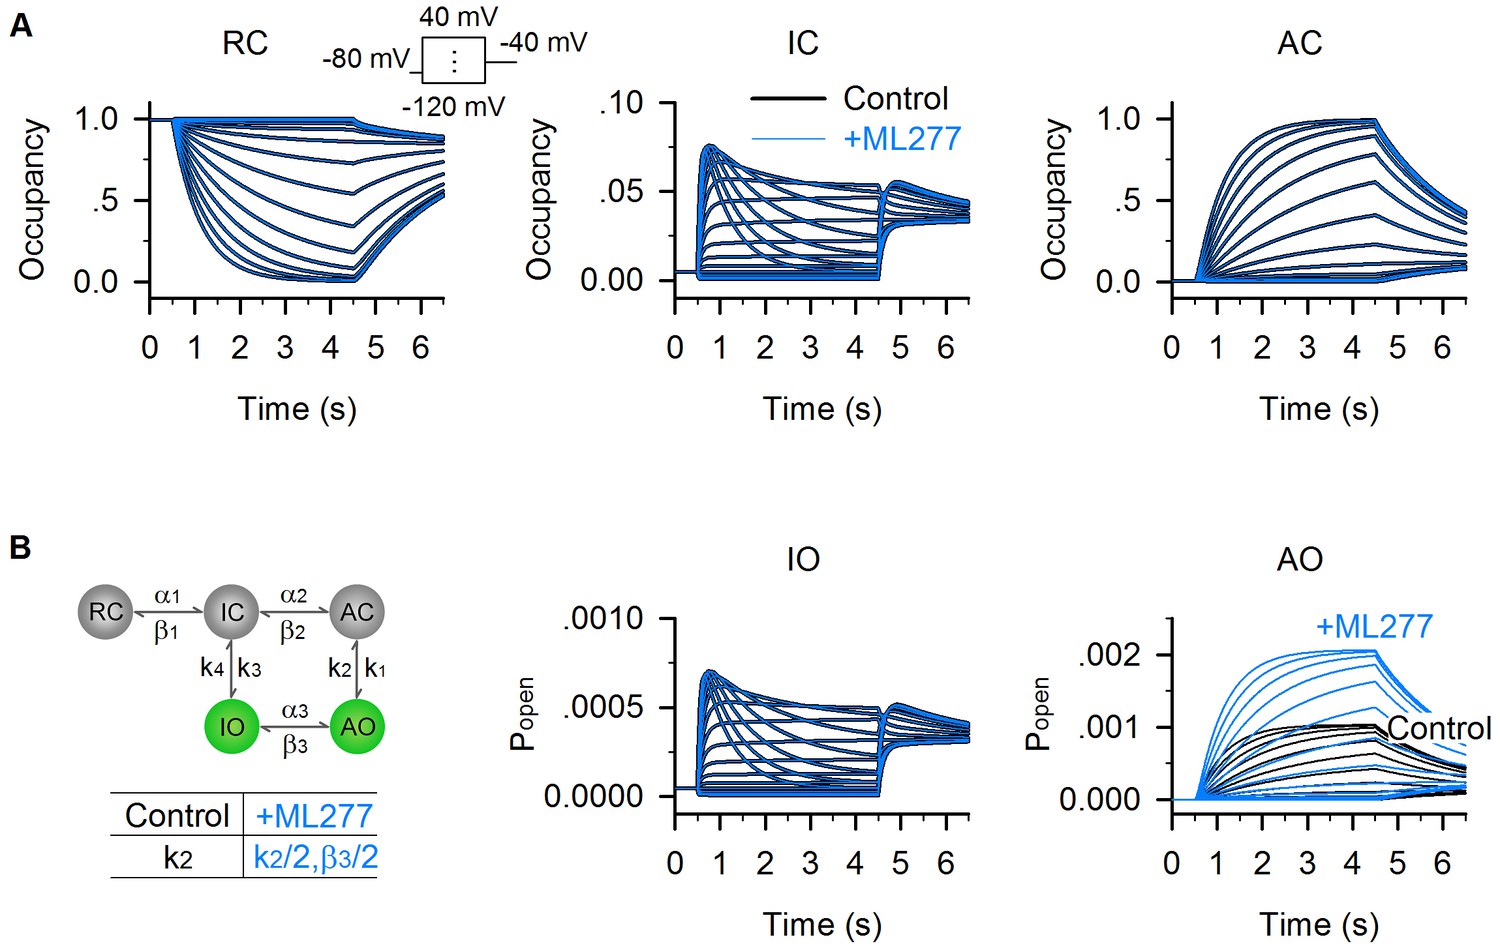
Model simulations of all-state occupancy before and after adding ML277.
(A) Model simulations of KCNQ1 all-state occupancy before (black) and after (blue) adding ML277. The voltage protocol was from −120 mV to +40 mV in increment of 10 mV from the −80 mV holding potential, and then stepped to −40 mV. The state occupancies are very similar for RC, IC, AC, and IO states, except for the AO state shows a clear increase after adding ML277. (B) Five-state Markov model. 1/2X K2 and 1/2X β3 can mimic the ML277 effects on KCNQ1 channel.
Author response image 1
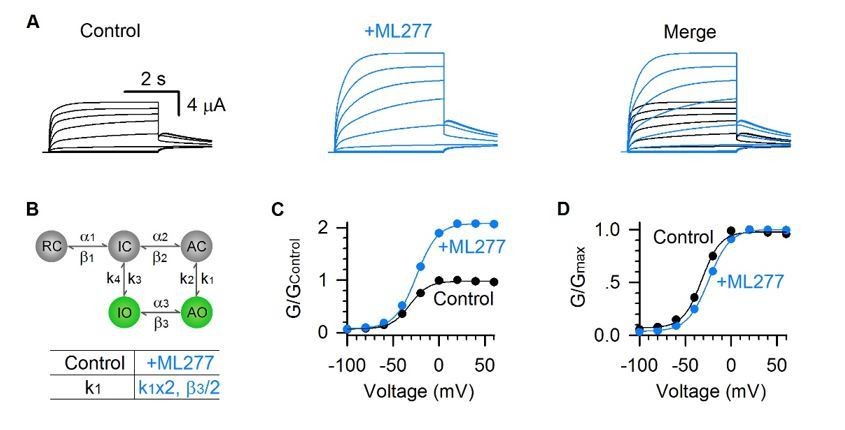
Model simulations of ML277 effects by 2X k1 and 1/2X β3.
(A) Model simulations of KCNQ1 activation currents before (black) and after (blue) adding ML277. (B) Five-state Markov model to show the two open states gating processes of KCNQ1 channel. α and β are voltage-dependent transitions. k1-4 are VSD-pore coupling rates (constant). 2X K1 and 1/2X β3 can mimic the ML277 effects on KCNQ1 channel. (C-D) G–V relationships of simulated KCNQ1 before (black) and after (blue) adding ML277. Data points were fitted with a Boltzmann function.
Author response image 2
Model simulations of deactivation kinetics by ML277.
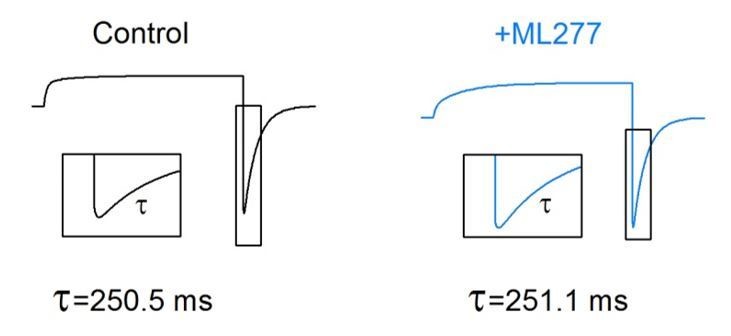
Model simulations of KCNQ1 channel before (black) and after (blue) adding ML277. The activation voltage was +40 mV and then stepped to −120 mV to induce a hook at the tail current. The insets show the tail currents with an expanded time scale. The time course of the deactivation currents was shown as τ. No obvious change of the deactivation kinetics was observed by ML277.
Author response image 3
Kinetics of the hook current before and after adding ML277.
(A) KCNQ1 tail current recorded with a 2.913 s pre-pulse duration (red) was fitted with a double exponential function F(t) = A1×exp(−t/τ1)+ A2×exp(−t/τ2)+ C (Hou et al., 2017). The fitting curve is shown in dotted green line, the deactivation component (A1×exp(−t/τ1)+C) and hook component (A2×exp(−t/τ2)) are shown in green lines. (B) Tail currents in Figure 3A, C were fitted with a double exponential function and time constants of the hook current before (black) and after (blue) adding ML277 were plotted over pre-pulse durations.
Additional files
-
Transparent reporting form
- https://doi.org/10.7554/eLife.48576.010
Download links
A two-part list of links to download the article, or parts of the article, in various formats.
Downloads (link to download the article as PDF)
Open citations (links to open the citations from this article in various online reference manager services)
Cite this article (links to download the citations from this article in formats compatible with various reference manager tools)
ML277 specifically enhances the fully activated open state of KCNQ1 by modulating VSD-pore coupling
eLife 8:e48576.
https://doi.org/10.7554/eLife.48576


