PHLPP1 counter-regulates STAT1-mediated inflammatory signaling
- University of California, San Diego, United States
Figures
Figure 1

PHLPP1 knock-out mice are protected against sepsis-induced death.
(A) Survival curve of WT and Phlpp1-/- mice i.p. infected with 1 × 10⁷ cfu of E. coli. Values are expressed as percent survival of 15 mice for each genotype. **p<0.01 by log-rank test. (B) Survival curve of WT and Phlpp1-/- mice i.p. injected with 15 mg/kg LPS. Values are expressed as percent survival of 16 mice for each genotype. *p<0.05 by log-rank test. (C–E) ELISA showing IL-6 (C), IL-1β (D) and IL-10 (E) levels in serum at the indicated times after i.p. injection of 10 mg/kg LPS. Data represent mean ± SEM. Statistics analyzed by Student’s t-test *p<0.05, **p<0.01.
Figure 2

Loss of PHLPP1 modulates the expression of inflammatory genes in macrophages.
(A) Heat map for mRNA-Seq expression of the 1,654 mRNA transcripts regulated greater than two-fold with a FDR < 0.05 in BMDMs isolated from WT or Phlpp1-/- animals treated with 100 ng/ml KLA for 1, 6 or 24 hr. Data represent the log2 difference between the mRNA expression in Phlpp1-/- macrophages compared to wild-type macrophages. (B) Gene ontology analysis for the 199 elevated (red arrow) or 144 decreased (blue arrow) transcripts in Phlpp1-/- macrophages compared to wild-type macrophages. (C) De novo motif analysis using HOMER (Hypergeometric Optimization of Motif EnRichment) for the 199 promoters corresponding to the genes elevated in the Phlpp1-/- macrophages. (D) Pie graph showing the percentage of promoters of elevated genes that contain STAT or IRF binding motifs. (E–G) Normalized mRNA-Seq values for (E) Cd69 (F) Ifit2 and (G) Gbp5 mRNA in BMDMs isolated from WT or Phlpp1-/- animals treated with 100 ng/ml KLA for 0, 1, 6, or 24 hr. RPKM – Reads Per Kilobase Million. Values are expressed as mean ± SEM. *p<0.05 (Student’s t-test) compared to WT cells. See also Supplementary file 1 and Supplementary file 2.
Figure 3
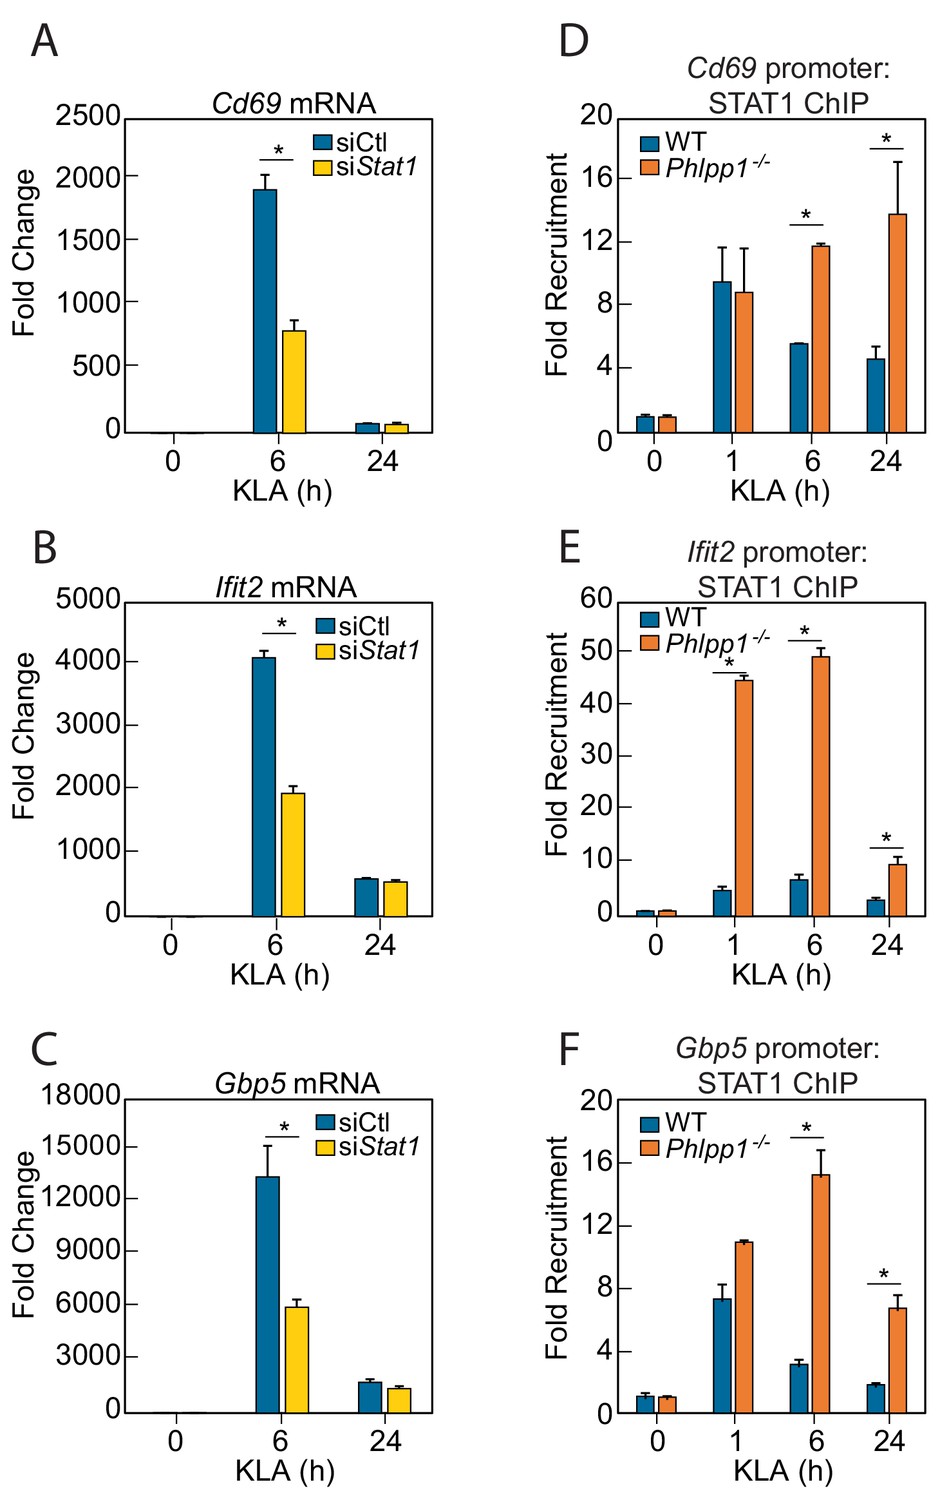
PHLPP1 controls STAT1 genomic recruitment and STAT1-dependent gene expression.
(A–C) Quantitative PCR analysis for (A) Cd69 (B) Ifit2 and (C) Gbp5 mRNA isolated from thioglycollate-elicited peritoneal macrophages treated with control siRNA (siCtl) or siRNA specifically targeting Stat1 (siStat1) and subsequently treated with vehicle or 100 ng/ml KLA for 6 or 24 hr. Values are expressed as mean ± SEM from replicate experiments. *p<0.05 (Student’s t-test) compared to siCtl treated cells. (D–F) Quantitative PCR analysis of ChIPs for STAT1 at the (D) Cd69 (E) Ifit2 and (F) Gbp5 promoter in BMDMs isolated from WT or Phlpp1-/- animals and treated with 100 ng/ml KLA for 0, 1, 6 or 24 hr. Values are expressed as mean ± SEM. *p<0.05 (Student’s t-test) compared to WT cells.
Figure 4
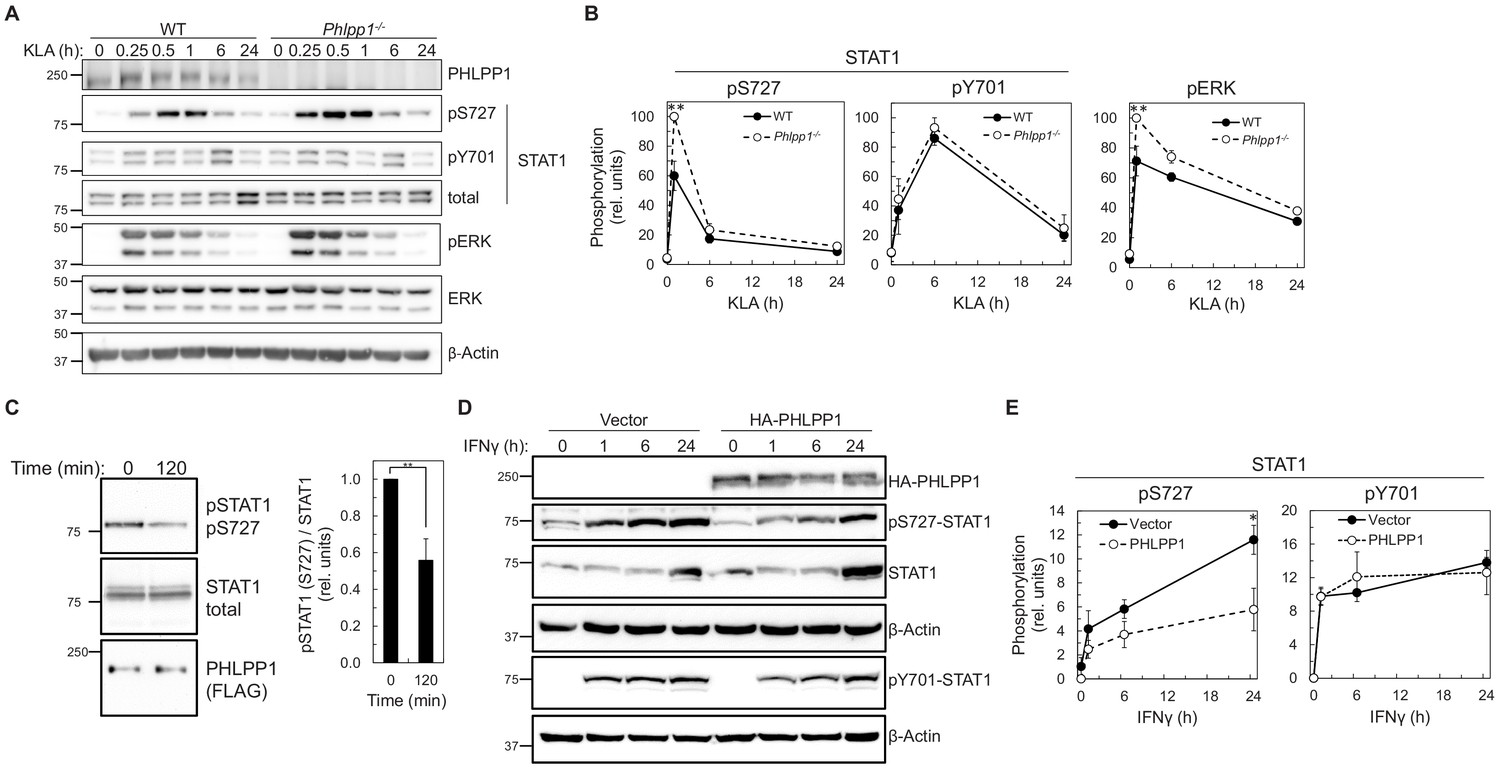
PHLPP1 regulates STAT1 phosphorylation on Ser727.
(A) Western blot analysis of primary BMDM from WT or Phlpp1-/- mice treated with 100 ng/ml KLA for the indicated times and probed with the indicated antibodies. (B) Ratio of pSTAT1 (S727):total STAT1, pSTAT1 (Y701):total STAT1 or phosphoERK (T202/Y204):total ERK normalized to the highest value; data represent the mean ± SEM of five independent experiments as in (A). **p<0.01 (Student’s t-test) compared to WT cells. (C) Western blot analysis of an in vitro phosphatase assay of purified and phosphorylated STAT1 and immunoprecipitated FLAG-PHLPP1, incubated for 0 or 120 min at 30°C (on the left). On the right, quantification of pSTAT1 (S727) divided by total STAT1 and normalized to 0 time point. Values are expressed as mean ± SEM of three independent experiments. **p<0.01 (Student’s t-test). (D) Western blot analysis of HEK-293T cells over-expressing vector control (Vector) or HA-tagged PHLPP1 and treated with 10 ng/ml IFNγ for 0, 1, 6, or 24 hr. (E) Graphs represent the quantification of three independent experiments as presented in (D). Values are expressed as mean relative units of pSTAT1 (S727) or (Y701) divided by β-Actin and normalized to vector 0 hr ± SEM. *p<0.05 (Student’s t-test) compared to vector control expressing cells. See also Figure 6—figure supplement 1.
Figure 5
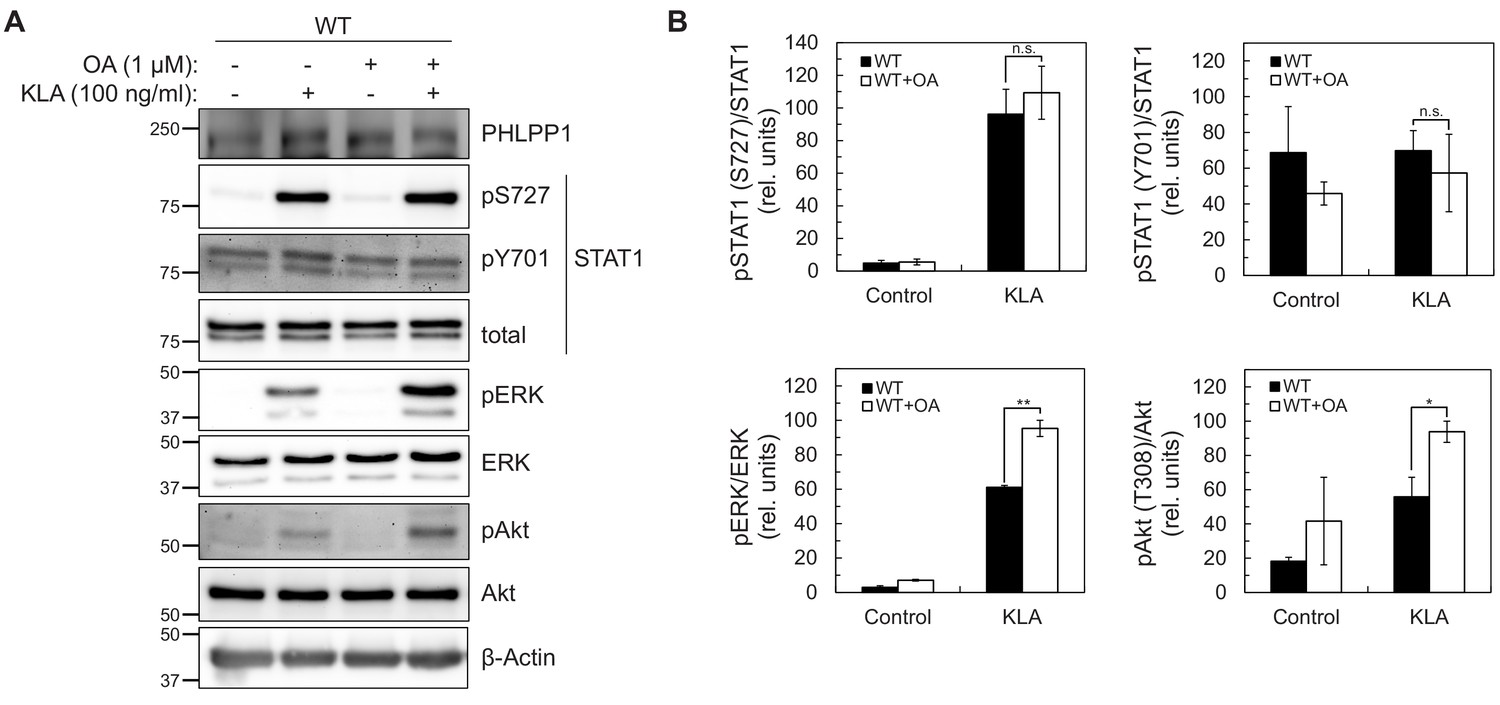
STAT1 Ser727 phosphorylation and transcriptional activity are insensitive to okadaic acid.
(A) Western blot analysis of primary BMDMs from WT or Phlpp1-/- mice treated with 100 ng/ml KLA for 0 or 30 min followed by treatment with 1 µM OA or DMSO control for an additional 15 min and probed with the indicated antibodies; pAkt antibody recognizes phosphorylated Thr308. (B) Graphs represent the quantification of three independent experiments as presented in (A). Values are expressed as the mean ± SEM of the ratio of pSTAT1 (S727) to total STAT1 normalized to the highest value; *p<0.05, **p<0.01 and n.s.- non-significant (Student’s t-test).
Figure 6 with 4 supplements

PHLPP1 suppresses STAT1 transcriptional activity by a mechanism that depends on its catalytic activity and an NLS in its N-Terminal Extension.
(A) Luciferase reporter assay in WT (+/+) and Phlpp1-/- (-/-) MEFs over-expressing GAS luciferase reporter and treated with 10 ng/ml IFNγ for 0, 1, 6, or 24 hr in combination with 1 µM OA or DMSO control treatment for 15 min. Values are expressed as mean of relative light units (RLU) ± SEM of three independent experiments. *p<0.05 (Student’s t-test). See also Figure 6—figure supplement 1. (B) Schematic of HA-tagged PHLPP1 constructs used in this study: the PP2C domain of PHLPP1 (PP2C), nuclear targeted PP2C with NLS (NLS- PP2C), NLS-PP2C with active site residues Asp1210 and Asp1413 mutated to Ala (NLS-PP2C DDAA), and full-length PHLPP1 (PHLPP1). (C) Luciferase reporter assay in HEK-293T cells over-expressing GAS luciferase reporter in combination with either vector control (vector, black) or the constructs described in (B) and treated with 10 ng/ml IFNγ for 0, 1, 6, or 24 hr. Values are expressed as mean RLU ± SEM of four independent experiments. All data points at 24 hr were significant against each other except for vector to PP2C, vector to NLS-PP2C DDAA, P1 to NLS-PP2C, and PP2C to NLS-PP2C DDAA. *p<0.05, **p<0.01 (Student’s t-test). (D) Schematic showing position and sequence of bipartite NLS in the NTE, and NLS mutants used in this study. (E) HeLa cells over-expressing the constructs used in Figure 6D were stained for HA (green), α-Tubulin (red), and DAPI (blue). Scale bar indicates 15 µm. (F) The Nuclear to Cytoplasmic ratio was calculated for each construct (300 cells per construct) and values are expressed as mean ± SEM. All data points were significant against each other except for NLS1 to NLS2, and NLS2 to NLS1/2. **p<0.01, n.s. – non-significant (Student’s t-test). (G) Luciferase reporter assay in HEK-293T cells over-expressing a GAS luciferase reporter in combination with either vector control (vector, black) or the constructs described in (D) however in the context of a full-length PHLPP1 and treated with 10 ng/ml IFNγ for 0, 1, 6, or 24 hr. Values are expressed as mean RLU ± SEM of eight independent experiments. *p<0.05, **p<0.01, n.s. - non-significant (Student’s t-test).
Figure 6—figure supplement 1
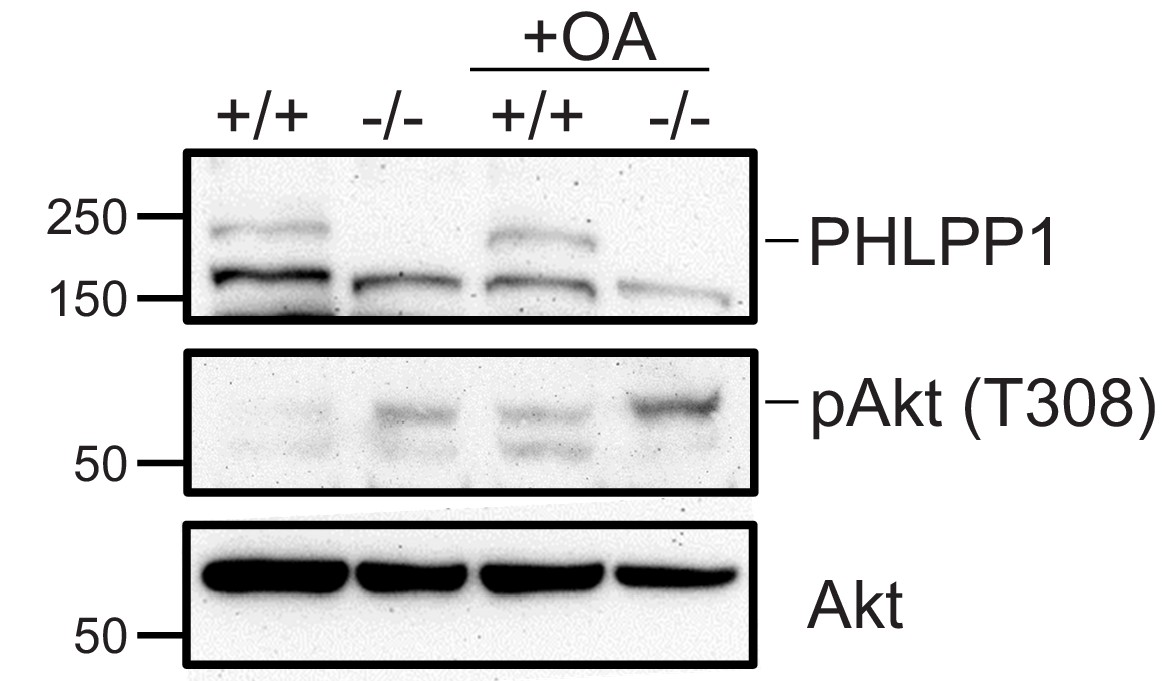
STAT1 phosphorylation and transcriptional activity are insensitive to okadaic acid.
Western blot analysis of extracts used in the luciferase reporter assay in WT (+/+) and Phlpp1-/- (-/-) MEFs over-expressing GAS luciferase reporter and treated with 10 ng/ml IFNγ for 0 or 24 hr in combination with 1 μM OA or DMSO control treatment for 15 min. Phosphorylation of the PP2A target site on Akt (Thr308) was increased upon OA treatment.
Figure 6—figure supplement 2
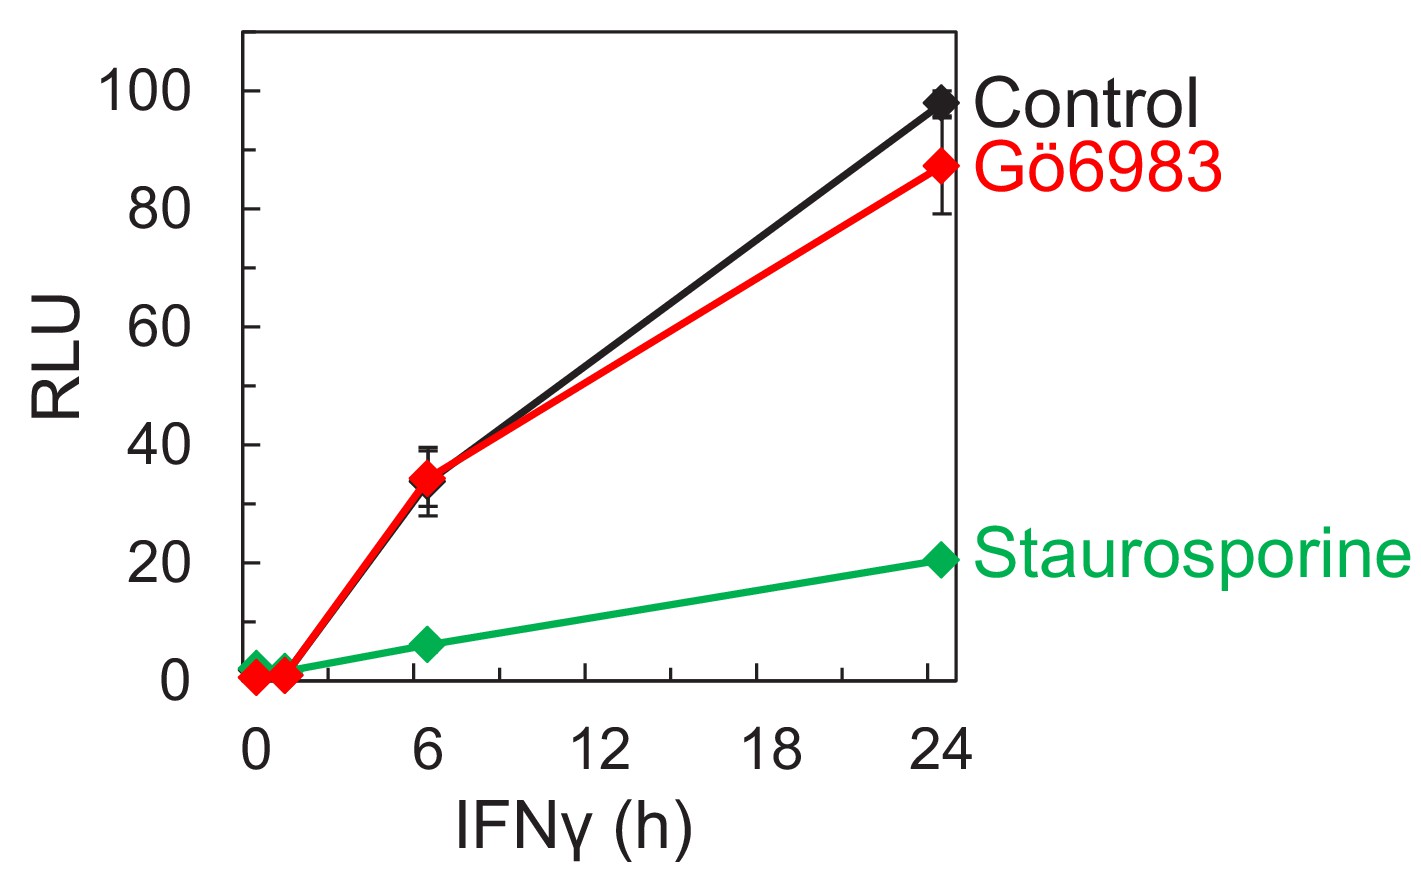
Luciferase reporter assay in HEK-293T cells over-expressing GAS luciferase reporter and treated with 10 ng/ml IFNγ for 0, 1, 6, or 24 hr followed by 250 nM Gö6983 for 10 min, 1 µM staurosporine for 30 min, or DMSO control.
Values are expressed as mean of RLU ± SEM of three independent experiments.
Figure 6—figure supplement 3
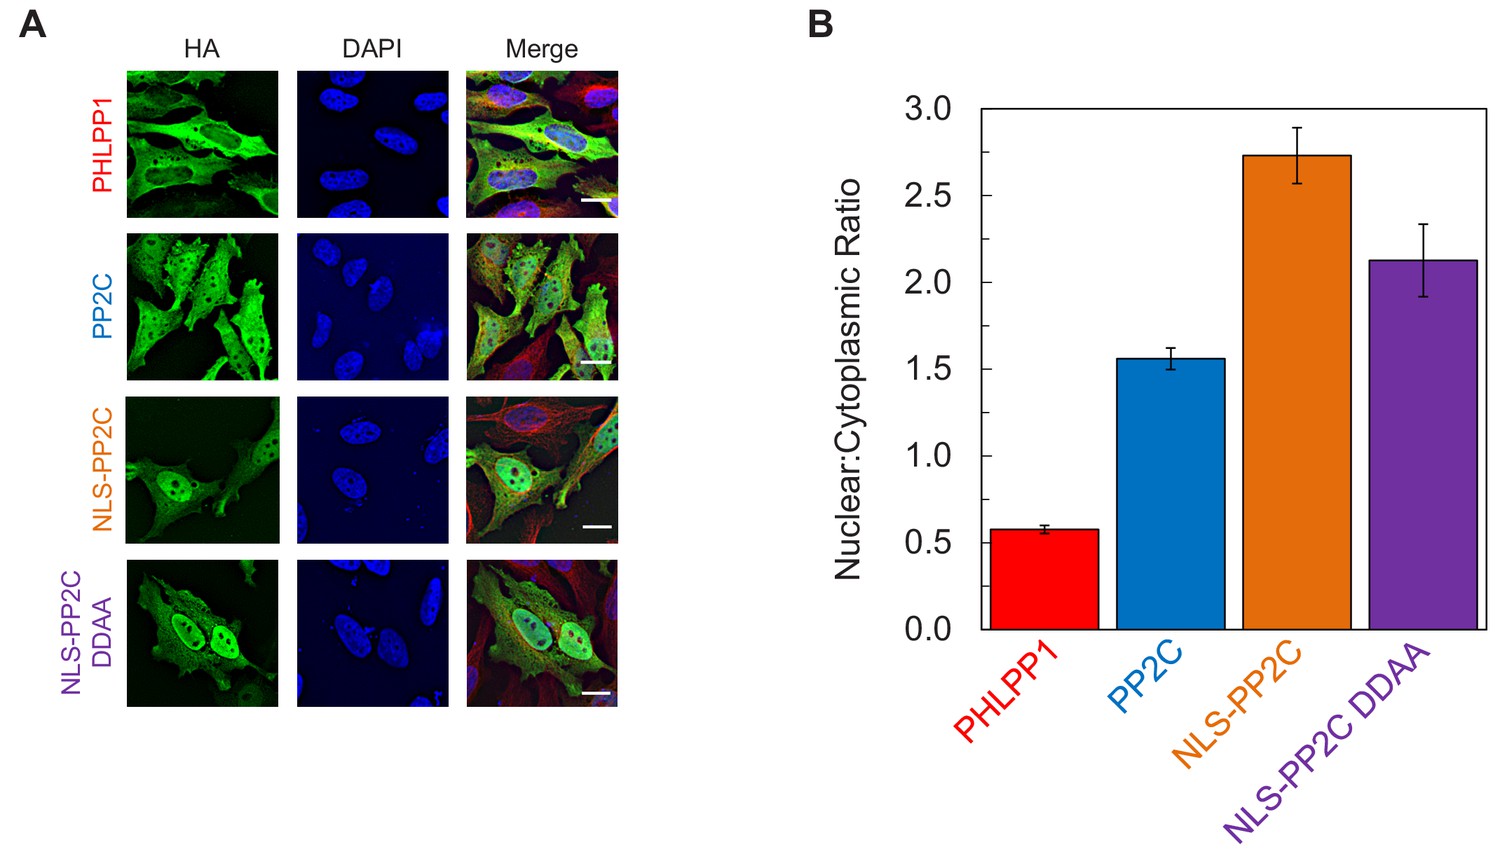
The phosphatase activity of PHLPP1 is important for the regulation of STAT1 activity.
(A) HeLa cells over-expressing the HA-tagged constructs used in Figure 6B were stained for HA (green), α-Tubulin (red), and DAPI (blue). Scale bar indicates 15 µm. (B) The Nuclear to Cytoplasmic ratio was calculated for each construct and values are expressed as mean ± SEM of: 169 cells for P1, 101 cells for PP2C, 100 cells for NLS-PP2C, and 101 cells for NLS-PP2C DDAA.
Figure 6—figure supplement 4
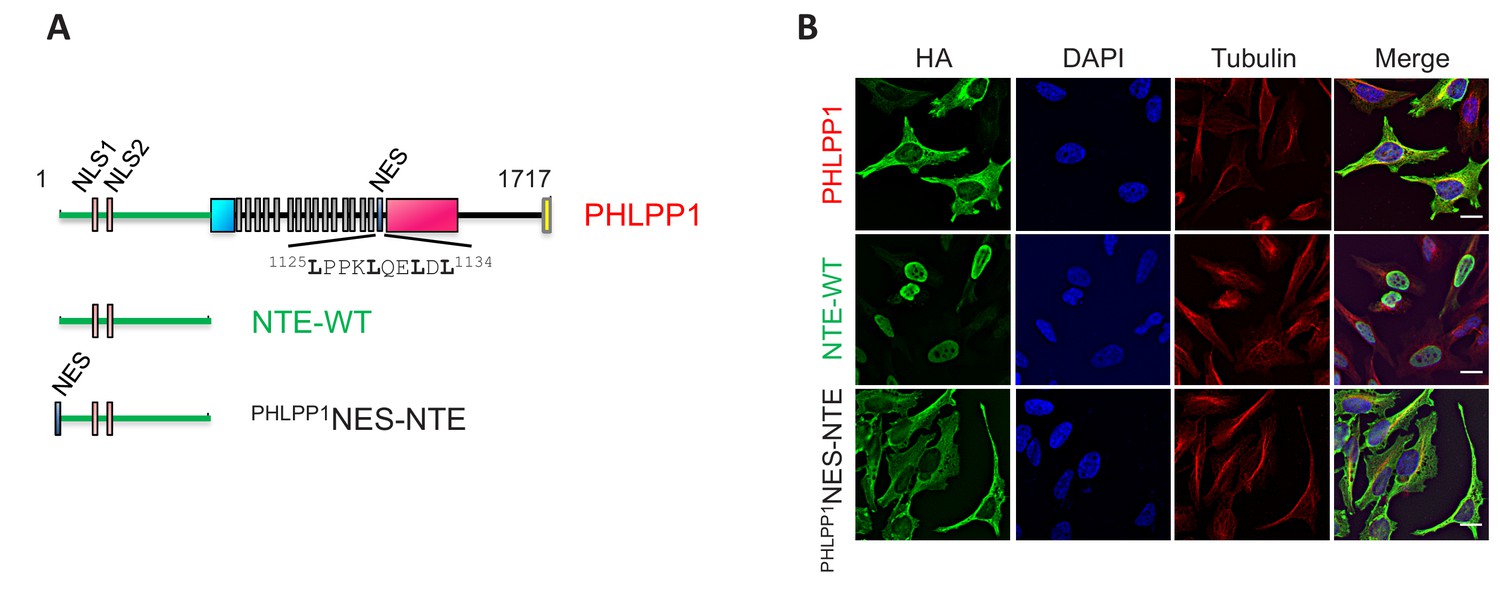
PHLPP1 has an NES.
(A) Schematic showing position of NES (residues 1125–1134) immediately following the last LRR. (B) HeLa cells over-expressing PHLPP1, the NTE from WT PHLPP1 (NTE-WT) or the NTE-WT in which the PHLPP1 NES was fused to the N-terminus (PHLPP1NES-NTE) were stained for HA (green), α-Tubulin (red), and DAPI (blue). Scale bar indicates 15 µm.
Figure 7

STAT1 associates with the N-Terminal Extension of PHLPP1.
(A) Luciferase reporter assay in HEK-293T cells over-expressing GAS luciferase reporter in combination with either vector control (Vector, black), PHLPP1 NTE (NTE, green), PHLPP1ΔNTE (blue), or PHLPP1 (red) and treated with 10 ng/ml IFNγ for 0, 1, 6, or 24 hr. Values are expressed as mean of RLU ± SEM of five independent experiments. All data points at 24 hr were significant against each other except for vector to PHLPP1ΔNTE, and PHLPP1ΔNTE to PHLPP1. *p<0.05, **p<0.01, ***p<0.001 (Student’s t-test). (B) Western blot analysis of detergent-solubilized lysate of HEK-293T cells transfected with vector control (Vector), HA-tagged NTE of PHLPP1 (HA-NTE), PHLPP1 with the NTE deleted (HA-P1ΔNTE) or full-length PHLPP1 (HA-P1) and immunoprecipitated (IP) using HA antibody; blots were probed for co-IP of STAT1 tag using GFP antibody. (C) Quantification of GFP-STAT1 IP divided by HA IP and normalized to HA-NTE IP. Values are expressed as mean ± SEM of three independent experiments. ***p<0.001, ****p<0.0001 (Student’s t-test).
Figure 8
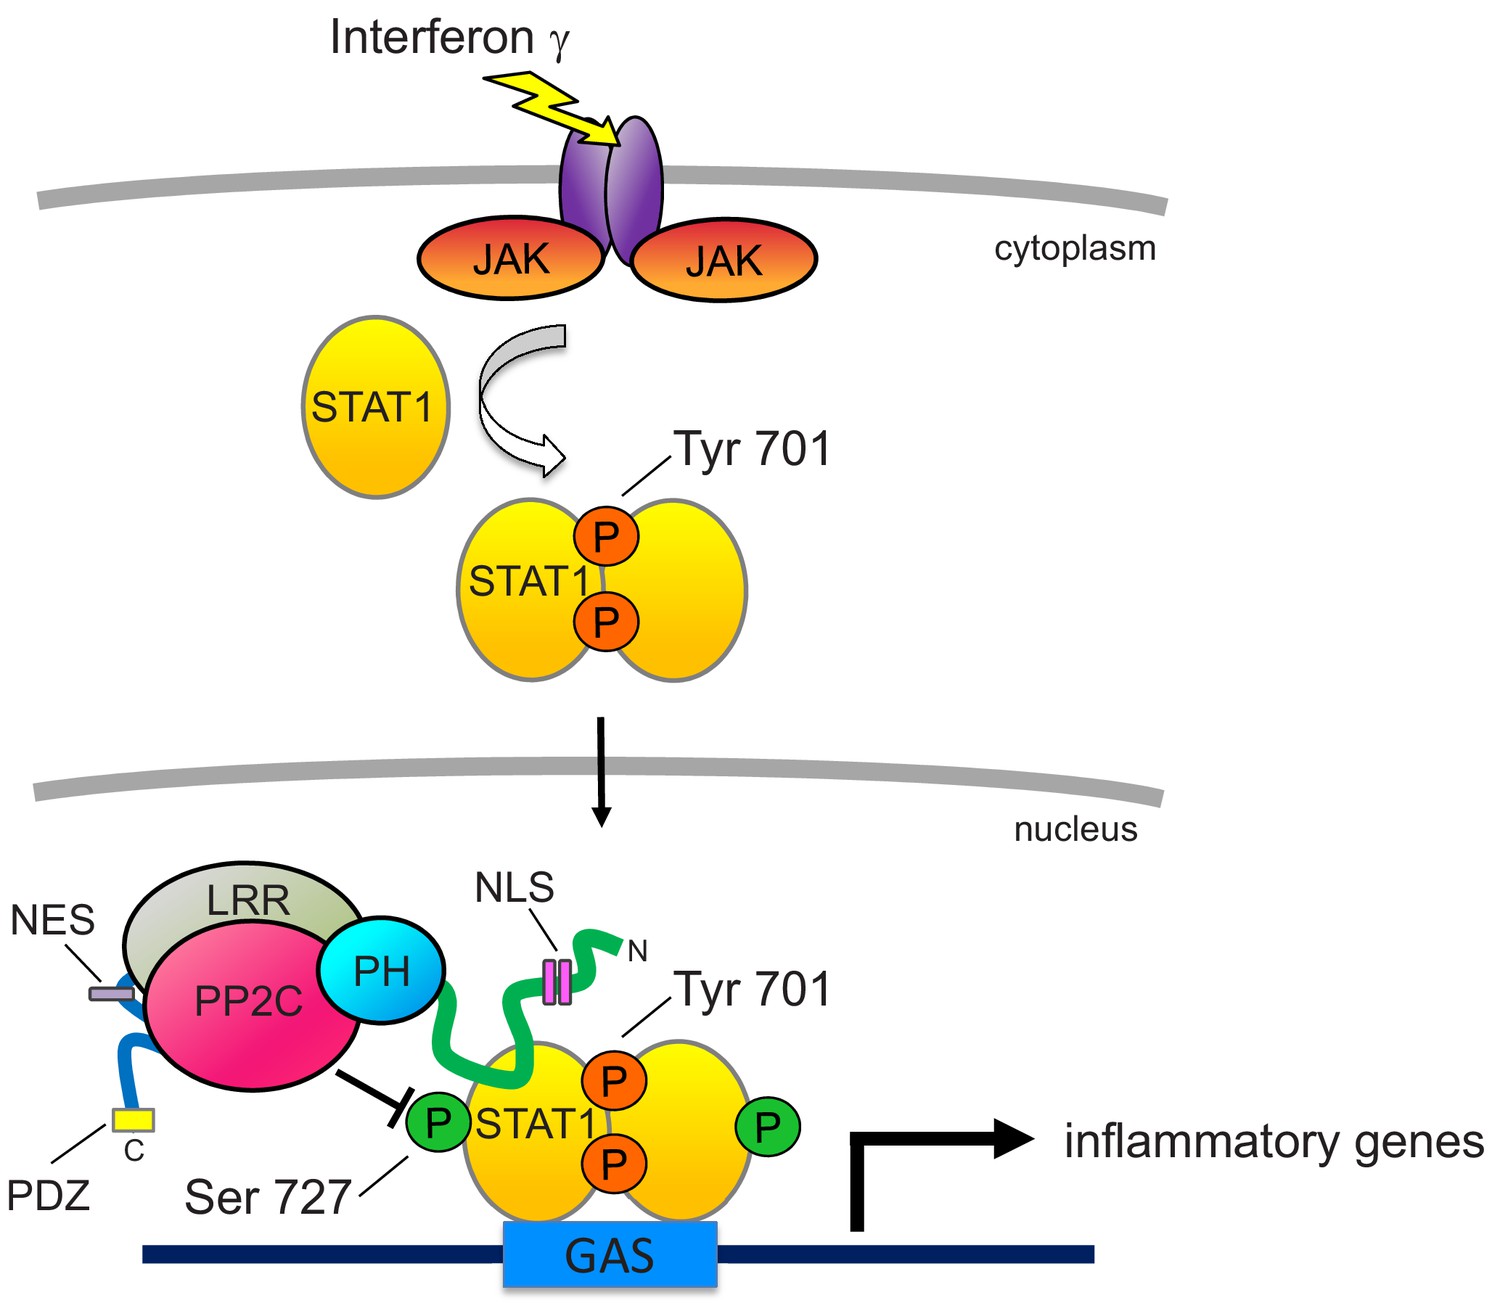
Proposed model for PHLPP1-dependent suppression of STAT1 activity.
Binding of IFNγ to IFN receptors results in their dimerization and phosphorylation, promoting the recruitment of JAK, which phosphorylates STAT1 on Tyr701. This promotes the dimerization of STAT1 and its translocation into the nucleus where it binds the GAS promoter to allow the transcription of inflammatory response genes. Activity of STAT1 is enhanced by phosphorylation on Ser727. However, nuclear-localized PHLPP1, which binds STAT1 via its N-terminal extension, tunes the activity of STAT1 by directly dephosphorylating this site to keep activity finely controlled. Loss of PHLPP1 results in poor resolution of inflammatory response. The nuclear localization of PHLPP1 is controlled by a bipartite NLS (pink rectangles) in the NTE (green line) and an NES (purple rectangle) in the segment between the LRR (gray oval) and the PP2C domain (red oval).
Tables
Key resources table
| Reagent type (species) or resource | Designation | Source or reference | Identifiers | Additional information |
|---|---|---|---|---|
| Cell line (Mus musculus) | Primary Bone Marrow Derived Macrophage Cells from Phlpp1+/+ mice | This paper | WT BMDM | male, 6–8 week old C57BL/6 mice, Charles River Laboratories |
| Cell line (Mus musculus) | Primary Bone Marrow Derived Macrophage Cells from Phlpp1-/- mice | This paper | Phlpp1-/- BMDM | male, 6–8 week old C57BL/6 mice, Charles River Laboratories |
| Cell line (Mus musculus) | Immortalized MEFs from Phlpp1+/+ mice | Lloyd Trotman Lab, CSHL, PMID: 21840483 | stably expressing shp53 and GFP | |
| Cell line (Mus musculus) | Immortalized MEFs from Phlpp1-/- mice | Lloyd Trotman Lab, CSHL, PMID: 21840483 | stably expressing shp53 and GFP | |
| Cell line (Homo sapiens) | HeLa | ATCC | CCL-2 | |
| Cell line (Homo sapiens) | HEK-293T | ATCC | CRL-11268 | |
| Cell line (Mus musculus) | NCTC clone L929 | ATCC | CCL-1 | L cell, L-929, derivative of Strain L |
| Strain, strain background (Escherichia coli) | E. coli K1 strain RS218 | PMID: 6995336 | Victor Nizet Lab, University of California San Diego | |
| Strain, strain background (Mus musculus) | WT and littermate control Phlpp1-/- mice | PMID: 20080691 | female, 10 to 14 week old, C57BL/6, for mouse infection studies | |
| Antibody | anti-HA (rat, monoclonal) | Roche | 11867425001 | Western Blot (1:1000) |
| Antibody | anti-GFP (rabbit, polyclonal) | Cell Signaling | 2555 | Western Blot (1:1000) |
| Antibody | anti-STAT1 (rabbit, polyclonal) | Cell Signaling | 9172 | Western Blot (1:1000) |
| Antibody | anti-STAT1 pSer727 (rabbit, polyclonal) | Cell Signaling | 9177 | Western Blot (1:1000) |
| Antibody | anti-STAT1 pTyr701 (rabbit, polyclonal) | Cell Signaling | 7649 | Western Blot (1:1000) |
| Antibody | anti-Erk1/2 pThr202/pTyr204 (rabbit, polyclonal) | Cell Signaling | 9101 | Western Blot (1:1000) |
| Antibody | anti-Erk1/2 (rabbit, polyclonal) | Cell Signaling | 9102 | Western Blot (1:1000) |
| Antibody | anti-Akt pThr308 (rabbit, polyclonal) | Cell Signaling | 9275 | Western Blot (1:1000) |
| Antibody | anti-Akt (rabbit, polyclonal) | AbCam | 126811 | Western Blot (1:1000) |
| Antibody | anti-PHLPP1 (rabbit, polyclonal) | Proteintech | 22789–1-AP | Western Blot (1:1000) |
| Antibody | anti-FLAG (mouse, monoclonal) | Sigma-Aldrich | F3165 | Western Blot (1:1000) |
| Antibody | anti-β-Actin (mouse, monoclonal) | Sigma-Aldrich | A2228 | Western Blot (1:2000) |
| Antibody | anti-α-tubulin (mouse, monoclonal) | Sigma-Aldrich | T6074 | Western Blot (1:1000) |
| Antibody | anti-STAT1 (rabbit, polyclonal) | Santa Cruz Biotechnology | sc-345 | Chromatin Immunoprecipitation |
| Antibody | anti-HA (mouse, monoclonal) | BioLegend | 901503 | Immunoprecipitation |
| Antibody | anti-α-tubulin (rabbit, monoclonal) | Cell Signaling | 2125 | Immunofluorescence (1:200) |
| Antibody | anti-Alexa647 (goat anti-Mouse IgG) | Life Technologies | A21235 | Immunofluorescence (1:500) |
| Antibody | anti-Alexa477 (goat anti-Rabbit IgG) | Life Technologies | A11034 | Immunofluorescence (1:500) |
| Recombinant DNA reagent | pCMV 3XFLAG-PHLPP1 WT | This paper | residues 1–1717 of PHLPP1 | |
| Recombinant DNA reagent | pCDNA3 HA-NLS-PHLPP1 PP2C | This paper | residues 653–906 of PHLPP1 | |
| Recombinant DNA reagent | pCDNA3 HA-NLS-PHLPP1 PP2C D1210/1413A | This paper | DDAA | Aspartate at residues 1210 and 1413 mutated to Alanine |
| Recombinant DNA reagent | pCDNA3 HA PHLPP1 NTE-WT | This paper | residues 1–512 of PHLPP1 | |
| Recombinant DNA reagent | pCDNA3 HA-PHLPP1 NTE-NLS1 mut. | This paper | residues 1–512 of PHLPP1 | |
| Recombinant DNA reagent | pCDNA3 HA-PHLPP1 NTE-NLS2 mut. | This paper | residues 1–512 of PHLPP1 | |
| Recombinant DNA reagent | pCDNA3 HA-PHLPP1 NTE-NLS1/2 mut. | This paper | residues 1–512 of PHLPP1 | |
| Recombinant DNA reagent | pCDNA3 HA-NES-PHLPP1 NTE | This paper | residues 1–512 of PHLPP1 | |
| Recombinant DNA reagent | pCDNA3 HA-PHLPP1 ΔNTE | PMID: 15808505 | Addgene: 22404 | residues 513–1717 of PHLPP1 |
| Recombinant DNA reagent | pCDNA3 HA-PHLPP1NES-PHLPP1 NTE | This paper | residues 1–512 of PHLPP1 | |
| Sequence-based reagent | Stat1 SMART siRNA pools | Dharmacon | L-058881 | |
| Sequence-based reagent | Control SMART siRNA pools | Dharmacon | D-001810-10-05 | |
| Peptide, recombinant protein | murine IFNγ | PeproTech | 315–05 | 10 ng/mL |
| Peptide, recombinant protein | human IFNγ | PeproTech | 300–02 | 10 ng/mL |
| Peptide, recombinant protein | recombinant STAT1 | Biosource | PHF0011 | 0.3 uM |
| Peptide, recombinant protein | recombinant human Cdk1/CyclinB | Millipore | 14–450 | 0.2 uM |
| Peptide, recombinant protein | E. coli O111:B4 LPS | Sigma-Aldrich | L4391 | |
| Chemical compound, drug | Okadaic Acid (OA) | Millipore | 459616 | 1 µM |
| Chemical compound, drug | Gö6983 | Calbiochem | 365251 | 250 nM |
| Chemical compound, drug | Staurosporine | Calbiochem | 569397 | 1 µM |
| Chemical compound, drug | KLA | Avanti Polar Lipids | 699500 | 100 ng/mL |
| Chemical compound, drug | RO-3306 | Enzo | ALX-270–463 | 144 uM |
| Commercial assay or kit | Dual-Glo Luciferase Assay System | Promega | E2940 | |
| Commercial assay or kit | IL-6 ELISA Kit | R and D Systems | DY406 | |
| Commercial assay or kit | IL-1β ELISA Kit | R and D Systems | DY401 | |
| Commercial assay or kit | IL-10 ELISA Kit | R and D Systems | DY417 |
Additional files
-
Supplementary file 1
List of 199 KLA-induced genes that are elevated in Phlpp1-/- BMDMs compared to WT cells.
- https://doi.org/10.7554/eLife.48609.014
-
Supplementary file 2
List of 144 KLA-induced genes that are reduced in Phlpp1-/- BMDMs compared to WT cells.
- https://doi.org/10.7554/eLife.48609.015
-
Transparent reporting form
- https://doi.org/10.7554/eLife.48609.016
Download links
A two-part list of links to download the article, or parts of the article, in various formats.
Downloads (link to download the article as PDF)
Open citations (links to open the citations from this article in various online reference manager services)
Cite this article (links to download the citations from this article in formats compatible with various reference manager tools)
PHLPP1 counter-regulates STAT1-mediated inflammatory signaling
eLife 8:e48609.
https://doi.org/10.7554/eLife.48609


