Local axonal morphology guides the topography of interneuron myelination in mouse and human neocortex
- Erasmus MC University Medical Center, Netherlands
- Brown University, United States
Figures
Figure 1 with 3 supplements
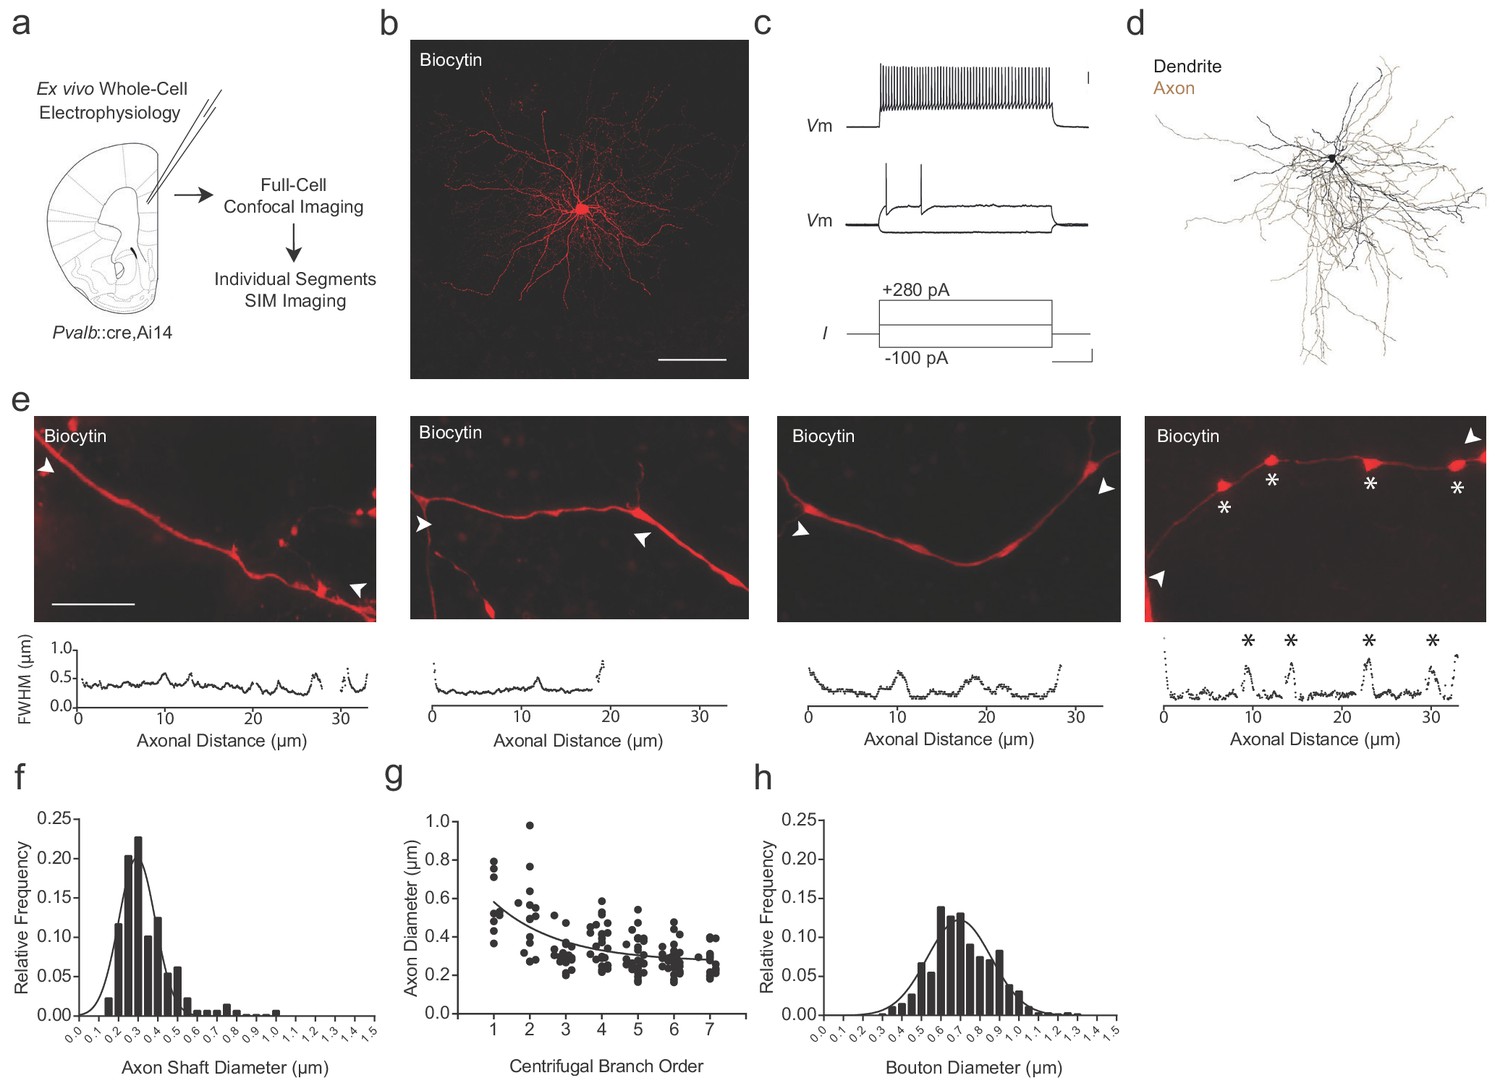
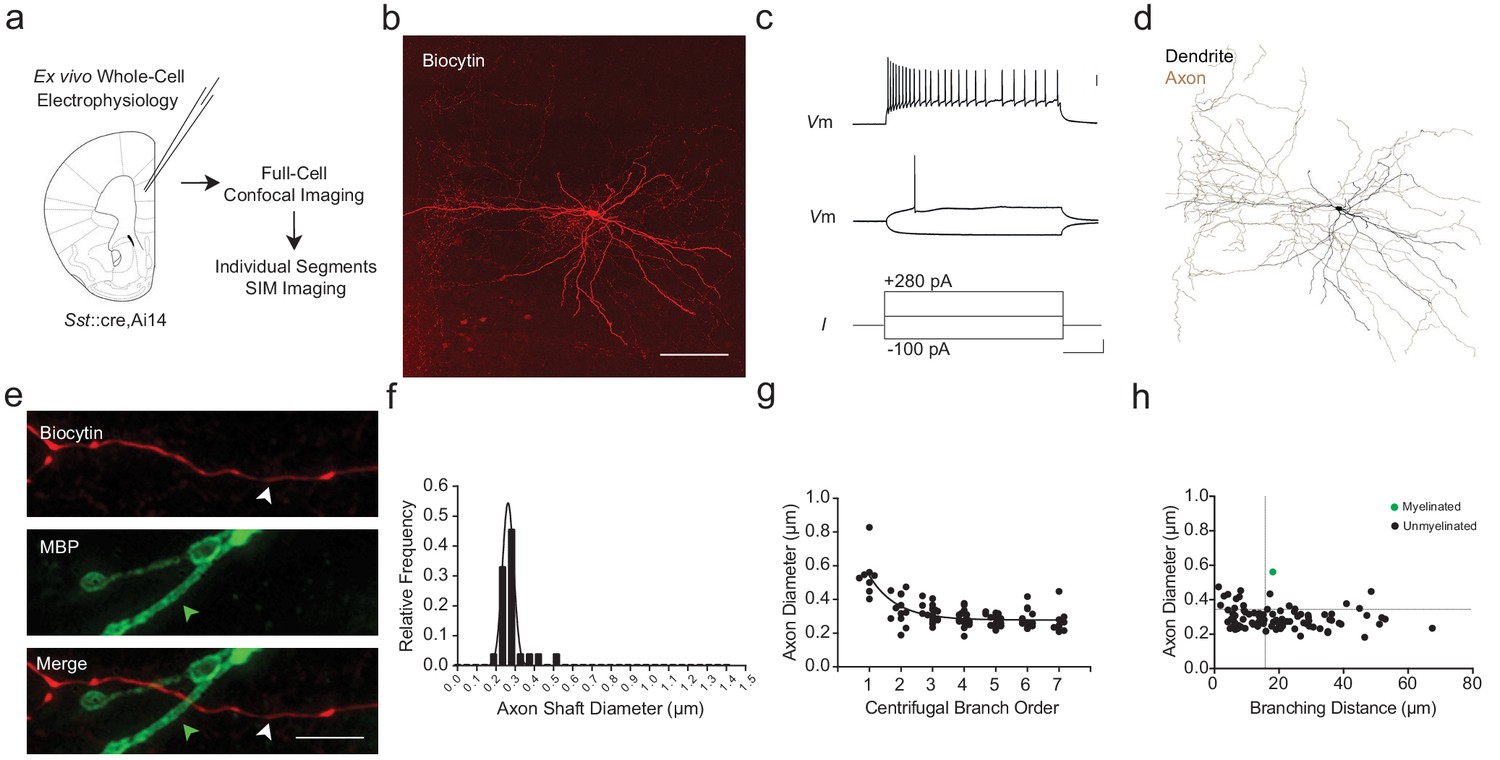
Super-resolution microscopy of fast-spiking, PV+ interneuron axons.
(a) Experimental approach. Biocytin-filled fast-spiking PV+ interneurons from mPFC were analyzed using both confocal imaging and structured illumination microscopy (SIM) imaging. See also Figure 1—figure supplements 1–3. (b) Maximum projection confocal image of a representative biocytin-filled PV+ cell from mPFC layer V (red). Scale bar, 50 µm. (c) Current clamp recording of evoked action potentials. Scale bars are 20 mV, 100 pA and 100 ms from top to bottom (right). (d) Full reconstruction of a mPFC layer V PV+ interneuron. Soma and dendrites in black, axon in brown. (e) Representative SIM z-stack projections of PV+ interneuron axonal segments (top), along with their corresponding FWHM diameter profiles (bottom). White arrowheads indicate measurement boundaries. From left to right: First branch order axon initial segment; second branch order unmyelinated axonal segment; third branch order myelinated axonal segment; sixth branch order unmyelinated axonal segment featuring multiple en-passant boutons (indicated by asterisks). Scale bar, 10 µm. (f) Distribution histogram of PV+ interneuron axon shaft diameters, fitted with a Gaussian curve. n = 140 axonal segments/8 cells. (g) Average axon shaft diameter decreases steadily over centrifugal branch order. n = 140 segments/8 cells. p<0.001, one-way ANOVA. (h) Distribution of axonal en passant bouton diameters of PV+ interneuron axons, fitted with a Gaussian curve. n = 250 boutons/8 cells. Abbreviations: FWHM, full-width half-maximum. I, input current. SIM, structured illumination microscopy. Vm, membrane voltage.
-
Figure 1—source data 1
Diameter measurements for axonal segments (f), branch order (g), and en passant boutons (h) of PV::WT cells.
- https://cdn.elifesciences.org/articles/48615/elife-48615-fig1-data1-v2.xlsx
Figure 1—figure supplement 1
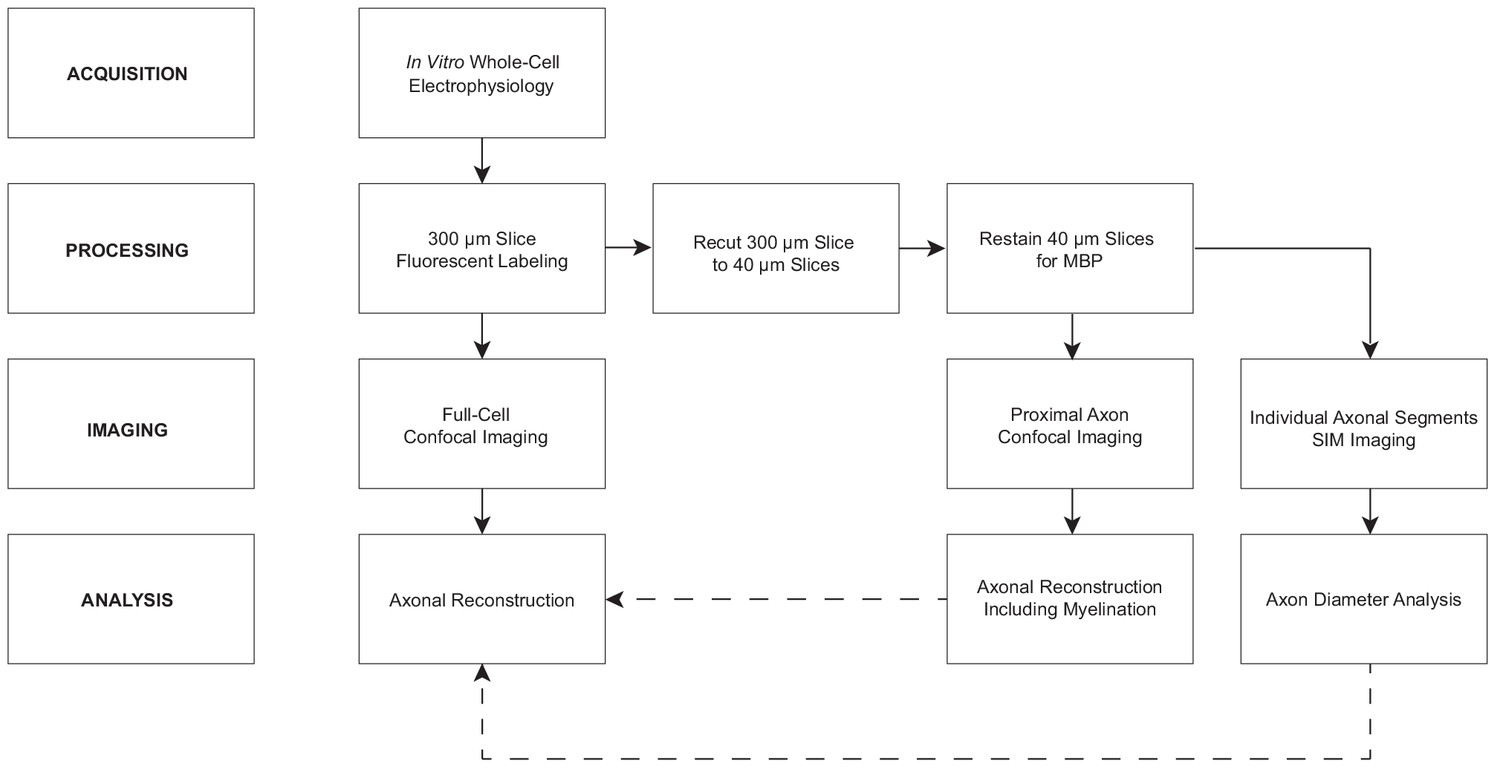
Experimental flowchart for axonal reconstructions.
Figure 1—figure supplement 2
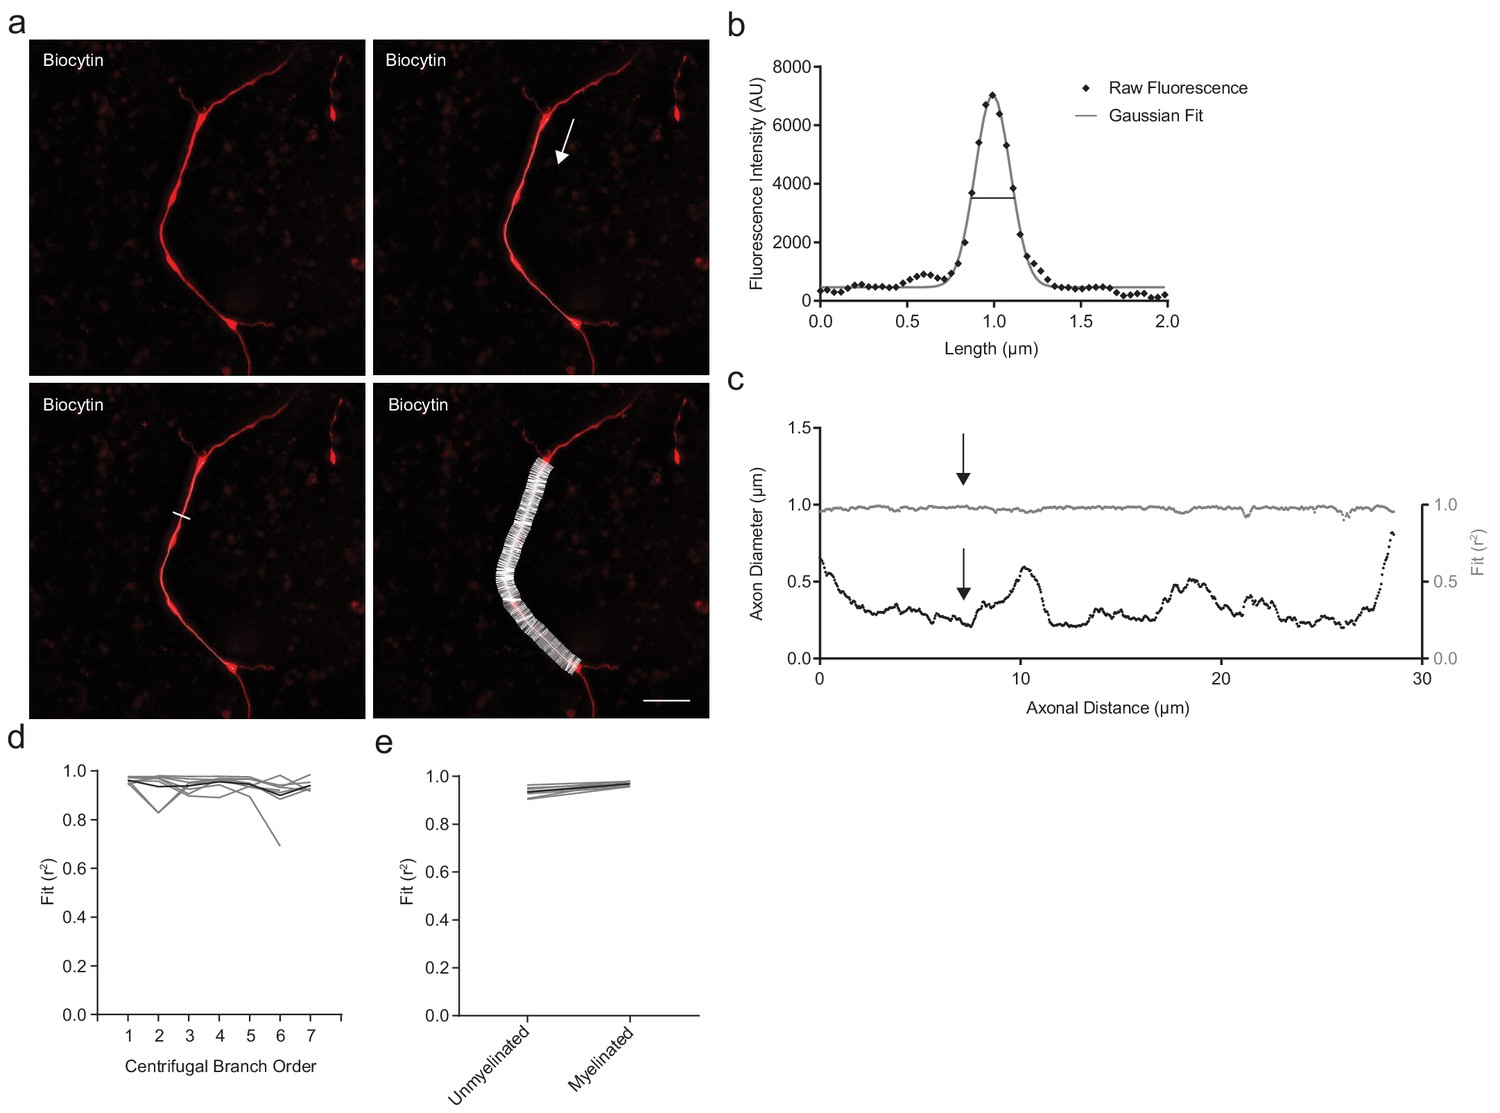
Axonal diameter analysis.
Interbranch axonal diameter was sampled at high spatial frequency from branch point to branch point. This representative example based on Figure 1e, depicts a 3rd order branch segment. (a) Axonal diameter was measured using the average intensity projection of a z-stack series of SIM images (red). A semi-automated, user-guided line was traced from the center of each axonal branch point to the center of the subsequent distal branch point (thin white line). Each segment was analyzed in the direction centrifugally oriented from the soma along the axon, as indicated by the white arrow. For every consecutive 40 nm of axon, a 50-pixel wide line (~2.0 µm) was drawn orthogonally to the tangent line of axonal orientation (white). Scale bar, 5 µm. (b) Along the orthogonals, pixel fluorescence intensities were extracted (black diamonds) and a Gaussian line was fitted (grey). Fits with r2 <0.9 were excluded from further analysis. From the Gaussian fit at each consecutive axonal position, the full-width at half-maximum (FWHM) was calculated. In this representative example, the FWHM (axonal diameter)=0.238 µm and r2 = 0.987. (c) Left axis: Axonal diameter measurements as a function of centrifugal distance along the axonal segment shown in (a). Right axis: Fit (r2) of the Gaussian function along the axonal segment. Black arrows indicate the location of the corresponding fit shown in (b). (d) Distribution over branch order of median Gaussian fit (r2) prior to exclusion of points with r2 <0.9. Individual cells in grey, average in black. (e) Goodness of fit (r2) is similar between myelinated and unmyelinated segments. Individual cells in grey, average in black. Abbreviations: FWHM, full-with at half-maximum.
Figure 1—figure supplement 3
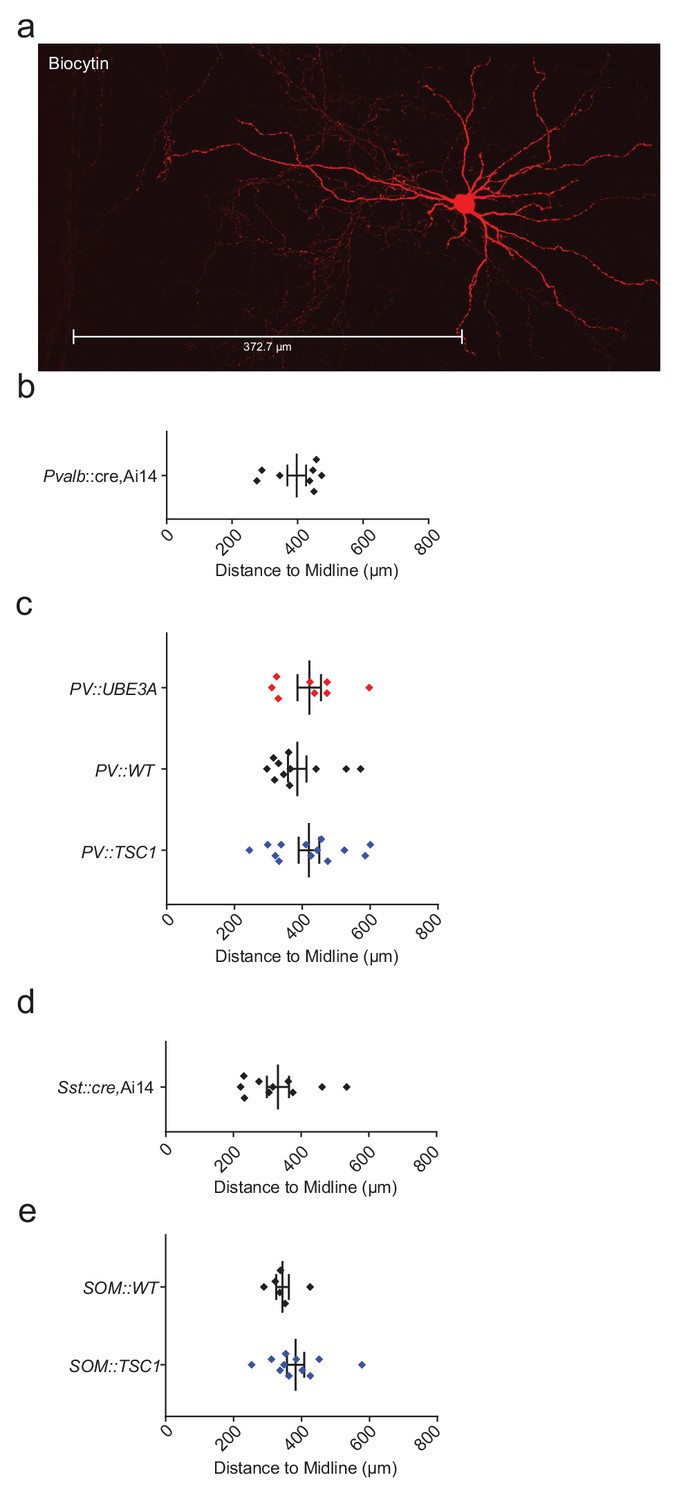
Locations of biocytin-filled and reconstructed PV+ and SOM+ cells.
(a) Maximum projection confocal image of a biocytin-filled mPFC SOM+ interneuron (red), with the distance to midline indicated. (b–e) Soma locations of Pvalb::cre,Ai14 cells (b), PV::UBE3A, PV::WT, PV::TSC1 cells (c), Sst::cre,Ai14 cells (d), and SOM::WT, SOM::TSC1 cells (e). Black bars indicate mean ± s.e.m.
Figure 2
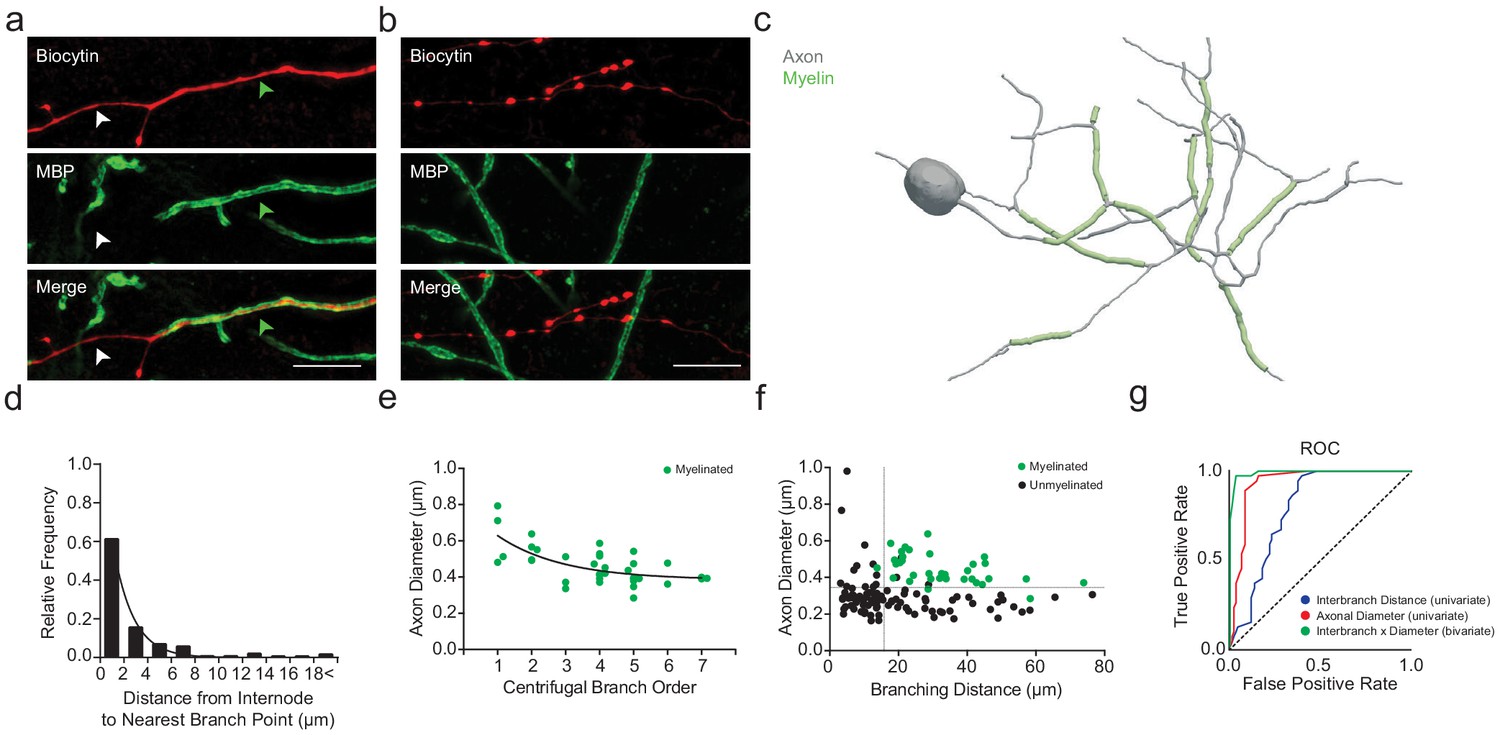
PV+ interneuron axon diameter co-varies with myelination.
(a) Average SIM z-stack projection of a biocytin-filled PV+ interneuron axon (red) along with its myelination (MBP; green arrowhead), centered over a fourth branch order segment. Note that the relatively thinner axonal segment is unmyelinated (white arrowhead). Scale bar, 5 µm. (b) Average SIM z-stack projection of a biocytin-filled PV+ interneuron axon (red) lacking myelination (MBP), centered over a seventh branch order segment. Note the frequent en passant boutons and thin axon shaft. (c) Neurolucida reconstruction of an mPFC fast-spiking PV+ interneuron axon. Axon in grey, myelinated segments in green. Note the proximal onset of myelin, consisting of short internodes interspersed by branch points. (d) Frequency histogram of nearest neighbor distance from internodes to branch points. n = 81 segments/5 cells. (e) Average axon segment diameter versus branch order, exclusively for segments showing myelination. n = 39 segments/8 cells. p<0.001, one-way ANOVA. (f) The joint combination of axonal diameter and interbranch point distance is highly predictive of segmental myelination. Each circle represents an individual axonal segment. Myelinated segments (green) are consistently thicker and longer compared to unmyelinated segments (black), with critical thresholds (dotted lines) of 13.4 µm and 334 nm for interbranch distance and diameter, respectively. n = 140 segments/8 cells. (g) Receiver-operator characteristic (ROC) curves for interbranch distance (blue) and diameter (red) as univariate predictors, as well as the significantly improved joint bivariate prediction (green) of myelination status (p<0.001). Diagonal dotted line indicates the non-discrimination reference boundary. Abbreviations: ROC, receiver-operator characteristic.
-
Figure 2—source data 1
Morphological measures in PV::WT cells: internode-to-branch point (d), branch order (e), and bivariate interbranch distance / axonal diameter values for myelinated and unmyelinated segments (f).
- https://cdn.elifesciences.org/articles/48615/elife-48615-fig2-data1-v2.xlsx
Figure 3
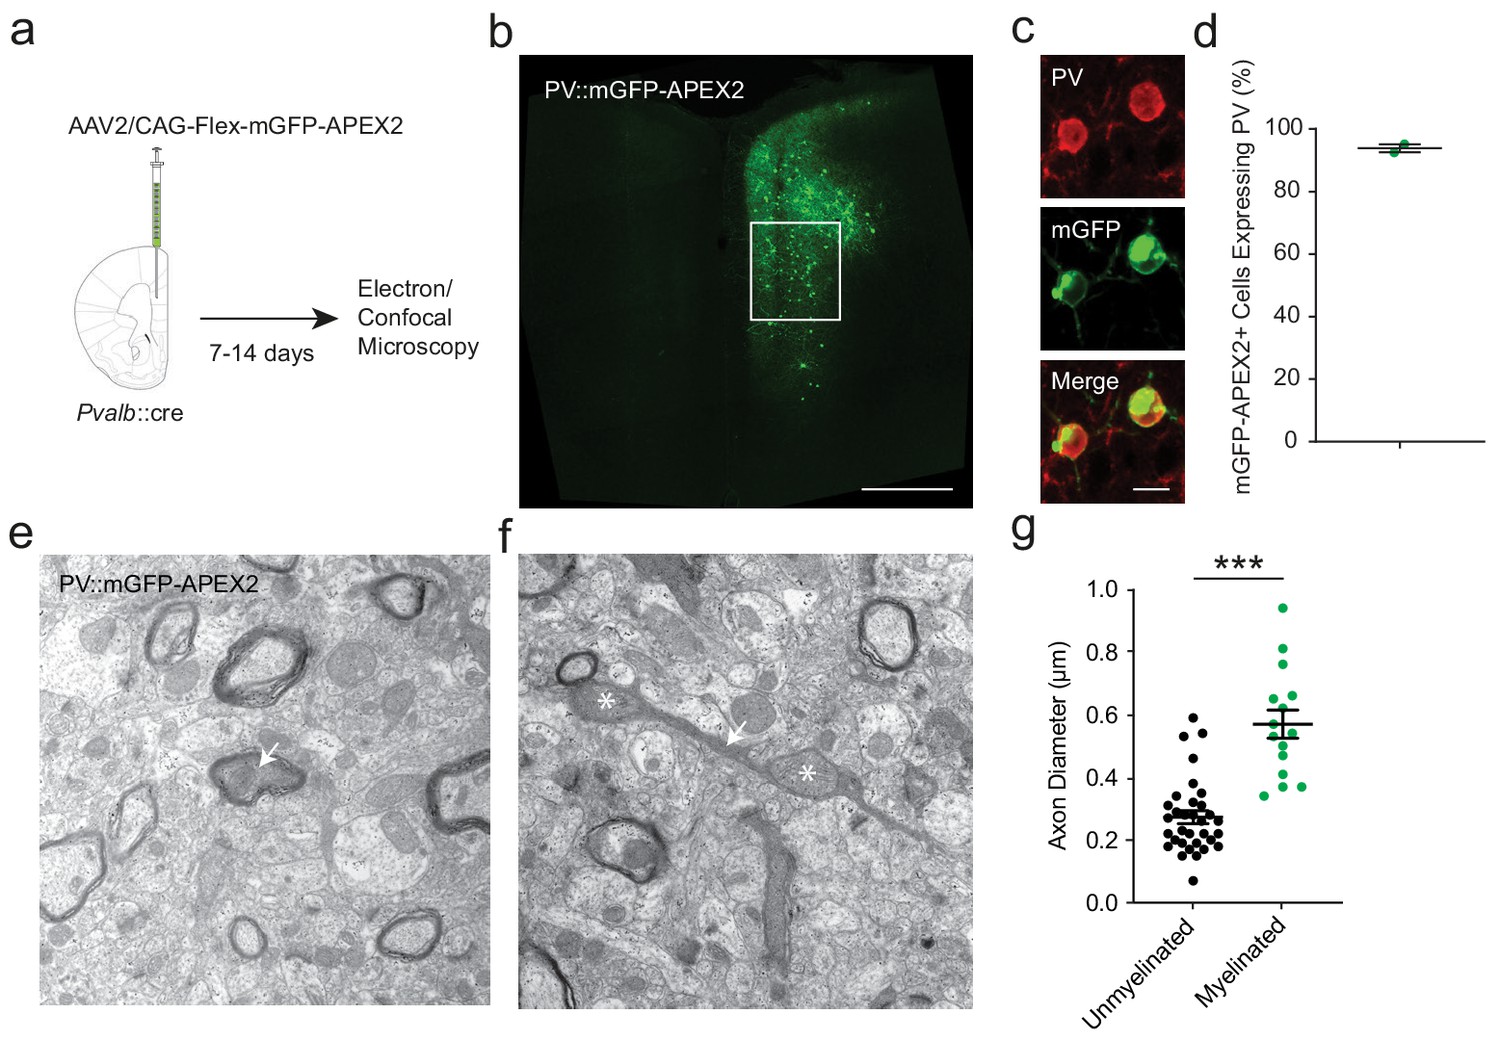
APEX2 contrast-enhanced electron microscopy confirms that smaller-diameter axonal segments lack myelination.
(a) Experimental flowchart. Pvalb::cre mice were given unilateral injections into mPFC with AAV2/CAG-flex-mGFP-APEX2, and sacrificed for confocal and electron microscopy after 7 to 14 days. (b) Confocal image of unilateral PV-specific mGFP-APEX2 expression in mPFC (green). White square depicts the region of interest in the prelimbic area. (c) Representative confocal microscopy image of mGFP-APEX2 fluorescence (green) and its colocalization with PV immunofluorescence (red). (d) Quantification of colocalization between mGFP-APEX2+ cells and PV immunofluorescence. 93.9 ± 1.3% of mGFP-APEX2+ cells expressed PV. n = 2 mice (e–f) Electron microscopy images (14kx) of PV::mGFP-APEX2+ myelinated (e) and unmyelinated (f) axons (arrows). Morphological enlargements featuring mitochondria (asterisks) were not included in the diameter analysis. (g) PV+ interneuron axonal segments featuring myelination have a larger average diameter (green) than unmyelinated axons (black). Unmyelinated: 0.269 ± 0.019 µm, n = 38; myelinated: 0.570 ± 0.045 µm, n = 15. ***p<0.001. Unpaired two-tailed Student’s t-test. Black bars represent mean ± s.e.m.
-
Figure 3—source data 1
Quantification of PV::WT cell axonal diameter by APEX2 contrast-enhanced electron microscopy (g).
- https://cdn.elifesciences.org/articles/48615/elife-48615-fig3-data1-v2.xlsx
Figure 4 with 4 supplements

PV::TSC1 and PV::UBE3A mice exhibit reciprocal alterations of PV+ cell morphology.
(a) Overview of mouse breeding scheme. (b) Maximum projection confocal image of PV+ somata (red) in PV::UBE3A mice lacking UBE3A (green; top), and in PV::TSC1 mice showing high pS6 expression (green, bottom). Higher magnification images are provided in Figure 4—figure supplements 1–2. Scale bar, 15 µm. (c) Quantification of PV+ interneuron maximum projection soma area from mPFC layers II-V. PV::UBE3A: 92.1 ± 2.7 µm2; n = 58 cells; PV::WT: 104.6 ± 2.5 µm2; n = 109 cells PV::TSC1: 160.2 ± 3.8 µm2; n = 159 cells; n = 3 mice per group. (d) Experimental procedure. PV::UBE3A, PV::WT and PV::UBE3A were stereotactically injected with AAV9/CAG-Flex-eGFP in the mPFC and analyzed two weeks later with SIM imaging. (e) Representative projection of a SIM z-stack showing primary axon branches (red) originating from transfected GFP+ somata in PV::UBE3A and PV::TSC1 mice. White arrowhead indicates location of axon onset. Scale bar, 2 µm. (f) PV+ interneuron axon caliber quantifications from mPFC layers II-V. PV::UBE3A: 0.613 ± 0.023 µm; n = 36 axons; PV::WT: 0.665 ± 0.019 µm; n = 46 axons; PV::TSC1: pS6+ 0.846 ± 0.034 µm; n = 30 axons; n = 3 mice per group. ***p<0.001; **p<0.01; *p<0.05. One-way ANOVA followed by post hoc Tukey’s test. Black bars represent mean ± s.e.m.
-
Figure 4—source data 1
Soma area (c) and axon onset diameter (f) for PV::UBE3A, PV:WT, and PV::TSC1 cells.
- https://cdn.elifesciences.org/articles/48615/elife-48615-fig4-data1-v2.xlsx
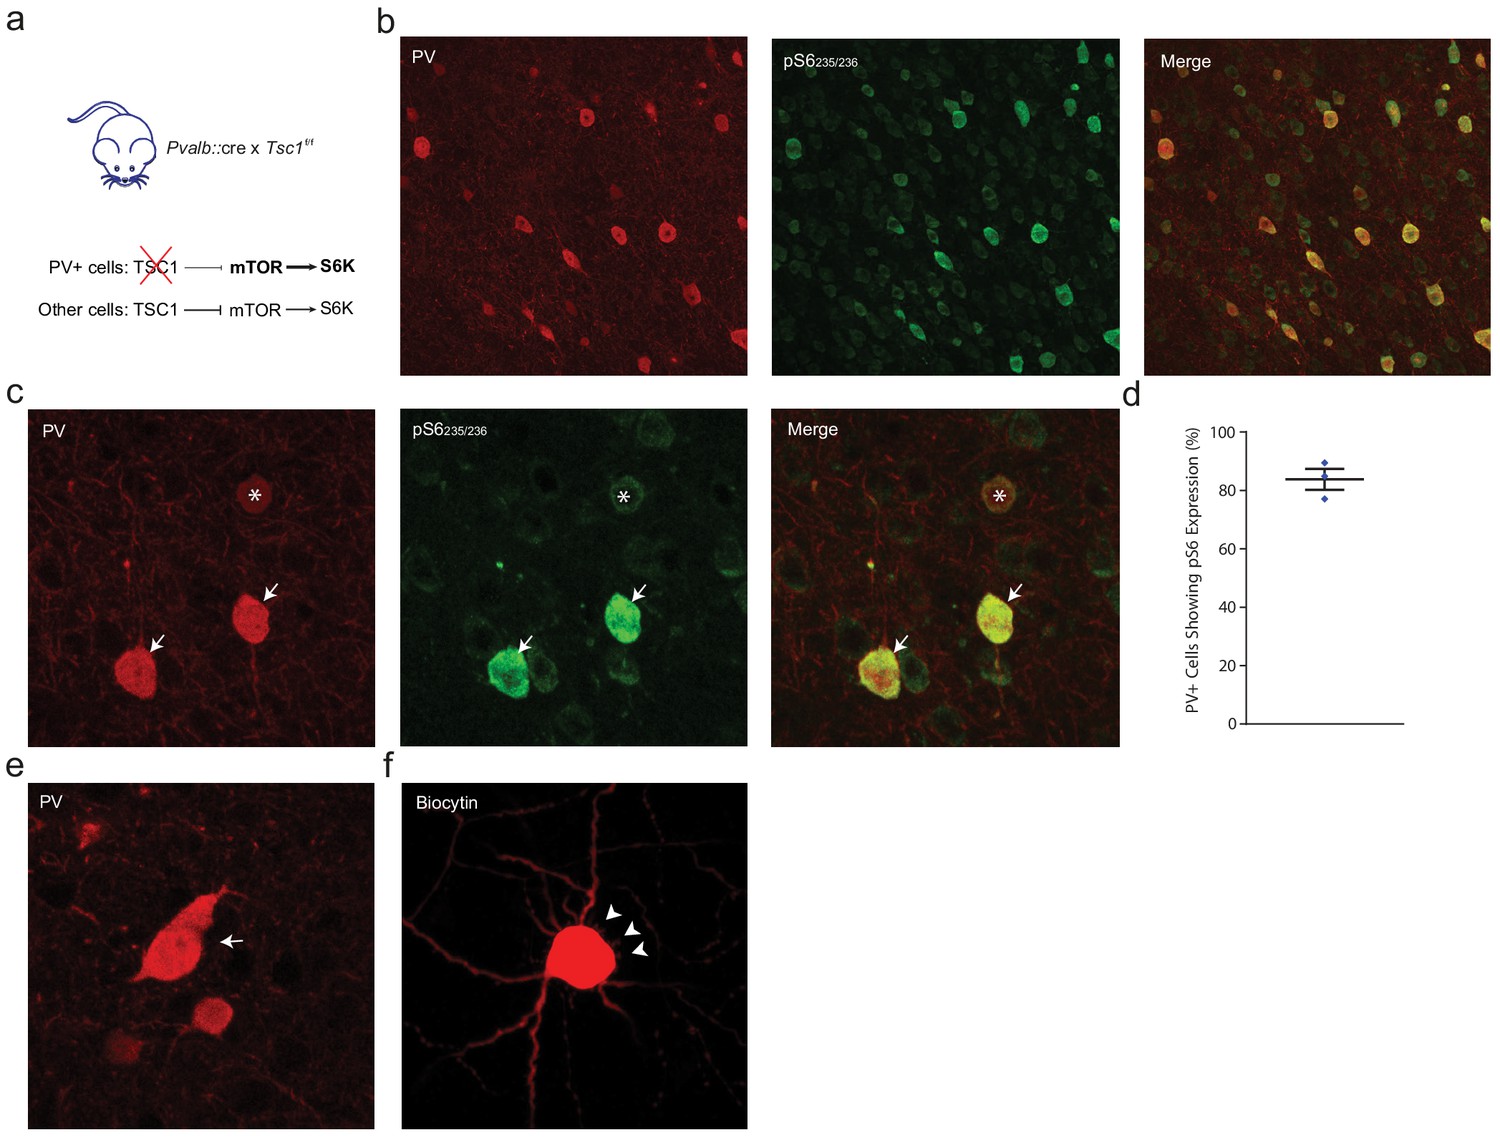
Figure 4—figure supplement 1
PV::TSC1 mice exhibit PV-specific deletion of Tsc1.
(a) Pvalb::cre mice were crossed with floxed Tsc1f/f to obtain heterozygous Pvalb::cre x homozygous Tsc1-/- mice. In the absence of Tsc1, mTOR signaling is disinhibited leading to excessive S6K activity. (b) Low magnification confocal image from the mPFC showing PV (red) and pS6235/236 (green) immunofluorescence in adult mPFC, confirming the PV-specific increased S6K activity. (c) Maximum projection confocal image showing increased expression of pS6235/236 (green) in most (arrows) but not all (asterisk) PV+ cells (red). Uncropped image from Figure 4b. (d) Corresponding deletion of Tsc1 was observed in 83.8 ± 3.6% of PV+ cells, n = 3 mice. (e). High magnification confocal image showing a rare instance of an oddly shaped enlarged pS6+ PV::TSC1 cell (red). (f) Biocytin-filled PV::TSC1 cells (red) show short, thin filopodia (white arrowheads) radiating from the enlarged soma. Black bars indicate mean ± s.e.m.
Figure 4—figure supplement 2

PV::UBE3A mice exhibit PV+ cell-specific deletion of Ube3a.
(a) PV-specific knockout of Ube3a. (b) Low magnification confocal microscopy image showing immunofluorescence of Ube3a (green) and PV (red) in adult mPFC. Note that the remaining non-PV neuronal cell types still retain intact Ube3a expression. Scale bar, 10 µm. (c) High magnification confocal image confirming the absence of Ube3a (green) in most (arrows) but not all (asterisk) PV+ cells (red). Uncropped image corresponding to Figure 4b. (d) Ube3a was deleted in 73.6 ± 2.8% of PV+ cells, n = 3 mice. Black bars indicate mean ± s.e.m.
Figure 4—figure supplement 3

PV cell-specific mutations of Ube3a or Tsc1 do not alter PV+ cell density in mPFC.
(a) Confocal microscopy image showing immunofluorescence of PV (red) and DAPI (white) in adult mPFC for PV::UBE3A, PV::WT, and PV::TSC1. Scale bar, 100 µm. (b) Quantification of PV+ cell density. p=0.780, Kruskal-Wallis test owing to non-normality. Black bars indicate mean ± s.e.m.
Figure 4—figure supplement 4
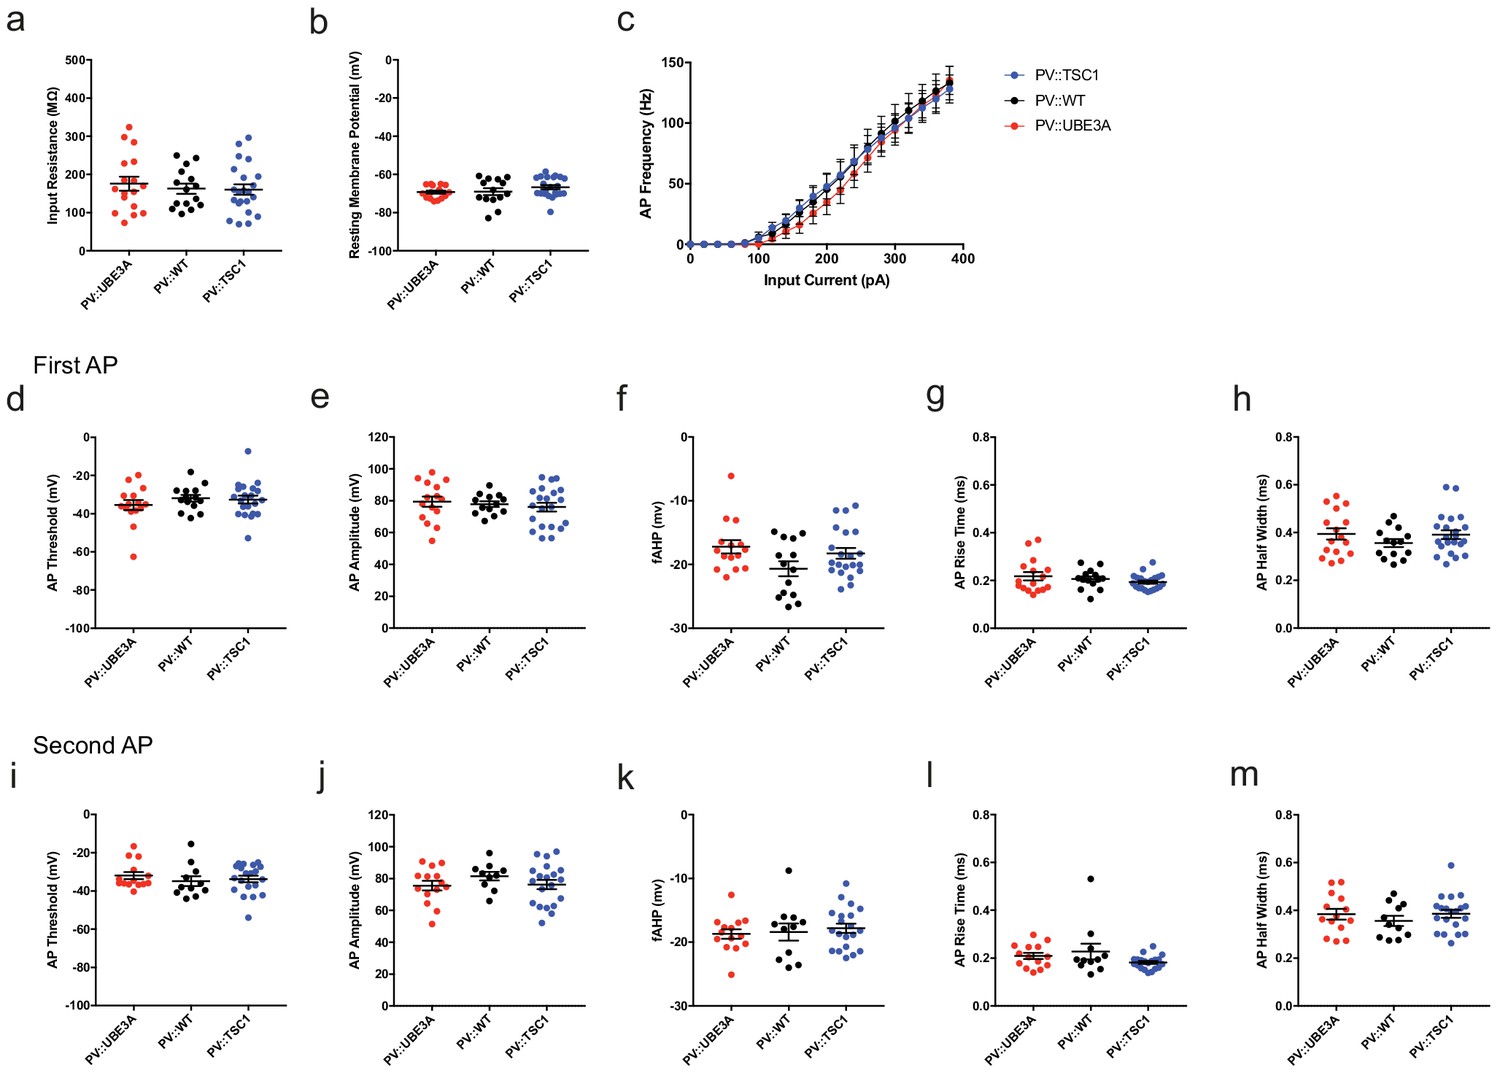
Electrophysiological properties of PV::TSC1, PV::WT, and PV::UBE3A cells.
(a) input resistance. p=0.741. (b) resting membrane potential. p=0.267. (c) Frequency-current plot, in response to square-wave current steps. p=0.999. PV::WT, n = 14 cells; PV::TSC1, n = 22 cells; PV::UBE3A, n = 16 cells. (d–h) Analysis of the first action potential. (d) AP threshold. p=0.518. (e) AP amplitude. p=0.410. (f) fast afterhyperpolarization (fAHP) amplitude. p=0.160. (g) AP rise time. p=0.309. (h) AP half-width. p=0.368. (i–m) Analysis of the first action potential. (i) AP threshold. p=0.696. (j) AP amplitude. p=0.855. (k) fast afterhyperpolarization (fAHP) amplitude. p=0.073. (l) AP rise time. p=0.082. (m) AP half-width. p=0.475. One-way ANOVA in (a), (b), (d), (e), (g), (h), (i), (j), (l), and (m). Mann-Whitney U test in (f) and (k). Repeated measures ANOVA in (c). Black bars indicate mean ± s.e.m. Abbreviations: AP, action potential; fAHP, fast afterhyperpolarization.
Figure 5 with 1 supplement
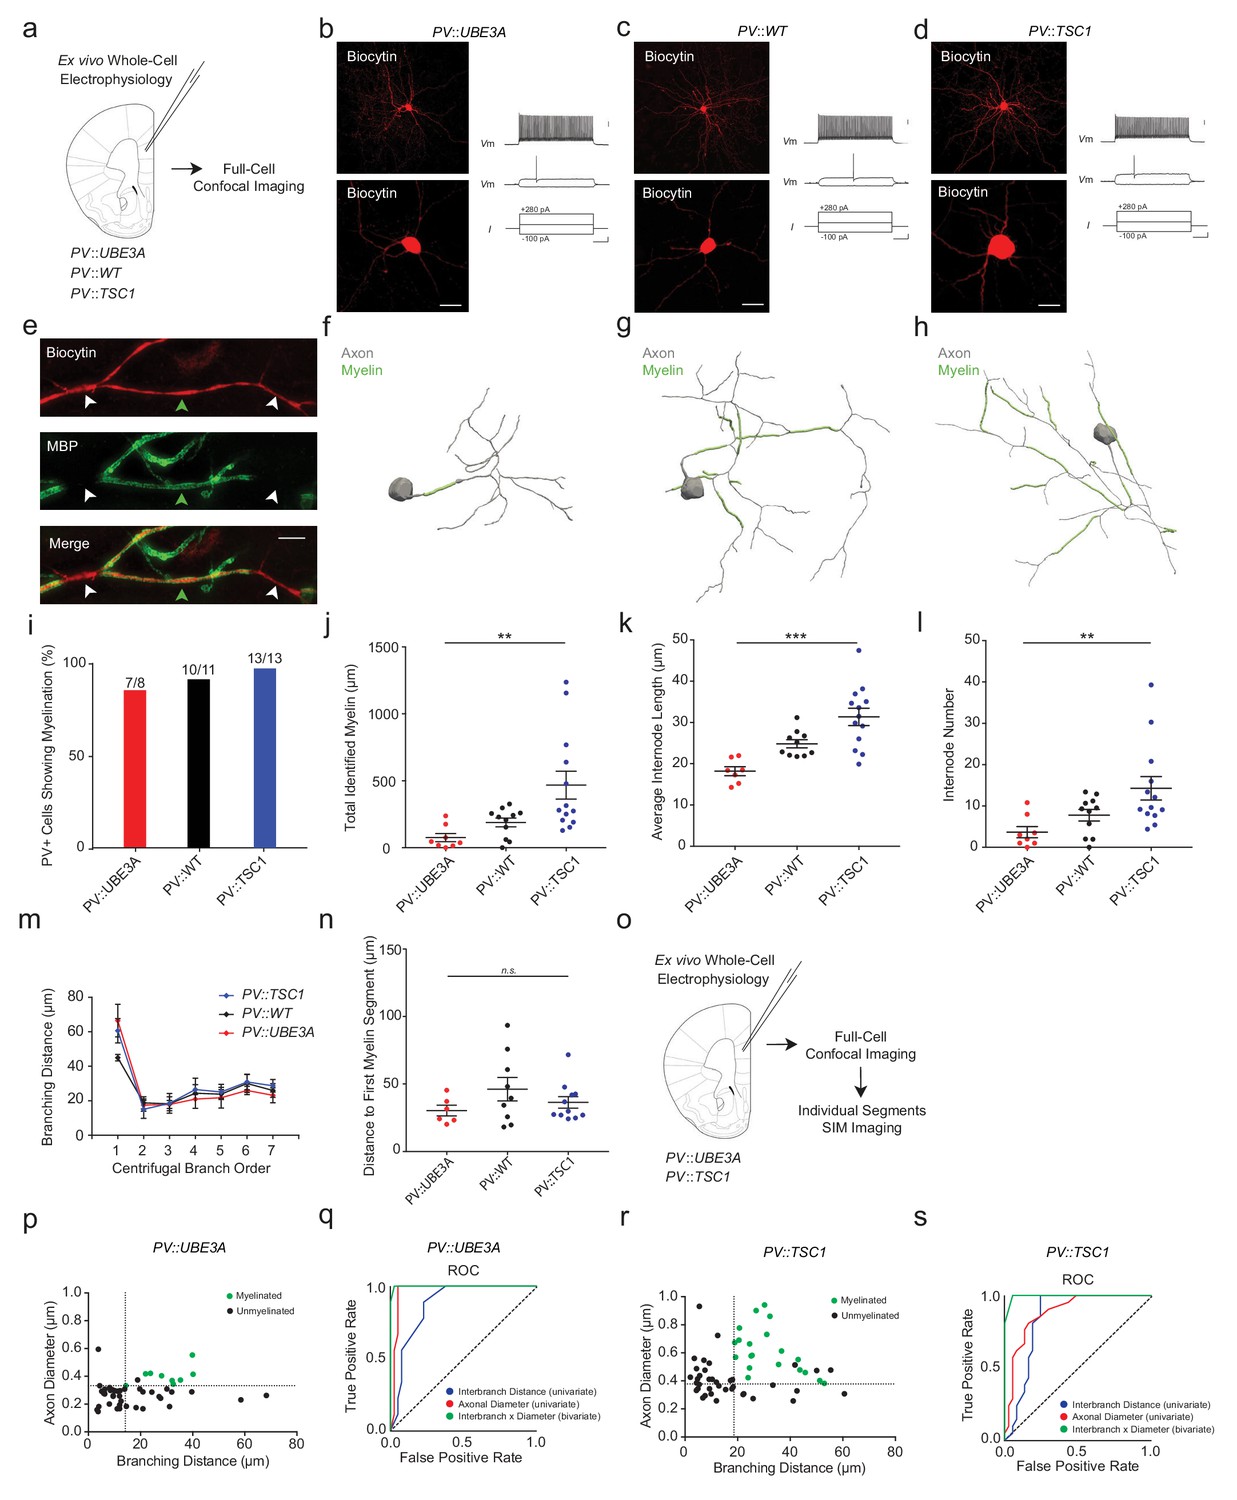
PV::UBE3A and PV::TSC1 mice exhibit bi-directional alterations in PV+ interneuron axonal myelination.
(a) Experimental approach. Biocytin-filled fast-spiking PV+ interneurons from each genotype were first analyzed using confocal imaging. (b–d) Maximum projection image of a representative biocytin-filled PV+ cell (red, top), a close-up of a biocytin-filled somata (red, bottom), with a corresponding fast-spiking action potential train for PV::UBE3A (b), PV::WT (c), and PV::TSC1 (d). Scale bars are 50 µm (left) and 20 mV, 100 pA and 100 ms from top to bottom (right). (e) Representative SIM z-stack projection of a biocytin-filled PV+ interneuron axon centered over a 4th order branch (red), demonstrating myelinated (MBP, green; green arrowhead) and unmyelinated segments (white arrowhead). Scale bar, 5 µm. (f–h) Proximal axon reconstructions (grey) including myelinated segments (green) of representative cells from PV::UBE3A (f), PV::WT (g), and PV::TSC1 (h) mice. (i) Nearly all PV+ cells exhibit axonal myelination, independent of genotype. (j–l) PV+ cell-specific genetic manipulations bi-directionally alter myelin content (j), internode length (k) and number of internodes per cell (l). (m) The distribution of interbranch distance remains similar across genotypes (p=0.575, repeated measures ANOVA group x branch order interaction). (n) Distance from the soma to the onset of myelination was unaffected by PV+ cell-specific deletion of Ube3a or Tsc1. p=0.589, one-way ANOVA. (o) Experimental approach. Biocytin-filled fast-spiking PV+ interneurons from PV::UBE3A and PV::TSC1 mice were analyzed using both confocal and SIM imaging. (p) The joint combination of axonal diameter and interbranch point distance is highly predictive of PV::UBE3A cell segmental myelination. Critical thresholds (dotted lines) for interbranch distance and axonal diameter were 14.1 µm and 332 nm, respectively. n = 49 segments/3 cells. Myelinated segments, green circles. Unmyelinated segments, black circles. (q) Receiver-operator characteristic (ROC) curve for PV::UBE3A cells. ROC curves of segmental myelination, comparing univariate models of interbranch distance (blue) and axonal diameter (red), and their joint bivariate combination (green). Diagonal dotted line indicates the non-discrimination reference boundary. (r) The joint combination of axonal diameter and interbranch point distance is highly predictive of PV::TSC1 cell segmental myelination. Critical thresholds (dotted lines) for interbranch distance and axonal diameter were 18.6 µm and 378 nm, respectively. n = 58 segments/3 cells. Myelinated segments, green circles. Unmyelinated segments, black circles. (s) ROC curves for PV::TSC1 cells. ROC curves of segmental myelination, comparing univariate models of interbranch distance (blue) and axonal diameter (red), and their joint bivariate combination (green). Diagonal dotted line indicates the non-discrimination reference boundary. ***p<0.001, **p<0.01, *p<0.05, n.s. non-significant. One-way ANOVA in (j), (k), (l) and (n). Repeated measures ANOVA in (m). Black bars represent mean ± s.e.m. Abbreviations: I, input current. ROC, receiver-operator characteristic. Vm, membrane voltage.
-
Figure 5—source data 1
Total recovered myelination length (j), internode length (k), internode number (l), branch order (m), myelin onset distance (n), as well as bivariate interbranch distance / axonal diameter values for myelinated and unmyelinated segments of PV::UBE3A (p) and PV::TSC1 (q) cells.
- https://cdn.elifesciences.org/articles/48615/elife-48615-fig5-data1-v2.xlsx
Figure 5—figure supplement 1
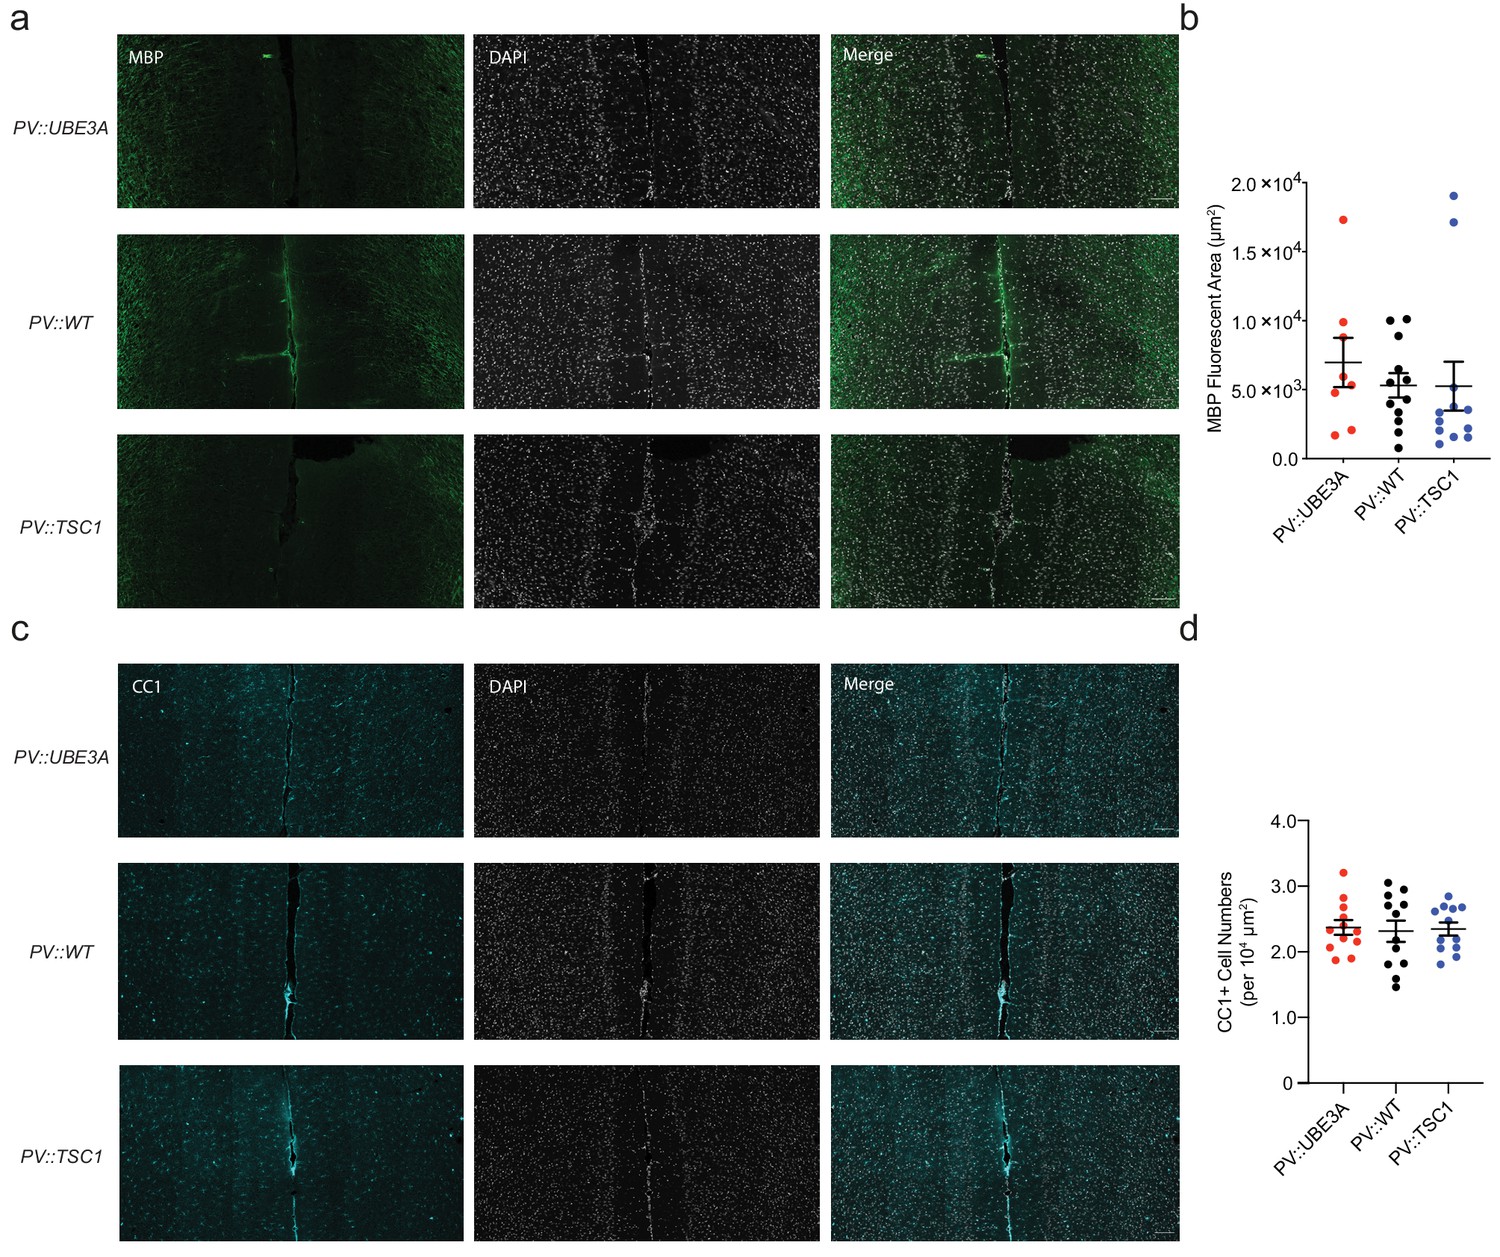
Intact global myelination and mature oligodendrocyte density in mPFC of mice with PV cell-specific mutations of Ube3a or Tsc1.
(a) Confocal microscopy image showing immunofluorescence of MBP (green) and DAPI (white) for PV::UBE3A, PV::WT, and PV::TSC1. Scale bar, 100 µm. (b) Quantification of MBP+ area. p=0.256, Kruskal-Wallis test owing to non-normality. (c) Confocal microscopy image showing immunofluorescence of CC1+ mature oligodendrocytes (cyan) and DAPI (white) in adult mPFC for PV::UBE3A, PV::WT, and PV::TSC1. Scale bar, 100 µm. (d) CC1+ mature oligodendrocyte density. p=0.950. One-way ANOVA. Black bars indicate mean ± s.e.m.
Figure 6
mPFC SOM+ interneurons have subthreshold axonal morphology and are correspondingly unmyelinated.
(a) Experimental approach. Biocytin-filled regular-spiking SOM+ interneurons from mPFC were analyzed using both confocal imaging and SIM imaging. See also Figure 1—figure supplements 1–3. (b) Maximum projection confocal image of a representative biocytin-filled SOM+ interneuron (red). Scale bar, 50 µm. (c) SOM+ interneuron recording demonstrating a low threshold for AP initiation, spike frequency adaptation, and AP amplitude attenuation. Scale bars are 20 mV, 100 pA and 100 ms from top to bottom. (d) Neurolucida reconstruction of the SOM+ cell depicted in (b). Soma and dendrite in black, axon in brown. Note the tortuous axonal arbor and dendrites. (e) mPFC SOM+ interneurons are rarely myelinated. Representative confocal image of a SOM+ interneuron axon (red), centered over a 3rd branch order segment (white arrowhead) without myelination (MBP, green; green arrowhead). Scale bar, 10 µm. (f) Frequency histogram of SOM+ interneuron axon shaft diameter, fitted with a Gaussian curve. n = 88 axonal segments/6 cells. (g) Axon shaft diameter decreases monotonically with increasing centrifugal branch order. n = 88 segments/6 cells. p<0.001, one-way ANOVA. (h) Distribution of axonal segment diameter and interbranch distances for myelinated (green circles) and unmyelinated (black circles) segments. n = 88 segments/6 cells. Dotted lines indicate the bivariate thresholds derived from PV::WT interneurons. Abbreviations: I, input current. Vm, membrane voltage.
-
Figure 6—source data 1
Diameter measurements for axonal segments (f), branch order (g), and bivariate interbranch distance / axonal diameter values for myelinated and unmyelinated segments (h) of SOM::WT cells.
- https://cdn.elifesciences.org/articles/48615/elife-48615-fig6-data1-v2.xlsx
Figure 7 with 3 supplements

SOM::TSC1 cells are frequently myelinated.
(a) Overview of mouse breeding scheme. (b) SOM::TSC1 cells have enlarged somata. Left: Representative confocal images of SOM+ cells (red) confirm the increased expression of pS6 (green) in SOM::TSC1 cells. Higher magnification images in Figure 7—figure supplement 1. Right: SOM+ interneuron maximum projection soma area from mPFC layers II-V. SOM::WT: 101.8 ± 1.9 µm2, n = 81 cells; SOM::TSC1: 166.4 ± 3.7 µm2, n = 103 cells; n = 3 mice per group. ***p<0.001. Unpaired two-tailed Mann-Whitney U-test. (c) Representative SIM z-stack projection images of GFP-labelled SOM+ interneuron axons (red). SOM::WT (top), SOM::TSC1 (bottom). Scale bar, 3 µm. (d). SOM::TSC1 cells have an increased axonal diameter. SOM::WT: 0.799 ± 0.049 µm, n = 18 cells; SOM::TSC1: 1.407 ± 0.076 µm, n = 17 cells; n = 3 mice per group. ***p<0.001. Unpaired two-tailed Mann-Whitney U-test. (e) Experimental approach. Biocytin-filled regular-spiking SOM+ interneurons from mPFC of SOM::WT and SOM::TSC1 mice were analyzed using confocal imaging (f) Representative confocal z-stack projection image of a biocytin-filled SOM::TSC1 interneuron axon (red) and myelination (MBP), centered over a 7th branch order segment. Unmyelinated branch point indicated by white arrowhead. Scale bar = 10 µm. (g) Neurolucida reconstruction of an mPFC SOM::TSC1 cell. The axon (grey) shows multiple myelinated internodes (green) along the main branch. Note the frequent thin, tortuous, and unmyelinated axon collaterals. (h) In contrast to SOM::WT cells, all 11 reconstructed SOM::TSC1 cells were myelinated. (i–k) SOM::TSC1 cells exhibit a robust (i) total myelin (208.30 ± 33.14 µm), (j) number of internodes (6.97 ± 0.90 µm), and (k) internode length (28.33 ± 1.31 µm). ***p<0.001, Unpaired Student’s two-tailed t-test. SOM::WT: n = 6; SOM::TSC1: n = 11. (l) Myelin segments occur with similar frequency on main SOM::TSC1 axon branches and axon collaterals (p=0.99, Fisher’s Exact Test). (m) Frequency histogram of nearest neighbor distance from internodes to branch points. n = 38 segments/4 cells. (n) Distance from the soma or originating dendrite to the onset of myelination was measurable only for SOM::TSC1 cells due to the very infrequent myelination of SOM::WT cells. (o) Experimental approach. Biocytin-filled regular-spiking SOM+ interneurons from SOM::TSC1 mice were analyzed using confocal and SIM imaging. (p) The joint combination of axonal diameter and interbranch point distance is highly predictive of PV::TSC1 cell segmental myelination. Critical thresholds (dotted lines) for interbranch distance and axonal diameter were 11.8 µm and 406 nm, respectively. n = 86 segments/5 cells. Myelinated segments, green circles. Unmyelinated segments, black circles. (q) ROC curves for SOM::TSC1 cells. ROC curves of segmental myelination, comparing univariate models of interbranch distance (blue) and axonal diameter (red), and their joint bivariate combination (green). Diagonal dotted line indicates the non-discrimination reference boundary. Unpaired Student’s two-tailed t-test in (i), (j) and (k). Unpaired two-tailed Mann-Whitney U-test in (b) and (d) owing to non-normality. Black bars represent mean ± s.e.m. Abbreviations: ROC, receiver-operator characteristic.
-
Figure 7—source data 1
Soma area (b), axon onset diameter (d), total recovered myelination length (i), internode number (j), internode length (k), myelin onset distance (n), as well as bivariate interbranch distance / axonal diameter values for myelinated and unmyelinated segments of SOM::TSC1 (p) cells.
- https://cdn.elifesciences.org/articles/48615/elife-48615-fig7-data1-v2.xlsx
Figure 7—figure supplement 1
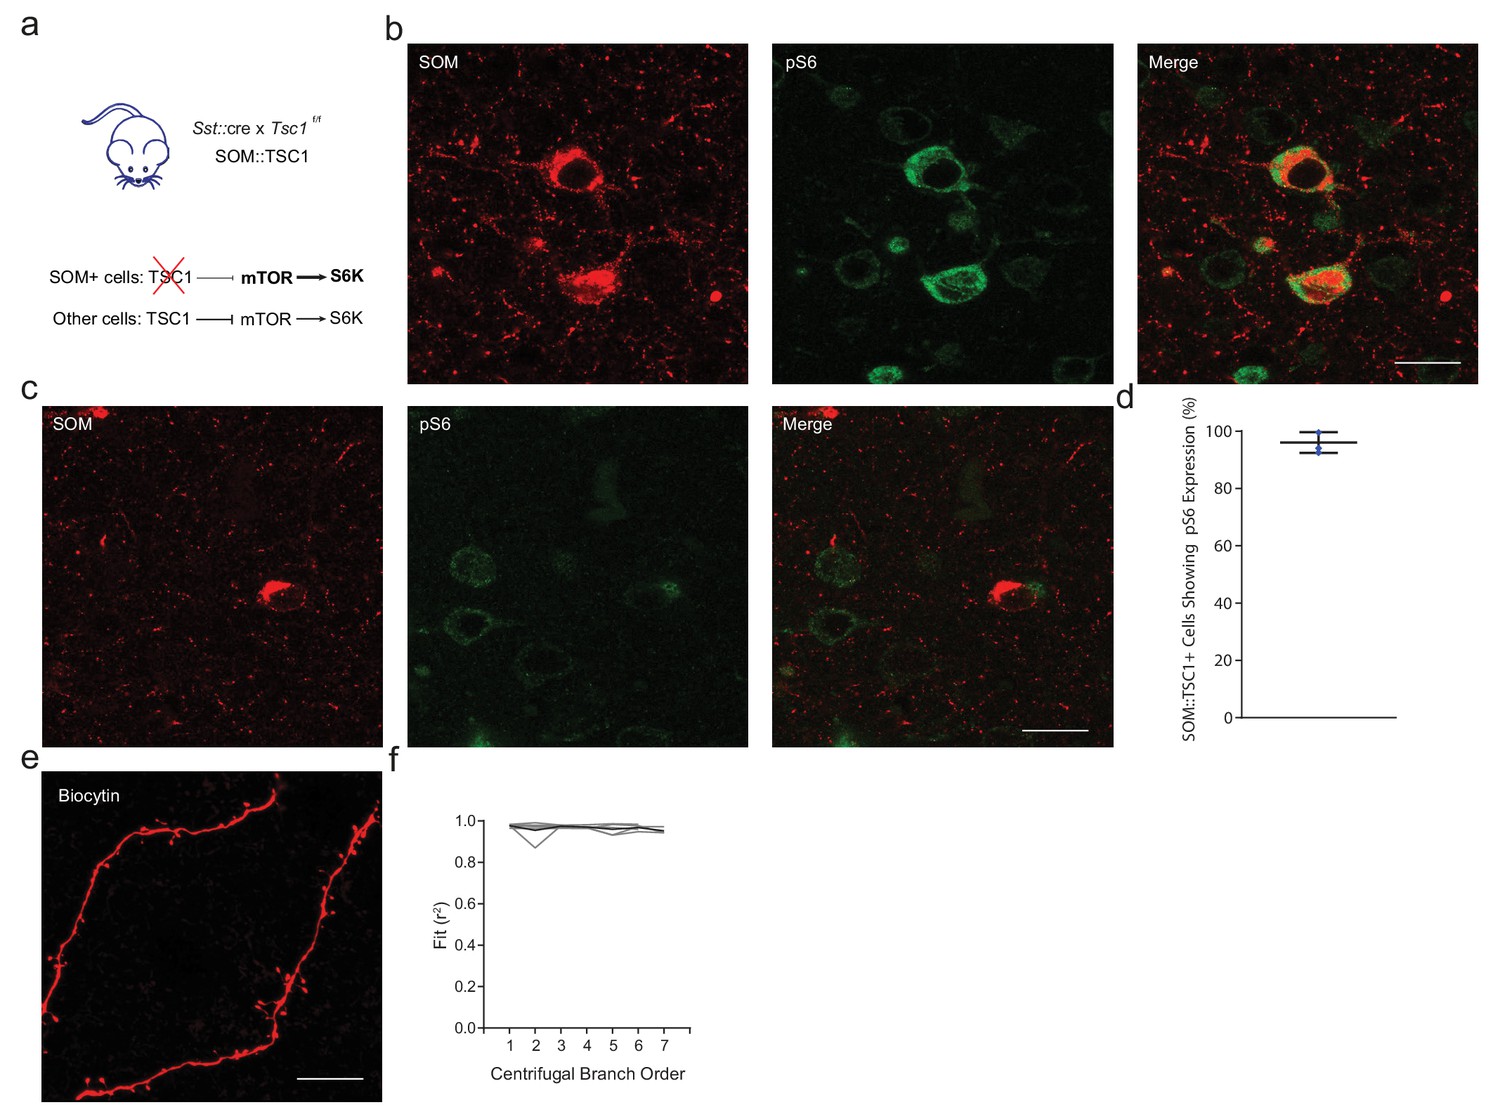
SOM::TSC1 mice exhibit SOM-specific deletions of Tsc1.
(a) Sst::cre mice were crossed with floxed Tsc1f/f to obtain heterozygous Sst::cre x homozygous Tsc1-/- mice (SOM::TSC1). In the absence of Tsc1, mTOR signaling is disinhibited leading to excessive S6K activity. (b) Maximum projection confocal image showing increased expression of pS6235/236 (green) in most SOM::TSC1 cells (red). Uncropped image from Figure 7b. (c) Maximum projection confocal image showing low expression of pS6235/236 (green) in a minority of SOM::WT cells (red). Uncropped image from Figure 7b. (d) Corresponding deletion of Tsc1 was observed in 95.8 ± 2.1% of cells, n = 3 mice. (e) High magnification SIM image of a biocytin-filled cell confirming the presence of dendritic spines on SOM+ interneurons. Scale bar, 10 µm. (f) r2 for FWHM Gaussian fits of SOM+ cell reconstructions. Median Gaussian fits (r2) over branch order, prior to exclusion of points with r2 <0.9. Individual cells in grey, average in black. Black bars denote means ± s.e.m.
Figure 7—figure supplement 2

SOM::TSC1 mice have a normal SOM+ cell density in mPFC.
(a) Confocal microscopy image showing immunofluorescence of SOM (red) and DAPI (white) in adult mPFC for SOM::WT, and SOM::TSC1. Scale bar, 100 µm. (b) SOM+ cell density in mPFC of SOM::TSC1 and SOM::WT mice. p=0.416, Unpaired two-tailed Student’s t-test. Black bars indicate mean ± s.e.m.
Figure 7—figure supplement 3
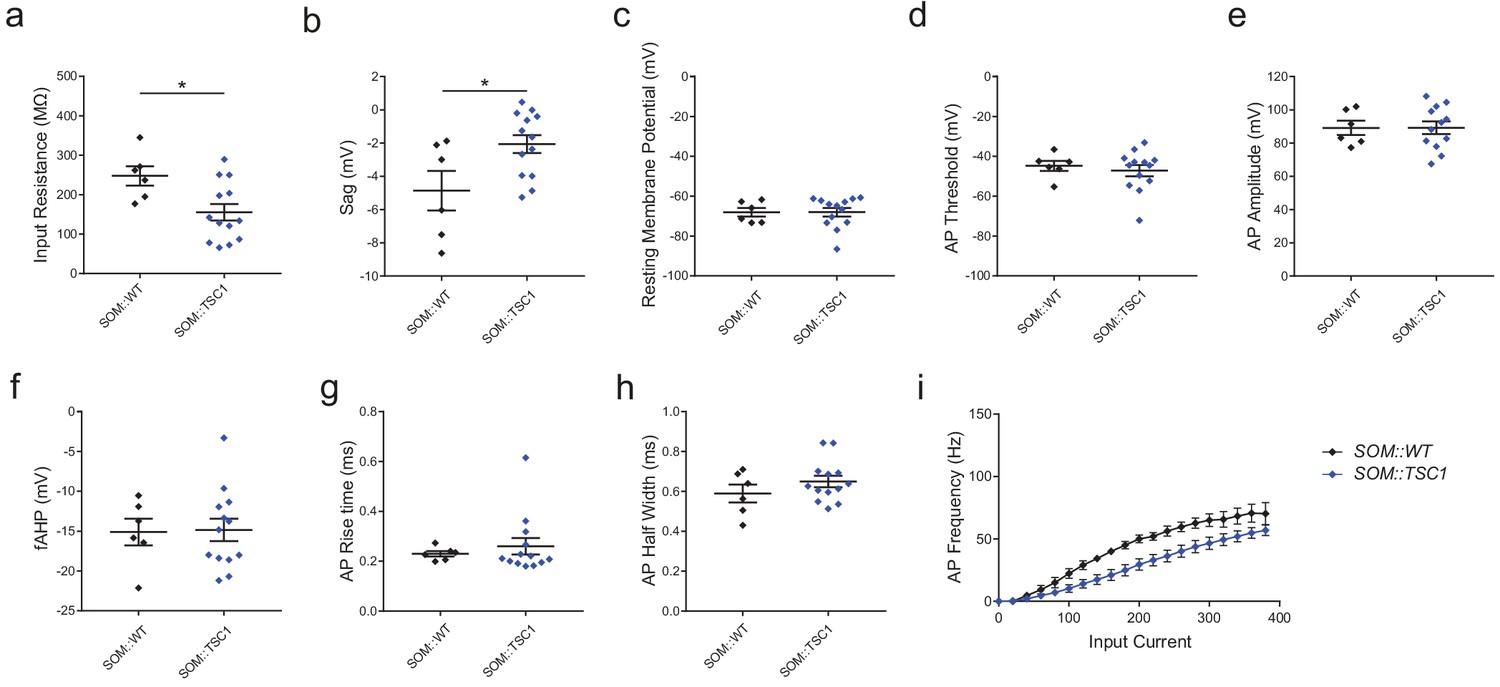
Electrophysiological properties of SOM::TSC1 and SOM::WT cells.
(a) input resistance. p=0.018. (b) sag potential. p=0.023. (c) resting membrane potential. p=0.993. (d) AP threshold. p=0.605. (e) AP amplitude. p=0.994. (f) fast afterhyperpolarization (fAHP) amplitude. p=0.915. (g) AP rise time. p=0.639. (h) AP half-width. p=0.265. (i) Frequency-current plot, in response to square-wave current steps. p<0.001. SOM::WT, n = 6 cells; SOM::TSC1, n = 13 cells. *p<0.05 Unpaired two-tailed Student’s t-test in (a) through (f) and (i). Mann-Whitney U test in (h). Repeated measures ANOVA in (i). Black bars denote means ± s.e.m. Abbreviations: AP, action potential; fAHP, fast afterhyperpolarization.
Figure 8
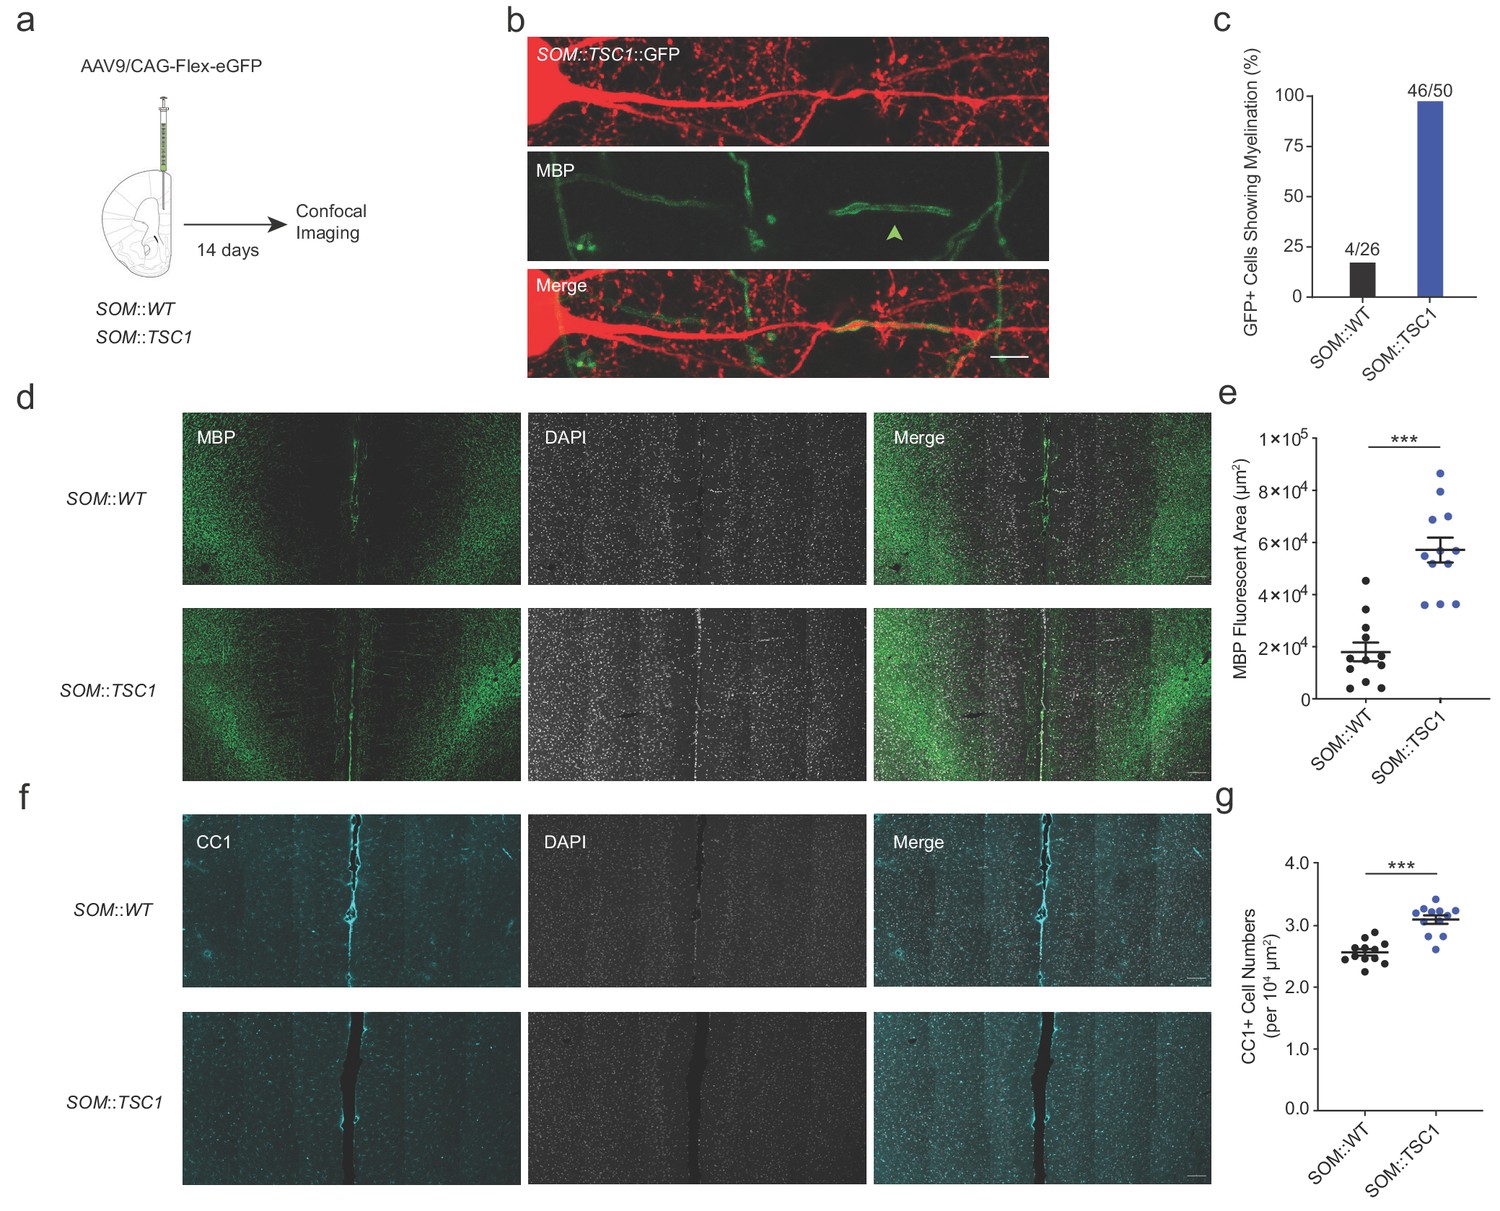
Extensive axonal myelination of SOM::TSC1 cells.
(a) Experimental flowchart. Adult SOM::WT and SOM::TSC1 mice were injected with low-titer AAV9 cre-dependent GFP reporter virus in mPFC, and sacrificed 14 days later for MBP immunofluorescence labeling and confocal microscopy. (b) Maximum projection confocal image of a GFP-labelled SOM::TSC1+ interneuron showing circumferential MBP expression (green). Scale bar, 5 µm. (c) A high proportion of virally-labelled SOM::TSC1 cells exhibited myelination (92.0%, 46 of 50 cells), in contrast to SOM::WT cells (15.4%, 4 of 26 cells) (p<0.001, Fisher’s Exact Test). (d) Representative low-magnification confocal image from mPFC showing the robust increase of myelination (MBP, green) in SOM::TSC1 compared to SOM::WT mice. DAPI in white. Scale bar, 100 µm. (e) Quantification of MBP+ area in mPFC of SOM::TSC1 mice (5.7 × 10⁴ ± 0.48 x 104 µm2) compared to SOM::WT mice (1.8 × 10⁴ ± 0.36 x 104 µm2). p<0.001, Unpaired Student’s two-tailed t-test. (f) Confocal microscopy image showing immunofluorescence of CC1 (cyan) and DAPI (white) in adult mPFC of SOM::WT and SOM::TSC1 mice. Scale bar, 100 µm. (g) CC1+ cell density in adult mPFC of SOM::TSC1 and SOM::WT mice. p<0.001, Unpaired Student’s two-tailed t-test. Black bars indicate mean ± s.e.m.
-
Figure 8—source data 1
MBP+ area (e) and CC1+ cell counts (g) in SOM::WT and SOM::TSC1 cells.
- https://cdn.elifesciences.org/articles/48615/elife-48615-fig8-data1-v2.xlsx
Figure 9
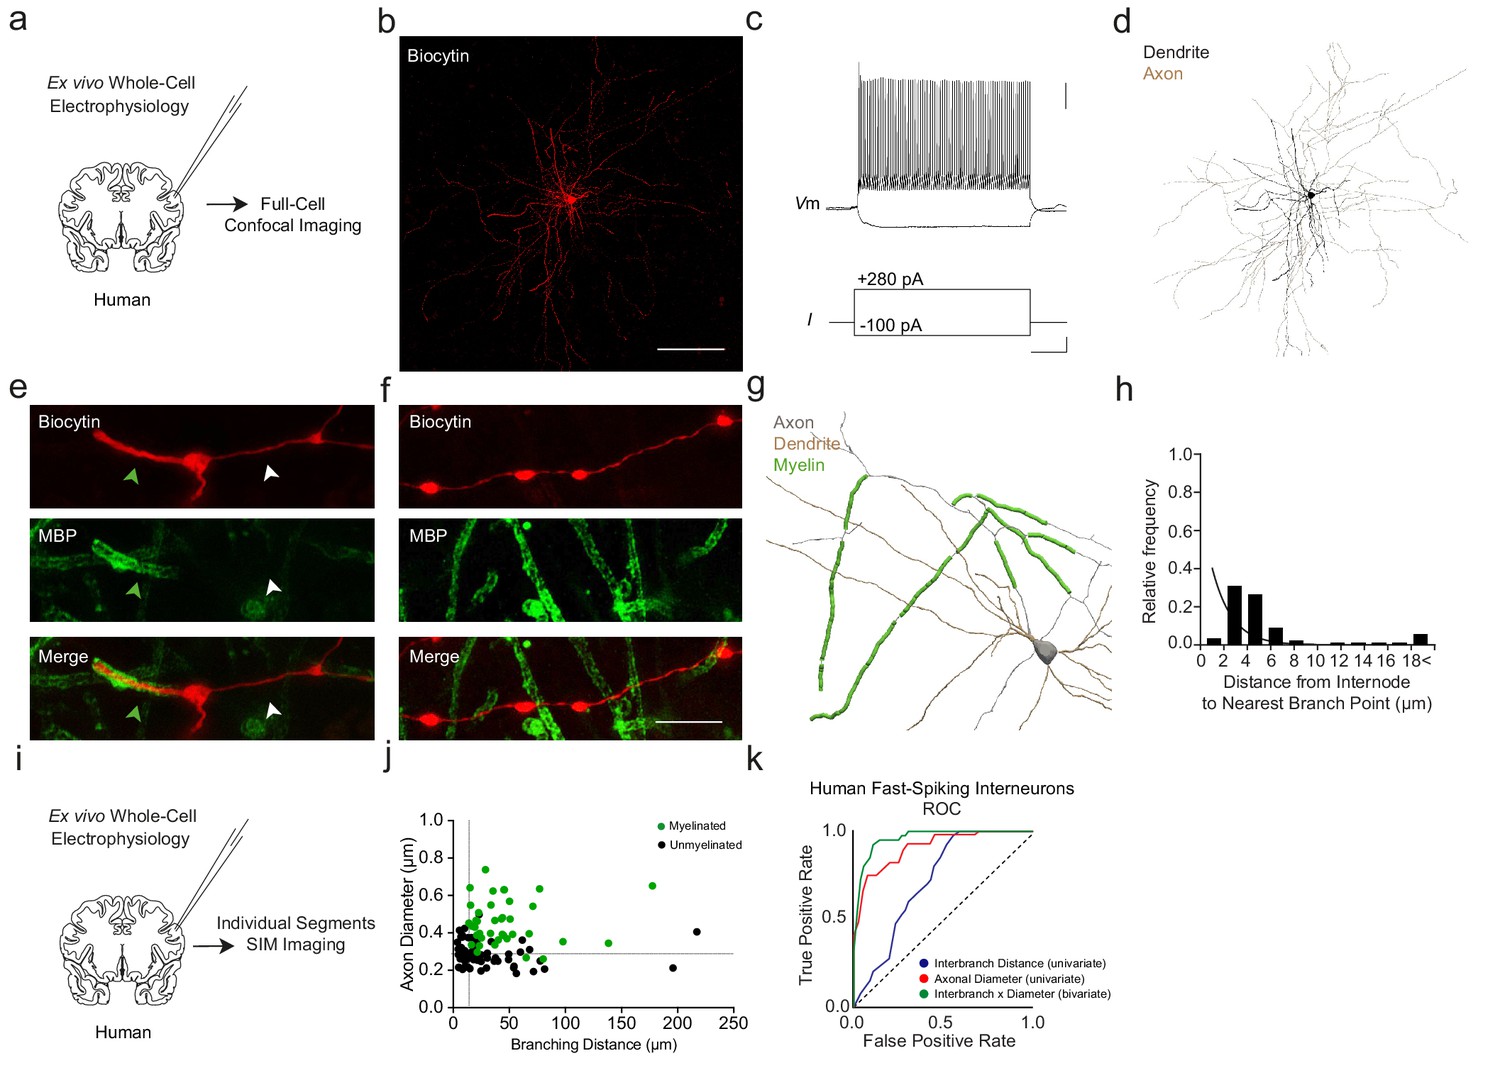
Myelination thresholds extend to fast-spiking interneurons in human cortex.
(a) Experimental approach. Biocytin-filled interneurons from human ex vivo resected cortical tissue were analyzed using confocal imaging. (b) Maximum projection confocal image of a representative biocytin-filled human fast-spiking interneuron (red). Scale bar, 50 µm. (c) Current clamp recording of evoked action potentials of human fast-spiking interneuron. Scale bars are 20 mV, 100 pA and 100 ms from top to bottom (right). (d) Full reconstruction of a human fast-spiking interneuron. Soma and dendrites in black, axon in brown. (e) Representative SIM z-stack projection image of a PV+ cell (biocytin, red), centered over a myelinated (MBP; green) 1st order axonal segment. Note that the myelinated axonal segment (green arrowhead) has a larger diameter than the unmyelinated axon segment (white arrowhead). (f) Representative SIM z-stack projection featuring an unmyelinated segment of axon (red) centered over the 3rd branch order. Scale bar 10 µm for (e) and (f). (g) Neurolucida reconstruction of a human fast-spiking interneuron axon. Axon in grey, myelinated segments in green. Since axon originated from proximal dendrite, dendrite is also depicted in brown. Note the proximal onset of myelin, consisting of short internodes interspersed by branch points. (h) Frequency histogram of nearest neighbor distance from internodes to branch points. n = 55 segments/3 cells. (i) Experimental approach. Biocytin-filled interneurons from human ex vivo resected cortical tissue were analyzed using SIM imaging. (j) The joint combination of axonal diameter and interbranch point distance is highly predictive of human fast-spiking interneuron segmental myelination. Critical thresholds (dotted lines) for interbranch distance and axonal diameter were 13.7 µm and 328 nm, respectively. n = 96 segments/4 cells. Myelinated segments, green circles. Unmyelinated segments, black circles. (k) ROC curves for human fast-spiking interneurons. ROC curves of segmental myelination, comparing univariate models of interbranch distance (blue) and axonal diameter (red), and their joint bivariate combination (green). Diagonal dotted line indicates the non-discrimination reference boundary. Abbreviations: ROC, receiver-operator characteristic. I, input current. Vm, membrane voltage.
-
Figure 9—source data 1
Morphological measures in human fast-spiking neocortical interneurons: internode-to-branch point (h), and bivariate interbranch distance / axonal diameter values for myelinated and unmyelinated segments (j).
- https://cdn.elifesciences.org/articles/48615/elife-48615-fig9-data1-v2.xlsx
Videos
Video 1
Adult PV::TSC1 mice are ataxic.
Left: PV::WT littermate. Right: PV::TSC1 mouse showing ataxia.
Additional files
-
Source code 1
Fiji source code for automated quantification of axonal diameter within user-defined segments based on the Gaussian full-width at half-maximum of the orthogonal cross-section of fluorescence intensity.
- https://cdn.elifesciences.org/articles/48615/elife-48615-code1-v2.ijm
-
Supplementary file 1
Electrophysiological properties of Pvalb::cre,Ai14 PV+ cells.
- https://cdn.elifesciences.org/articles/48615/elife-48615-supp1-v2.docx
-
Supplementary file 2
Electrophysiological properties of Sst::cre,Ai14 SOM+ cells.
- https://cdn.elifesciences.org/articles/48615/elife-48615-supp2-v2.docx
-
Supplementary file 3
Electrophysiological properties of human fast-spiking interneurons.
- https://cdn.elifesciences.org/articles/48615/elife-48615-supp3-v2.docx
-
Transparent reporting form
- https://cdn.elifesciences.org/articles/48615/elife-48615-transrepform-v2.pdf
Download links
A two-part list of links to download the article, or parts of the article, in various formats.
Downloads (link to download the article as PDF)
Open citations (links to open the citations from this article in various online reference manager services)
Cite this article (links to download the citations from this article in formats compatible with various reference manager tools)
Local axonal morphology guides the topography of interneuron myelination in mouse and human neocortex
eLife 8:e48615.
https://doi.org/10.7554/eLife.48615


