A distinct transition from cell growth to physiological homeostasis in the tendon
- Massachusetts General Hospital, Harvard Medical School, United States
- Harvard University, United States
- Broad Institute of Harvard and MIT, United States
- Harvard Stem Cell Institute, United States
Figures
Figure 1 with 1 supplement
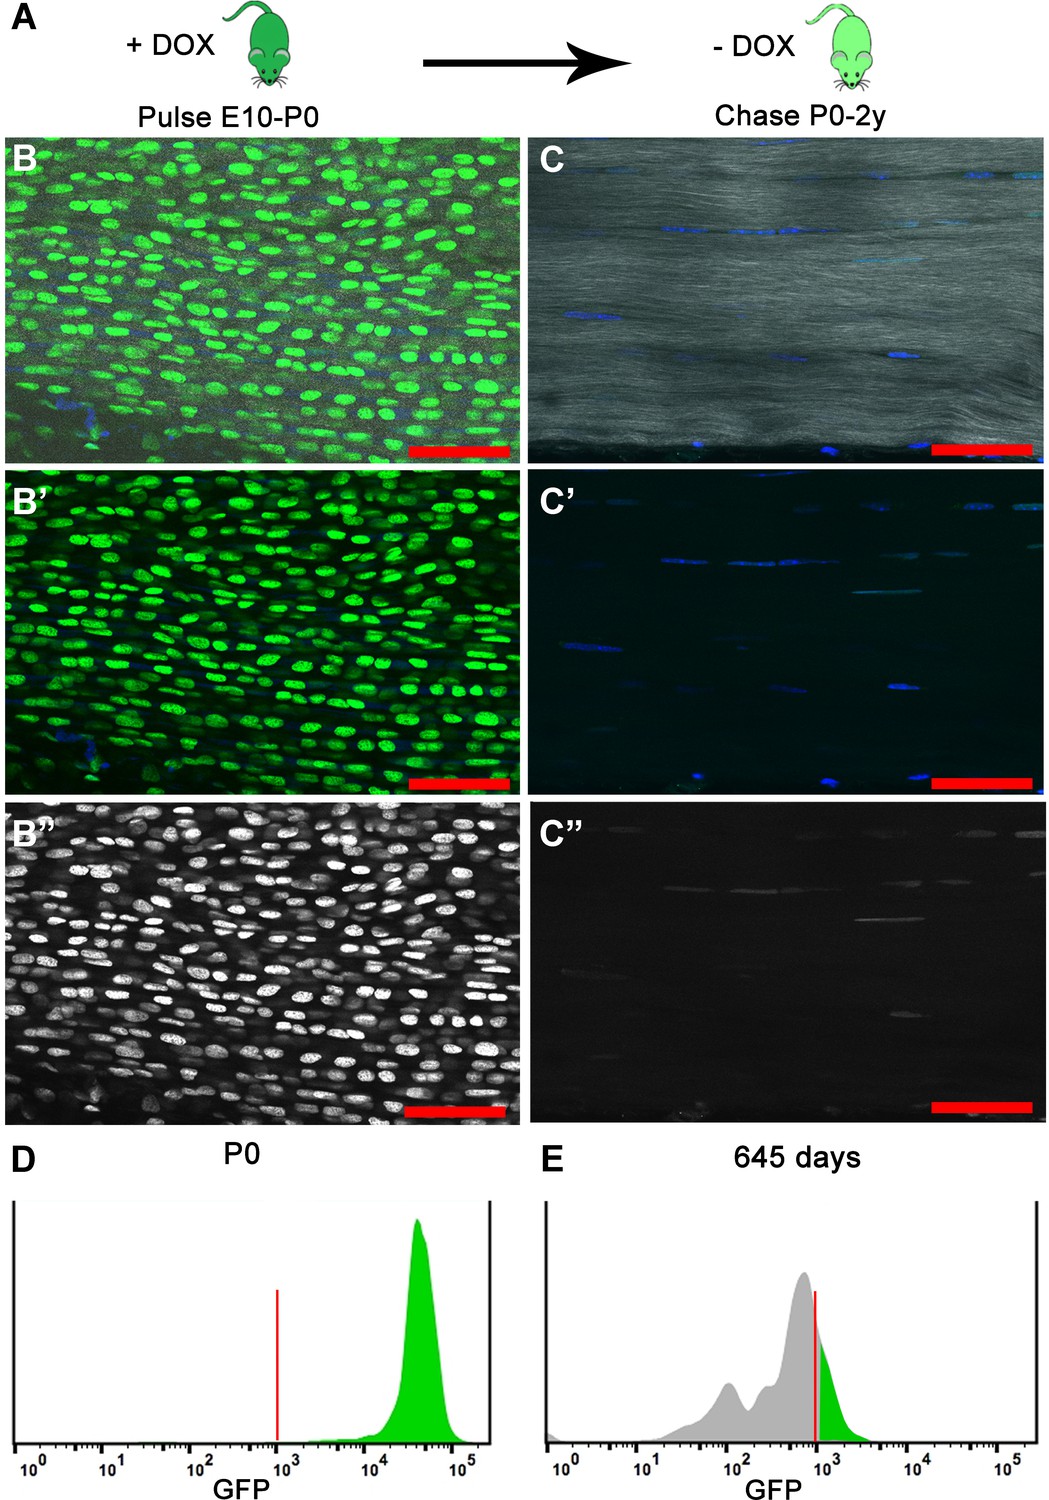
H2B-GFP expression is induced upon the addition of Dox to timed pregnant females from E10 to P0 (dark green); Dox is removed for the chase period of 0–2 years and H2B-GFP protein is diluted (light green) in proportion to cell division.
(A) At birth (P0), longitudinal sections of Achilles (B–B’’) tendons (n = 3 mice) show extensive H2B-GFP+ (green B, B'; white B’’) labeling of Hoechst+ nuclei (blue, B, B’). SHG is shown in white (B, C). Histogram showing that more than 95% of the cells are H2B-GFP+ at P0 (D). After 680 days, Achilles (C–C’’) tendons (n = 3 mice) have qualitatively fewer H2B-GFP+ (green C, C'; white C’’) labeled Hoechst+ nuclei (blue C, C’). Histogram showing only 20% of the cells are H2B-GFP+ and the H2B-GFP intensity has decreased at 645 days (E). For the histograms, a representative is shown; tendons from n > 3 mice were examined independently. Scale Bars, 50 µm; Vertical red lines (H, O) indicate the control GFP beads for standardizing intensity and gates.
Figure 1—figure supplement 1
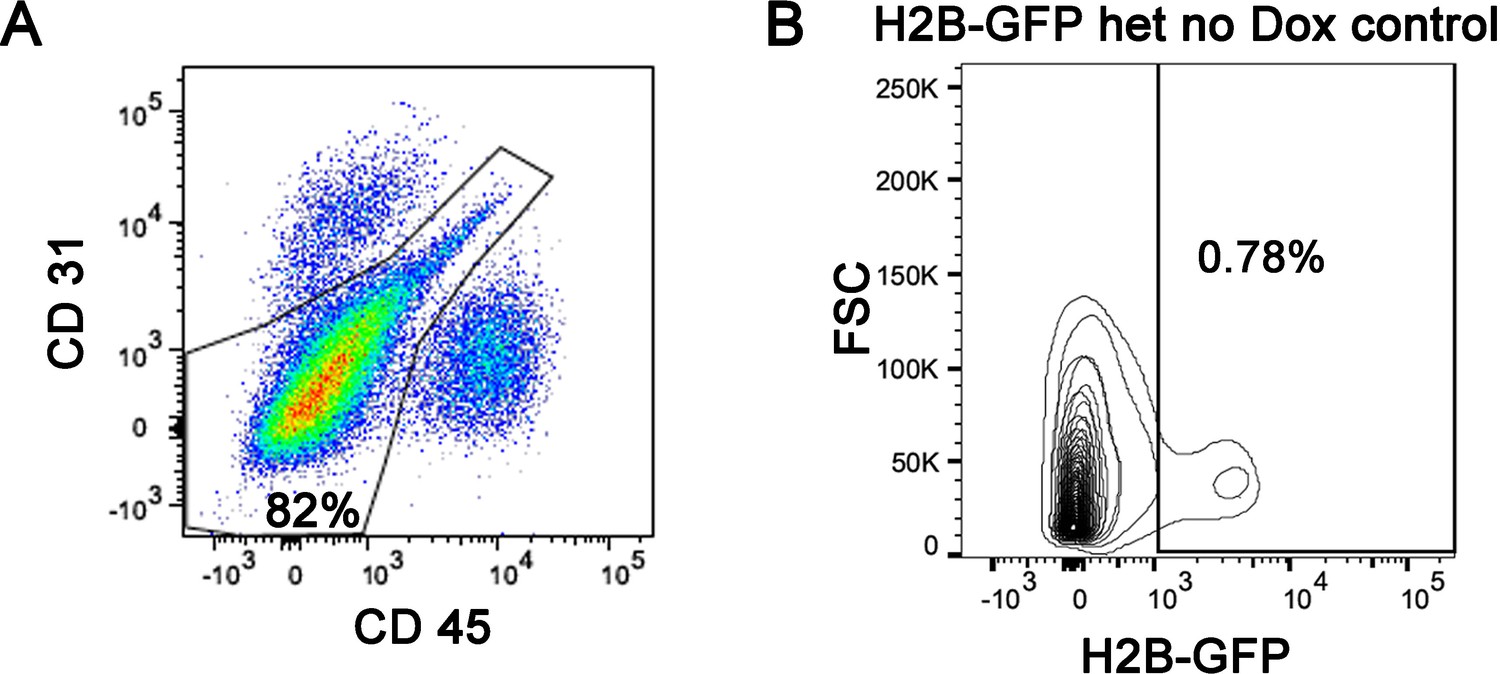
Flow cytometry analysis of H2B-GFP+ tendon cells showing the exclusion of CD31+ and CD45+ cells; CD31-/CD45- cells (80–90%) were used for our H2B-GFP analysis.
(A) A representative flow cytometry analysis of H2B-GFP expression in a H2B-GFP heterozygous mouse that never received Dox, indicating a relatively small amount (<1%) of transgene expression occurs in the absence of Dox induction (B). n = 3 mice per experiment.
Figure 2
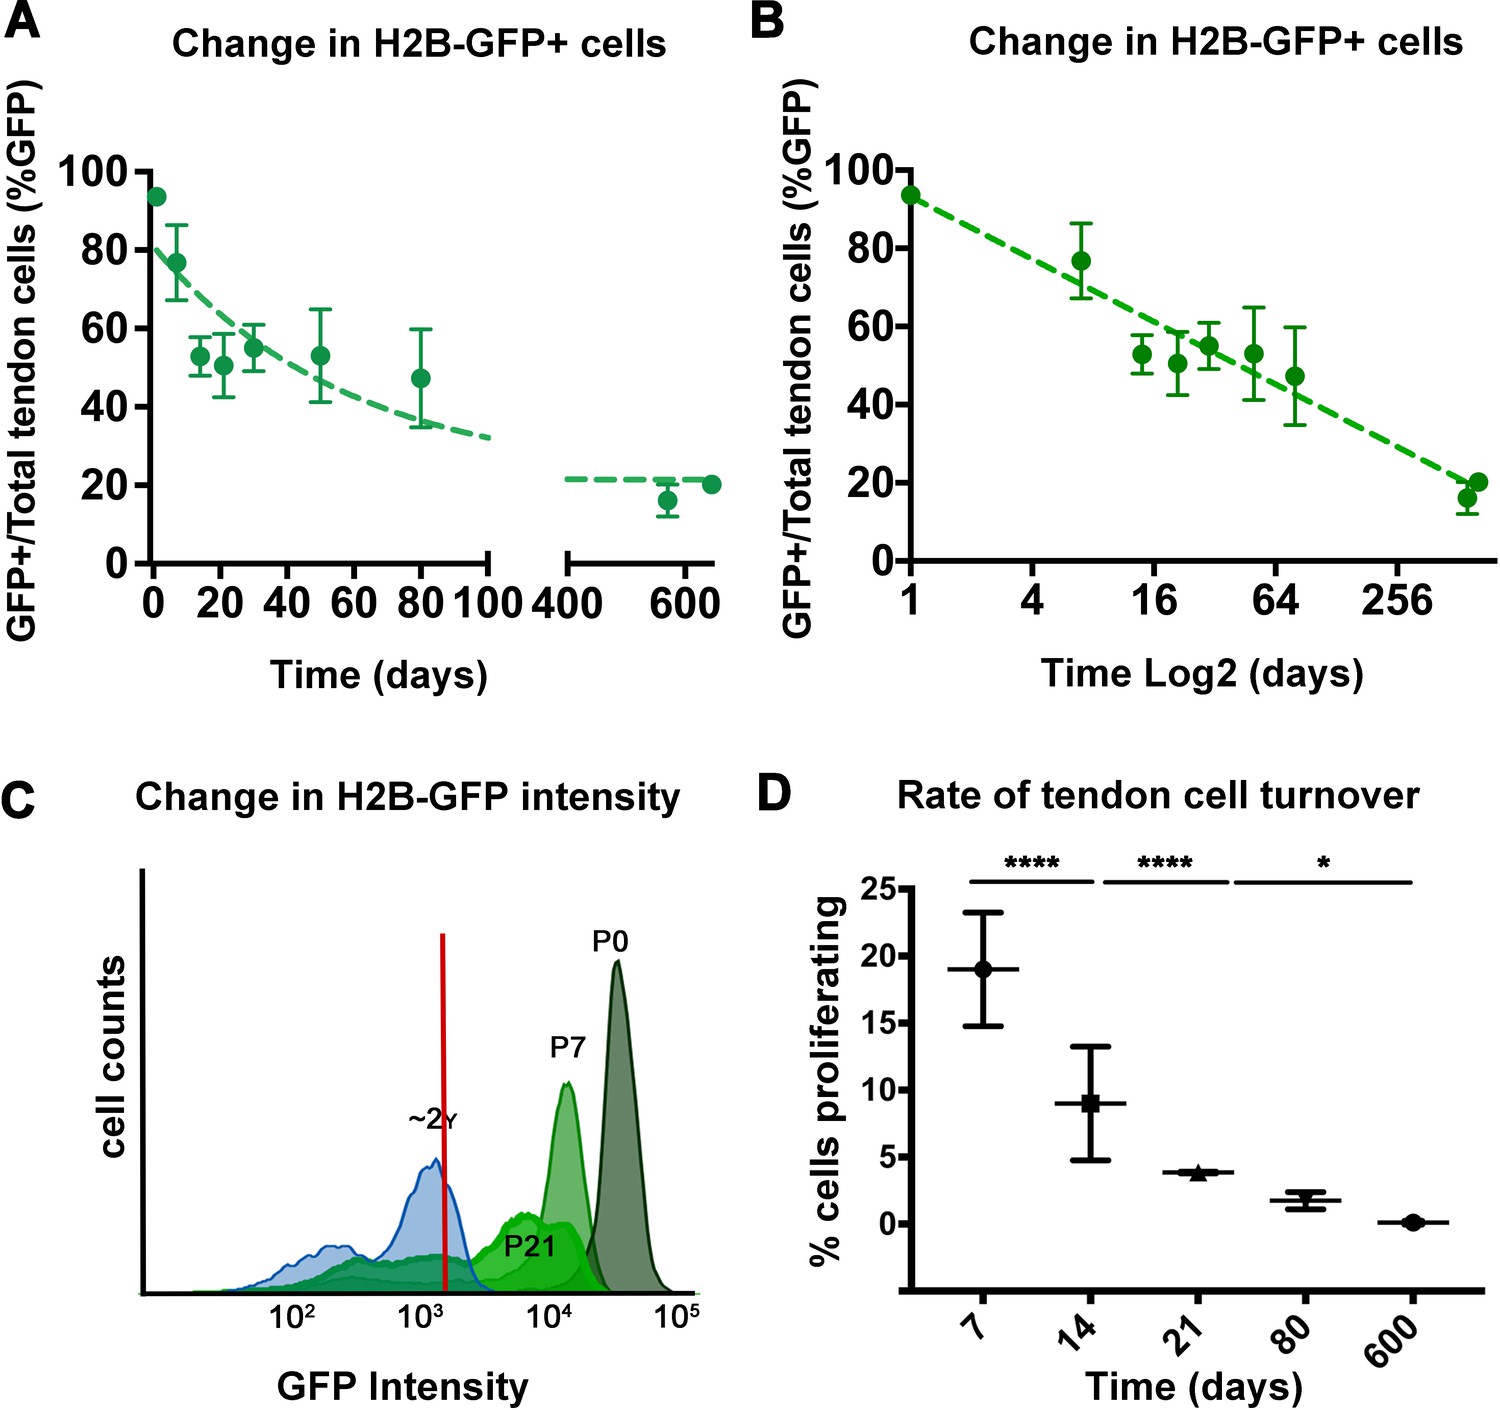
Analysis of H2B-GFP+ cells from postnatal to aged stages.
The percentage of H2B-GFP+ tendon cells decreases from P0 to P645, with a rapid decline of H2B-GFP+ tendon cells by 14 days post birth and a more graduate decrease in H2B-GFP+ cells from P14 to P645 (A). Analysis of H2B-GFP+ tendon cells shows logarithmic decay (log2) in the percentage of H2B-GFP+ cells (B). H2B-GFP+ tendon cells decrease in their intensity of GFP from P0 to P645 (C; stages examined are labeled and shown with different shades of green; histogram is a representative from n = 4 mice). Using the change in H2B-GFP intensity, a model was used to calculate the daily cell proliferation rates (D), which shows significantly higher proliferation rates from P0 to P21, and lower proliferation rates at P80 and P600. Tendons from n > 3 mice were examined per each stage shown on the graph. All error bars represent standard deviation.
-
Figure 2—source data 1
Source data for Figures 2A–C and 3A-D.
- https://doi.org/10.7554/eLife.48689.006
-
Figure 2—source data 2
Source data for Figure 2D.
- https://doi.org/10.7554/eLife.48689.007
Figure 3 with 1 supplement
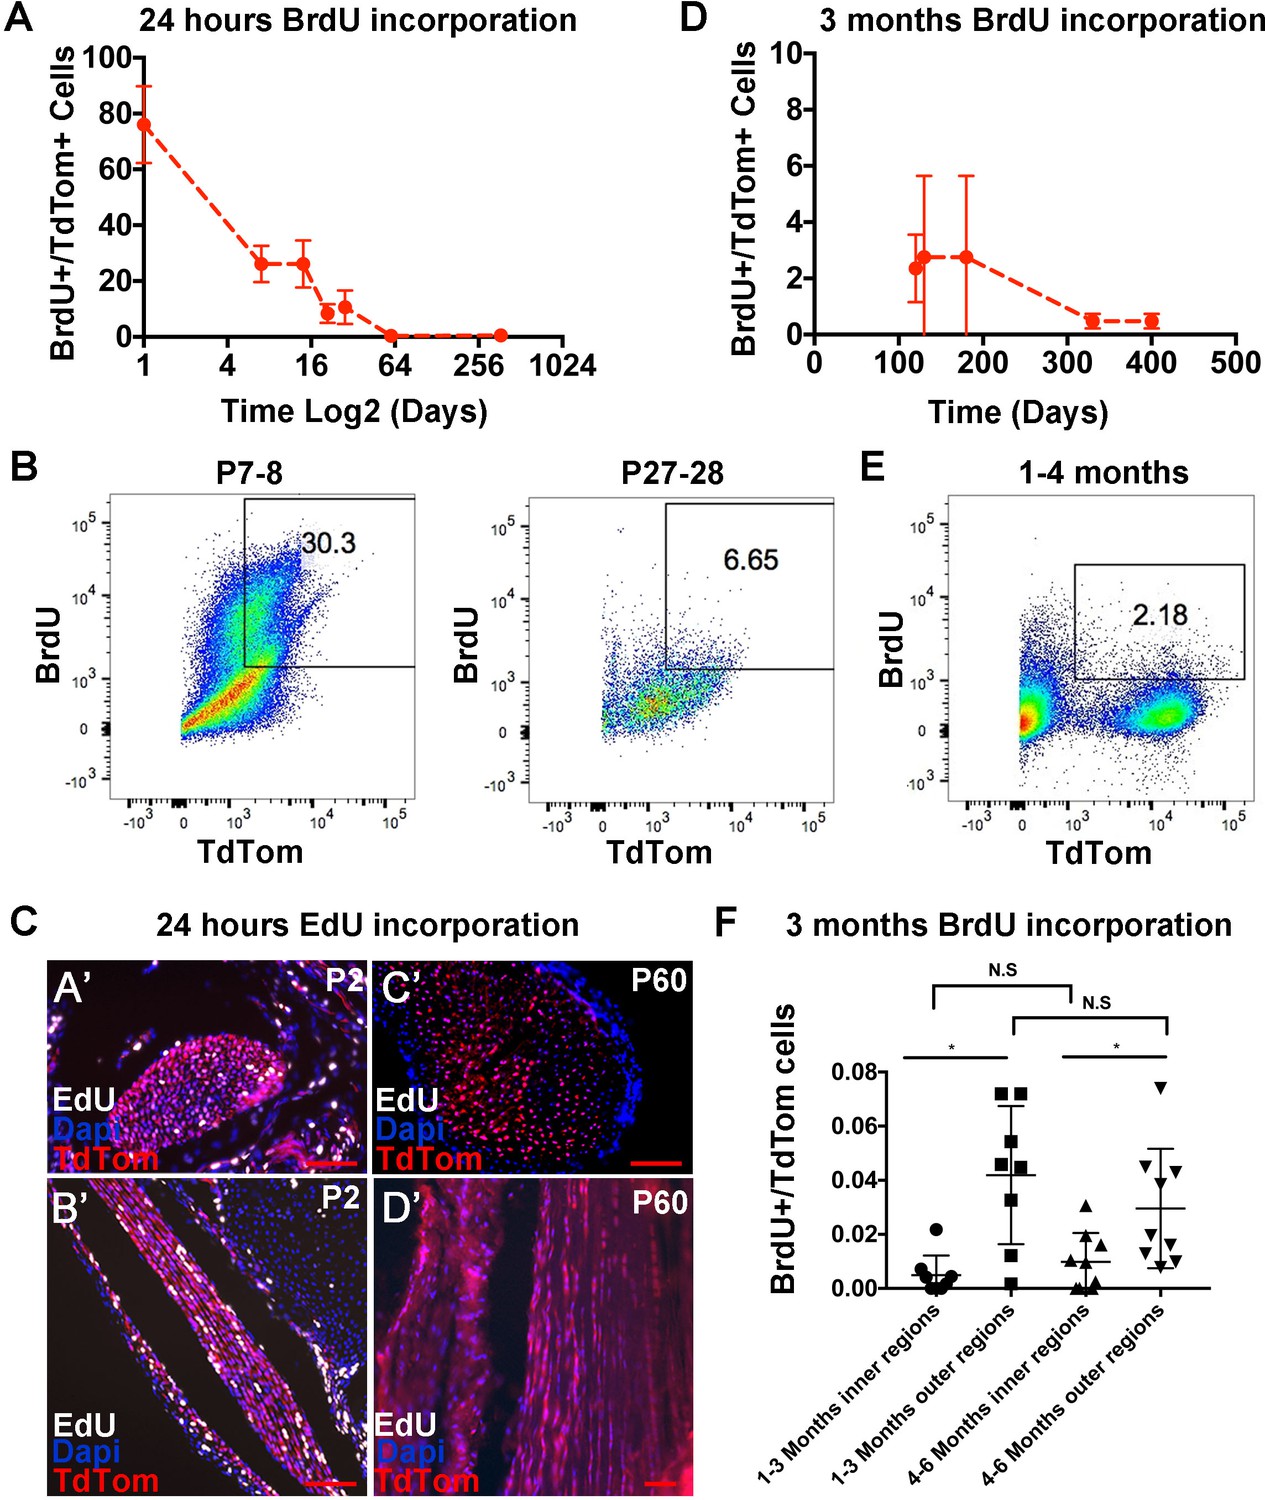
Analysis of tendon cell proliferation using short and long pulses of BrdU/EdU.
Examination of BrdU incorporation 24 hr after BrdU injection reveals higher BrdU incorporation rates at P0 through P14 compared with P21 and later stages (A). Representative flow cytometry of 24 hr BrdU labeled Scx-Cre;TdTom+ tendon cells shows 30.3% BrdU+/TdTom+ cells at P8 and 6.65% BrdU+/TdTom+ cells at P28 (B). 24 hr EdU labeling identifies a significant number of proliferating cells at P2 (C, A’, B’), but no EdU+ cells were observed at P60 (C, C’,D’). Administration of BrdU for over 90 days after P30 shows low but detectable levels of BrdU incorporation from 120 to 400 days (D). Example flow cytometry shows 2.18% BrdU+/TdTom+ cells after 3 months of BrdU incorporation (1–4 months, (E). Quantification of BrdU+/TdTom+ cells in tendon sections (F) shows a similar percentage of incorporation as the flow cytometry analysis and significantly more BrdU incorporating nuclei in outer Achilles tendon regions compared with inner regions at either 3 and 6 months. For all experiments, n = 3 mice were examined per stage. Error bars are standard deviation. Scale bars = 100 µm.
-
Figure 3—source data 1
Source data for Figure 3F.
- https://doi.org/10.7554/eLife.48689.010
Figure 3—figure supplement 1
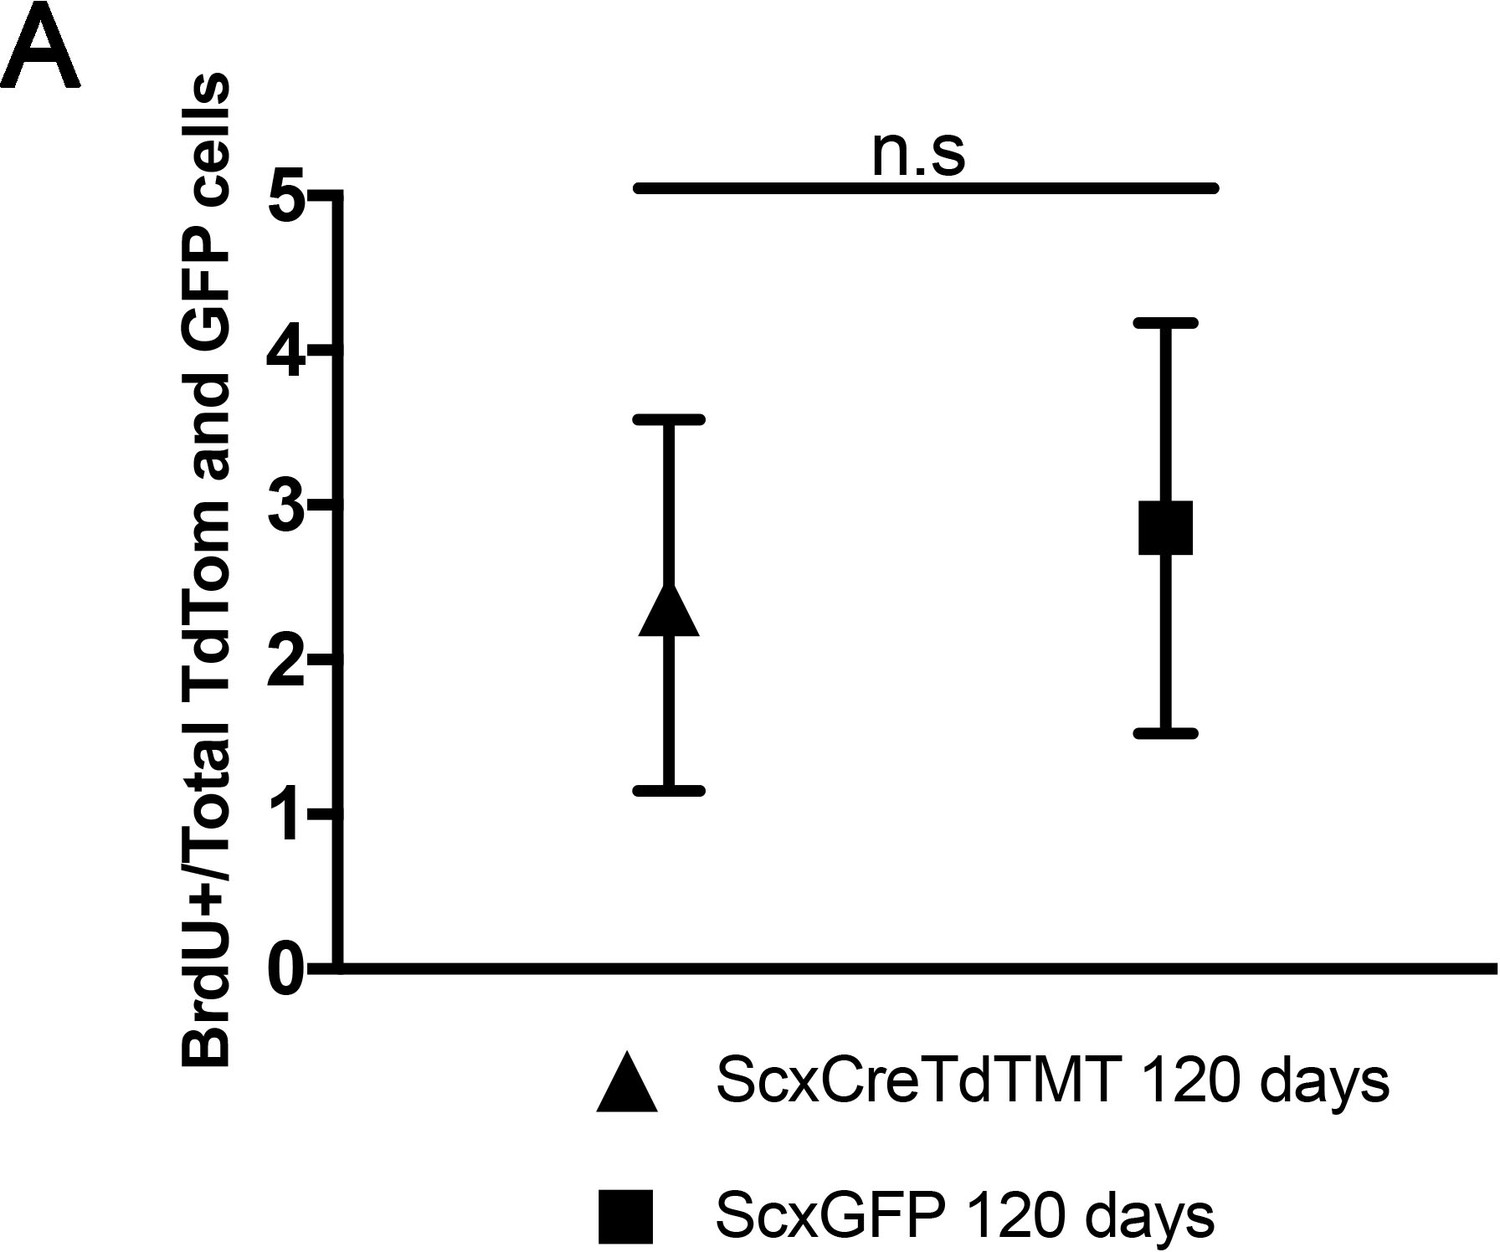
No significant differences in the percentage of BrdU+ cells were observed between Scx-Cre;TdTom+ cells and Scx-GFP+ cells after 120 days of BrdU incorporation.
n = 3 mice per experiment. Error bars are standard deviation.
Figure 4
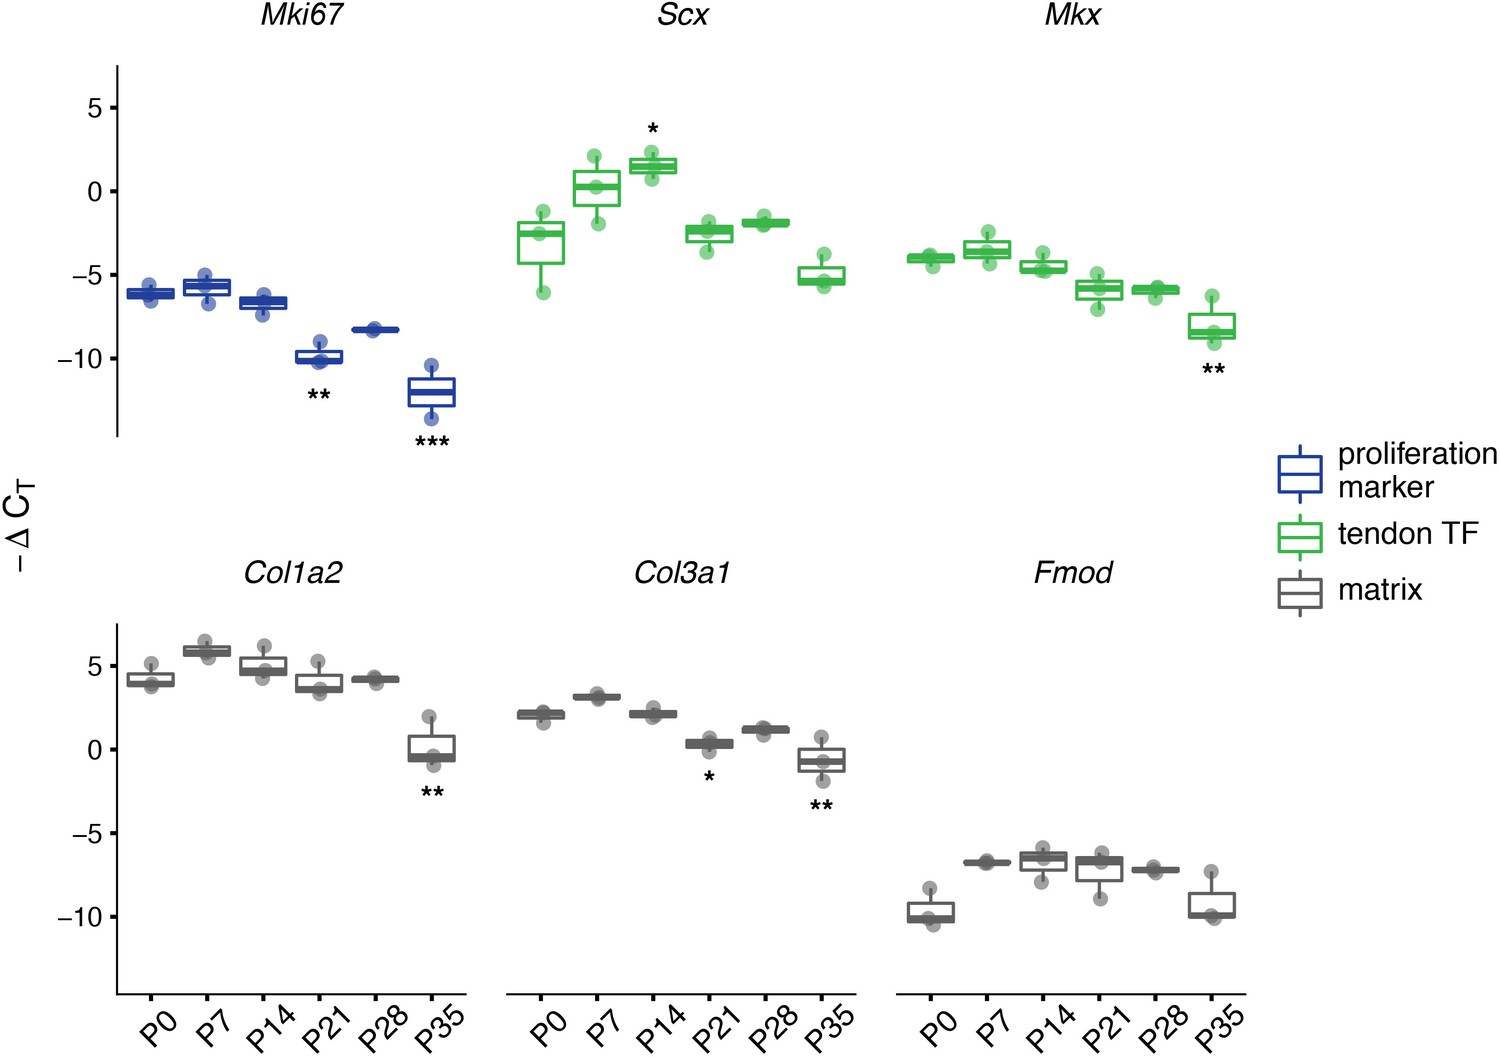
Expression of tendon and matrix related genes changes during the transition in cell division rate.
RT-qPCR of selected markers of proliferation (Mki67; blue), tendon transcription factors (TFs, Scx and Mkx; green), and extracellular matrix (Col1a2, Col3a1, and Fmod; gray). Relative expression was calculated using the ∆CT method using Gapdh as the reference gene. For all genes assayed, significant differences between all six time points were found via ANOVA (p<0.05). Stars indicate significant differences based on Tukey’s HSD compared to P0 only (*p<0.05; **p<0.01; ***p<0.001). See Supplementary file 1 for ANOVA statistics and full report of post hoc pairwise comparisons. n = 3 biological replicates per time point. Boxplot edges represent the interquartile range (IQR) and the middle line represents the median. Whiskers represent 1.5 x IQR.
Figure 5
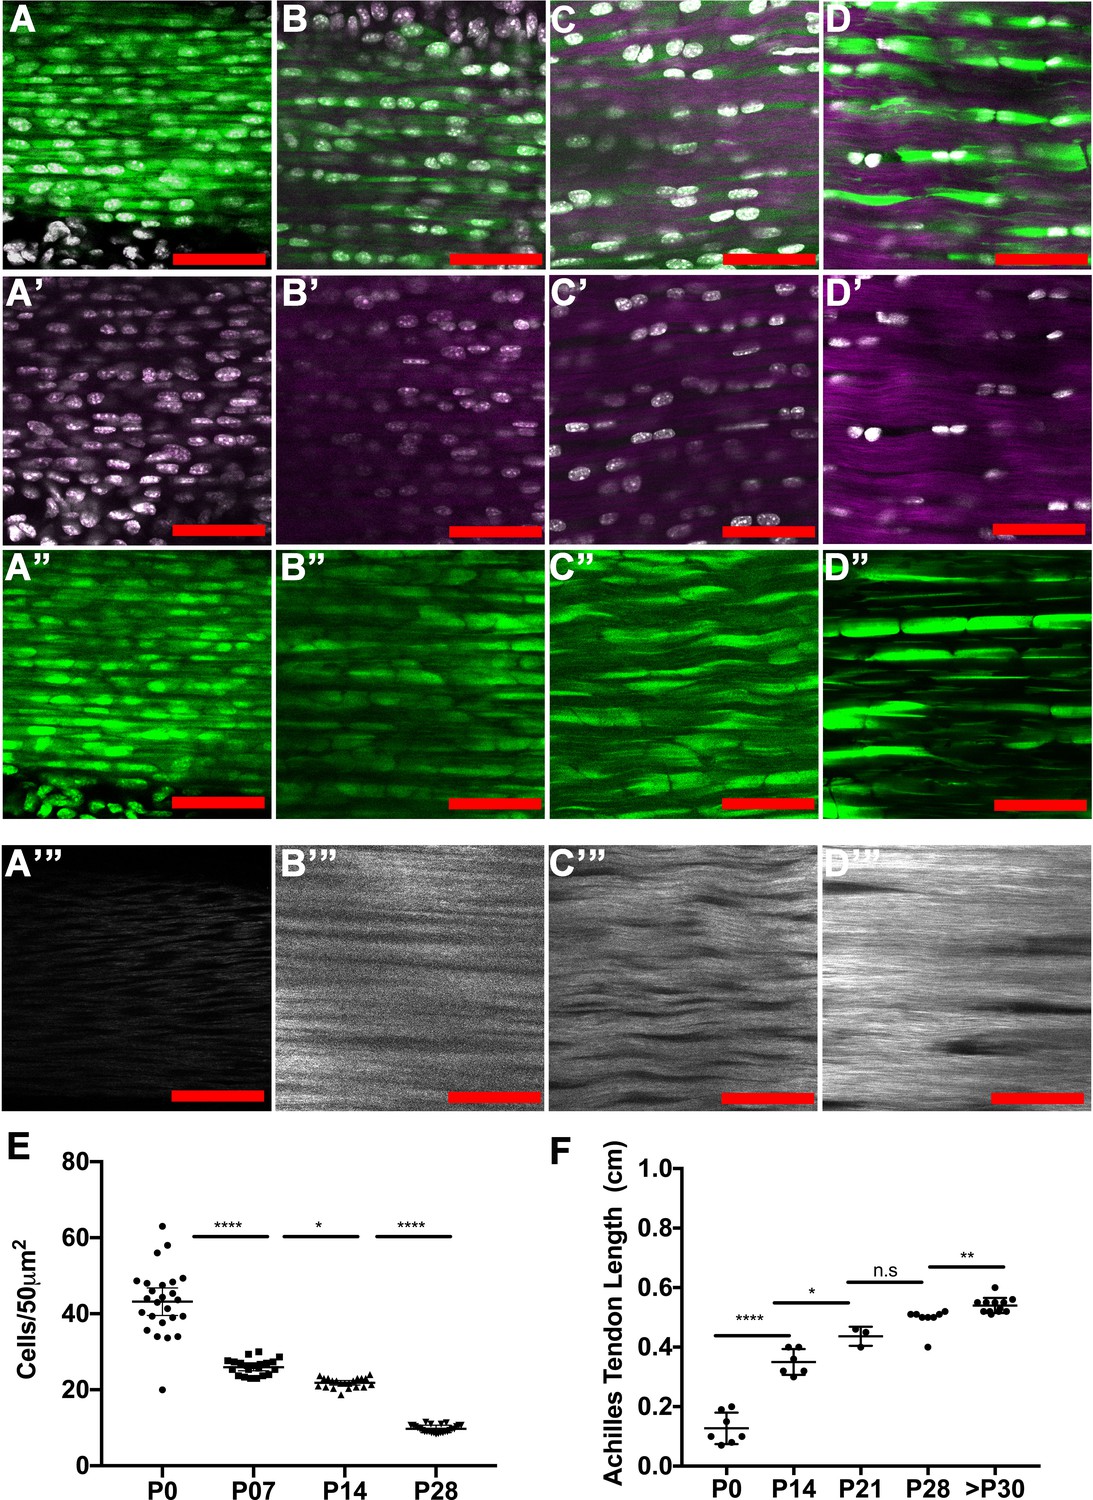
Tendon growth corresponds to changes in tendon cell density and matrix organization.
Two photon microscopy images of Achilles tendons showing second harmonic generation signal (purple, A-D’; white, A’’’–D’’’), Hoechst+ nuclei (white, A–D’), and Scx-GFP+ cells (green, A–D, A’’–D’’). Images show changes in cell density, cell shape, and collagen organization at P0 (A–A’’’), P7 (B–B’’’), P14 (C–C’’’), and P28 (D–D’’’). Using optical sections from 2-photon images, we found that tendon cell density significantly decreases at postnatal stages (E, each point represents cell counts from an optical section; n = 3 mice analyzed per stage). The Achilles tendon undergoes significant longitudinal growth from P0 to P30; no significant increases in Achilles length is detected after P30 (F, each point represents measurements from one mouse Achilles; n > 3 mice). Error bars are standard deviation. Scale bars = 100 µm.
-
Figure 5—source data 1
Source data for Figure 5A.
- https://doi.org/10.7554/eLife.48689.013
-
Figure 5—source data 2
Source data for Figure 5F.
- https://doi.org/10.7554/eLife.48689.014
Figure 6

Our model of tendon growth shows significant proliferation prior to P30 that coincides with expansion and maturation of the tendon matrix.
By P30, tendon cells transition from relatively high to very low rates of proliferation, signifying a transition from growth to physiological tissue maintenance. Others have shown that matrix maturation and expansion continue after P30, but these changes do not involve proliferation-driven cell growth or longitudinal growth of the tendon.
Videos
Video 1
Movie of sagittal optical sections taken using 2-photon microscopy of P0 Achilles tendon with Hoechst+ nuclei (white) and SHG signal (purple) corresponding to Figure 5A’.
https://doi.org/10.7554/eLife.48689.015
Video 2
Movie of sagittal optical sections taken using 2-photon microscopy of P7 Achilles tendon with Hoechst+ nuclei (white) and SHG signal (purple) corresponding to Figure 5B’.
https://doi.org/10.7554/eLife.48689.016
Video 3
Movie of sagittal optical sections taken using 2-photon microscopy of P14 Achilles tendon with Hoechst+ nuclei (white) and SHG signal (purple) corresponding to Figure 5C’.
https://doi.org/10.7554/eLife.48689.017
Video 4
Movie of sagittal optical sections taken using 2-photon microscopy of P28 Achilles tendon with Hoechst+ nuclei (white) and SHG signal (purple) corresponding to Figure 5D’.
https://doi.org/10.7554/eLife.48689.018
Video 5
Movie of optical sections taken using 2-photon microscopy of P28 Achilles tendon with Scx-GFP+ cells (yellow) and SHG signal (purple).
For this movie, the ‘reslice’ feature in the FIJI software was used to convert the image from the sagittal to transverse view.
Tables
Key resources table
| Reagent type (species) or resource | Designation | Source or reference | Identifiers | Additional information |
|---|---|---|---|---|
| Strain, strain background (Mus musculus) | Col1a1:tetO-H2B-GFP; ROSA:rtTA (H2B-GFP) | Brack, Hochedlinger labs, PMID: 24715455, 19060879 | ||
| Strain, strain background (Mus musculus) | Scx-GFP | Schweitzer lab, PMID: 20059955 | ||
| Strain, strain background (Mus musculus) | Scx-Cre | Schweitzer lab,PMID: 11585810 | ||
| Strain, strain background (Mus musculus) | Gt(ROSA)26Sortm9(CAG.tdTomato)Hze (ai9)/TdTom | Jackson | cat# 007909 | |
| Antibody | Rat anti Mouse CD31 | BD | Cat#551262 | (1:100) |
| Antibody | Rat anti Mouse CD45 | BD | Cat# 557659 | (1:100) |
| Antibody | Mouse monoclonal BrdU | Biolegend | Cat# 339808 | (1:100) |
| Antibody | Rat monoclonal BrdU | Abcam | Cat# 6326 | (1:100) |
| Commercial assay or kit | Green Flow Cytometry Reference Beads | Molecular Probes | Cat# C16508 | |
| Commercial assay or kit | Click-iT EdU | Invitrogen | Cat# C10337 | |
| Commercial assay or kit | Qubit HS RNA assay | Invitrogen | Cat# Q32852 | |
| Commercial assay or kit | SuperScript | Thermo Fisher | Cat#18091050 | |
| Commercial assay or kit | SYBR | Applied Biosystems | Cat#4367659 | |
| Chemical compound, drug | Dox | Sigma | cat#D9891 | |
| Chemical compound, drug | Collagenase II | Worthington | Cat# LS004176 | |
| Chemical compound, drug | DMEM | Gibco | Cat#11956–092 | |
| Chemical compound, drug | P/S | Corning | Cat#30002 CL | |
| Chemical compound, drug | Hepes | Gibco | Cat#15630–80 | |
| Chemical compound, drug | Collagenase I | Gibco | Cat# 17100–017 | |
| Chemical compound, drug | Dispase | Gibco | Cat# 1710541 | |
| Chemical compound, drug | BrdU | Sigma | Cat#B5002 | |
| Chemical compound, drug | Hoechst | Thrmo Fisher | Cat# H3569 | |
| Chemical compound, drug | TRIzol | Invitrogen | Cat# 15596026 | |
| Software, algorithm | Prism8 | GraphPad | ||
| Software, algorithm | R | 'stats' version 3.5.1(Team) |
Additional files
-
Source code 1
RT-qPCR data analysis R script.
- https://doi.org/10.7554/eLife.48689.021
-
Source code 2
Rmarkdown file for generating RT-qPCR statistics tables.
- https://doi.org/10.7554/eLife.48689.022
-
Supplementary file 1
RT-qPCR Statistics tables for Figure 4.
- https://doi.org/10.7554/eLife.48689.023
-
Supplementary file 2
List of RT-qPCR primers used for Figure 4.
- https://doi.org/10.7554/eLife.48689.024
-
Transparent reporting form
- https://doi.org/10.7554/eLife.48689.025
Download links
A two-part list of links to download the article, or parts of the article, in various formats.
Downloads (link to download the article as PDF)
Open citations (links to open the citations from this article in various online reference manager services)
Cite this article (links to download the citations from this article in formats compatible with various reference manager tools)
A distinct transition from cell growth to physiological homeostasis in the tendon
eLife 8:e48689.
https://doi.org/10.7554/eLife.48689


