Length-dependent disassembly maintains four different flagellar lengths in Giardia
- University of California, Davis, United States
- Brandeis University, United States
Figures
Figure 1 with 1 supplement
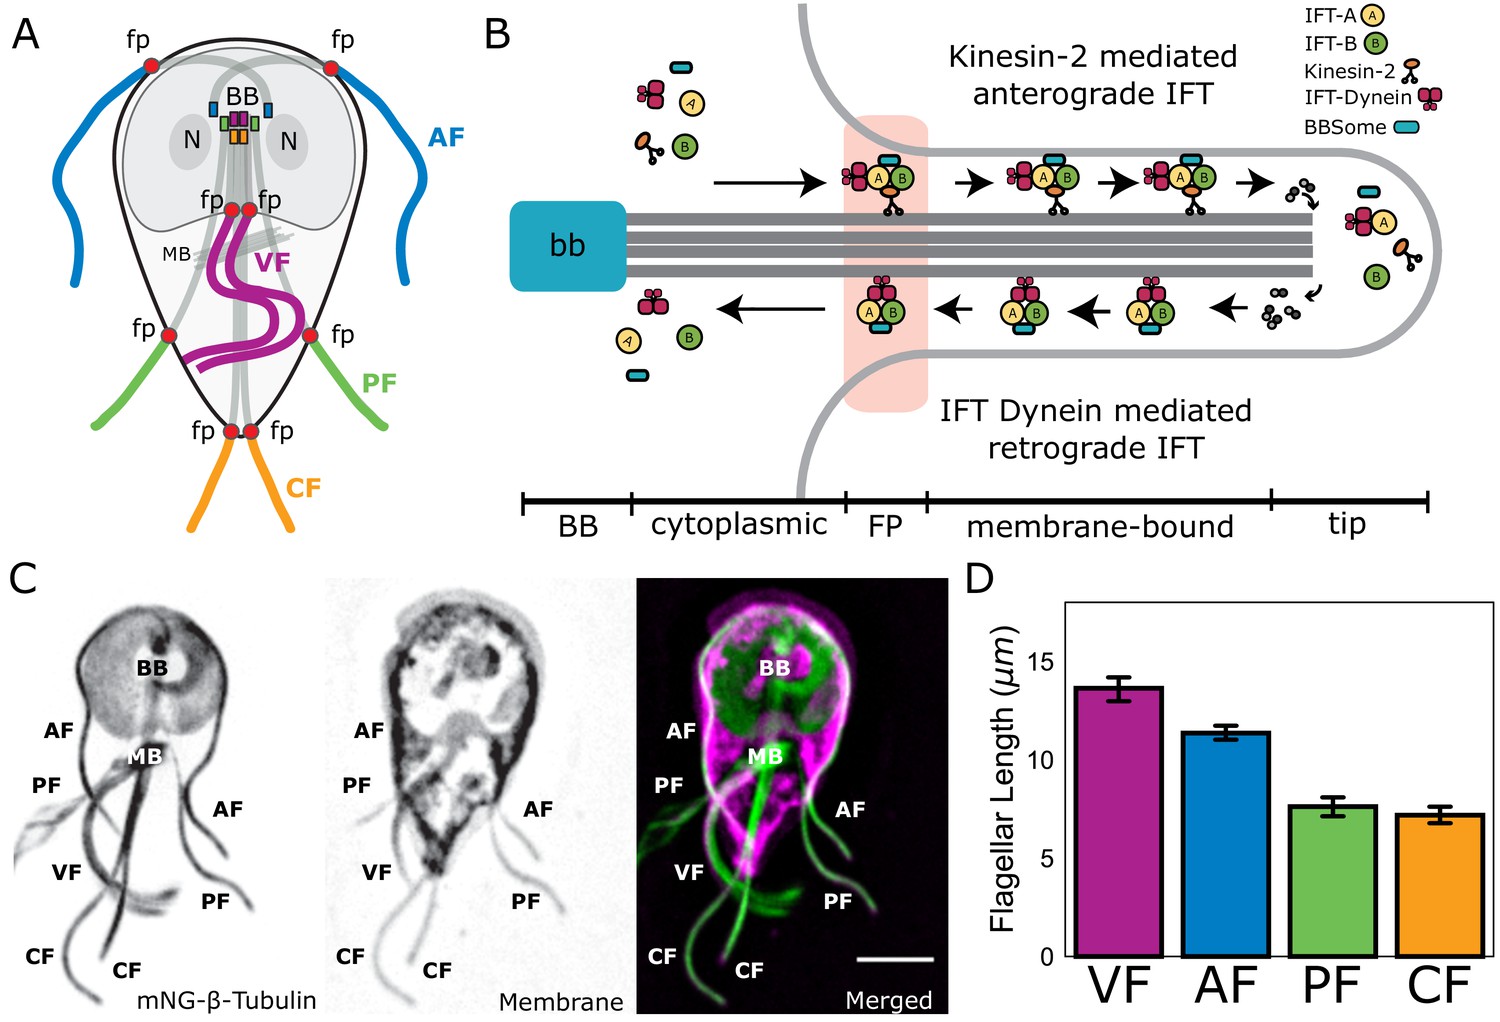
Giardia maintains four flagellar pairs with unique equilibrium lengths.
(A) Schematic representation of membrane-bound, cytoplasmic, basal body (BB), and flagellar pore (fp) regions of the axoneme, as well as the two nuclei (N) and median body (MB). (B) Schematic representation of the specific regions of Giardia’s flagellar axoneme, including the basal body (BB), cytoplasmic axoneme (cytoplasmic), flagellar pore (FP), membrane-bound axoneme (membrane-bound), and the flagellar tip (tip). (C) Fluorescent labeling of the microtubule cytoskeleton and membrane of a Giardia lamblia trophozoite, including the median body (MB), the basal body (BB), and the four flagellar pairs: anterior (AF), posteriolateral (PF), caudal (CF), and ventral (VF). Scale bar, 5 µm. (D) Flagellar length quantification of membrane-bound regions of flagellar pairs of Giardia WBC6 trophozoites. The 95% confidence interval and average length are indicated. n ≥ 35 flagella for each pair. All pairs are statistically significantly different (p≤0.05, t-test) in membrane-bound length, except the posteriolateral and caudal flagella.
Figure 1—figure supplement 1

Quantification of full axoneme lengths in Giardia lamblia.
Flagellar length quantification of membrane-bound and cytoplasmic regions of flagellar pairs of Giardia trophozoites expressing single-copy, integrated mNeonGreen-β-tubulin. The 95% confidence interval and average length are indicated for cytoplasmic (red) and membrane-bound (blue) regions. n ≥ 35 flagella for each pair from three independent experiments.
Figure 2 with 2 supplements
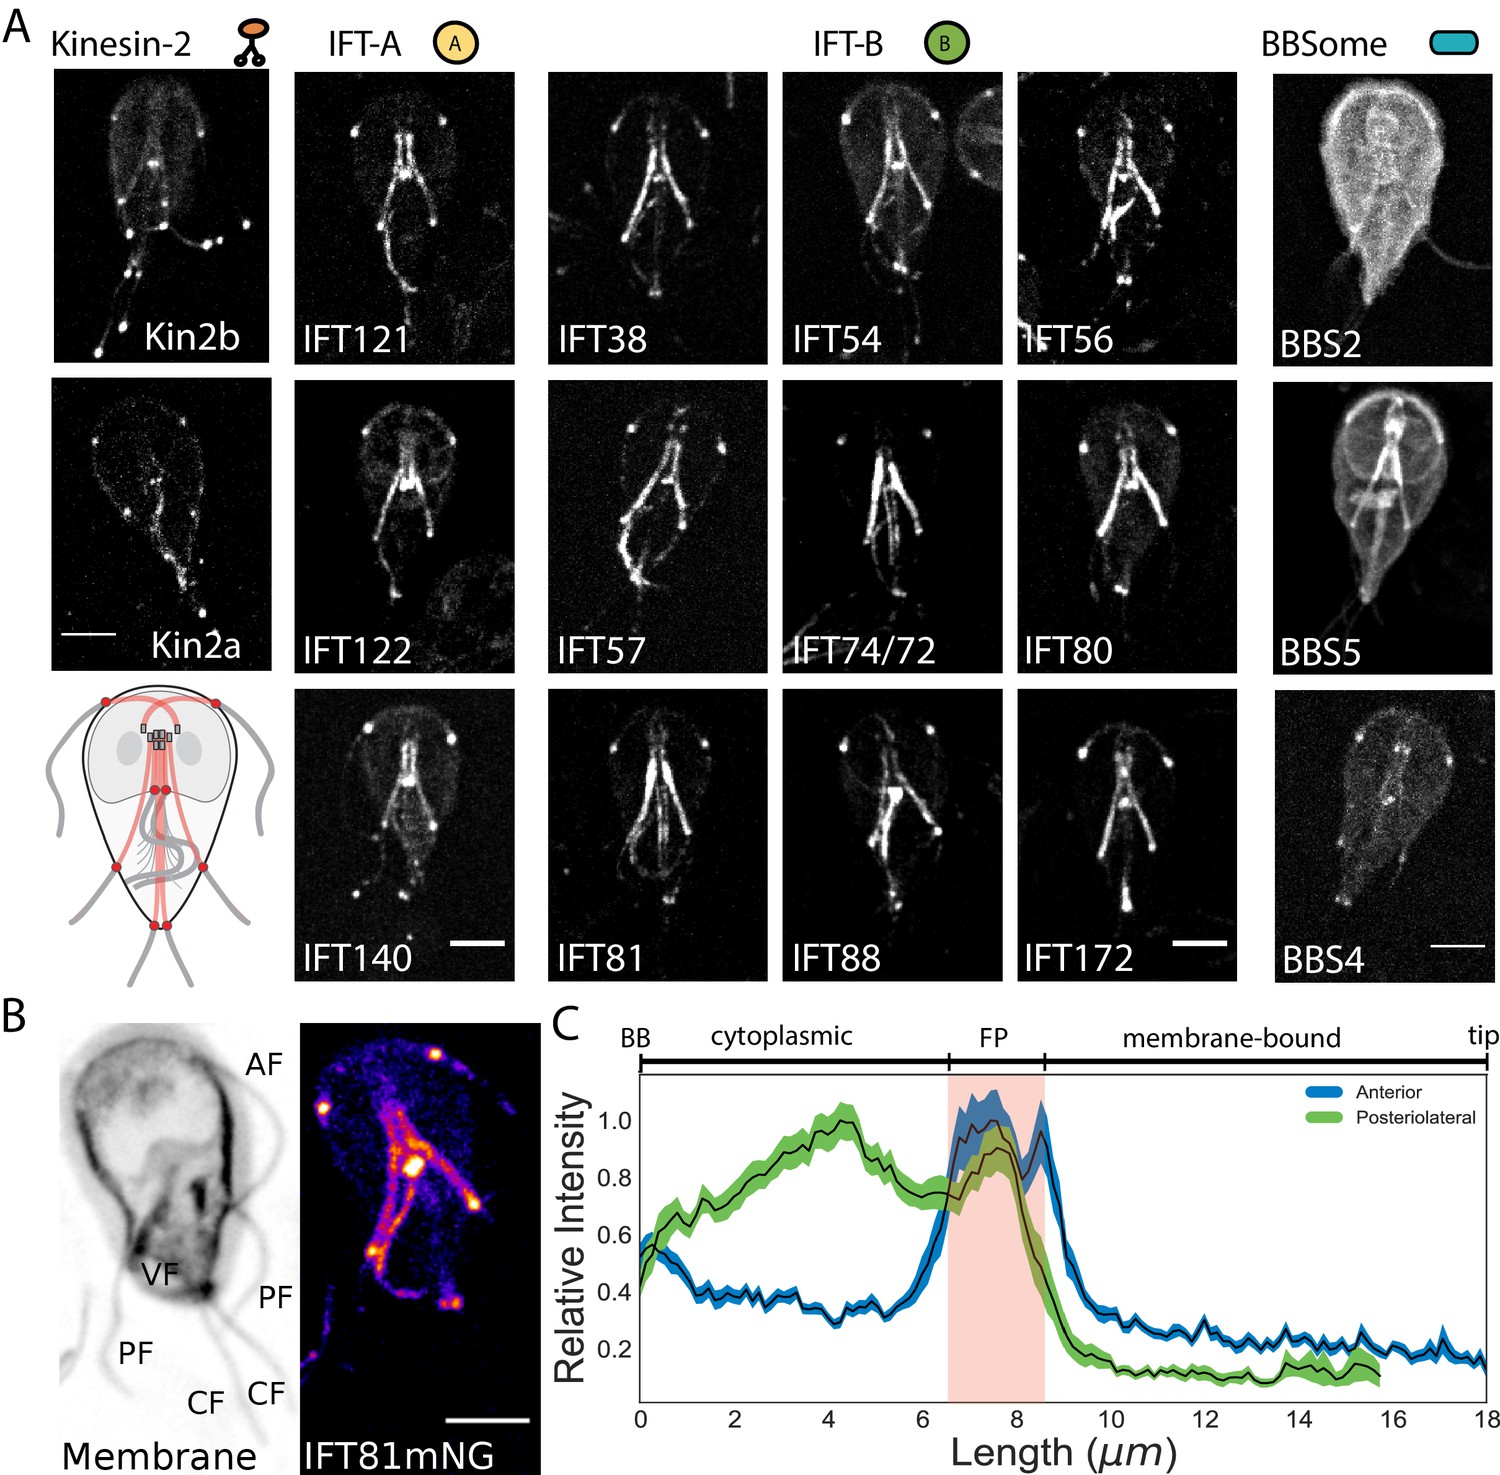
IFT proteins accumulate in the flagellar pore regions.
(A) Maximum intensity projections of live cells show the distribution of kinesin-2, IFT-A complex, IFT-B complex, and BBSome proteins throughout the trophozoite. Representative schematic of IFT-A and IFT-B localizations is in the lowest left corner. All scale bars, 5 µm. (B) IFT81mNeonGreen proteins are more concentrated at the flagellar pore regions of the flagellar pairs. Scale bar, 5 µm. (C) Quantification of IFT81mNG distribution along the entire lengths of anterior and posteriolateral axonemes using line-scans. Black lines indicate mean intensity and shaded regions indicate 95% confidence intervals. Flagellar length is indicated on bottom axis and approximate anatomical position is indicated on the top axis, with red shading indicating the flagellar pore region. n = 31 for each flagellar pair, from four independent experiments.
Figure 2—figure supplement 1

PCR validation of IFT81mNG and IFT81GFP integration into the native genomic locus.
(A) Schematic representation of primers designed to detect single-copy integration of IFT81mNeonGreen and IFT81GFP constructs. (B) PCR validation of IFT81mNeonGreen and IFT81GFP integration into the native genomic locus. Specific bands are detected for each strain and positive control amplification (CWP1) is detected for all tested strains.
Figure 2—figure supplement 2
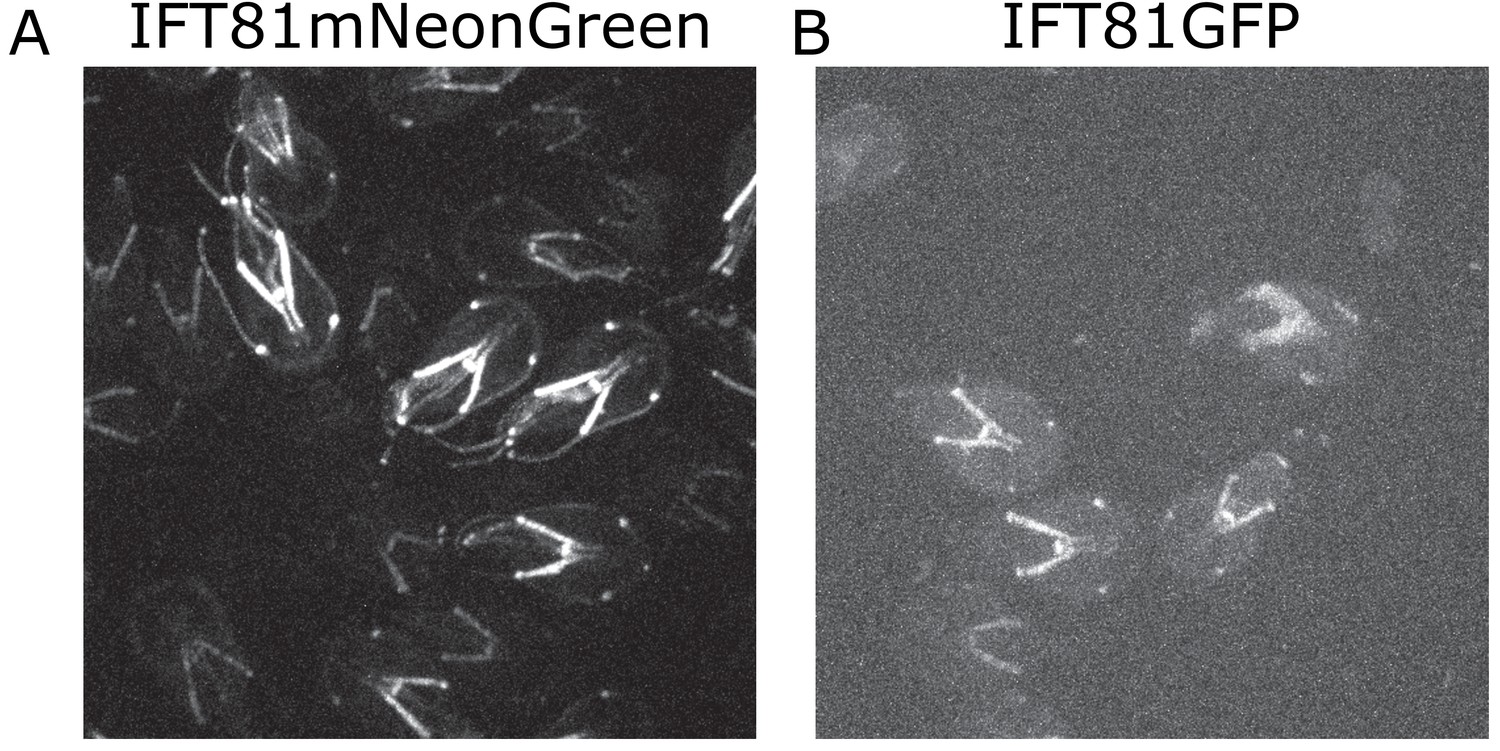
Comparison of brightness between IFT81GFP and IFT81mNG.
(A) Representative image of IFT81mNeonGreen and (B) IFT81GFP. Both images are maximum intensity projections acquired with the same acquisition parameters (30 ms exposure, 60% laser power).
Figure 3
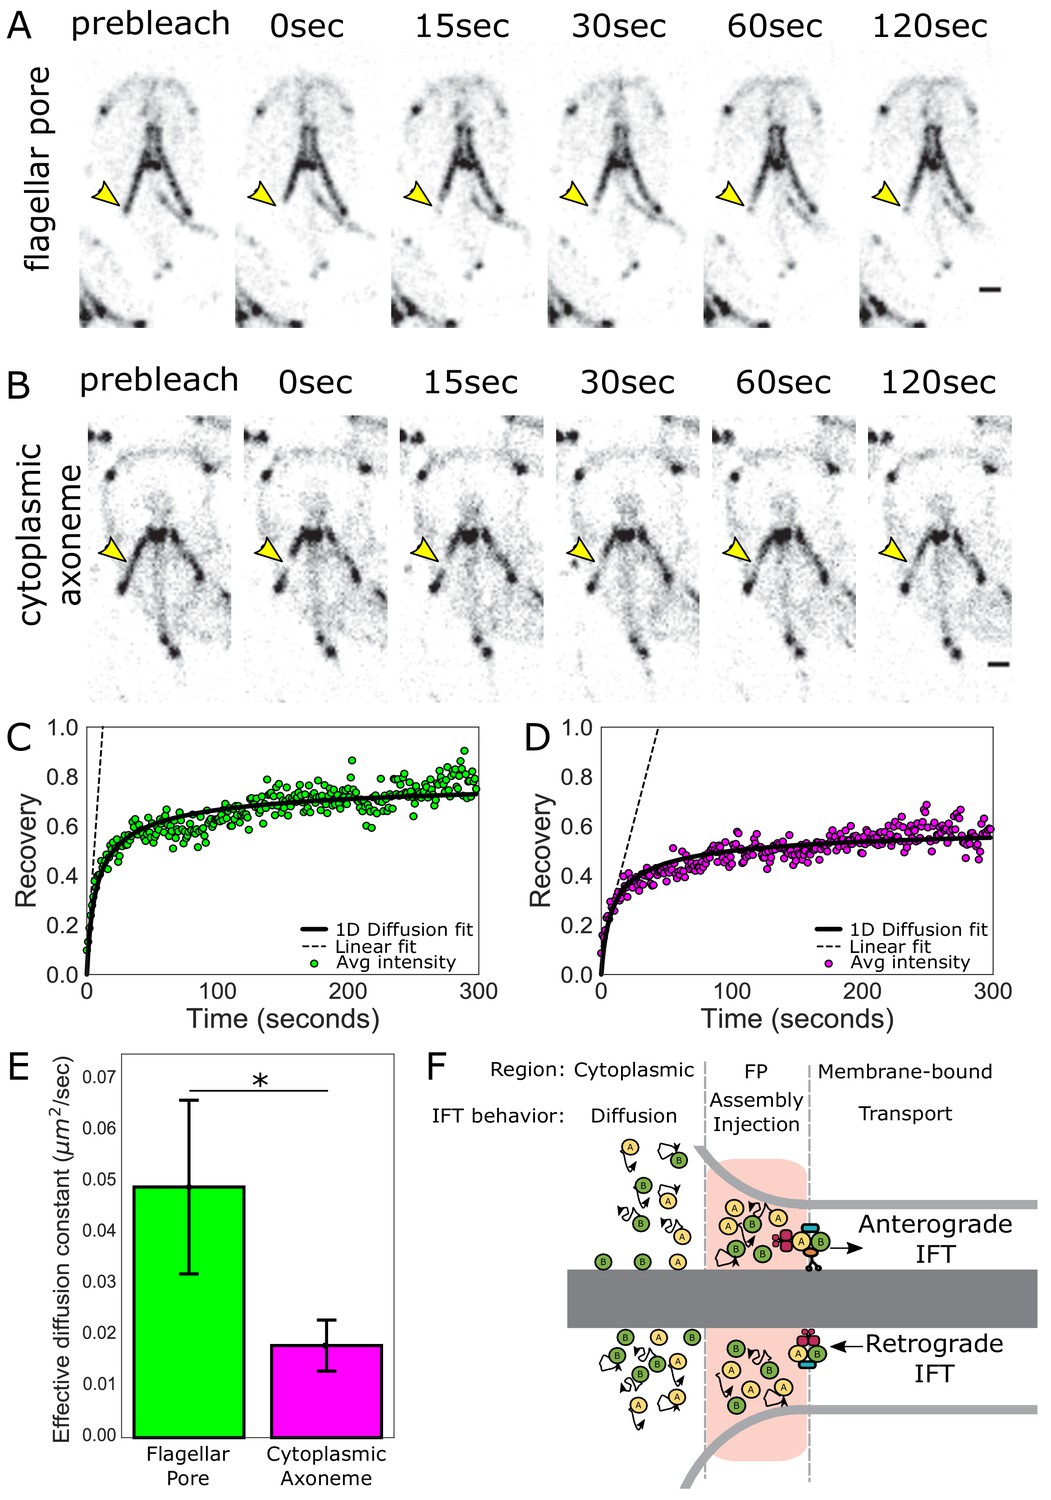
IFT train assembly occurs at the flagellar pore region.
(A) Time series images of trophozoites expressing IFT81mNG prebleach, immediately post-bleach (0 s, yellow arrow) and during recovery (time in sec) for flagellar pore or (B) cytoplasmic axoneme regions. Scale bar, 2 µm. (C) Time averaged fluorescent recovery of posteriolateral flagellar pores and (D) cytoplasmic axonemes. Solid black lines indicate fit of the entire recovery phase. Dashed lines indicate linear fit of the initial recovery phase. n = 32 for bleached cytoplasmic axoneme regions, n = 25 for bleached flagellar pore regions, each from three independent experiments. (E) Effective diffusion constants from fitting FRAP recovery of the flagellar pore and cytoplasmic regions of posteriolateral flagella. Means and standard error are indicated. Student’s t-test, *p=0.031. n ≥ 25 cells, from ≥three independent experiments. (F) Schematic representation of IFT particle behavior associated with the cytoplasmic axoneme, flagellar pore, and membrane-bound axoneme regions.
Figure 4
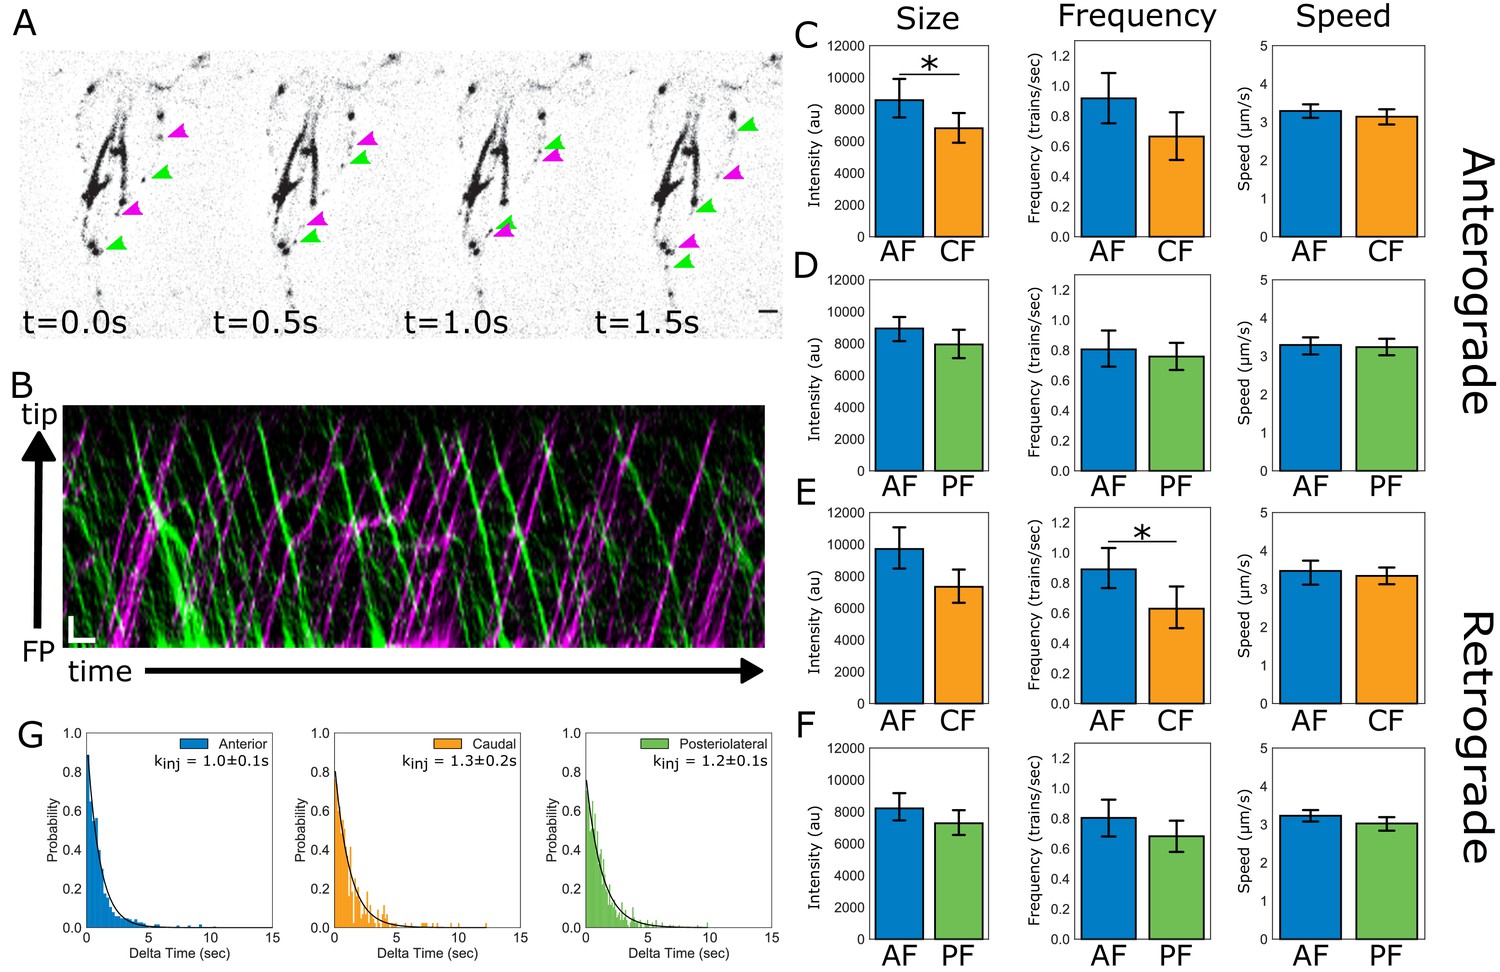
IFT dynamics are similar between flagellar pairs of different lengths.
(A) Still images from time-lapse imaging of live trophozoites expressing IFT81mNG showing anterograde (magenta arrows) and retrograde IFT trains (green arrows). Scale bar, 2 µm. (B) A representative kymograph of IFT train trajectories within the membrane-bound anterior flagellum. Total time is ~26 s. Scale bar, 1 µm and 1 s. (C) Comparisons of anterograde IFT train intensity, frequency, and speed from anterior and caudal flagella. (D) Comparisons of anterograde IFT train intensity, frequency, and speed from anterior and posteriolateral flagella. (E) Comparisons of retrograde IFT train intensity, frequency, and speed from anterior and caudal flagella. (F) Comparisons of retrograde IFT train intensity, frequency, and speed from anterior and posteriolateral flagella. All plots show mean values with 95% confidence intervals. Student’s t-test, *p<0.05. n = 22 cells for the anterior and caudal flagella, n = 42 cells for the anterior and posteriolateral flagella, from N = five independent experiments. (G) Frequency histograms of the time-lag between IFT train injections for anterior (blue), posteriolateral (green), and caudal (orange) flagella. Black line indicates a fit to a single exponential equation to measure the injection rate for each flagellar pair. Injection rates are indicated with 95% confidence intervals.
Figure 5
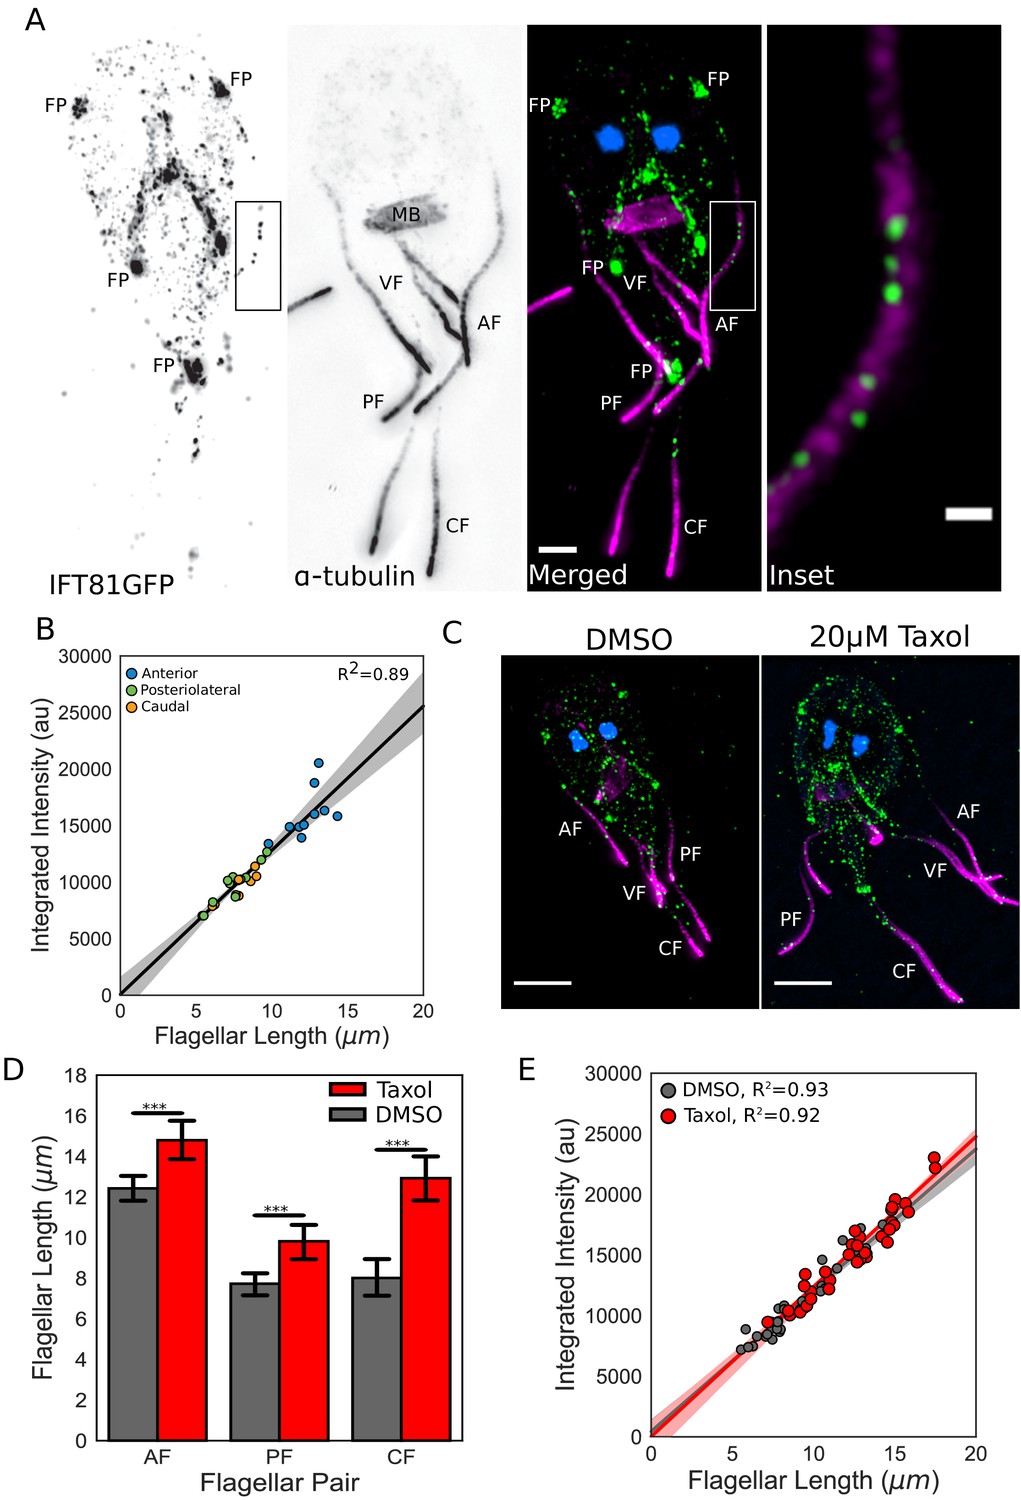
IFT injection is length-independent.
(A) Representative structured illumination microscopy (SIM) image of a trophozoite expressing IFT81GFP (green) immunostained for α-tubulin (magenta) and stained with DAPI (blue). Scale bar, 2 µm. Boxed inset is enlarged on the right. Scale bar, 0.5 µm. (B) Total integrated intensity of IFT81GFP plotted versus flagellar length. Orange dots indicate caudal flagella, green dots indicate posteriolateral flagella, and blue dots indicate anterior flagella. Linear fit (black line) and coefficient of determination are indicated. Shading indicates 95% confidence interval. (C) Representative SIM images of IFT81GFP expressing trophozoites treated with DMSO (left) or 20 µM Taxol (right) for one hr, then fixed and stained as in A. (D) Flagellar lengths of IFT81GFP expressing trophozoites treated with DMSO (gray) or 20 µM Taxol (red). Ten cells from three separate experiments were measured for each condition. Student’s t-test, ***p<0.001. (E) Total integrated intensity of IFT81GFP for trophozoites treated with DMSO (gray) or 20 µM Taxol (red) plotted versus flagellar length. Linear fit (gray and red lines) and coefficient of determination are indicated. Shading indicates 95% confidence interval.
Figure 6
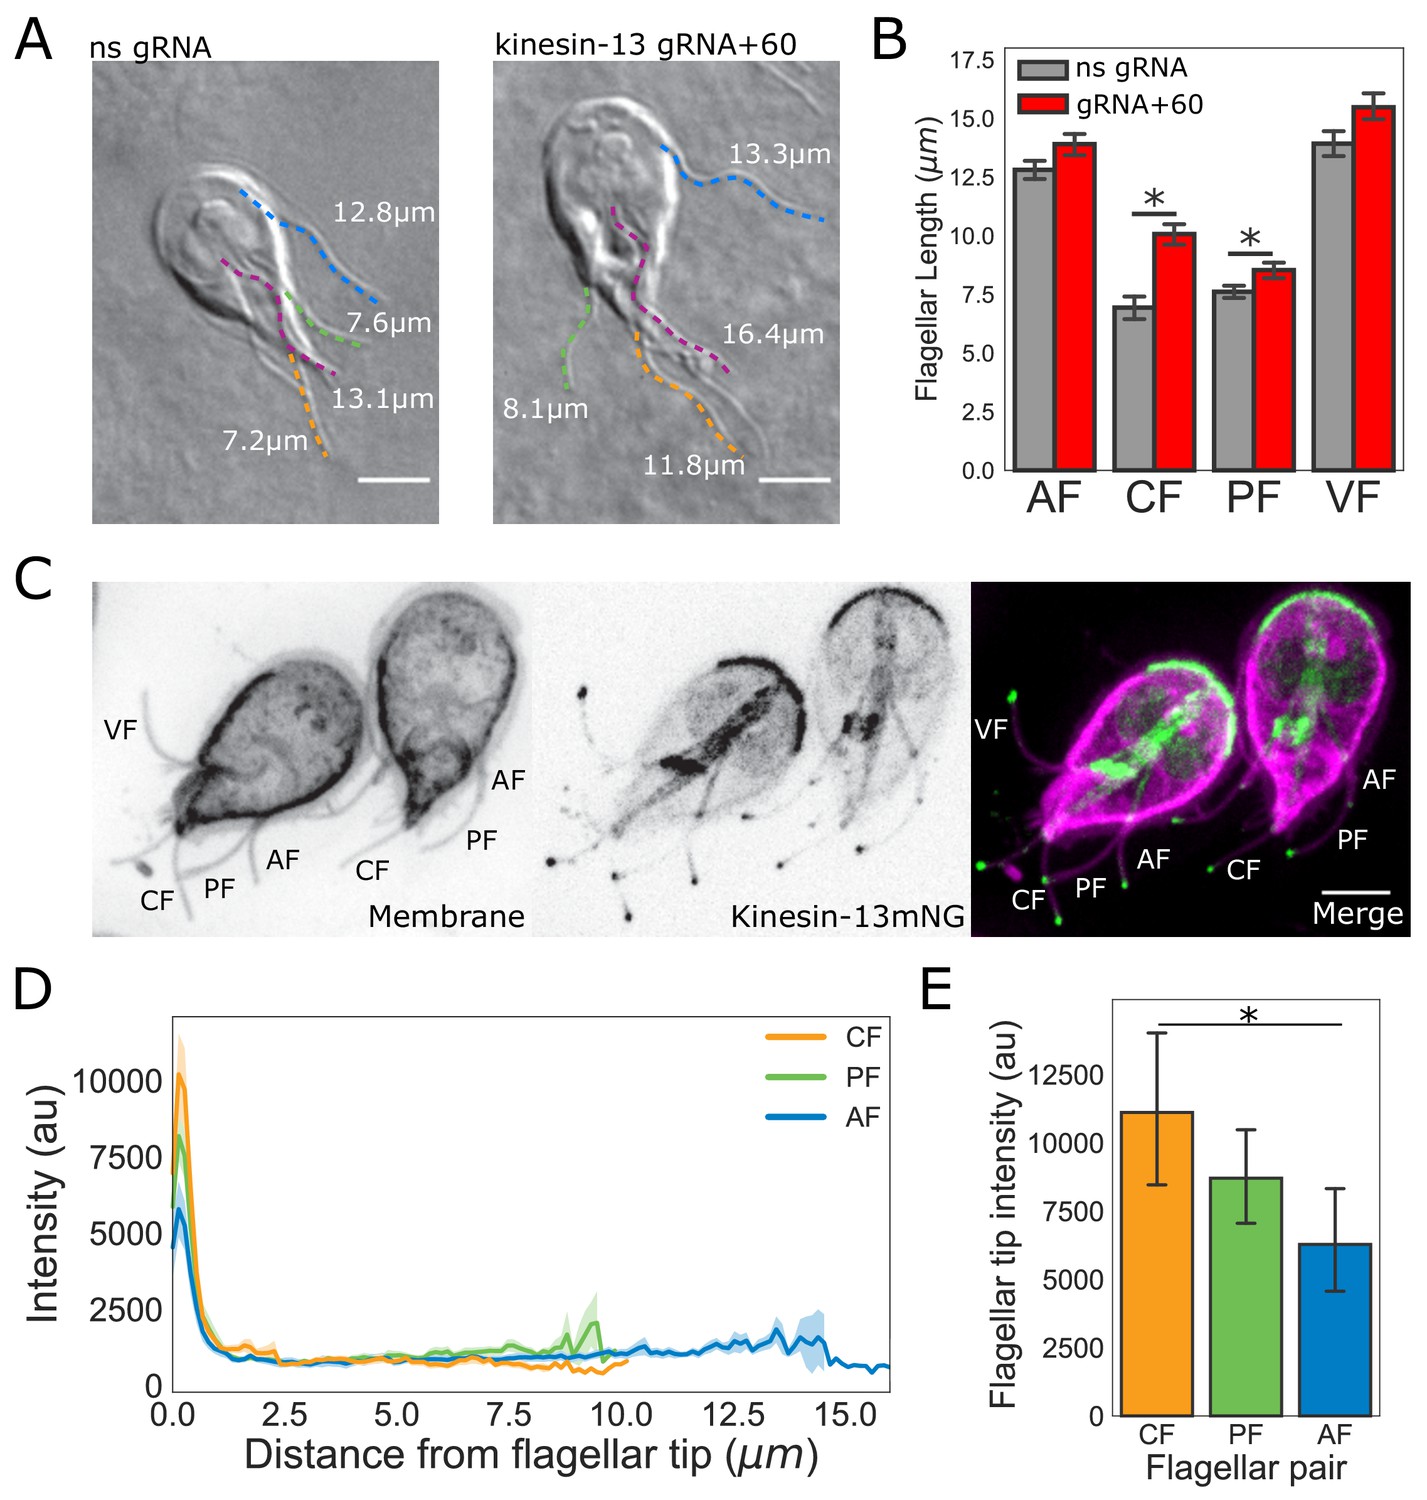
The intensity of kinesin-13 flagellar tip localization is inversely correlated with flagellar length.
(A) Representative images and (B) quantification of CRISPRi mediated knockdown of kinesin-13 (gRNA+60, red) as compared to a non-specific (ns, gray) gRNA. Blue traces indicate anterior flagella, magenta traces indicate the ventral flagella, green traces indicate the posteriolateral flagella, and orange traces indicate the caudal flagella. n ≥ 30 cells from two separate experiments were measured for each condition. Means and 95% confidence intervals are indicated. (C) Representative image of trophozoites expressing kinesin-13mNG with the cell membrane labeled to indicate the membrane-bound regions of the flagella. Scale bar, 5 µm. (D) Kinesin-13mNG intensity profiles from the flagellar tip to the base of the membrane-bound regions of caudal (orange), posteriolateral (green), and anterior (blue) flagella. Shading indicates standard error of the mean. n ≥ 23 for each flagellar pair, from two independent experiments. (E) Mean flagellar tip intensity plotted for each flagellar pair. 95% confidence intervals are indicated. Student’s t-test, *p<0.05.
Figure 7
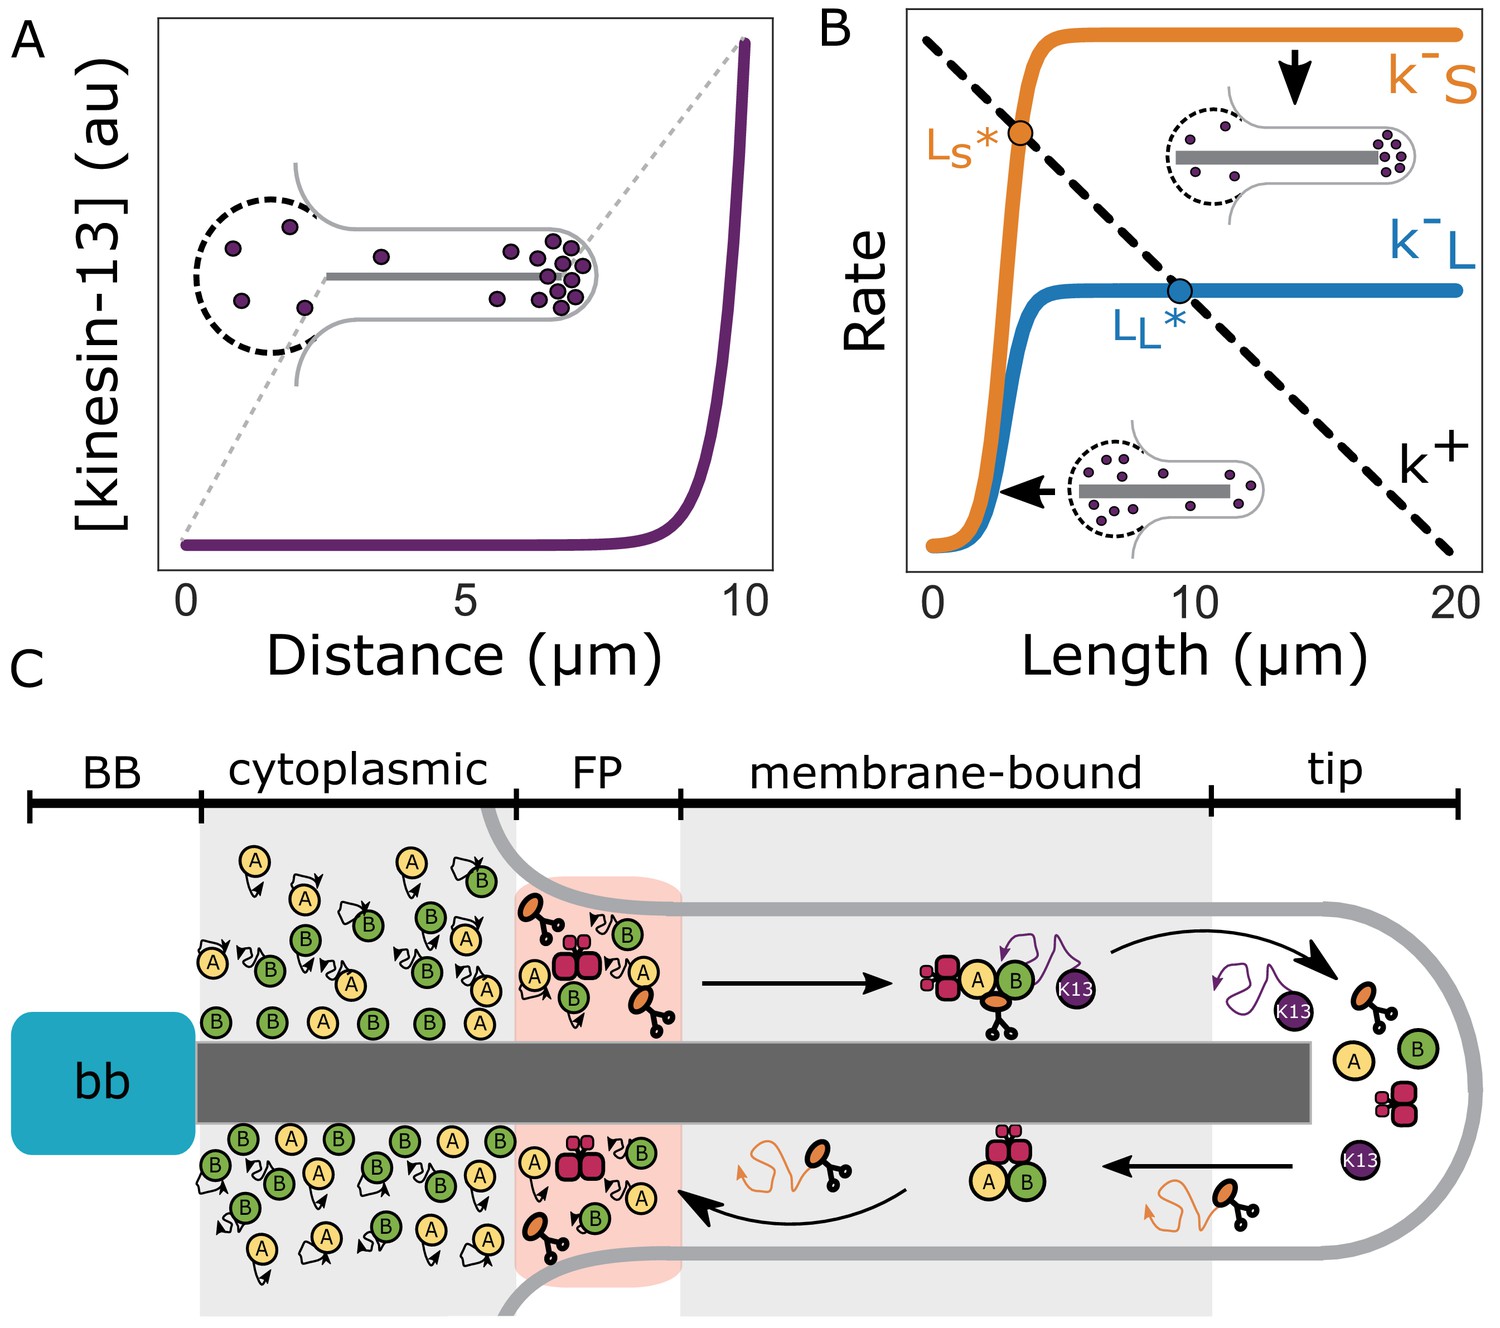
Length-dependent disassembly controls flagellar length.
(A) Theoretically predicted concentration profile of kinesin-13 (purple) at equilibrium flagellar length. Inset depicts a schematic representation of kinesin-13 concentration at the flagellar tip and in the reservoir (dashed lines). (B) Theoretically predicted disassembly rates for short (k–S) and long (k–L) flagella as a function of length (Materials and methods). Dashed line indicates the proposed rate of assembly (k+). Intersections of disassembly and assembly rates generate two distinct equilibrium flagellar lengths (LS*, LL*). (C) Schematic of flagellar assembly and maintenance in Giardia lamblia. IFT particles (yellow and green circles) move diffusively in the cytoplasmic axoneme regions. IFT trains are assembled in the flagellar pore region and are injected into the membrane-bound region of the axoneme. Within the membrane-bound region, IFT particles undergo anterograde transport via kinesin-2 (orange) mediated transport until they reach the distal flagellar tip. IFT trains are reorganized into retrograde directed trains and carried back to the flagellar base by IFT dynein (red). Kinesin-2 and kinesin-13 (purple) are not included in retrograde IFT trains, and instead diffuse back to the flagellar base. While kinesin-2 can freely diffuse to the flagellar base, kinesin-13 can be ‘recaptured’ by anterograde IFT trains and carried back to the distal tip. Unidirectional transport coupled with free diffusion is expected to give a profile that decreases linearly from the flagellar tip to the base (Kinesin-2). Unidirectional transport coupled with diffusion and anterograde recapture gives a profile that decreases exponentially from the distal flagellar tip (Kinesin-13) (Naoz et al., 2008).
Figure 8 with 2 supplements
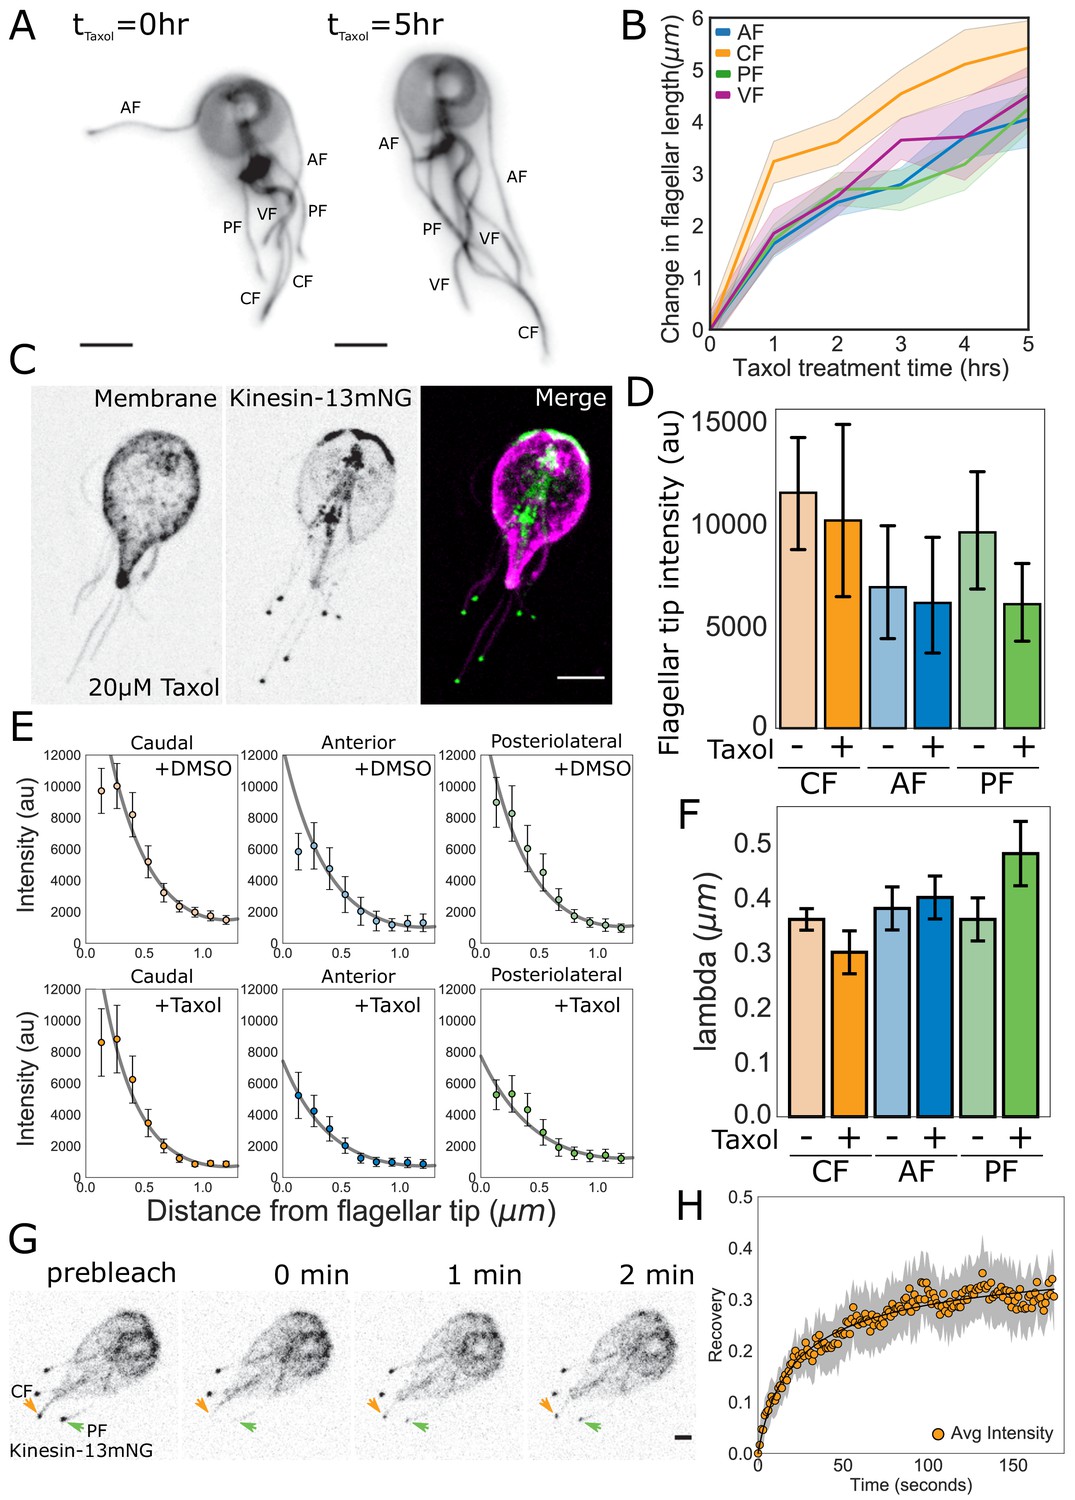
Quantitative tests of specific predictions from the disassembly-dependent flagellar length control model in Giardia.
(A) Representative images and (B) quantification of flagellar length changes in trophozoites expressing mNG-β-tubulin and treated with 20 µM Taxol for 5 hr. Flagellar pairs are indicated. Scale bar, 5 µm. n ≥ 35 cells from two separate experiments were measured for each time-point. Means and 95% confidence intervals are indicated. (C) Representative image of trophozoites expressing kinesin-13mNG and treated with 20 µM Taxol for 1 hr, with the cell membrane labeled to indicate the membrane-bound regions of the flagella. Scale bar, 5 µm. (D) Flagellar tip intensity of kinesin-13mNG expressing trophozoites treated with DMSO (‘-‘) or 20 µM Taxol (‘+’). (E) Kinesin-13mNG fluorescence intensity decay within the first 1.2 µm of the flagellar tip of caudal, anterior, and posteriolateral flagella trophozoites treated with DMSO (top panel) or 20 µM Taxol (bottom panel). Means and 95% confidence interval are indicated. Gray lines indicate fits to obtain the decay rate ( of the intensity profile. (F) Mean decay rate (lambda) for caudal (CF), anterior (AF), and posteriolateral (PF) flagella treated with DMSO (‘-‘) or 20 µM Taxol (‘+’). n ≥ 12 cells from two separate experiments were measured for each condition. Means and 95% confidence intervals are indicated. (G) Time series images of trophozoites expressing kinesin-13mNG prebleach, immediately post-bleach (0 min, arrows), and during recovery (time in minutes) for caudal and posteriolateral flagellar tip regions. Scale bar, 2 µm. (H) Time averaged fluorescent recovery of caudal flagellar tip regions following photobleaching. Solid black lines indicate fit of the entire recovery phase and shading indicates the 95% confidence interval. n = 19 caudal flagellar tips, from two independent experiments.
Figure 8—figure supplement 1
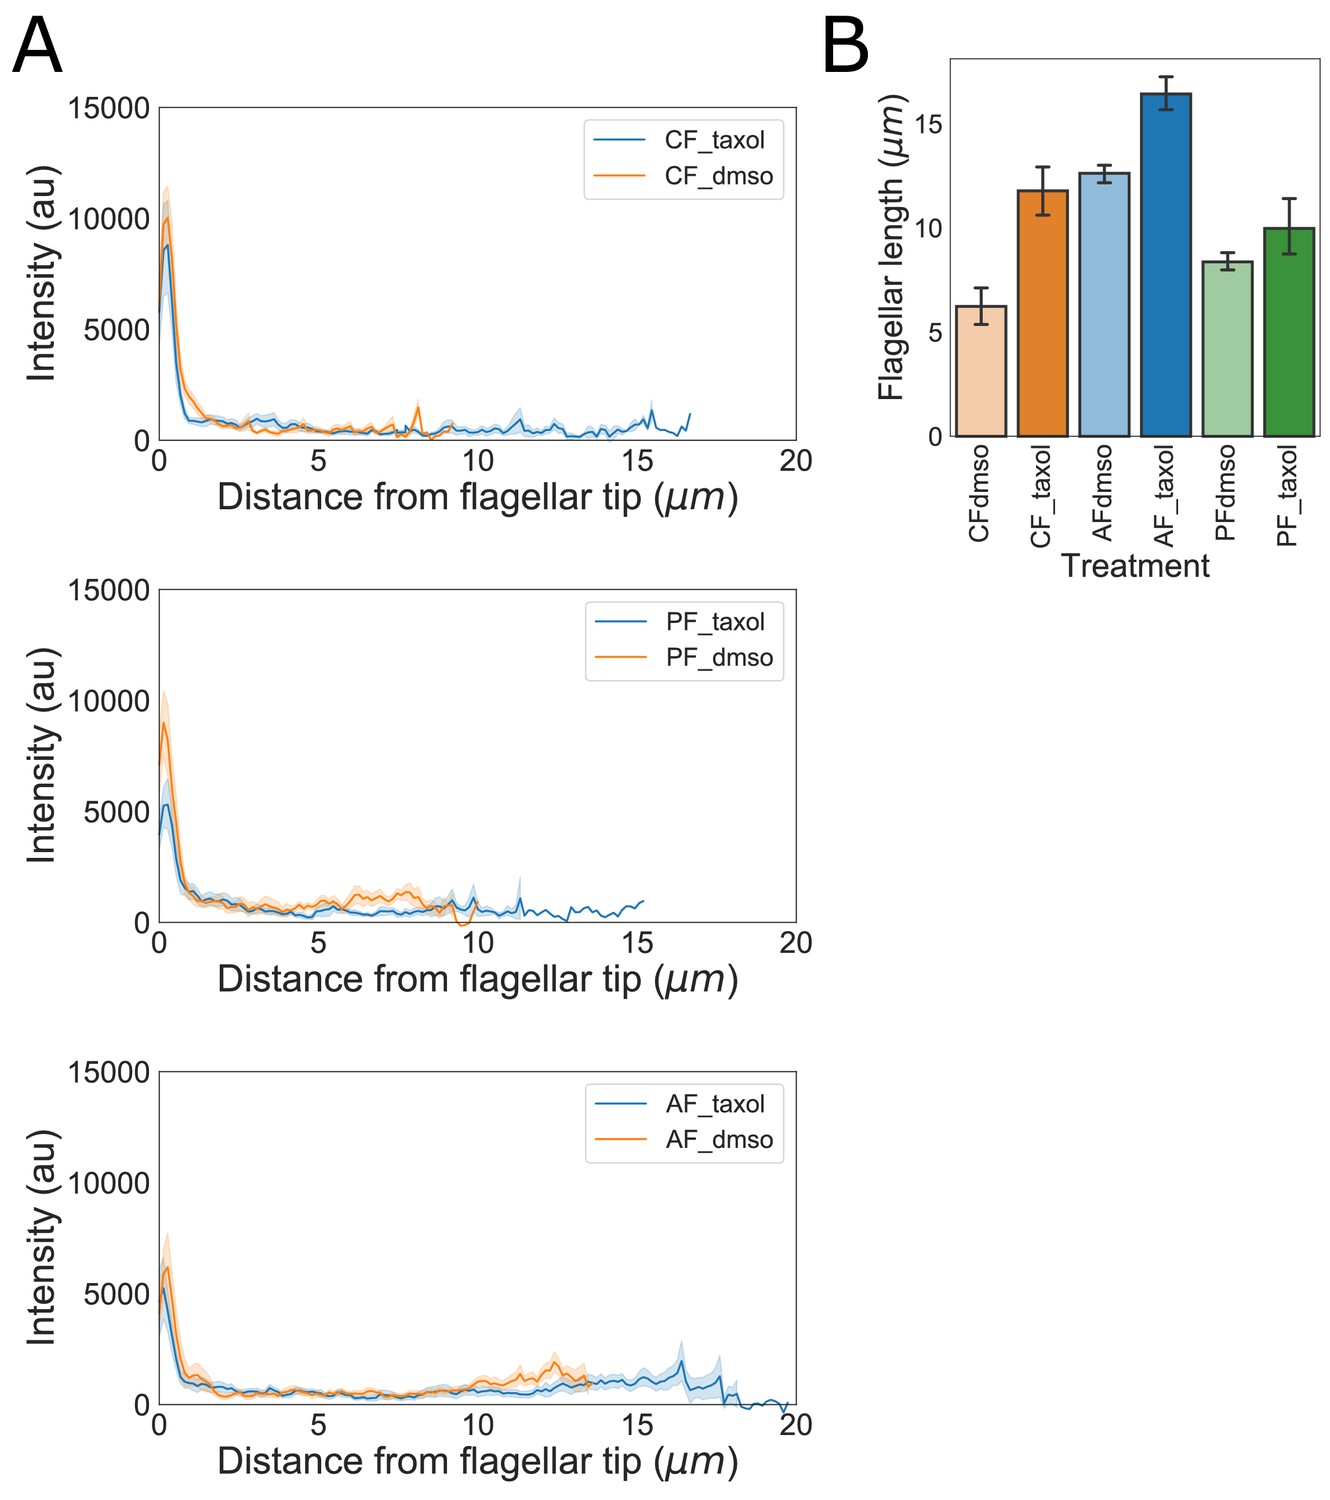
Kinesin-13mNG flagellar length changes and intensity profiles following flagellar elongation with Taxol.
(A) Kinesin-13mNG intensity profiles from the flagellar tip to the base of the membrane-bound regions of caudal (top), posteriolateral (middle), and anterior (bottom) flagella. Orange traces indicate control (DMSO treated) cells and blue traces indicate Taxol treated cells. Shading indicates standard error of the mean. (B) Flagellar length of kinesin-13mNG expressing trophozoites treated with DMSO (lighter fill) or 20 µM Taxol (darker fill). n ≥ 12 cells from two separate experiments were measured for each condition. Means and 95% confidence intervals are indicated.
Figure 8—figure supplement 2
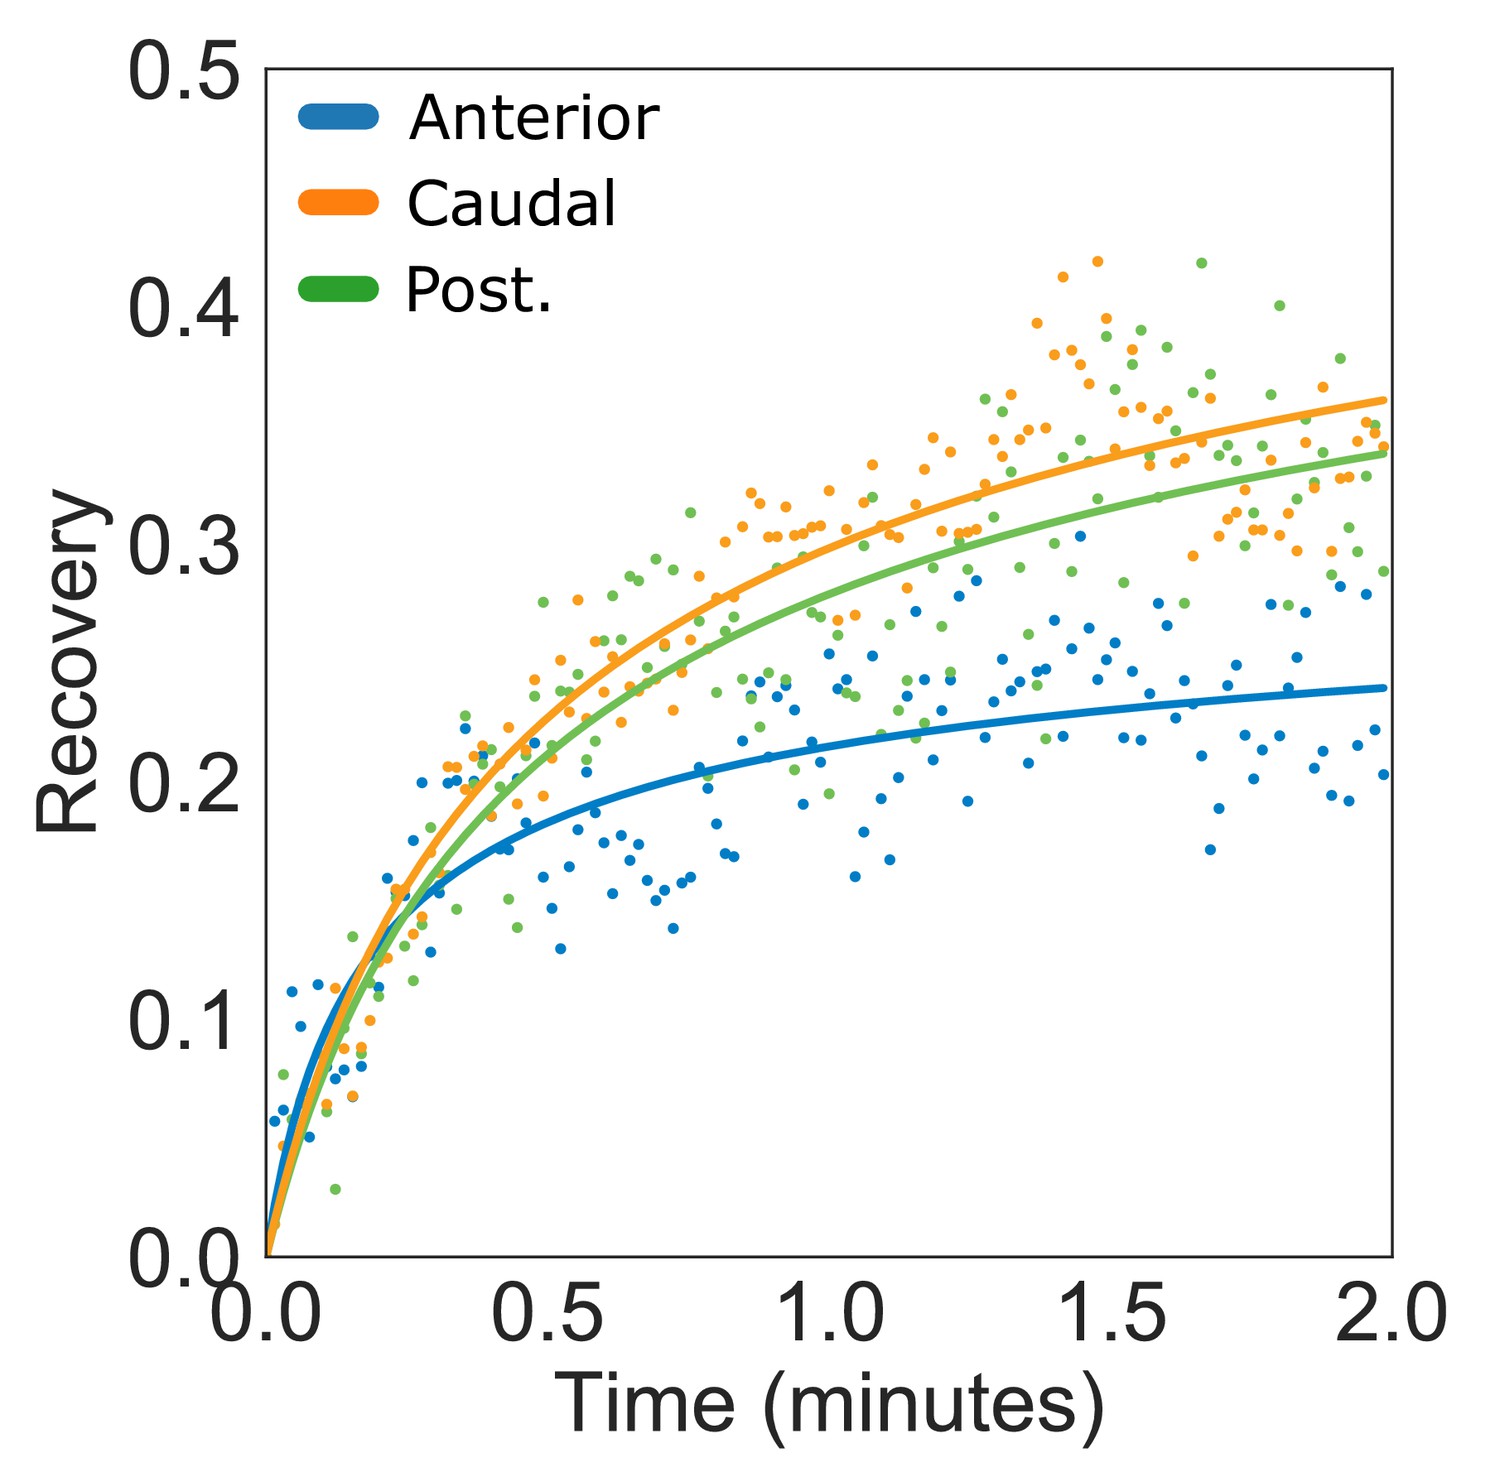
Kinesin-13mNG fluorescence recovery after photobleaching of anterior, caudal, and posteriolateral flagella.
(A) Time averaged fluorescent recovery of photobleached kinesin-13mNG at the tips of posteriolateral (green), caudal (yellow), and anterior (blue) flagella. Solid lines indicate fit of the entire recovery phase. n ≥ 10 cells from two separate experiments were measured for each flagellar pair.
Videos
Video 1
Fluorescence recovery of IFT81mNG after photobleaching of anterior and posteriolateral flagellar pores.
Fluorescence recovery following photobleaching of the right posteriolateral flagellar pore (top left) and right anterior flagellar pore (bottom right) in trophozoites expressing IFT81mNG. The video was recorded at one frame/second and is played at 10x increased speed. Time post-bleach (in minutes) is indicated in the top left corner. Scale bar, 5 µm.
Video 2
Fluorescence recovery of IFT81mNG after photobleaching of posteriolateral cytoplasmic axonemes.
Fluorescence recovery following photobleaching of the left posteriolateral cytoplasmic axoneme in trophozoites expressing IFT81mNG. The video was recorded at one frame/second and is played at 10x increased speed. Time post-bleach (in minutes) is indicated in the top left corner. Scale bar, 5 µm.
Video 3
Tracking IFT trains in Giardia.
IFT train movement visualized using spinning-disc confocal microscopy in trophozoites expressing IFT81mNG. The video was recorded at ~13 frames/second and is played in real time (indicated in the top left corner, in seconds). Scale bar, 5 µm.
Video 4
Fluorescence recovery of kinesin-13mNG after photobleaching of caudal and posteriolateral flagellar tips.
Fluorescence recovery following photobleaching of the flagellar tips of caudal (left) and posteriolateral (right) flagellar tips in trophozoites expressing kinesin-13mNG. The video was recorded at one frame/second and is played at 10x increased speed. Time post-bleach (in minutes) is indicated in the top left corner. Scale bar, 5 µm.
Tables
Key resources table
| Reagent type (species) or resource | Designation | Source or reference | Identifiers | Additional information |
|---|---|---|---|---|
| Genetic reagent (Giardia lamblia) | BBS2 | GiardiaDB | RRID:SCR_013377 GL50803_23934 | C-terminal GFP tagged cell line maintained in Dawson Lab |
| Genetic reagent (Giardia lamblia) | BBS4 | GiardiaDB | RRID:SCR_013377 GL50803_10529 | C-terminal GFP tagged cell line maintained in Dawson Lab |
| Genetic reagent (Giardia lamblia) | BBS5 | GiardiaDB | RRID:SCR_013377 GL50803_8146 | C-terminal GFP tagged cell line maintained in Dawson Lab |
| Genetic reagent (Giardia lamblia) | Beta-tubulin | GiardiaDB | RRID:SCR_013377 GL50803_101291 | N-terminal mNG tagged cell line maintained in Dawson Lab |
| Genetic reagent (Giardia lamblia) | IFT 38 | GiardiaDB | RRID:SCR_013377 GL50803_16707 | C-terminal GFP tagged cell line maintained in Dawson Lab |
| Genetic reagent (Giardia lamblia) | IFT 54 | GiardiaDB | RRID:SCR_013377 GL50803_9098 | C-terminal GFP tagged cell line maintained in Dawson Lab |
| Genetic reagent (Giardia lamblia) | IFT 56 | GiardiaDB | RRID:SCR_013377 GL50803_16375 | C-terminal GFP tagged cell line maintained in Dawson Lab |
| Genetic reagent (Giardia lamblia) | IFT 57 | GiardiaDB | RRID:SCR_013377 GL50803_14713 | C-terminal GFP tagged cell line maintained in Dawson Lab |
| Genetic reagent (Giardia lamblia) | IFT 74/72 | GiardiaDB | RRID:SCR_013377 GL50803_9750 | C-terminal GFP tagged cell line maintained in Dawson Lab |
| Genetic reagent (Giardia lamblia) | IFT 80 | GiardiaDB | RRID:SCR_013377 GL50803_17223 | C-terminal GFP tagged cell line maintained in Dawson Lab |
| Genetic reagent (Giardia lamblia) | IFT 81 | GiardiaDB | RRID:SCR_013377 GL50803_15428 | C-terminal GFP and mNG tagged cell line (episomal and integrated) maintained in Dawson Lab |
| Genetic reagent (Giardia lamblia) | IFT 88 | GiardiaDB | RRID:SCR_013377 GL50803_16660 | C-terminal GFP tagged cell line maintained in Dawson Lab |
| Genetic reagent (Giardia lamblia) | IFT 121 | GiardiaDB | RRID:SCR_013377 GL50803_87817 | C-terminal GFP tagged cell line maintained in Dawson Lab |
| Genetic reagent (Giardia lamblia) | IFT 122 | GiardiaDB | RRID:SCR_013377 GL50803_16547 | C-terminal GFP tagged cell line maintained in Dawson Lab |
| Genetic reagent (Giardia lamblia) | IFT 140 | GiardiaDB | RRID:SCR_013377 GL50803_17251 | C-terminal GFP tagged cell line maintained in Dawson Lab |
| Genetic reagent (Giardia lamblia) | IFT 172 | GiardiaDB | RRID:SCR_013377 GL50803_17105 | C-terminal GFP tagged cell line maintained in Dawson Lab |
| Genetic reagent (Giardia lamblia) | Kinesin-13 | GiardiaDB | RRID:SCR_013377 GL50803_16945 | C-terminal mNG tagged cell line maintained in Dawson Lab |
| Genetic reagent (Giardia lamblia) | Kinesin-2a | GiardiaDB | RRID:SCR_013377 GL50803_17333 | C-terminal GFP tagged cell line maintained in Dawson Lab |
| Genetic reagent (Giardia lamblia) | Kinesin-2b | GiardiaDB | RRID:SCR_013377 GL50803_16456 | C-terminal mNG tagged cell line maintained in Dawson Lab |
| Strain, strain background (Giardia lamblia) | WBC6 | ATCC | ATCC 50803 | Cell line maintained in Dawson Lab |
| Recombinant DNA reagent | pKS_mNeonGreen-N11_NEO | https://doi.org/10.1073/pnas.1705096114 | ||
| Recombinant DNA reagent | pKS_mNeonGreen-N11_PAC | https://doi.org/10.1073/pnas.1705096114 | ||
| Recombinant DNA reagent | Giardia Gateway cloning destination vector pcGFP1Fpac | https://doi.org/10.1016/S0091-679X(10)97017-9 | GenBank MH048881.1 | |
| Antibody | TAT-1 (mouse monoclonal) | Sigma-Aldrich | Anti-α-Tubulin, 00020911 | IF: (1:250) |
| Antibody | anti-GFP (rabbit polyclonal) | Sigma-Aldrich | IF: (1:500) | |
| Software, algorithm | KymographClear 2.0 | https://doi.org/10.1091/mbc.e15-06-0404 | ||
| Software, algorithm | KymographDirect | https://doi.org/10.1091/mbc.e15-06-0404 | ||
| Chemical compound, drug | Taxol | Sigma-Aldrich | T7402 | Concentration (in DMSO): 20 µM |
Additional files
Download links
A two-part list of links to download the article, or parts of the article, in various formats.
Downloads (link to download the article as PDF)
Open citations (links to open the citations from this article in various online reference manager services)
Cite this article (links to download the citations from this article in formats compatible with various reference manager tools)
Length-dependent disassembly maintains four different flagellar lengths in Giardia
eLife 8:e48694.
https://doi.org/10.7554/eLife.48694


