Entrained neuronal activity to periodic visual stimuli in the primate striatum compared with the cerebellum
- Hokkaido University School of Medicine, Japan
- Baylor College of Medicine, United States
Figures
Figure 1
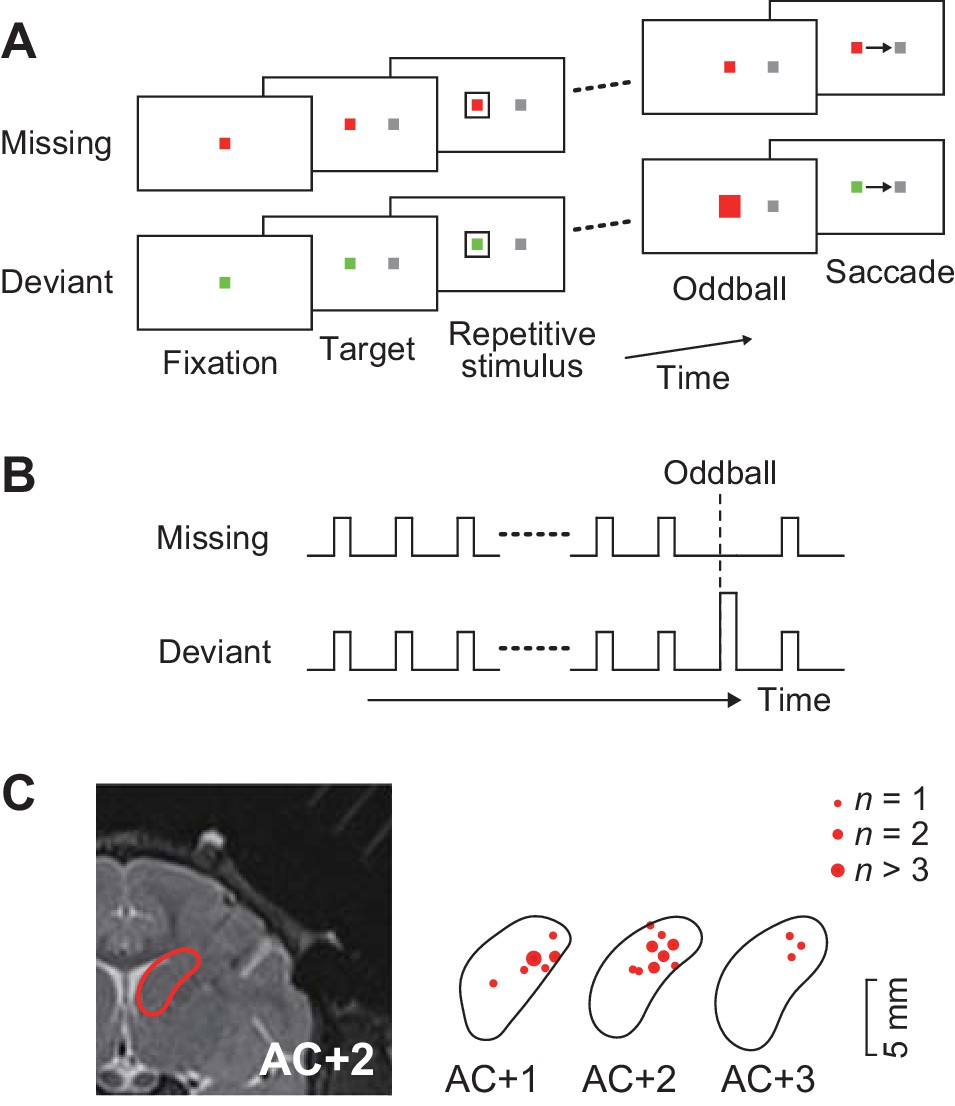
Behavioral task and recording sites.
(A) Oddball detection task. During central fixation, a saccade target was presented either left or right of the fixation point (FP). Then, a brief visual cue (35 ms) was isochronously presented around the FP (unfilled white square). Monkeys were trained to make a saccade in response to the omission or deviation of the repetitive visual stimuli. The deviant stimulus differed in color and filling but had same size as the regular repetitive stimuli. Different FP colors indicated different conditions so that animals could predict either stimulus omission or deviation during fixation. The FP remained visible until end of each trial. (B) Time course of events. Repetitive visual stimuli were presented at a fixed inter-stimulus interval (ISI) ranging from 100 to 600 ms. The stimulus sequence lasted for a random 2000–4800 ms before the occurrence of the oddball. Different conditions were pseudorandomly presented in a block of trials. (C) Recording sites reconstructed from MR images. Locations of task-related neurons (red dots) are overlaid on the contour of the caudate nucleus on the coronal sections at different levels from the anterior commissure (AC).
Figure 2
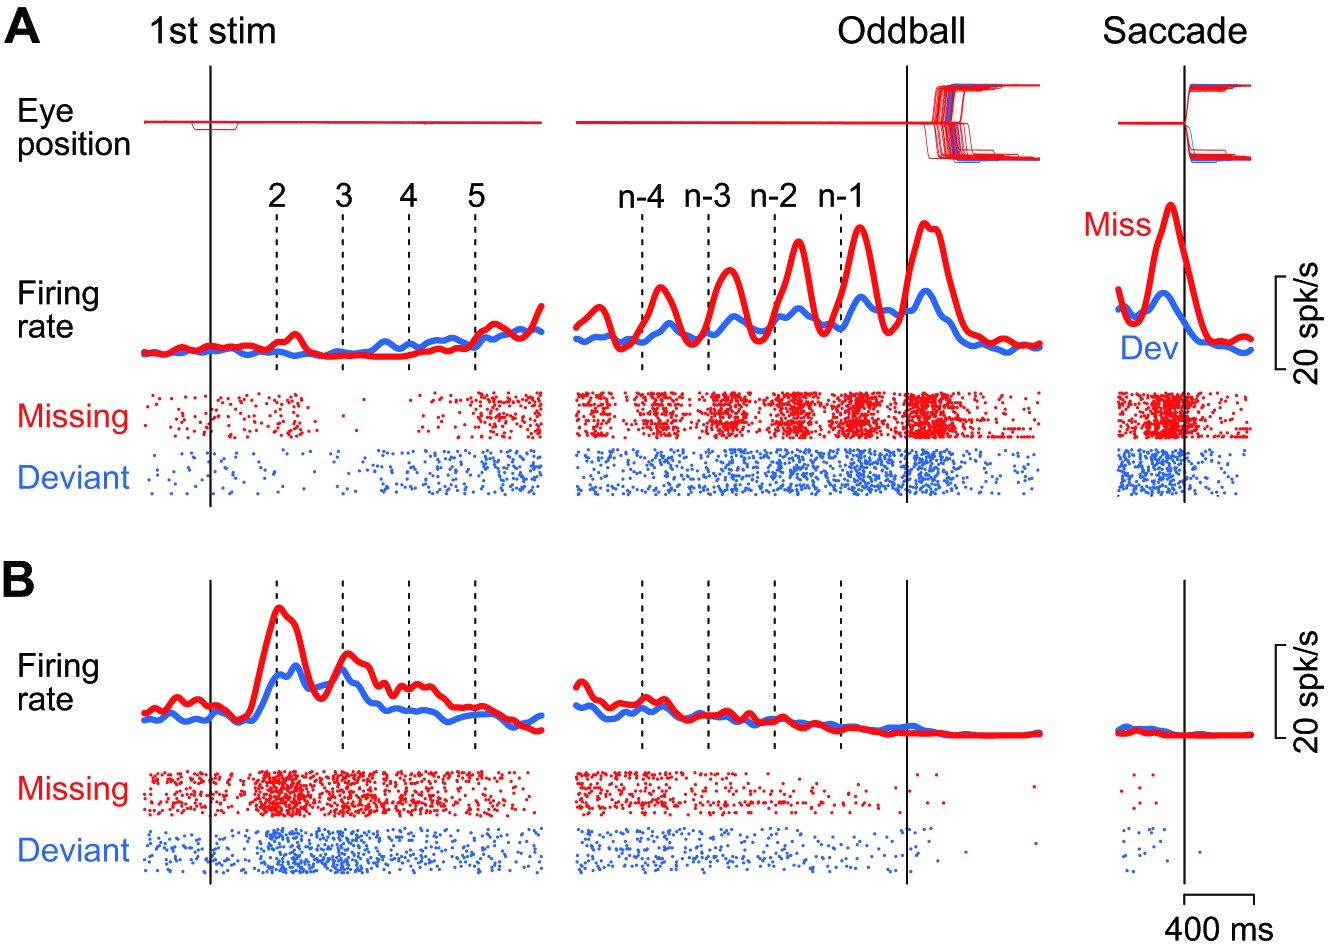
Example neurons.
(A) A neuron with a gradual increase of firing modulation for the repetitive stimuli. Data are aligned with either the first stimulus in the sequence (left) or the occurrence of the oddball (right). Vertical dashed lines indicate stimulus timing. Red and blue traces and rasters indicate the data for the missing and the deviant conditions, respectively. (B) A neuron showing a gradual decrease of firing rate.
-
Figure 2—source data 1
Numerical data for Figure 2.
- https://doi.org/10.7554/eLife.48702.004
Figure 3
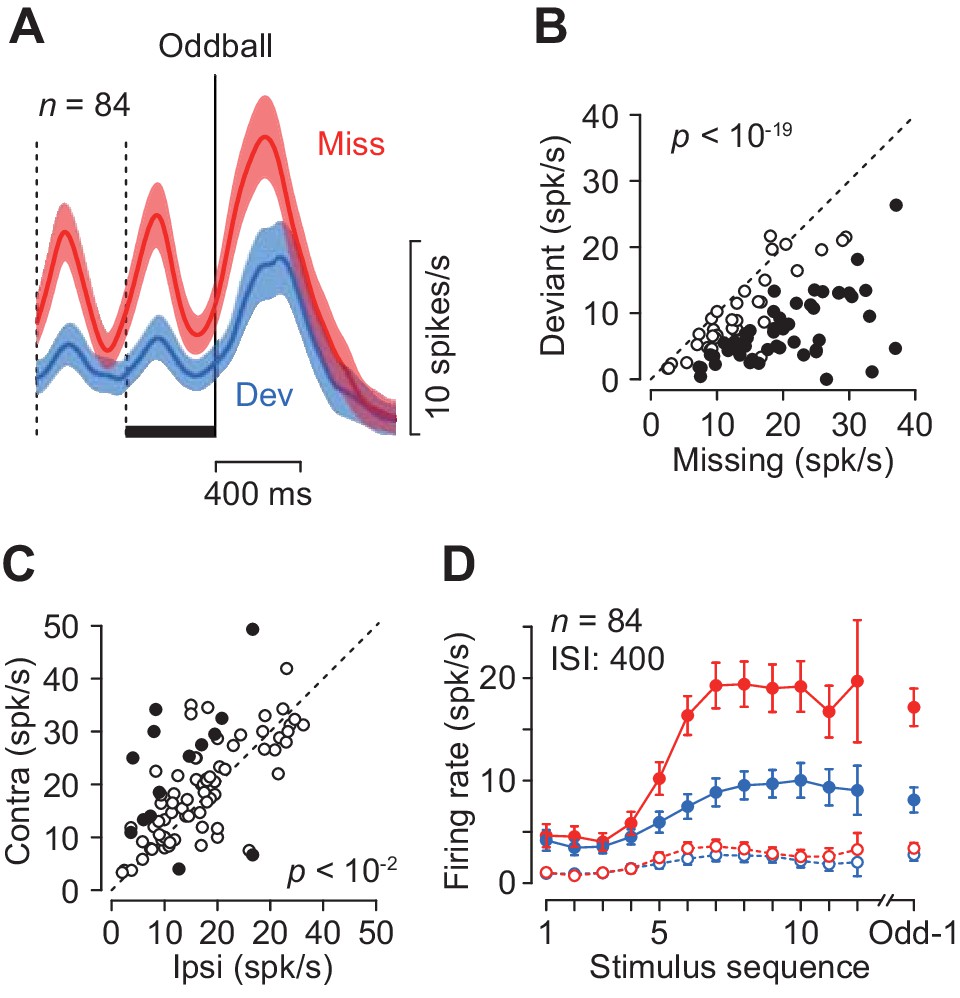
Quantitative comparison of neuronal activity between the missing and the deviant conditions.
(A) Population activity of the increase-type neurons aligned with the oddball (vertical solid line). Shaded area indicates ± 95% CIs. (B) Effects of oddball conditions in individual neurons. The maximal firing rate was measured during a 100 ms window placed within the last inter-stimulus interval denoted by a black bar in A. Filled symbols indicate the data with a significant difference (Wilcoxon’s rank sum test, p<0.01, corrected). (C) Effects of saccade direction. Each data point compares maximal activity before the oddball between trials with opposite saccade directions. (D) The means of maximal (data connected with solid lines) and minimal (dashed lines) activities during each ISI as a function of time. Colors indicate different oddball conditions. Error bar indicates ± 95% CIs. Data are aligned with the beginning of the stimulus sequence (left panel) or the occurrence of the oddball (right).
-
Figure 3—source data 1
Numerical data for Figure 3.
- https://doi.org/10.7554/eLife.48702.006
Figure 4 with 1 supplement
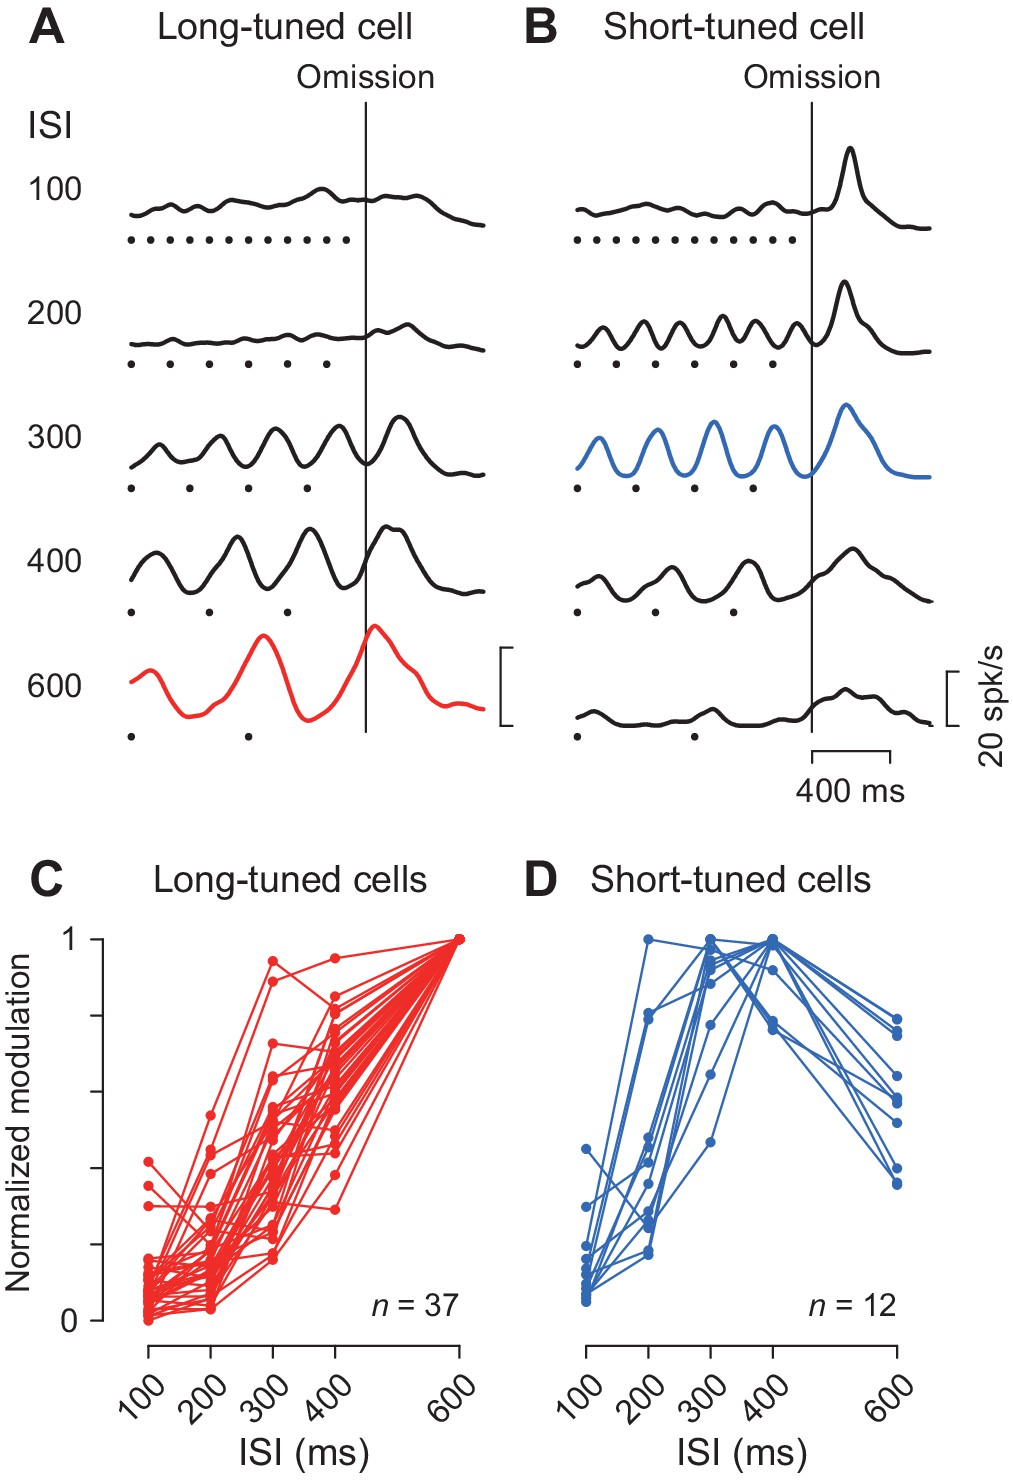
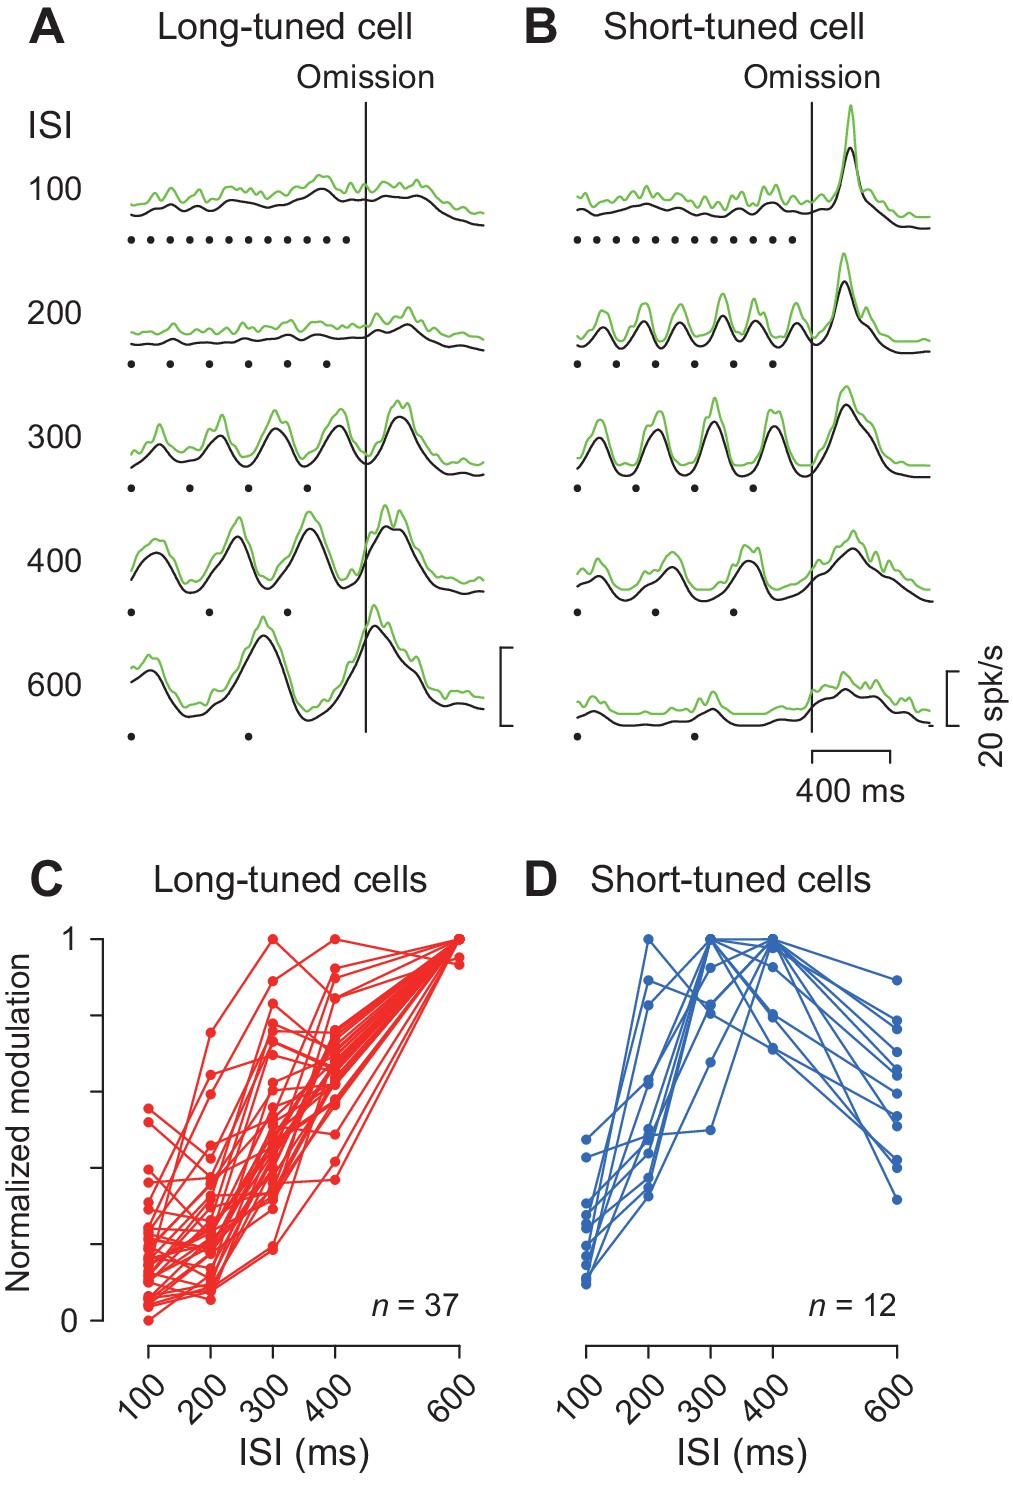
Duration preference.
(A, B) Spike density profiles of two example neurons for different ISIs. Data are aligned with the stimulus omission (vertical black line). Black dots below the traces indicate stimulus timing. Each panel plots a long-tuned neuron (A) and a short-tuned neuron (B). (C, D) Duration tuning for individual neurons. Data points connected with lines indicate the normalized firing modulation for each neuron. Note that the majority of neurons (75%, 36/48) steadily elevated the magnitude of firing modulation as the ISI increased (C). Note also that most short-tuned neurons showed a preference for either 300 or 400 ms ISI but never for 100 or 200 ms (D).
-
Figure 4—source data 1
Numerical data for Figure 4.
- https://doi.org/10.7554/eLife.48702.009
Figure 4—figure supplement 1
Comparison of different Gaussian filters.
Same format as in Figure 4 except that a narrower Gaussian kernel (σ = 15 ms) was used. (A, B) Spike density profiles of two example neurons for different ISIs with different kernels (15 ms, green traces; 30 ms, black traces, same as in Figure 4). Spike density traces with a narrower kernel were shifted vertically for presentation purpose only. (C, D) Duration tuning computed with a narrower kernel.
Figure 5 with 1 supplement
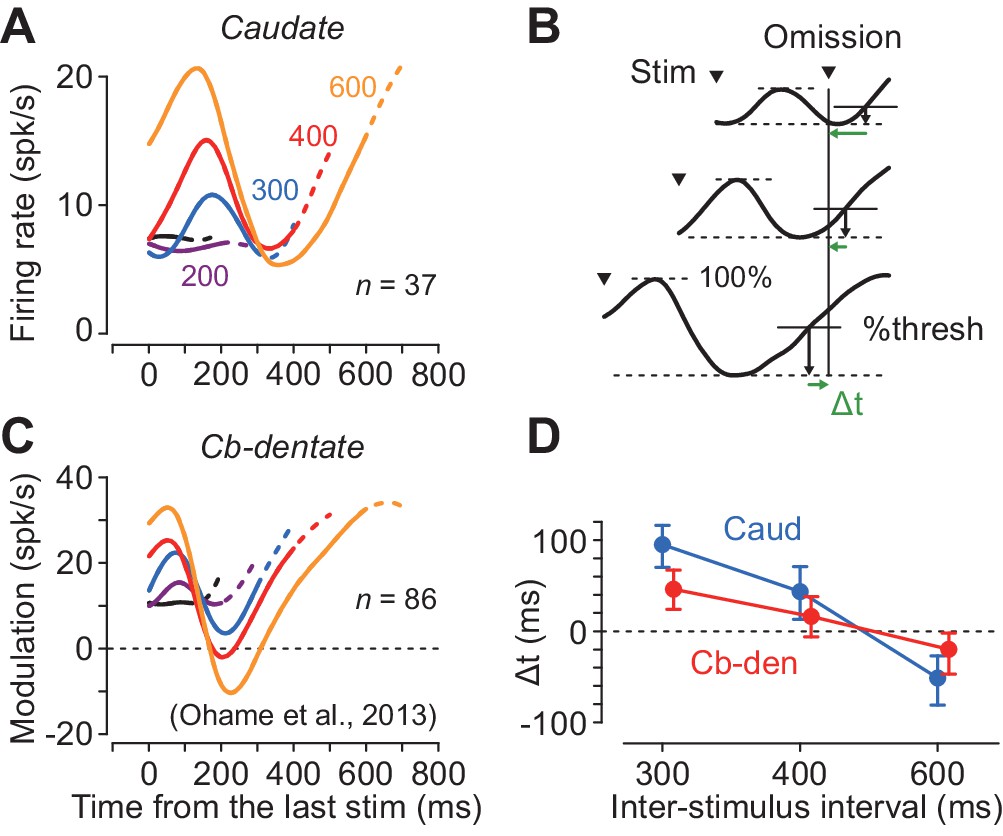
Comparison of neuronal activity in the caudate nucleus with that in the cerebellar dentate nucleus.
(A, C) Time courses of population activity aligned with the stimulus just before the oddball. Different colors indicate different ISIs. Dashed traces indicate neuronal activity during 100 ms following the oddball. Data for the cerebellar nucleus are taken from the previous study (Ohmae et al., 2013). (B) Procedures to estimate the next stimulus timing based on the time courses of the population activity. For the data of longer ISIs (300, 400 and 600 ms), we assumed that the stimulus timing was predicted when neuronal activity surpassed a certain threshold. We searched for the % threshold that minimized the squared sum of the prediction error (Δt) of the next stimulus timing. (D) Prediction error of stimulus timing for neurons in the caudate nucleus and the cerebellum. Error bars indicate bootstrap 95% CIs.
-
Figure 5—source data 1
Numerical data for Figure 5.
- https://doi.org/10.7554/eLife.48702.012
Figure 5—figure supplement 1
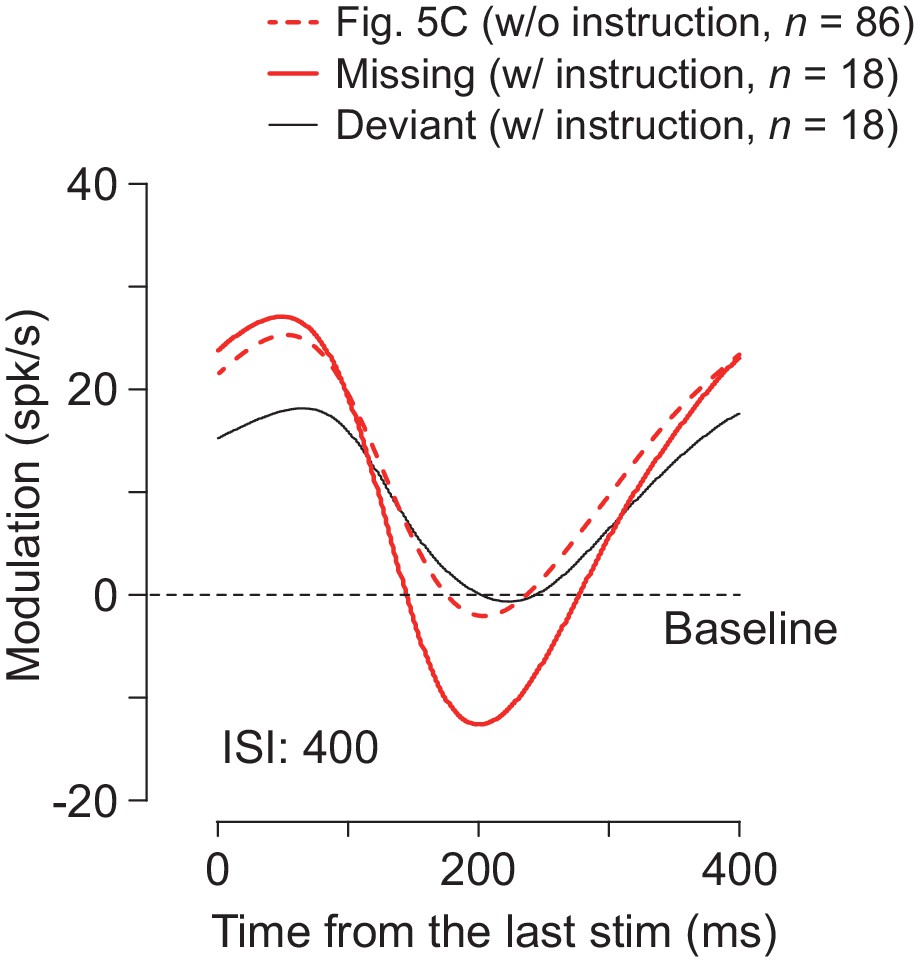
Effects of prior instruction of oddball condition on neuronal activity in the cerebellar dentate nucleus.
Time courses of population activity aligned with the stimulus just before the oddball. Red dashed trace duplicates the data in Figure 5C, and were obtained in trials with no prior instruction about oddball condition (Ohmae et al., 2013). Red continuous trace plots the data in the explicit missing oddball condition, in which color of the fixation point (red) indicated the forthcoming stimulus omission (Figure 1A). Thin black trace indicates the data in the explicit deviant oddball condition (green FP). Data with prior instruction were obtained from the right dentate nucleus in monkey H (n = 18 neurons).
Figure 6
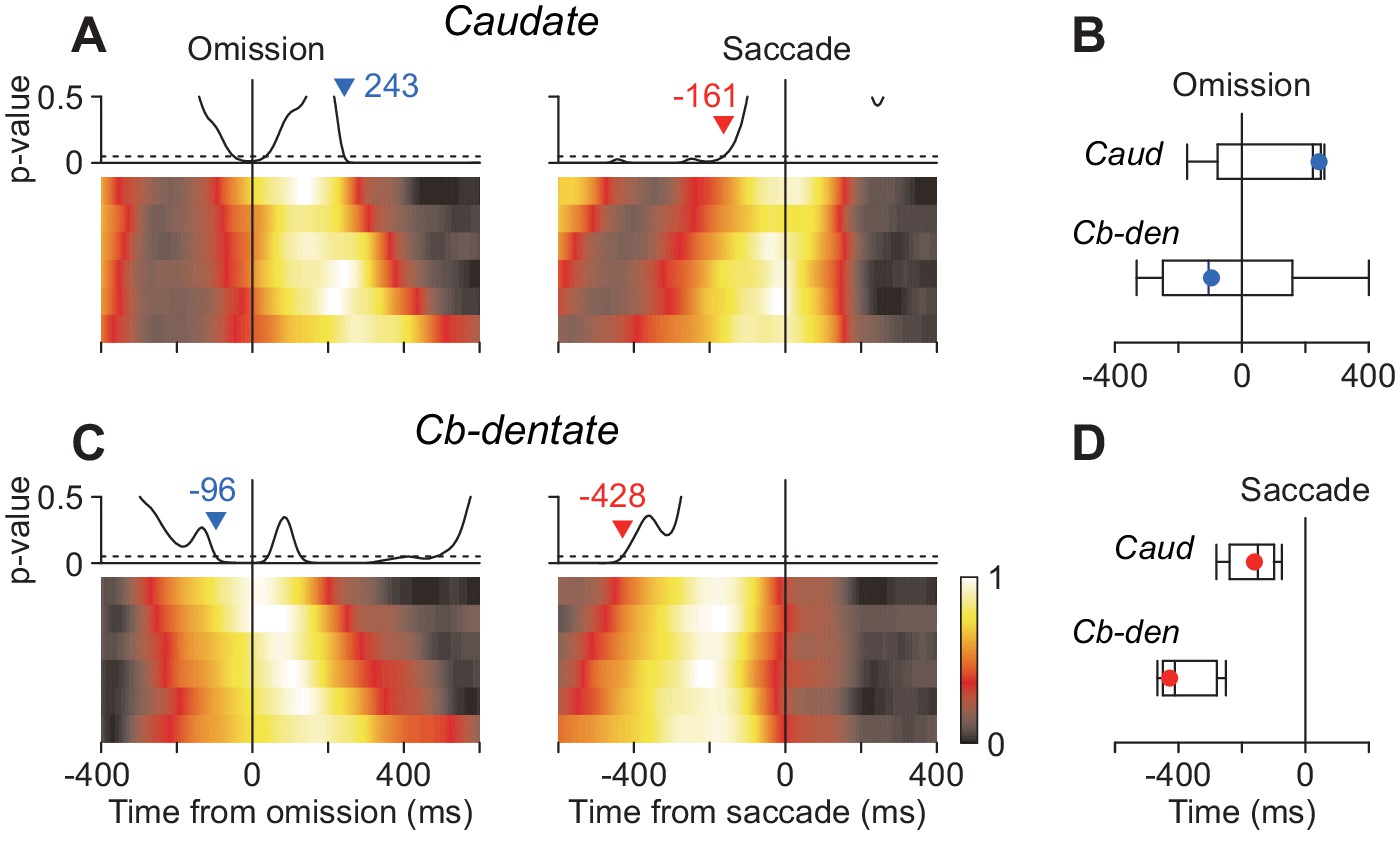
Neuronal correlates of stochastic variation of saccade latency.
(A, B) For each neuron, data were divided into six groups according to saccade latency (with equal number of trials). Each heatmap plots normalized population activity aligned with either stimulus omission (left panel) or saccade initiation (right). We performed one-way ANOVA for every millisecond to measure the timing of neuronal correlates of trial-by-trial variation in latency (Materials and methods). Traces above the heatmap plot the time course of p-values and the horizontal dashed lines denote the significance level (0.05). Inverted triangles with numbers indicate the timing when neuronal variation consistently (>100 ms) started (blue) or disappeared (red). Note that the stochastic variation started firstly in the cerebellar nucleus (B) and persisted late in the caudate nucleus (A). (C) Summary of the timing of neuronal variation relative to the stimulus omission (top panel) or saccade initiation (bottom). Box-whisker plot illustrates bootstrap quartiles and 95% CIs. Red and blue circles indicate actual measurements.
-
Figure 6—source data 1
Numerical data for Figure 6.
- https://doi.org/10.7554/eLife.48702.014
Figure 7
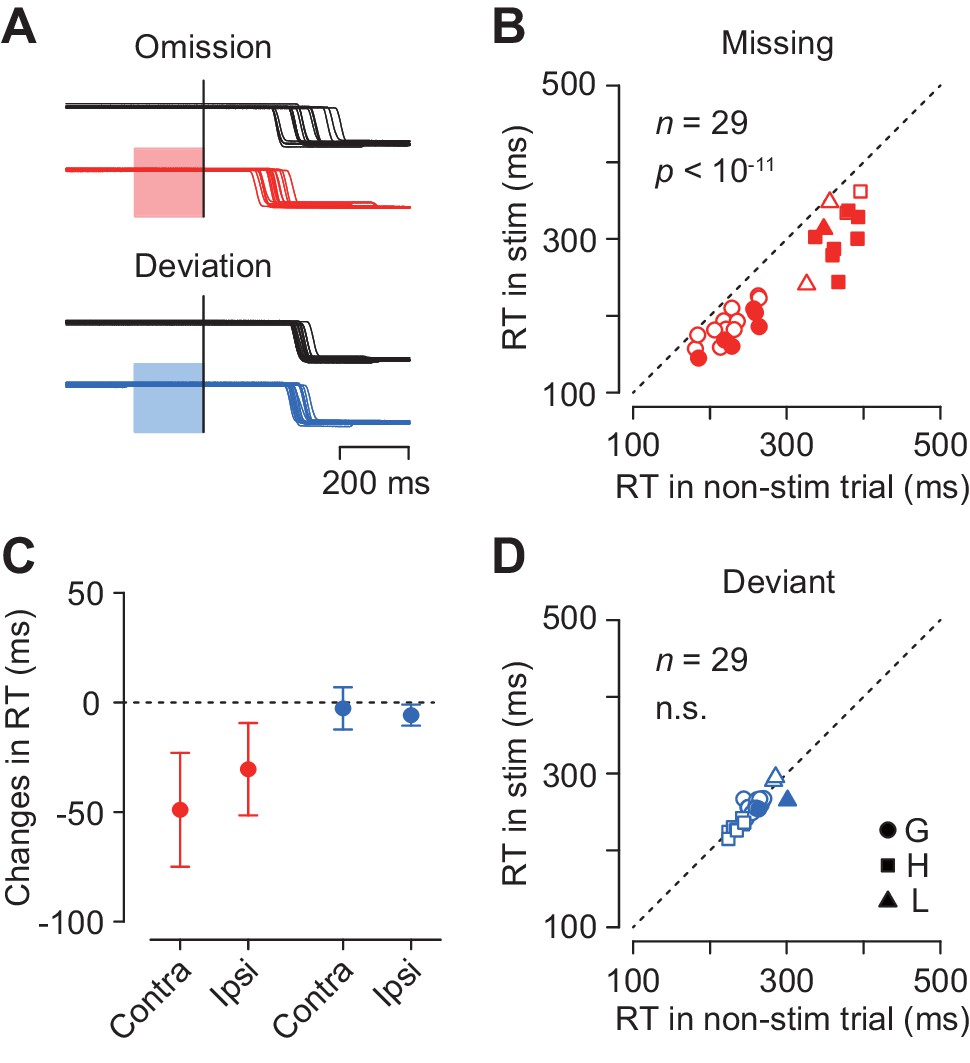
Effects of electrical microstimulation.
(A) Traces of eye position aligned with the stimulus omission or deviation in a single experiment. Black traces indicate non-stimulation controls and colored traces indicate randomly-interleaved stimulation trials. Shaded areas denote timing of electrical stimulation (200 ms, 50 μA, 100 Hz). (B, D) Comparison of medians of contraversive saccade latencies between trials with and without electrical stimulation. Different symbols indicate different animals. (C) Changes in saccade latency for different oddball conditions and saccade directions.
-
Figure 7—source data 1
Numerical data for Figure 7.
- https://doi.org/10.7554/eLife.48702.016
Additional files
-
Transparent reporting form
- https://doi.org/10.7554/eLife.48702.017
Download links
A two-part list of links to download the article, or parts of the article, in various formats.
Downloads (link to download the article as PDF)
Open citations (links to open the citations from this article in various online reference manager services)
Cite this article (links to download the citations from this article in formats compatible with various reference manager tools)
Entrained neuronal activity to periodic visual stimuli in the primate striatum compared with the cerebellum
eLife 8:e48702.
https://doi.org/10.7554/eLife.48702


