Receptor-specific interactome as a hub for rapid cue-induced selective translation in axons
- University of Cambridge, United Kingdom
- Harvard Medical School, United States
Figures
Figure 1 with 1 supplement
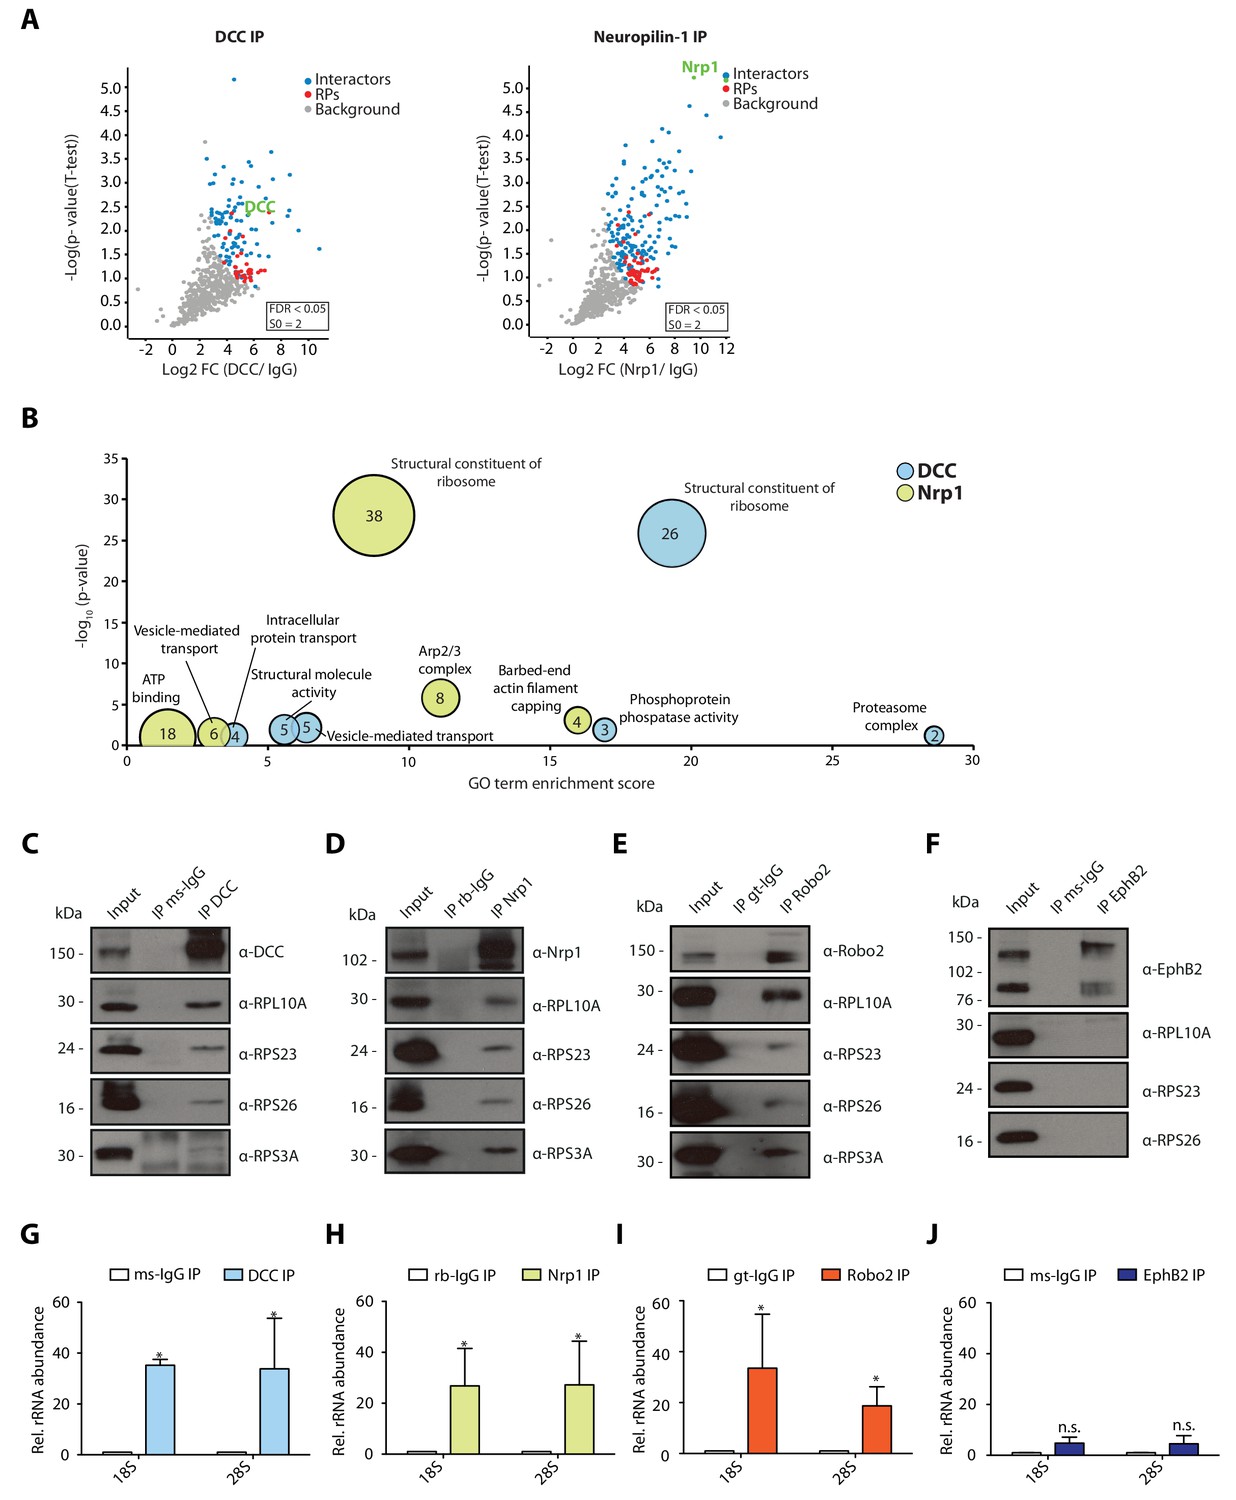
Multiple guidance cue receptors interact with ribosomes.
(A) Volcano plots showing statistically enriched proteins in DCC-IP and Nrp1-IP samples identified by permutation-based FDR-corrected t-test based on three biological replicates. The LFQ intensity of the DCC or Nrp1 pulldowns over IgG pulldowns are plotted against the -log10 p-value. FDR < 0.05; S0 = 2. (B) Gene enrichment analysis of statistically enriched proteins in the DCC and Nrp1 pulldown samples. The values in each circle denotes protein count. (C–F) Western blot validation of RP co-immunoprecipitation with DCC, Nrp1 and Robo2 but not with EphB2. Each Western blot was repeated 2 to 4 times, representative images are shown. (G–J) Relative 18S and 28S ribosomal RNA abundance after control (IgG) pulldown or receptors pulldowns shows enrichment of rRNA in DCC, Nrp1, and Robo2 but not EphB2 pulldowns (unpaired two-tailed t-test; three biological replicates). Bars indicate means, error bars indicate standard deviation; *p<0.05.
Figure 1—figure supplement 1

Multiple guidance cue receptors interact with ribosomes in SH-SY5Y cells.
(A–C) Western blot validation of RP co-immunoprecipitation with DCC, Nrp1 and Robo2 in SH-SY5Y cells. Western blots were repeated 2 to 4 times, Rps4X Western blots are from one experiment, representative examples are shown. (D–E) Relative 18S and 28S ribosomal RNA abundance after control (IgG) pulldowns or receptor pulldowns shows enrichment of rRNA in DCC and Nrp1 IPs in SH-SY5Y cells (unpaired two-tailed t-test; three biological replicates; Bars indicate mean, error bars indicate standard deviation. *p<0.05).
Figure 2 with 1 supplement
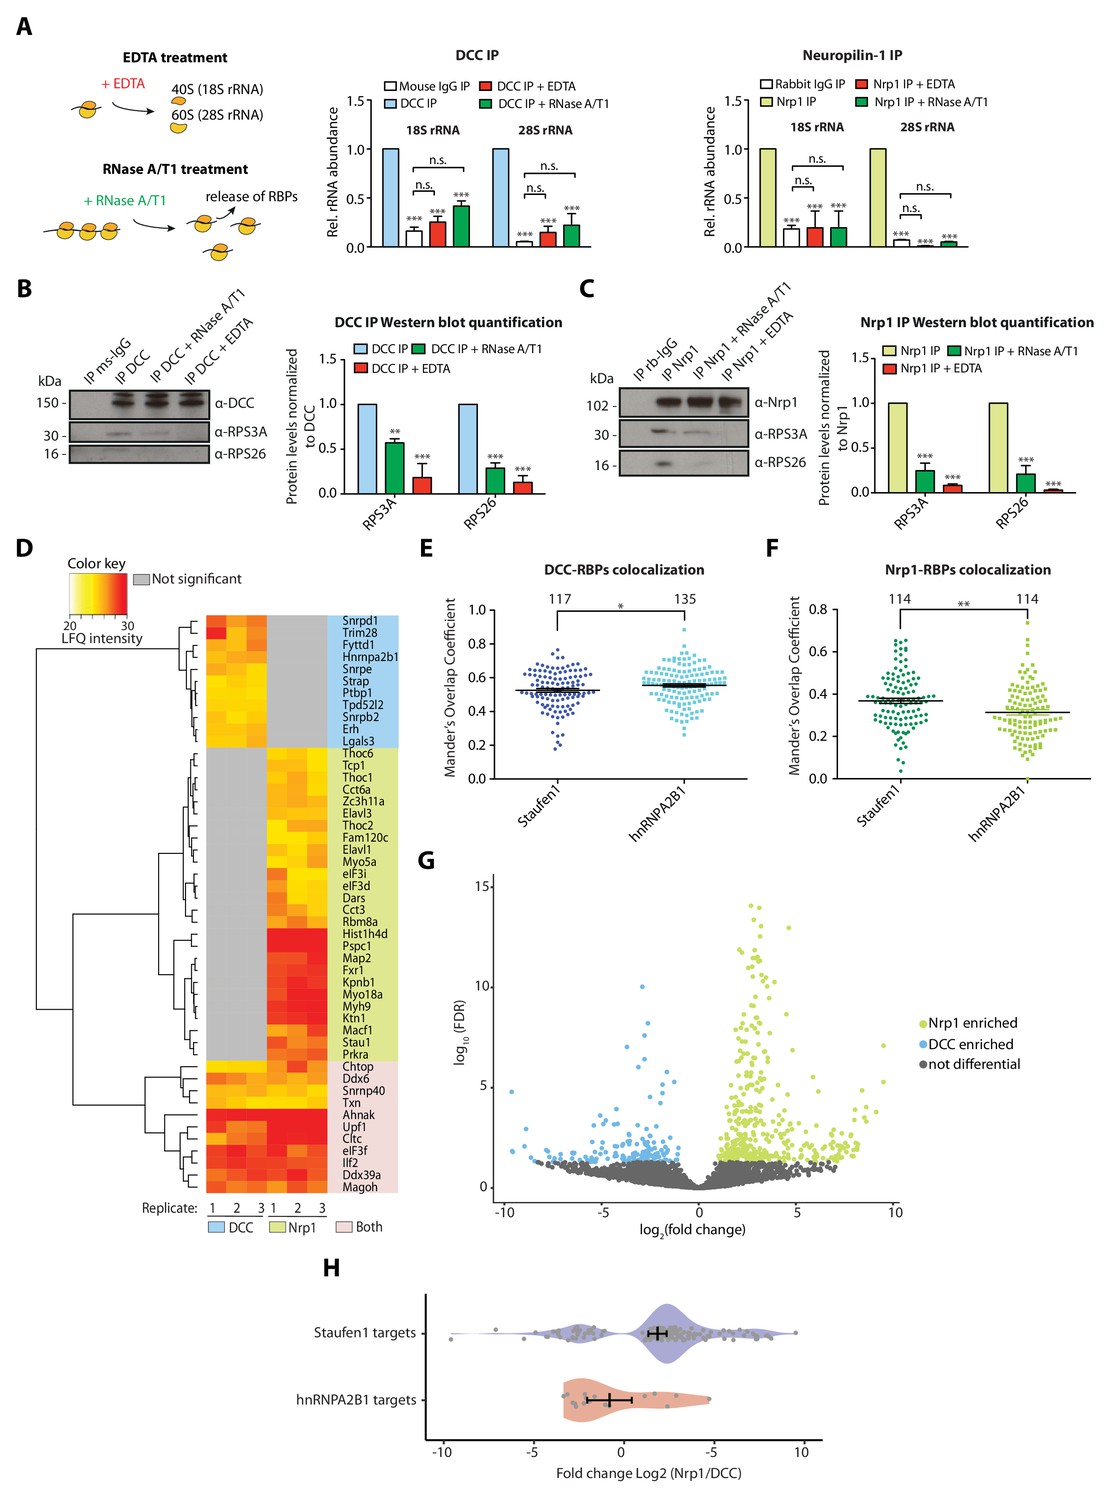
Receptor-ribosome coupling is mRNA dependent and DCC and Nrp1 bind to specific RBPs and mRNAs.
(A) Relative 18S and 28S ribosomal RNA abundance after control (IgG) pulldown or receptors pulldowns with or without EDTA or RNase A/T1 treatments (two-way ANOVA with Bonferroni’s multiple comparisons test; three biological replicates; Bars indicate mean, error bars indicate standard deviation; ***p<0.0001). (B) Western blot analysis and quantification of ribosomal proteins after DCC and (C) Nrp1 pulldowns. (two-way ANOVA with Bonferroni’s multiple comparisons test; three biological replicates; Bars indicate mean, error bars indicate standard deviation; **p<0.01; ***p<0.0001). (D) Hierarchically-clustered heatmap of detected RBPs after DCC and Nrp1 pulldown. LFQ intensities are plotted for each IP-MS replicate. (E) Mander’s overlap coefficients analysed using dual immunohistochemistry of DCC and Staufen1 or hnRNPA2B1 in axonal growth cones (unpaired two-tailed t-test; three biological replicates; individual data points are shown, error bars indicate SEM; p=0.03913). (F) Mander’s overlap coefficients analysed using dual immunohistochemistry Nrp1 and Staufen1 or hnRNPA2B1 in axonal growth cones (unpaired two-tailed t-test; three biological replicates; individual data points are shown, error bars indicate SEM; p=0.00161). (G) Volcano plot showing differential expression analysis for DCC and Nrp1 pulldowns. (H) Enrichment analysis plot of known RBP targets of Staufen1 and hnRNPA2B1 detected in RNA-sequencing data after DCC and Nrp1 pulldown (individual data points are shown, error bars indicate standard deviation, Mann-Whitney test, Wilcoxon rank sum test DCC versus Nrp1; p=0.001511).
-
Figure 2—source data 1
Spreadsheet containing all Manders Overlap Coefficient values for each axonal growth cone in Figure 2E and F.
- https://cdn.elifesciences.org/articles/48718/elife-48718-fig2-data1-v2.xlsx
-
Figure 2—source data 2
Spreadsheet containing RNA-sequencing analysis of DCC and Nrp1 bound mRNAs and GO analysis of high abundant (FPKM >100) detected mRNAs for DCC and Nrp1.
- https://cdn.elifesciences.org/articles/48718/elife-48718-fig2-data2-v2.xlsx
Figure 2—figure supplement 1
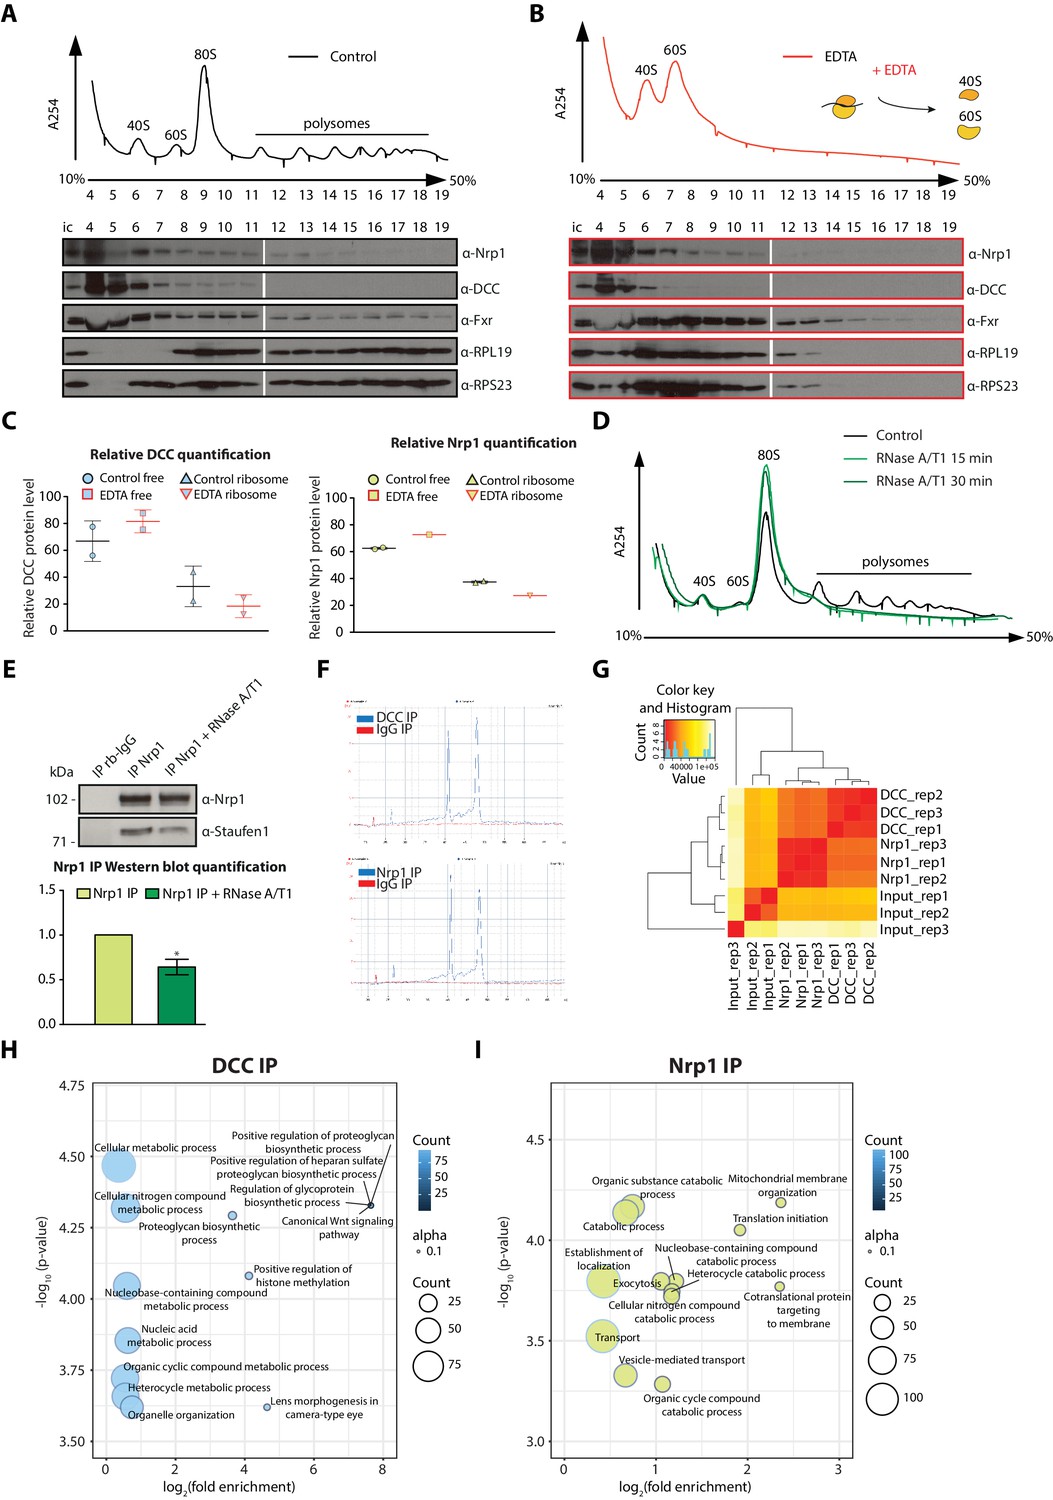
Polysome fractionation analysis, RNase sensitivity of Nrp1-Staufen1 interaction and additional RNA-seq analyses.
(A) Control and (B) EDTA treated polysome fractions and Western blot showing the distribution of DCC and Nrp1 across fractions. (C) Relative quantification of DCC and Nrp1 protein levels in ribosome-free and ribosomal fractions for control and EDTA-treated samples (DCC control n = 2, DCC EDTA n = 2, Nrp1 control n = 2, Nrp1 EDTA n = 1; Bars indicate mean, errors bars indicate standard deviation). (D) UV absorbance profiles after sucrose density gradient fractionation for control and RNAseA/T1 treated lysates. (E) Western blot analysis and quantification of Staufen1 after Nrp1 pulldowns. (paired t-test; three biological replicates; bars indicate mean, error bars indicate standard deviation; p=0.0136). (F) Bioanalyzer gel analysis of RNA. (G) Distance matrix showing a high correlation between replicates and a distinct signature between samples. (H) Gene ontology enrichment plot of mRNAs after DCC or (I) Nrp1 pulldowns.
Figure 3 with 1 supplement
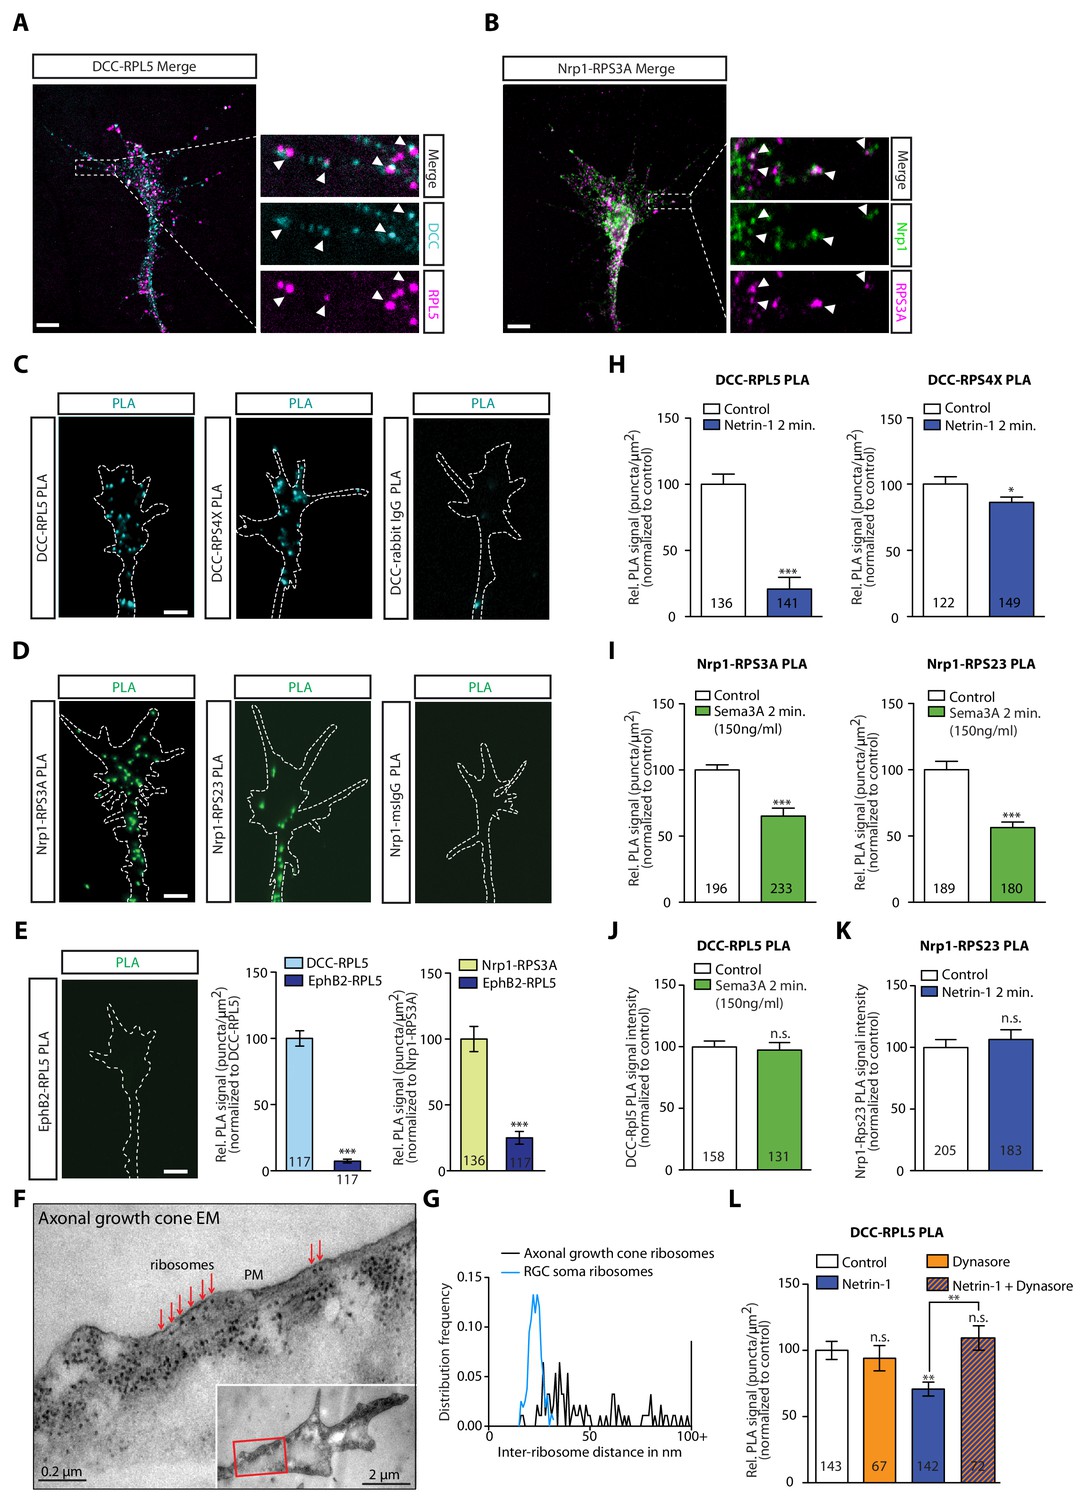
DCC and Nrp1 are in close proximity to ribosomes in axonal growth cones in a cue-dependent manner.
(A) Expansion imaging shows partial co-localization of DCC and (B) Nrp1 with ribosomal proteins (Scale bars, 5 μm). (C) Representative proximity ligation assay signal in axonal growth cones between DCC and RPL5/uL18, RPS4X/eS4 or IgG control (Scale bars, 5 μm). (D) Representative proximity ligation assay signal in axonal growth cones between Nrp1 and RPS3A/eS1, RPS23/uS12 or IgG control (Scale bars, 5 μm). (E) Representative PLA signal in axonal growth cones between EphB2 and RPL5/uL18 (left) and quantification of PLA signal in axonal growth cones compared to DCC-RPL5/uL18 or Nrp1-RPS23/uS12 (right) (Mann-Whitney test; three biological replicates; bars indicate mean, error bars indicate SEM, ***p<0.0001; Scale bars, 5 μm). (F) EM image of an unstimulated axonal growth cone showing ribosomes aligned in a row (red arrows) under plasma membrane (PM). Inset shows the growth cone at lower magnification; the red box indicates the area shown in higher magnification. The section glances through the extreme surface of growth cone, where it attaches to the culture dish, giving rise to areas that lack subcellular structure. (G) Distribution frequency of the inter-ribosome distance in nm of ribosomes in axonal growth cones (n = 20) or in RGC soma (n = 5). All distances larger than 100 nm were pooled together. (H, I, J, K) Quantification of PLA signal in cue-stimulated axonal growth cones relative to control (unpaired two-tailed t-test; bars indicate mean, error bars indicate SEM; ***p<0.0001; *p=0.0423; for n.s. in J p=0.3522; for n.s. in K, p=0.885). (L) Relative PLA quantification of DCC and RPL5/uL18 compared to control after Dynasore pre-treatment (50 μM for 20 min), Netrin-1, or Netrin-1 + Dynasore (one-way ANOVA with Bonferroni’s multiple comparisons test; bars indicate mean, error bars indicate SEM; p=0.001027 for Control vs. Netrin-1, p=0.000402 for Netrin-1 vs Netrin-1 + Dynasore, p=0.590377 for Control vs. Dynasore, p=0.384848 for Control vs Netrin + Dynasore). For all PLA experiments, numbers in bars indicate total number of growth cones quantified from at least three independent experiments.
-
Figure 3—source data 1
Spreadsheet containing PLA counts and relative comparisons from each axonal growth cone in Figure 3E, all inter-ribosome distances and distribution shown in Figure 3G, and all normalized PLA count values for each axonal growth cone in Figure 3H–L.
- https://cdn.elifesciences.org/articles/48718/elife-48718-fig3-data1-v2.xlsx
Figure 3—figure supplement 1

DCC and Nrp1 are in close proximity to ribosomes in axonal growth cones in a cue-dependent manner.
(A) Pearson’s Correlation coefficients of DCC-RPL5/uL18 and Nrp1-RPS3A/eS1 from expanded axonal growth cones (data obtained from four biological replicates, bars indicate mean, error bars indicate SEM). (B) PLA images showing DCC and RPL10A/uL1 are in close proximity in axonal growth cones, whereas DCC and IgG control generates little to no PLA signal. Scale bars, 5 μm. (C–E) EM images of an unstimulated axonal growth cone (C), a growth cone lamellipodium (D) and a retinal ganglion cell body (E). Ribosomes can be seen aligned in rows (red arrows) or isolated (white arrow) under the plasma membrane and as polysomes (blue arrows) in the cell body. (F) PLA signal between DCC and hnRNPA2B1 does not decrease after a 2 min Netrin-1 stimulation in axonal growth cones (Mann-Whitney test; bars indicate mean, error bars indicate SEM; p=0.2886; representative PLA images are shown). (G) Sema3A stimulation at protein-synthesis independent concentration does not decrease puromycin levels in axonal growth cones (Mann-Whitney test; bars indicate mean, error bars indicate SEM; p=0.2487; representative images are shown) or (H) PLA signal between Nrp1 and RPS3A/eS1 (Mann-Whitney test; bars indicate mean, error bars indicate SEM; p=0.2555). For all Expansion microscopy, PLA and QIF experiments, numbers in bars indicate amount of growth cones quantified collected from at least three independent experiments.
-
Figure 3—figure supplement 1—source data 1
Spreadsheet containing all Pearson’s correlation values for each expanded growth cone in Figure 3—figure supplement 1A, all normalized PLA count values for each axonal growth cone in Figure 3—figure supplement 1F and H, and all normalized puromycin intensity values for each axonal growth cone in Figure 3—figure supplement 1G.
- https://cdn.elifesciences.org/articles/48718/elife-48718-fig3-figsupp1-data1-v2.xlsx
Figure 4 with 1 supplement
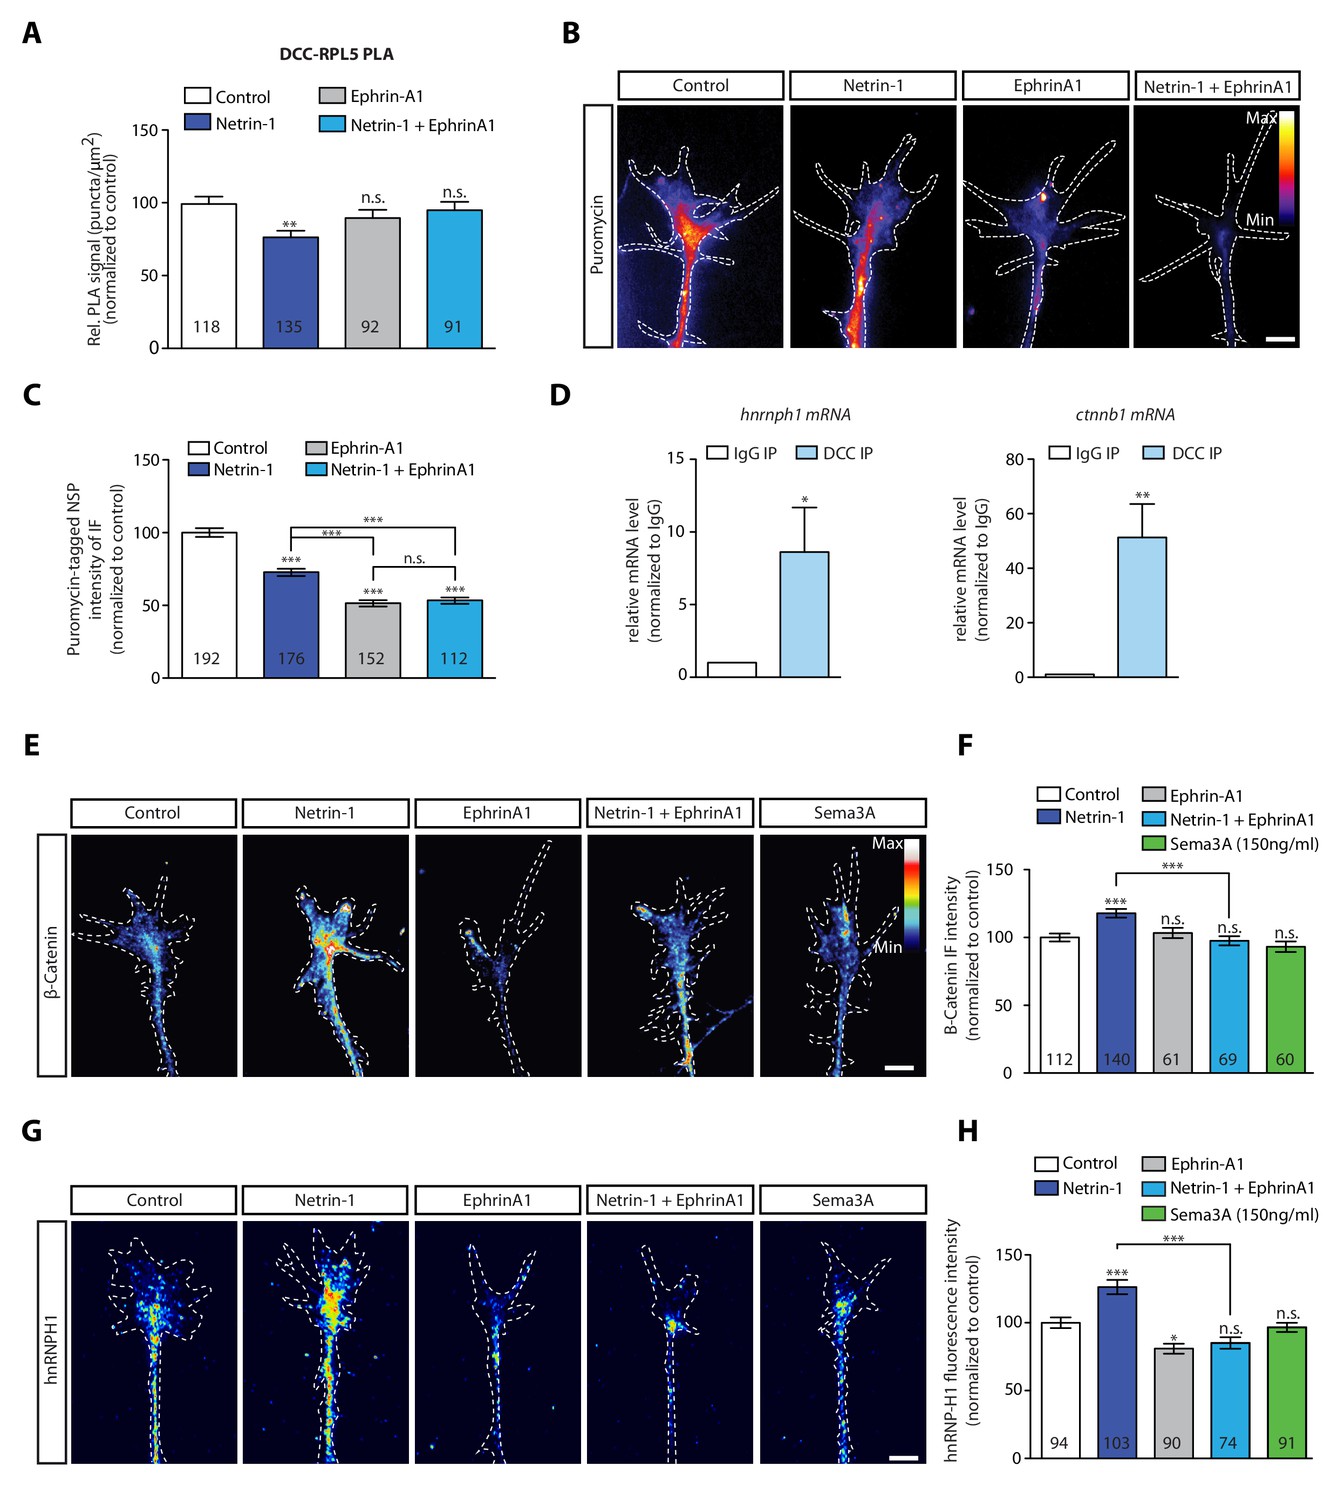
EphrinA1 co-stimulation blocks Netrin-1 induced receptor-ribosome dissociation and selective translation.
(A) Relative PLA quantification of DCC and RPL5/uL18 compared to control after Netrin-1, EphrinA1, or co-stimulation (one-way ANOVA with Bonferroni’s multiple comparisons test; bars indicate mean, error bars indicate SEM; **p<0.01). (B, C) Puromycin QIF relative to control after Netrin-1, EphrinA1 or co-stimulation (one-way ANOVA with Bonferroni’s multiple comparisons test; bars indicate mean, error bars indicate SEM; ***p<0.0001). (D) Relative mRNA quantification after DCC IP of hnrnph1 and ctnnb1 mRNA (unpaired t-test with Welch’s corrections on dCT values; three biological replicates; bars indicate mean, error bars indicate SEM; *p=0.02 for hnrnph1; **p=0.0018 for ctnnb1). (E, F) β-Catenin QIF relative to control after Netrin-1, EphrinA1, Sema3A or Netrin-1 and EphrinA1 co-stimulation (one-way ANOVA with Bonferroni’s multiple comparisons test; bars indicate mean, error bars indicate SEM; ***p<0.0001). (G, H) hnRNPH1 QIF relative to control after Netrin-1, EphrinA1, Sema3A or Netrin-1 and EphrinA1 co-stimulation (one-way ANOVA with Bonferroni’s multiple comparisons test; bars indicate mean, error bars indicate SEM; ***p<0.0001; *p=0.0164). Scale bars, 5 μm. For all QIF experiments, numbers in bars indicate amount of growth cones quantified collected from at least three independent experiments.
-
Figure 4—source data 1
Spreadsheet containing all normalized PLA count values for each axonal growth cone in Figure 4A, all normalized puromycin intensity values for each axonal growth cone in Figure 4C, all normalized ß-Catenin intensity values for each axonal growth cone in Figure 4F and all normalized hnRNPH1 intensity values for each axonal growth cone in Figure 4H.
- https://cdn.elifesciences.org/articles/48718/elife-48718-fig4-data1-v2.xlsx
Figure 4—figure supplement 1

EphrinA1 co-stimulation blocks Netrin-1 induced receptor-ribosome dissociation and selective translation of rps14.
(A) Relative PLA quantification of Nrp1 and RPS23/uS12 compared to control after Sema3A, EphrinA1, or co-stimulation with Sema3A and EphrinA1 (one-way ANOVA with Bonferroni’s multiple comparisons test; bars indicate mean, error bars indicate SEM; *p=0.032078; **p<0.018577; ***p<0.001). (B) pERK1/2 QIF relative to control after Netrin-1, EphrinA1 or Netrin-1 and EphrinA1 co-stimulation (one-way ANOVA with Bonferroni’s multiple comparisons test; bars indicate mean, error bars indicate SEM; ***p<0.0001). (C) Relative mRNA quantification after DCC IP of rps14 mRNA (unpaired t-test with Welch’s corrections on dCT values; three biological replicates; bars indicate mean, error bars indicate SEM; ***p=0.0003). (D) RPS14 QIF relative to control after Netrin-1, EphrinA1 or Netrin-1 and EphrinA1 co-stimulation (one-way ANOVA with Bonferroni’s multiple comparisons test; bars indicate mean, error bars indicate SEM; ***p<0.0001; *p=0.026544). (E) RpsRPS14 QIF relative to control after Netrin-1 or Sema3A stimulation (one-way ANOVA with Bonferroni’s multiple comparisons test; bars indicate mean, error bars indicate SEM; ***p<0.0001; *p<0.05). Scale bars, 5 μm. For all QIF experiments the numbers in bars indicate amount of growth cones quantified collected from three independent experiments.
-
Figure 4—figure supplement 1—source data 1
Spreadsheet containing all normalized PLA count values for each axonal growth cone in Figure 4—figure supplement 1A, all normalized pERK1/2 intensity values for each axonal growth cone in Figure 4—figure supplement 1B and all normalized RPS14 intensity values for each axonal growth cone in Figure 4—figure supplement 1D and E.
- https://cdn.elifesciences.org/articles/48718/elife-48718-fig4-figsupp1-data1-v2.xlsx
Figure 5
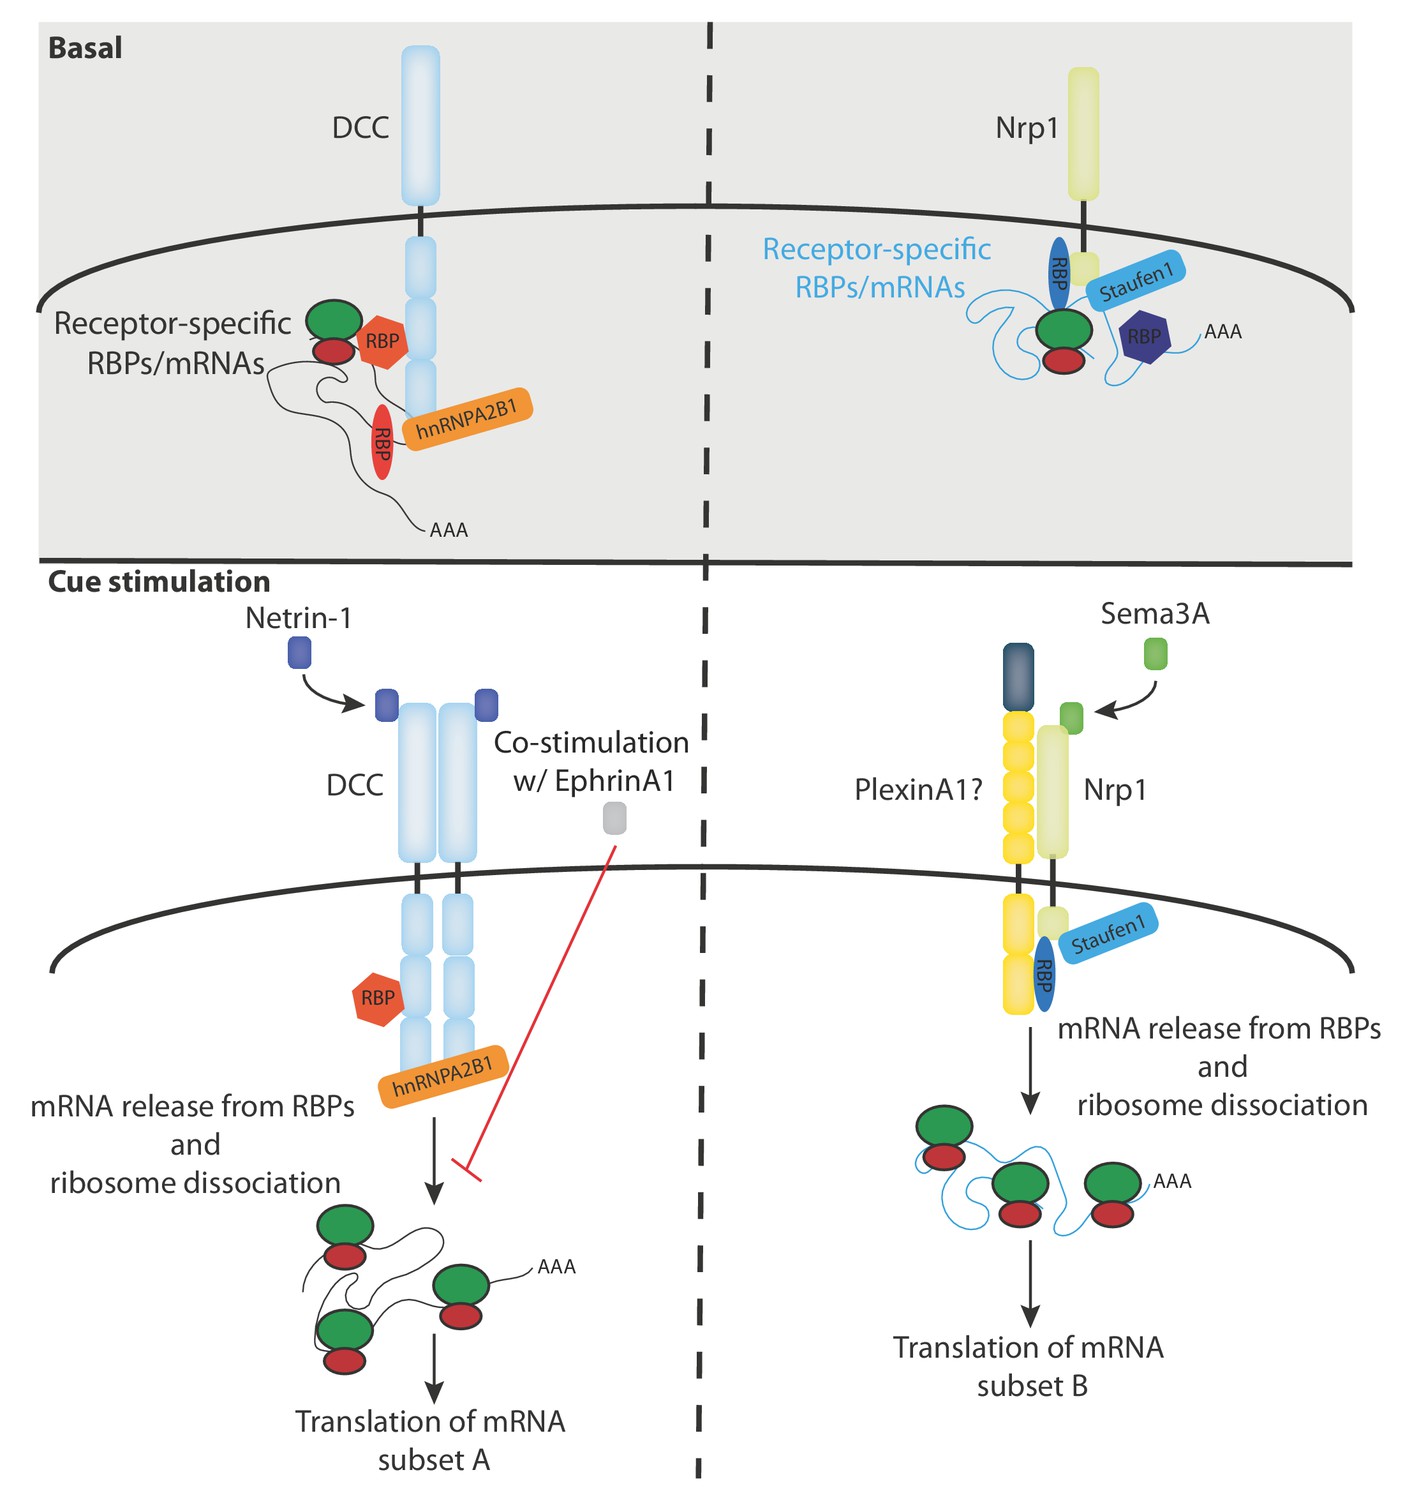
Model diagram depicting the proposed interactions between receptors, RBPs, mRNAs and ribosomes under basal and cue stimulation conditions.
Author response image 1

Tables
Key resources table
| Reagent type (species) or resource | Designation | Source or reference | Identifiers | Additional information |
|---|---|---|---|---|
| Biological sample (Xenopus laevis) | Xenopus laevis | NASCO | Cat# LM00715 (male); RRID:XEP_Xla100; Cat# LM00535 (female); RRID:XEP_Xla | |
| Cell line (Homo-sapiens) | SH-SY5Y | ATCC | Cat# CRL-2266; RRID:CVCL_0019 | |
| Antibody | anti-RPS3A (Rabbit polyclonal) | Abcam | Cat# ab194670; RRID:AB_2756396 | ICC/PLA (1:100) WB (1:1000) |
| Antibody | Anti-Neuropilin-1 (Rabbit monoclonal) | Abcam | Cat# ab81321; RRID:AB_1640739 | ICC/PLA (1:100) WB (1:2000) IP (5 µg) |
| Antibody | Anti-Neuropilin-1 (Mouse monoclonal) | Proteintech | Cat# 60067–1-Ig; RRID:AB_2150840 | ICC (1:100) |
| Antibody | Anti-DCC (mouse monoclonal | BD Biosciences | Cat# 554223; RRID:AB_395314 | ICC/PLA (1:100) WB (1:1000) IP (5 µg) |
| Antibody | Anti-RPL5 (rabbit polyclonal | Proteintech | Cat# 15430–1-AP; RRID:AB_2238681 | ICC/PLA (1:100) |
| Antibody | Anti-RPS4X (Rabbit polyclonal) | Proteintech | Cat# 14799–1-AP; RRID:AB_2238567 | PLA (1:100) WB (1:1000) |
| Antibody | Anti-RPL10A (Rabbit polyclonal) | Proteintech | Cat# 16681–1-AP; RRID:AB_2181281 | PLA (1:100) WB (1:500) |
| Antibody | Anti-RPS23 (mouse monoclonal) | Abcam | Cat#: ab57644; RRID:AB_945314 | PLA (1:100) WB (1:1000) |
| Antibody | Anti-RPS26 (Rabbit polyclonal | Proteintech | Cat# 14909–1-AP; RRID:AB_2180361 | WB (1:500) |
| Antibody | Anti-Robo2 (goat polyclonal) | R and D Systems | Cat# AF3147; RRID:AB_2181857 | WB (1:250) |
| Antibody | Anti-EphB2 (mouse monoclonal) | Santa Cruz | Cat# sc130068; RRID:AB_2099958 | WB (1:100) IP (5 µg) |
| Antibody | Anti-EphB2 (mouse monoclonal) | Thermo Fisher Scientific | Cat# 37–1700; RRID:AB_2533302 | PLA (1:100) |
| Antibody | Anti-Staufen1 (Rabbit polyclonal) | Abcam | Cat# ab73478; RRID:AB_1641030 | ICC (1:100) WB (1:500) |
| Antibody | Anti-hnRNPA2B1 (Rabbit polyclonal) | Abcam | Cat# ab31645; RRID:AB_732978 | ICC/PLA (1:100) |
| Antibody | Anti-RPS14 (Rabbit polyclonal) | Abcam | Cat# ab174661 | ICC (1:100) |
| Antibody | Anti-ß-Catenin (Rabbit polyclonal) | Sigma-Aldrich | Cat# C2206; RRID:AB_476831 | ICC (1:500) |
| Antibody | Anti-hnRNPH1 | Abcam | Cat# ab154894 | ICC (1:500) |
| Antibody | Anti-IgG (Rabbit) | Abcam | Cat# ab37415; RRID:AB_2631996 | PLA (1:100) IP (5 µg) |
| Antibody | Anti-IgG1 (Mouse) | R and D Systems | Cat# MAB002; RRID:AB_357344 | PLA (1:100) IP (5 µg) |
| Antibody | Anti-IgG2b (Mouse) | R and D Systems | Cat# MAB004; RRID:AB_357346 | IP (5 µg) |
| Antibody | Anti-IgG (Goat) | R and D Systems | Cat# AB-108-C; RRID:AB_354267 | IP (5 µg) |
| Antibody | Anti-Puromycin-Alexa Fluor 488 conjugate (mouse monoclonal) | Millipore | Cat# MABE343-AF488; RRID:AB_2736875 | ICC (1:200) |
| Antibody | Anti-RPL19 (mouse monoclonal) | Abcam | Cat#ab58328; RRID:AB_945305 | WB (1:1000) |
| Antibody | Anti-FxR | Gift from Dr. Edward Khandjan, University of Quebec | N/A | WB (1:1000) |
| Antibody | Anti-pERK1/2 | Cell Signaling | Cat# 9101; RRID:AB_331646 | ICC (1:250) |
| Antibody | Goat-anti-rabbit Alexa Fluor 568 | Abcam | Cat# ab150077; RRID:AB_2630356 | ICC (1:1000) |
| Antibody | Goat-anti-mouse Alexa Fluor 568 | Abcam | Cat# ab150117; RRID:AB_2688012 | ICC (1:1000) |
| Antibody | Goat-anti-mouse-HRP | Abcam | Cat# ab6789; RRID:AB_955439 | WB (1:15000) |
| Antibody | Goat-anti-rabbit-HRP | Abcam | Cat#: ab97080; RRID:AB_10679808 | WB (1:15000) |
| Commercial assay or kit | RNeasy mini kit | Qiagen | Cat# 74104 | |
| Commercial assay or kit | SuperScript III First-strand Synthesis kit | Thermo Fisher Scientific | Cat# 18080051 | |
| Commercial assay or kit | Quantitect SYBR green PCR kit | Qiagen | Cat# 204143 | |
| Commercial assay or kit | KAPA HyperPrep kit | Roche | Cat# KK8503 | |
| Commercial assay or kit | NextSeq 500/550 high output v2 kit (150 cycles) | Illumina | Cat# FC-404–2002 | |
| Commercial assay or kit | Duolink In situ PLA Detection reagents green | Sigma-Aldrich | Cat# DUO92014 | |
| Commercial assay or kit | Duolink In situ PLA Detection reagents red | Sigma-Aldrich | Cat# DUO92008 | |
| Commercial assay or kit | Duolink In situ PLA probe Anti-Rabbit PLUS | Sigma-Aldrich | Cat# DUO92002 | |
| Commercial assay or kit | Duolink In situ PLA probe Anti-Mouse MINUS | Sigma-Aldrich | Cat# DUO92004 | |
| Chemical compound, drug, reagent | Cycloheximide | Sigma Aldrich | Cat# C4859 | |
| Chemical compound, drug, reagent | RNase A | Ambion | Cat# EN0531 | |
| Chemical compound, drug, reagent | RNase T1 | Ambion | Cat# EN0541 | |
| Chemical compound, drug, reagent | Puromycin | Sigma-Aldrich | Cat# P8833 | |
| Chemical compound, drug, reagent | Recombinant mouse Netrin-1 | R and D systems | Cat# 1109-N1 | |
| Chemical compound, drug, reagent | Recombinant human Sema3A | R and D systems | Cat# 1250-S3 | |
| Chemical compound, drug, reagent | Dynasore | Sigma-Aldrich | Cat# D7693 | |
| Chemical compound, drug, reagent | SUPERase In RNAse inhibitor | Ambion | Cat# AM2696 | |
| Software, algorithm | Volocity | PerkinElmer | Version 6.0.1; RRID:SCR_002668 | |
| Software, algorithm | GraphPad Prism | GraphPad | v.5; RRID:SCR_002798 | |
| Software, algorithm | R | Other | v.3.2.2; RRID:SCR_001905 | https://www.r- project.org |
| Software, algorithm | MATLAB | Mathworks | v.R2016b; RRID:SCR_001622 | |
| Software, algorithm | HISAT2 | Other | v.2.1.0; RRID:SCR_015530 | https://ccb.jhu.edu/software/hisat2/index.shtml |
| Software, algorithm | Cufflinks | Other | v.2.2.1; RRID:SCR014597 | http://cole-trapnell-lab.github.io/cufflinks/ |
Additional files
Download links
A two-part list of links to download the article, or parts of the article, in various formats.
Downloads (link to download the article as PDF)
Open citations (links to open the citations from this article in various online reference manager services)
Cite this article (links to download the citations from this article in formats compatible with various reference manager tools)
Receptor-specific interactome as a hub for rapid cue-induced selective translation in axons
eLife 8:e48718.
https://doi.org/10.7554/eLife.48718


