Molecular mechanism of TRPV2 channel modulation by cannabidiol
- Perelman School of Medicine, University of Pennsylvania, United States
- Pfizer Research and Development, United States
- New Jersey Medical School, Rutgers University, United States
Figures
Figure 1 with 10 supplements
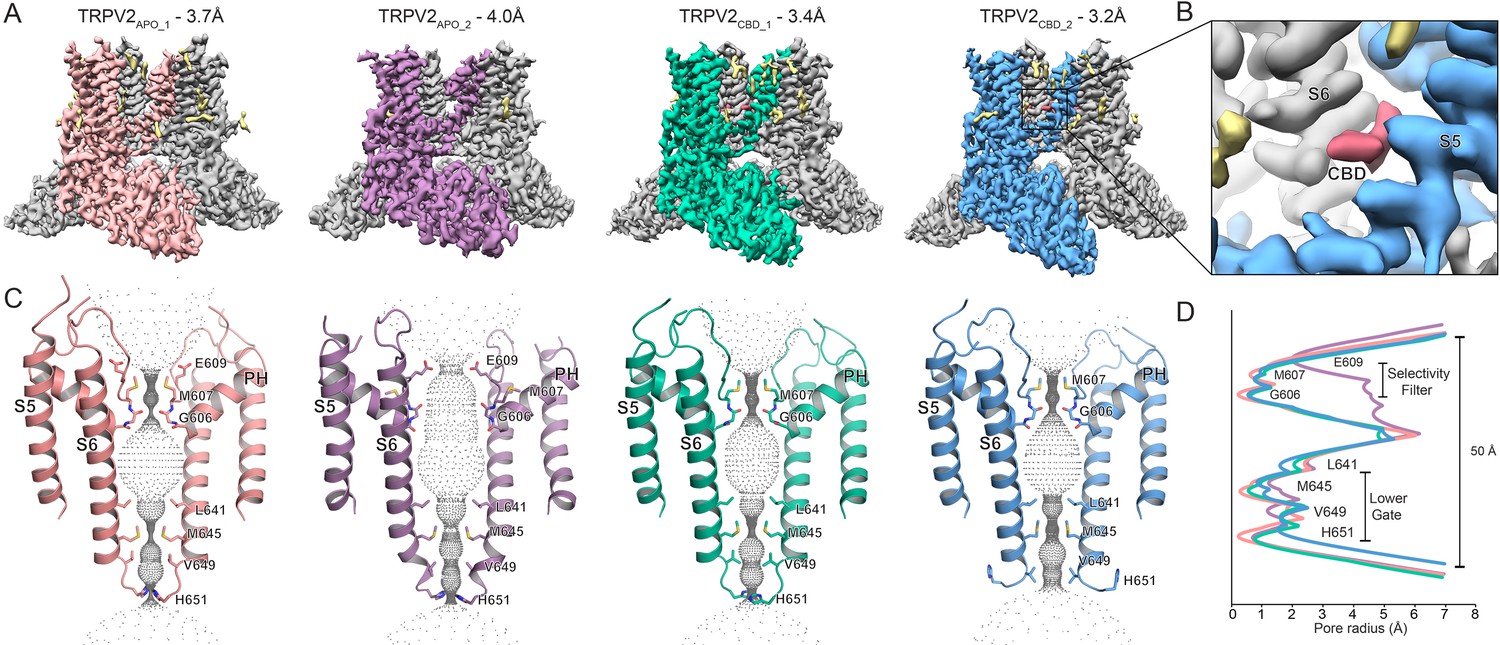
Overview of the full-length rat TRPV2 channel structures in nanodiscs.
(A) Three-dimensional cryo-EM reconstructions for TRPV2APO_1 at 3.7 Å (salmon), TRPV2APO_2 at 4.0 Å (purple), TRPV2CBD_1 at 3.4 Å (green), TRPV2CBD_2 at 3.2 Å (blue); (B) CBD binding pocket in the TRPV2CBD_2 structure. The S5 and S6 helices are shown in blue and gray, respectively. Density attributed to CBD is shown in pink. (C) The profile of the ion permeation pathway for TRPV2APO_1 (salmon), TRPV2APO_2 (purple), TRPV2CBD_1 (green) and TRPV2CBD_2 (blue) structures; (D) Graphical representation of the radius of the pore as a function of the distance along the ion conduction pathway.
Figure 1—figure supplement 1
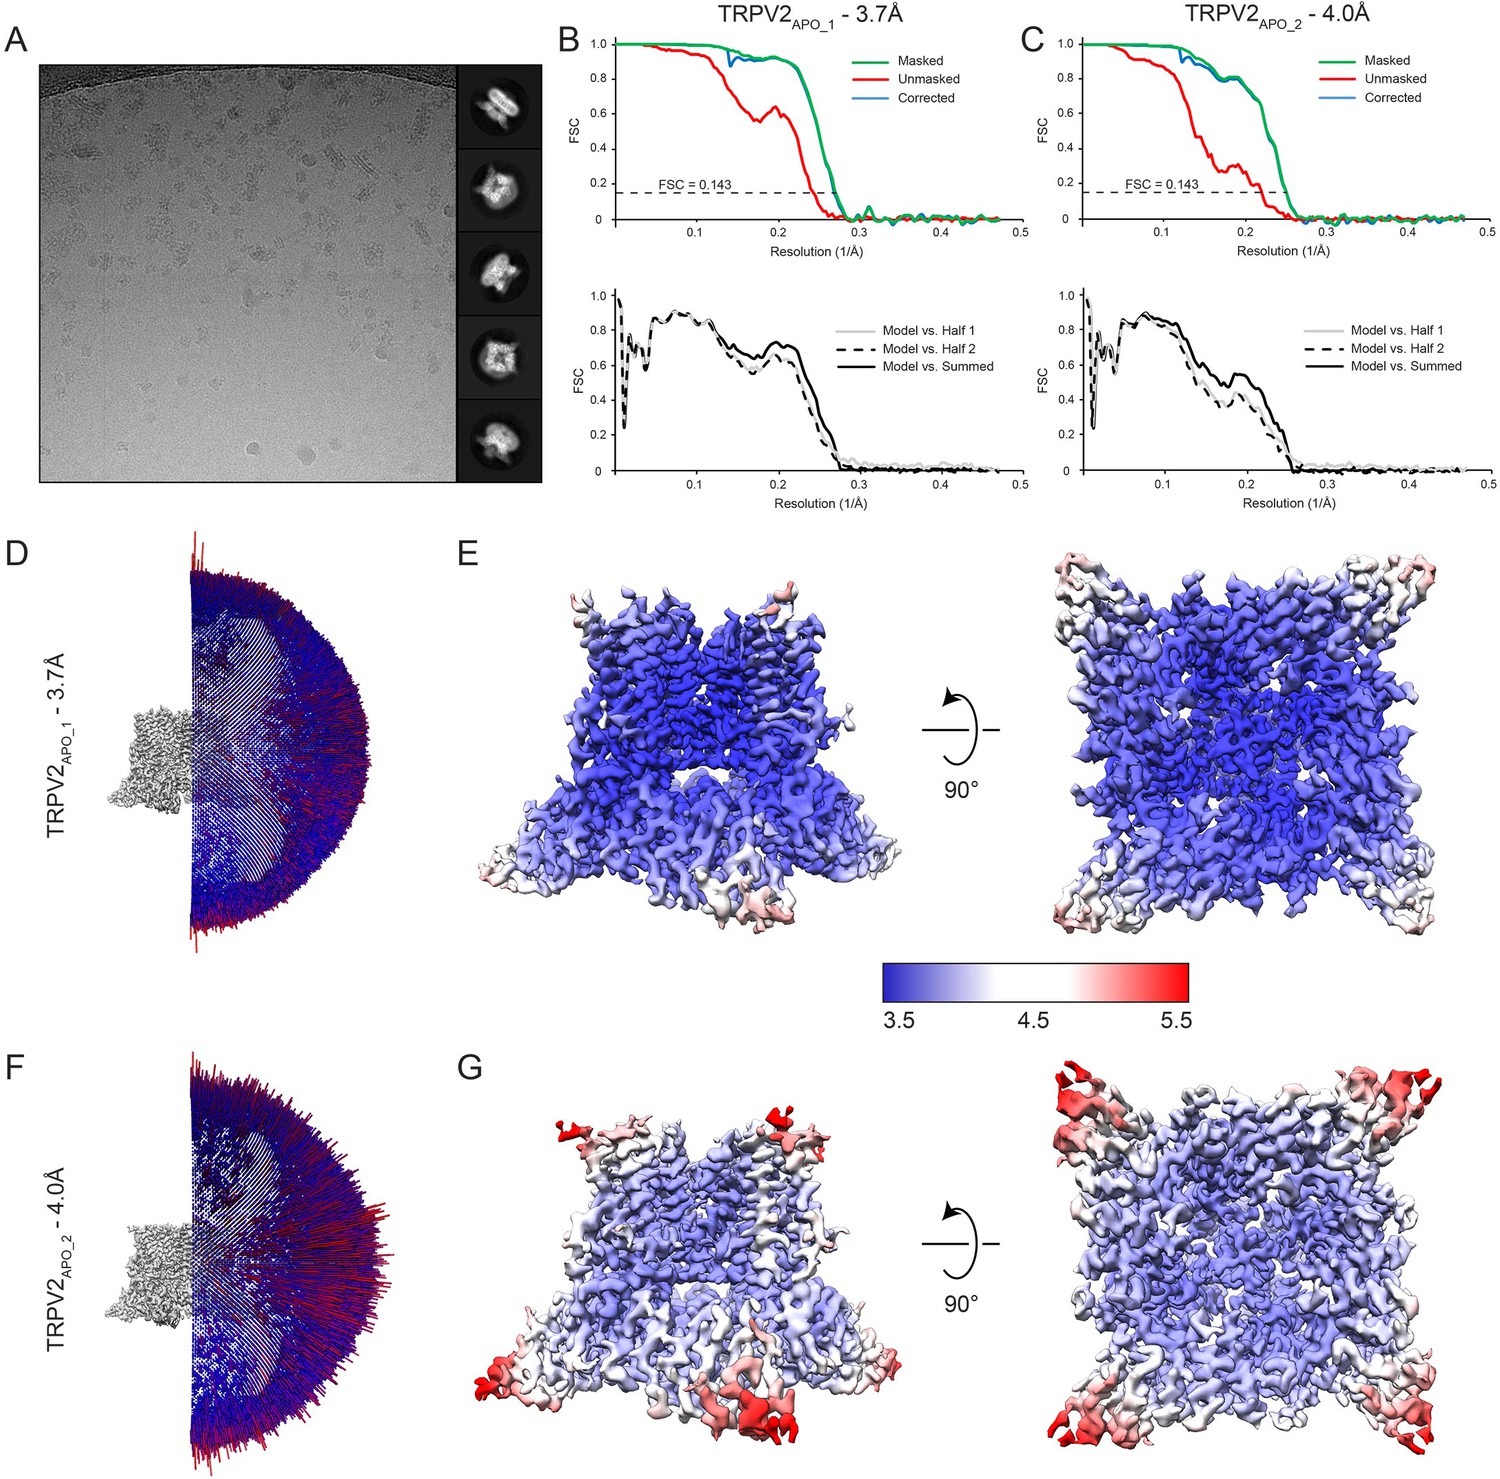
EM summary of apo full-length rat TRPV2 in nanodiscs.
(A) Representative micrograph and 2D classes of cryo-EM data. Map FSC curves and model validation curves for (B) TRPV2APO_1 and (C) TRPV2APO_2. Angular distribution for the final 3D reconstruction of (D) TRPV2APO_1 and (F) TRPV2APO_2. Tall red cylinders indicate a large number of particles aligned at a position and short blue cylinders indicate fewer particles. (D) Side and bottom views of (E) TRPV2APO_1 and (G) TRPV2APO_2 colored based on local resolution as calculated via RELION. Blue, white and red regions indicate resolutions of 3.5 Å, 4.5 Å and 5.5 Å, respectively.
Figure 1—figure supplement 2
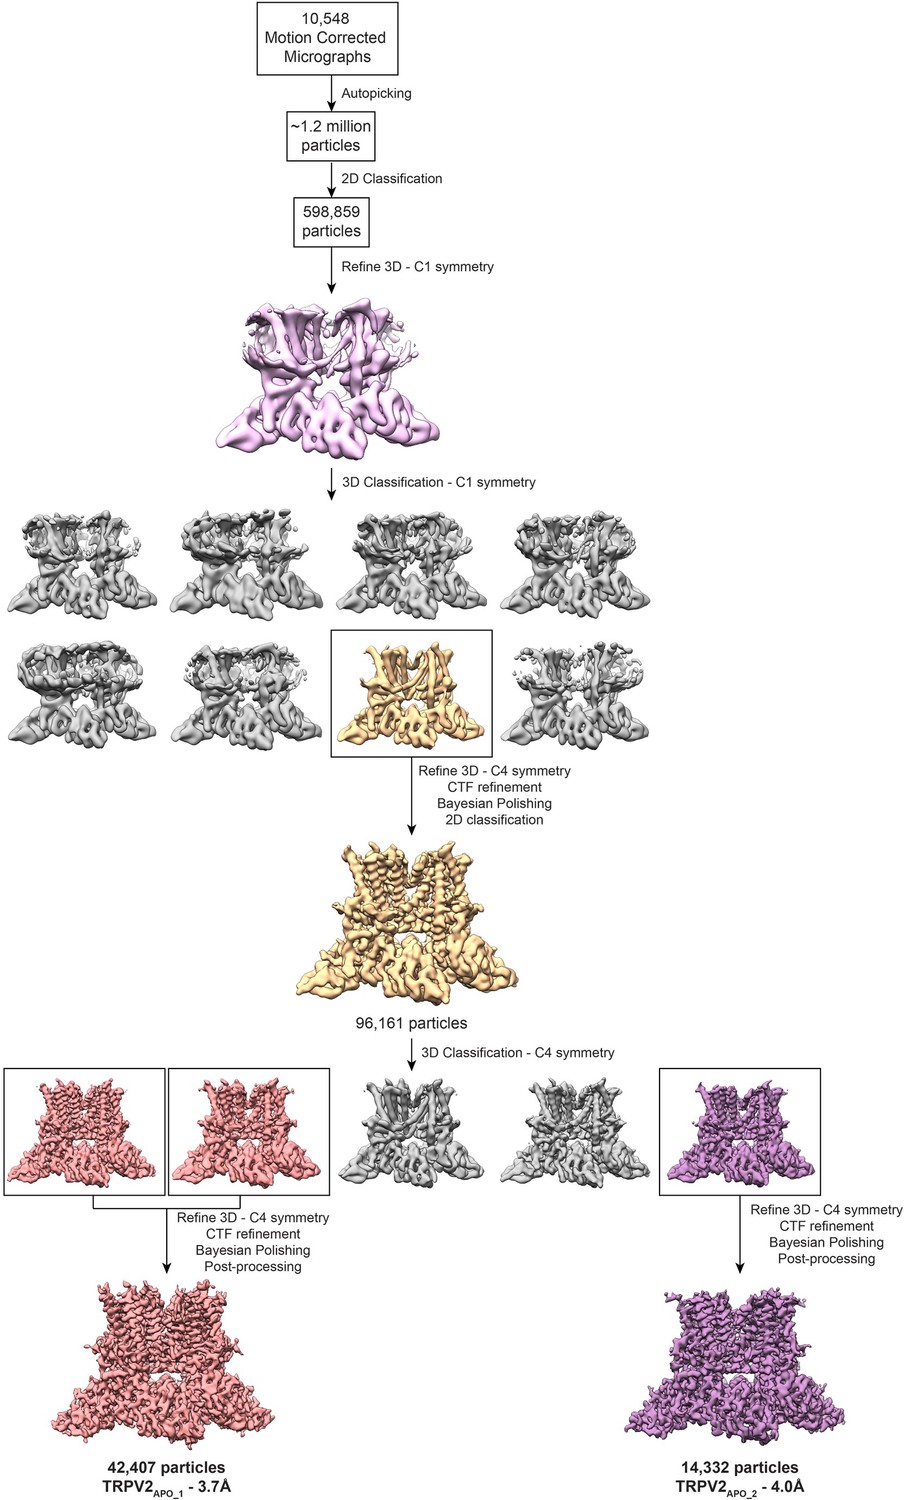
Apo TRPV2 cryo-EM data processing.
Workflow for 3D reconstruction resulting in two distinct apo TRPV2 structures.
Figure 1—figure supplement 3
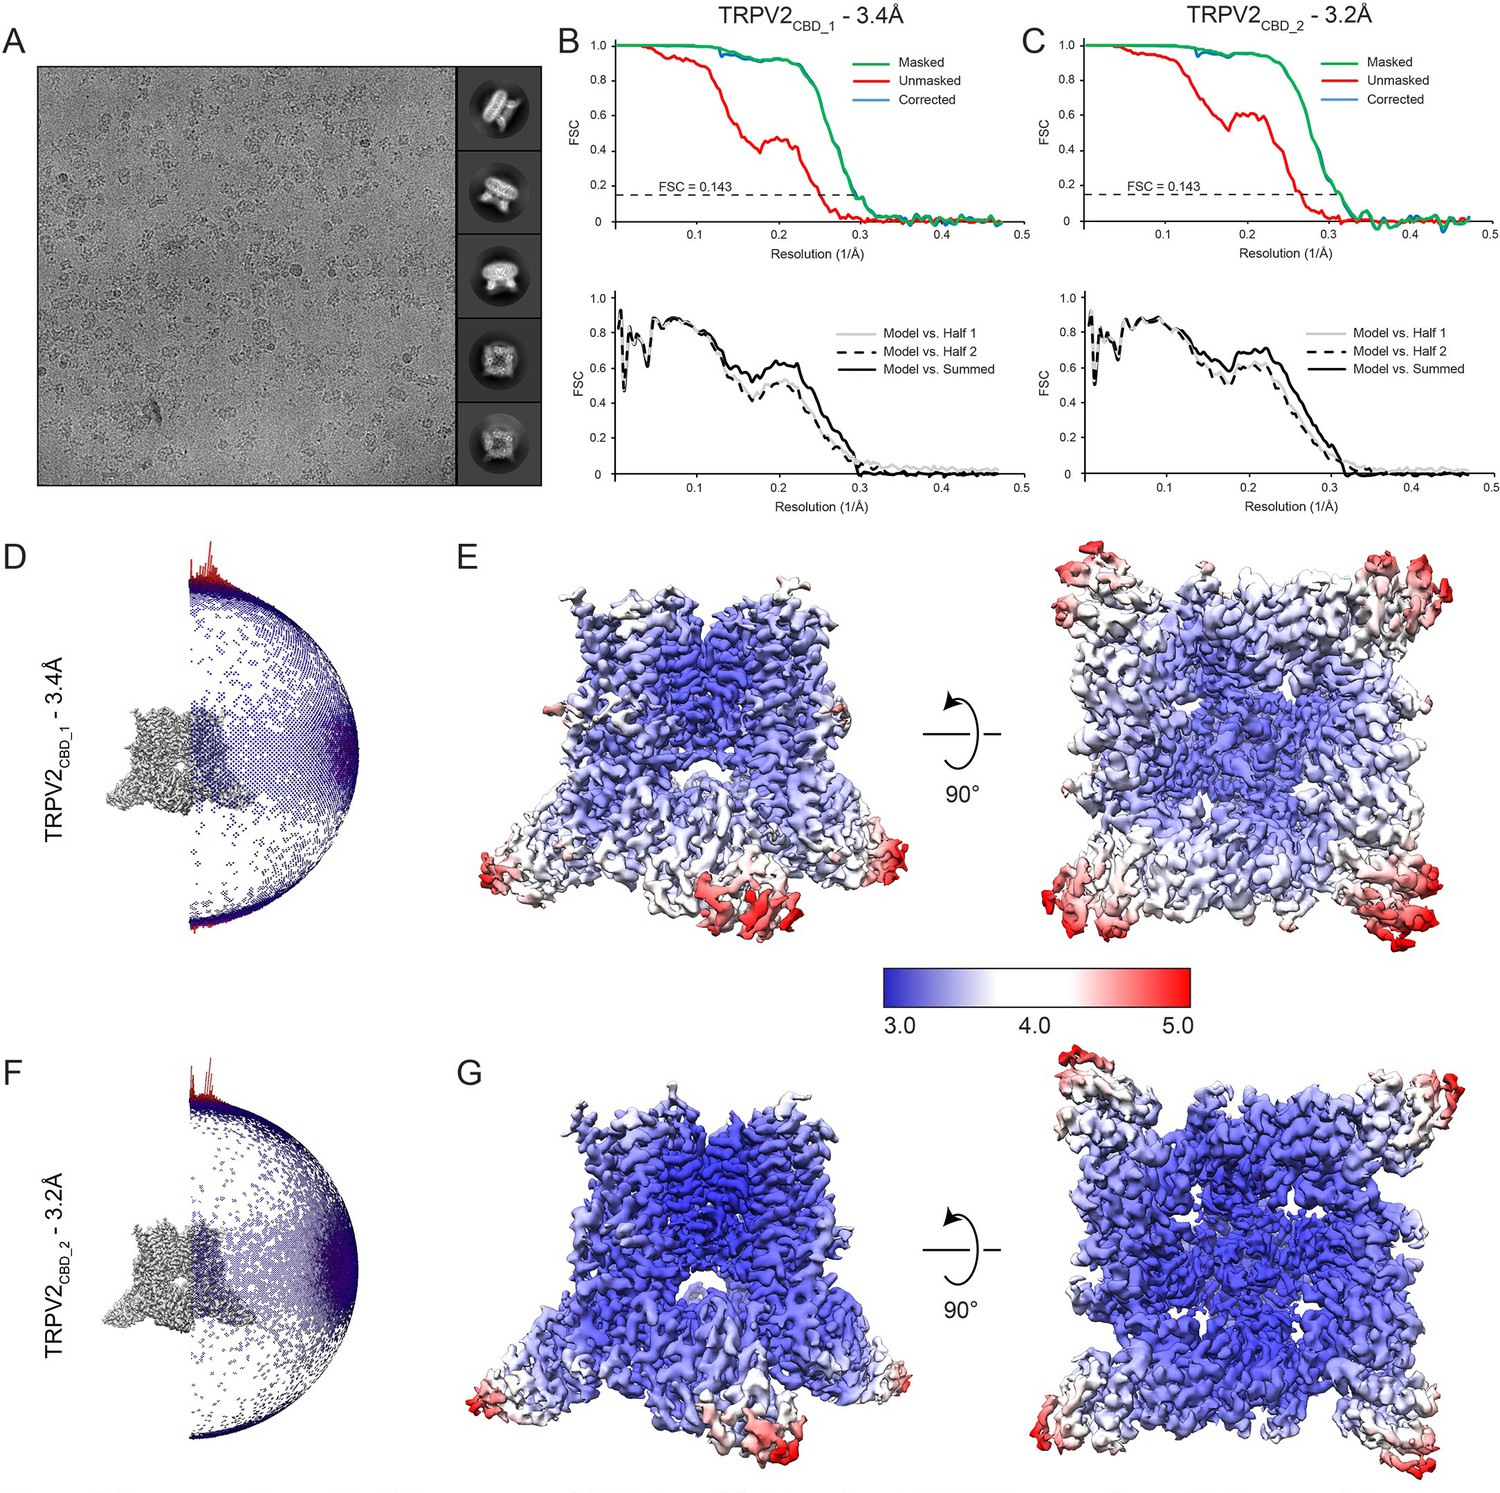
EM summary of CBD-bound full-length rat TRPV2 in nanodiscs.
(A) Representative micrograph and 2D classes of cryo-EM data. Map FSC curves and model validation curves for (B) TRPV2CBD_1 and (C) TRPV2CBD_2. Angular distribution for the final 3D reconstruction of (D) TRPV2CBD_1 and (F) TRPV2CBD_2. Tall red cylinders indicate a large number of particles aligned at a position and short blue cylinders indicate fewer particles. (D) Side and bottom views of (E) TRPV2CBD_1 and (G) TRPV2CBD_2 colored based on local resolution as calculated via RELION. Blue, white and red regions indicate resolutions of 3.0 Å, 4.0 Å and 5.0 Å, respectively.
Figure 1—figure supplement 4

CBD-bound TRPV2 cryo-EM data processing.
Workflow for 3D reconstruction resulting in two distinct CBD-bound TRPV2 structures.
Figure 1—figure supplement 5
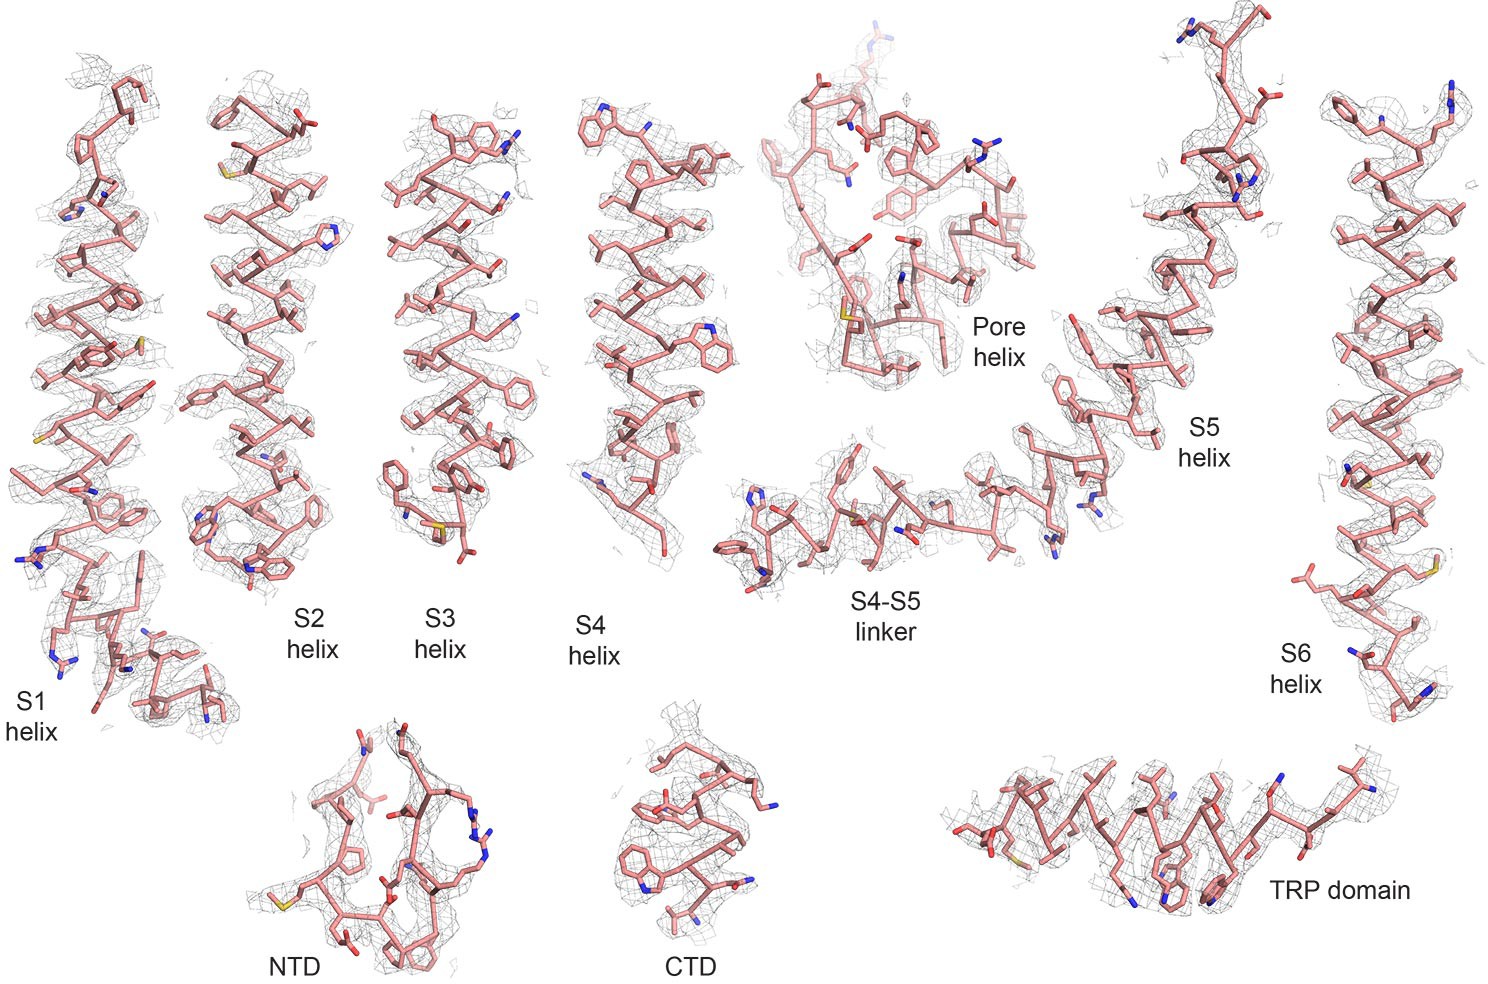
Representative densities from the TRPV2APO_1 cryo-EM map.
Densities are contoured at σ = 5.
Figure 1—figure supplement 6

Representative densities from the TRPV2APO_2 cryo-EM map.
Densities are contoured at σ = 5.
Figure 1—figure supplement 7

Representative densities from the TRPV2CBD_1 cryo-EM map.
Densities are contoured at σ = 5.
Figure 1—figure supplement 8
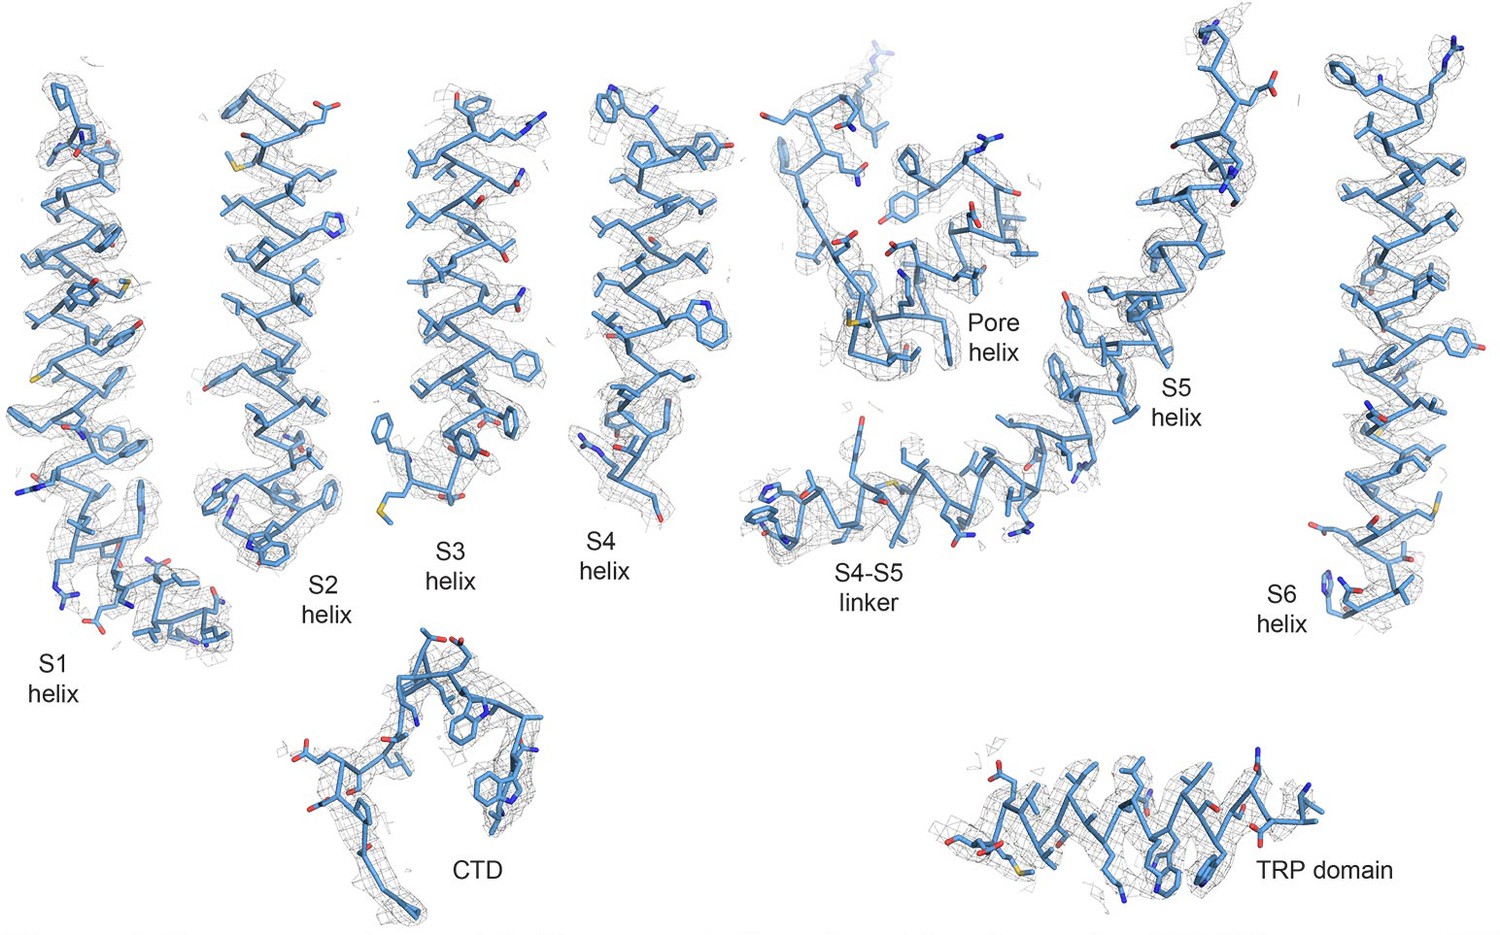
Representative densities from the TRPV2CBD_2 cryo-EM map.
Densities are contoured at σ = 5.
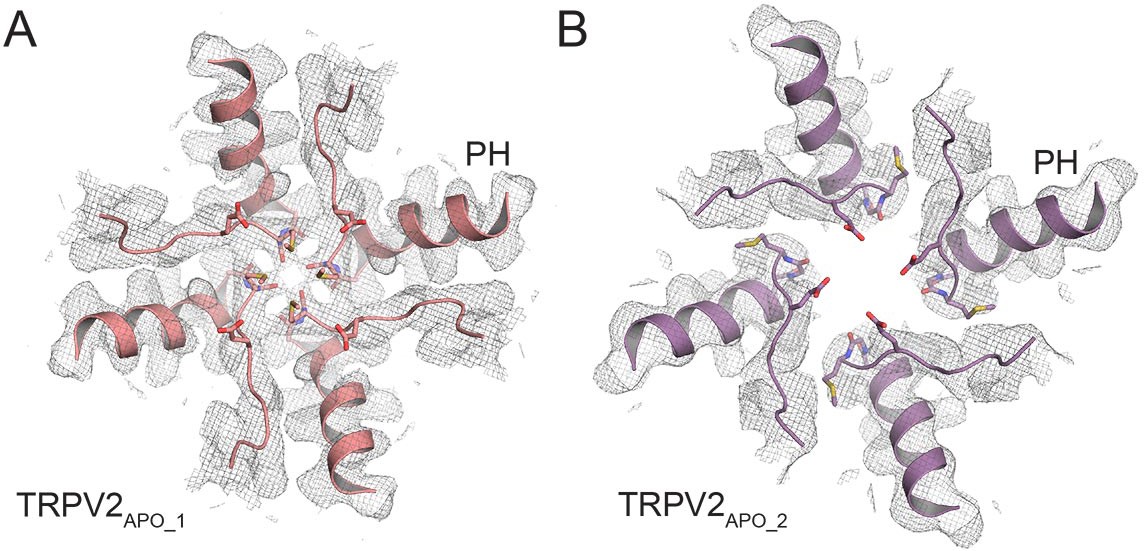
Figure 1—figure supplement 9
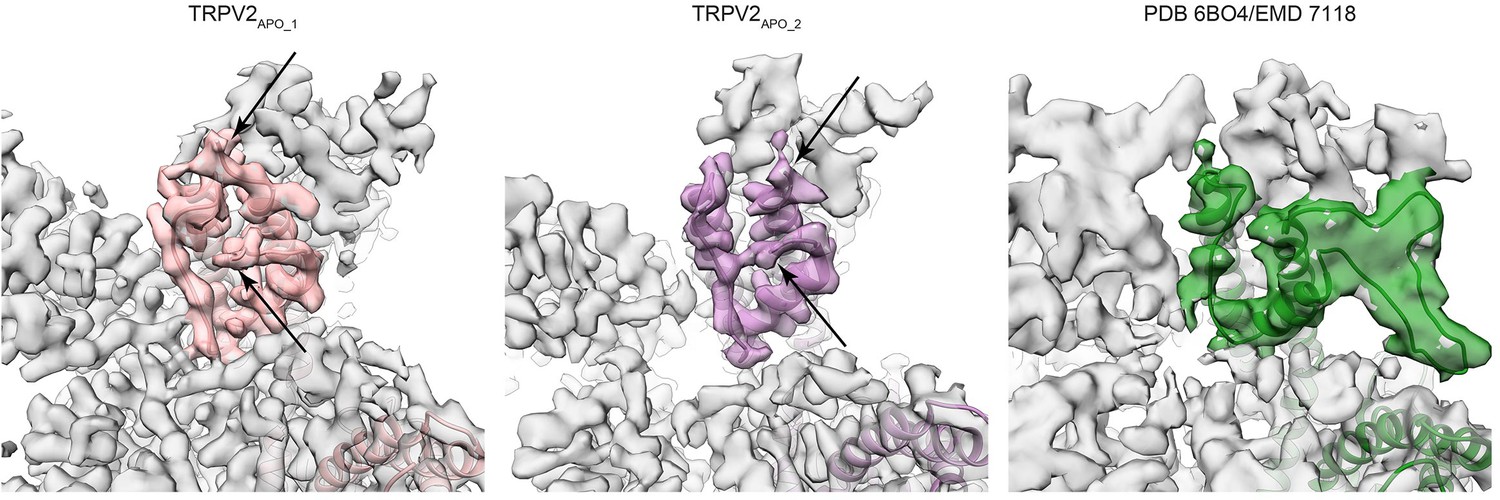
Apo full-length rat TRPV2 pore turret comparison.
Comparison of cryo-EM density maps of TRPV2APO_1 (left, salmon), TRPV2APO_2 (middle, purple) and full-length rat TRPV2 in detergent (EMD 7118; right, green) in the pore turret region. The density surrounding the pore helix and the top of S5 is colored to standout from the rest of the density. A cartoon model of a single monomer is shown in each map. Arrows indicate the final residues visible on each end of the pore turret.
Figure 1—figure supplement 10
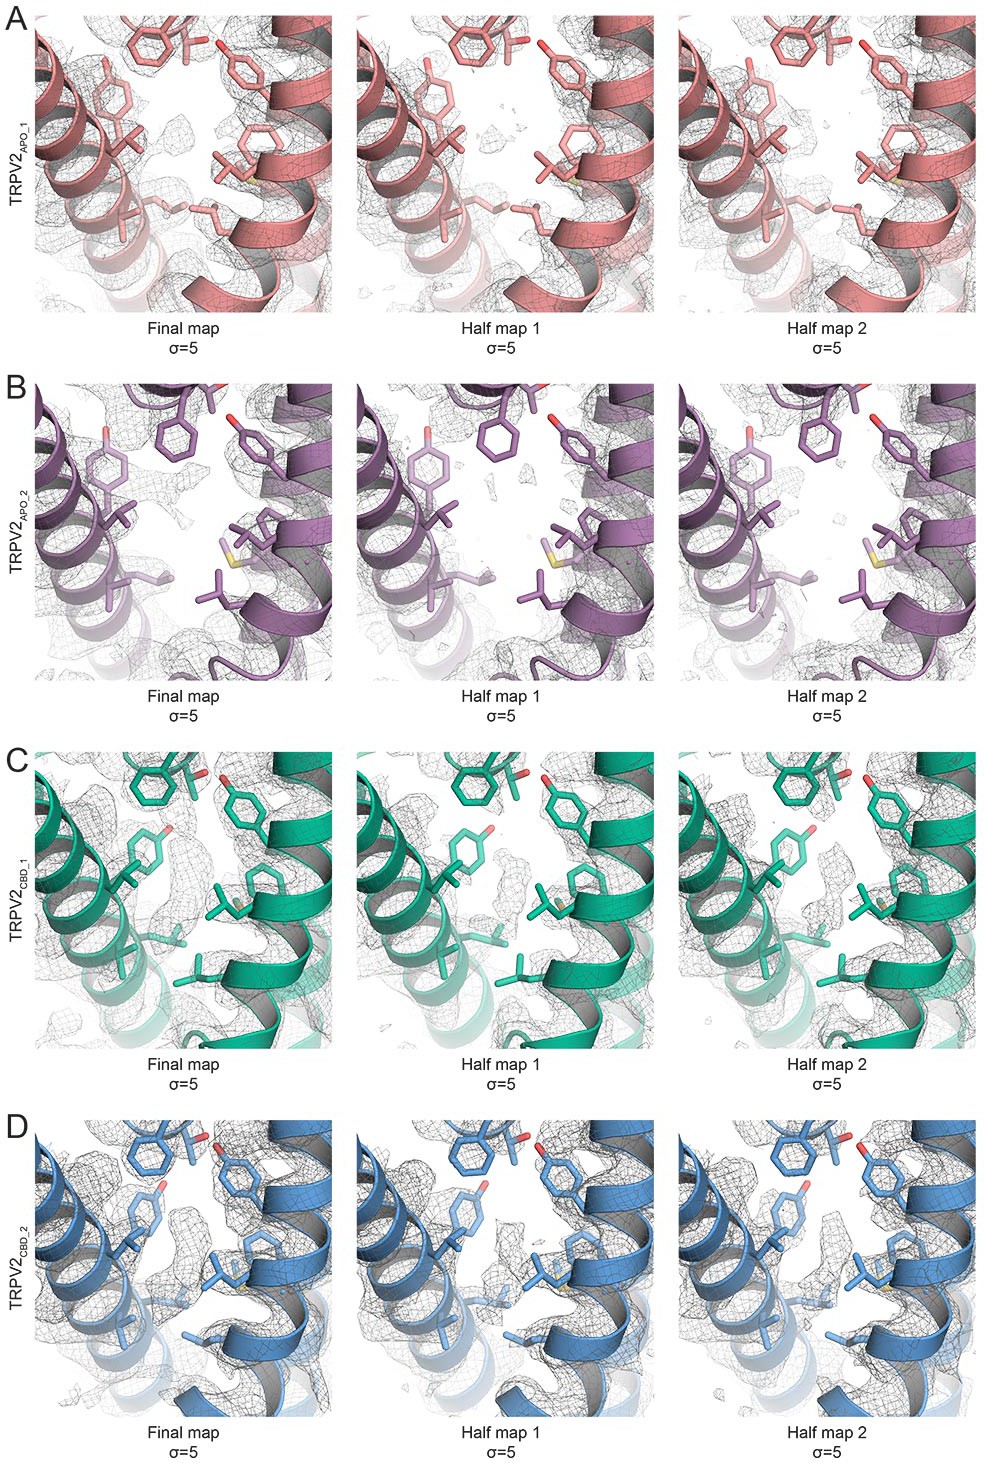
Cryo-EM density in the CBD binding pocket.
TRPV2 models overlaid with the final postprocessed map and the two corresponding half maps for (A) TRPV2APO_1, (B) TRPV2APO_2, (C) TRPV2CBD_1, and (D) TRPV2CBD_2. Cryo-EM densities are contoured at σ = 5 and are shown as gray mesh. Side chains of interest are shown as sticks. Bound CBD is not shown.
Figure 2 with 4 supplements
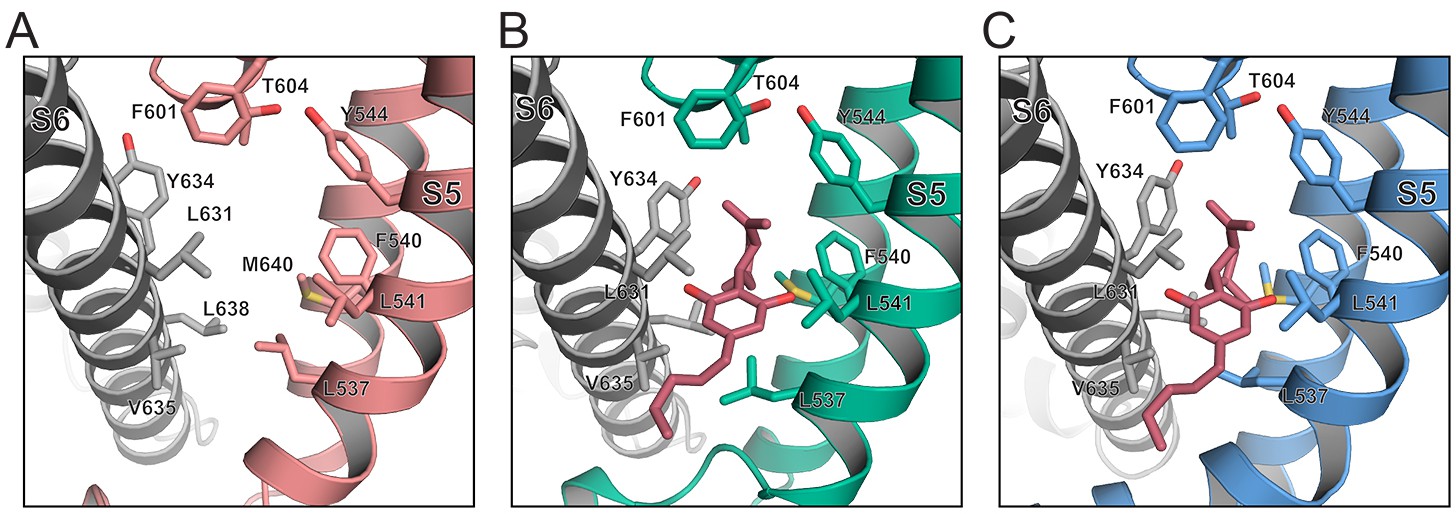
The CBD binding site.
Model representations of the CBD binding pockets in the (A) TRPV2APO_1 (salmon), (B) TRPV2CBD_1 (green) and (C) TRPV2CBD_2 (blue) structures. CBD is shown as pink sticks. Residues of interest are labeled and represented as sticks.
Figure 2—figure supplement 1
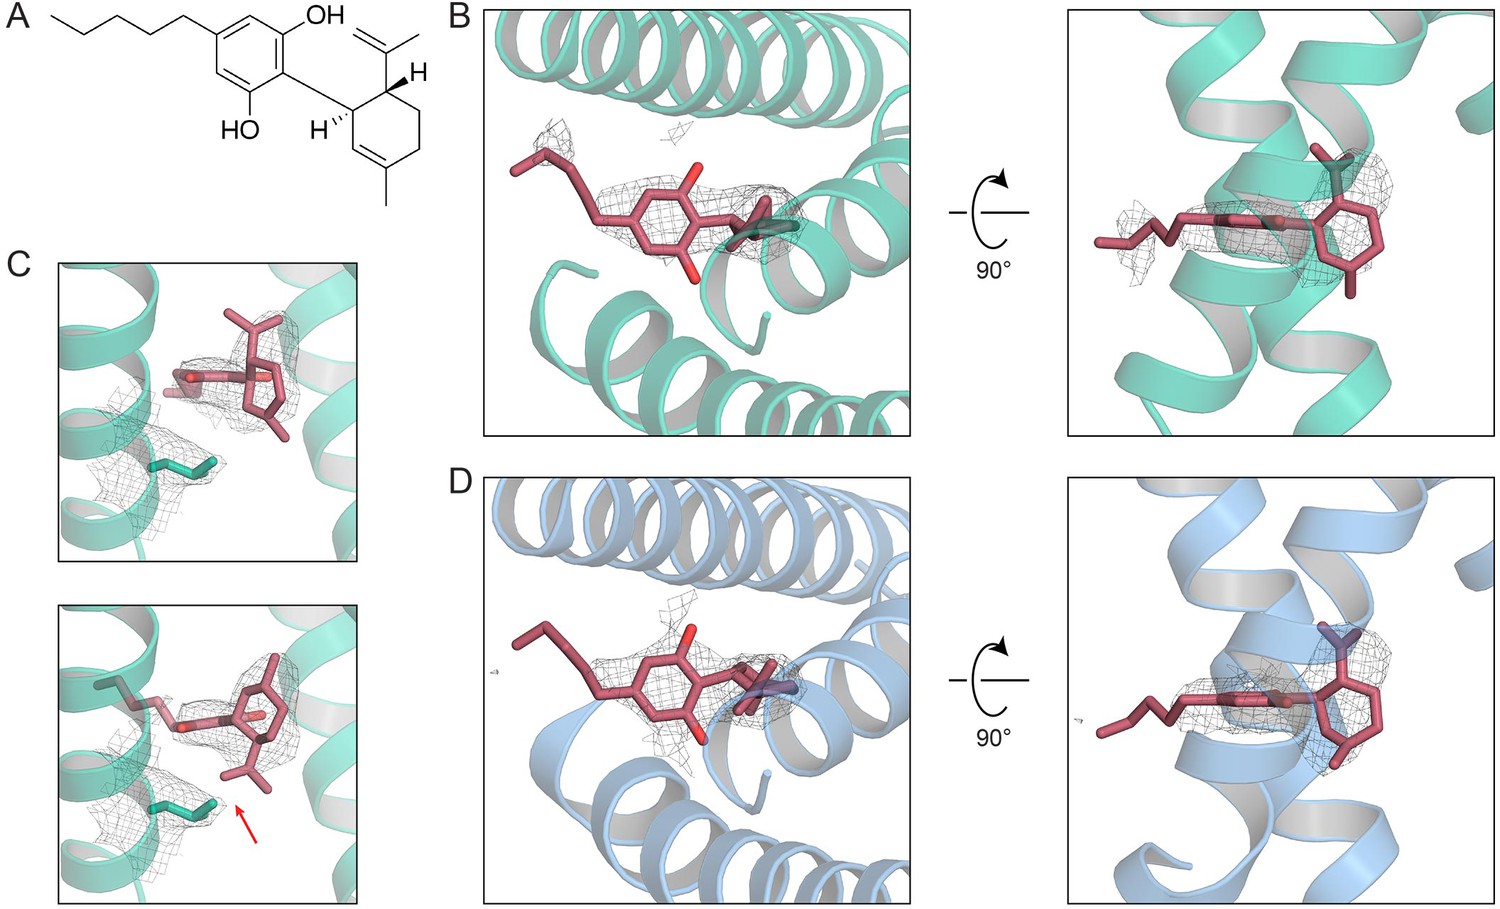
CBD fit in the cryo-EM map.
(A) Chemical diagram of cannabidiol (CBD). (B) Fit of CBD into the TRPV2CBD_1 map. (C) Comparison of two poses of CBD in the TRPV2CBD_1 map. The residue shown in sticks is Leu537. The red arrow indicates a clash. (D) Fit of CBD into the TRPV2CBD_2 map.
Figure 2—figure supplement 2
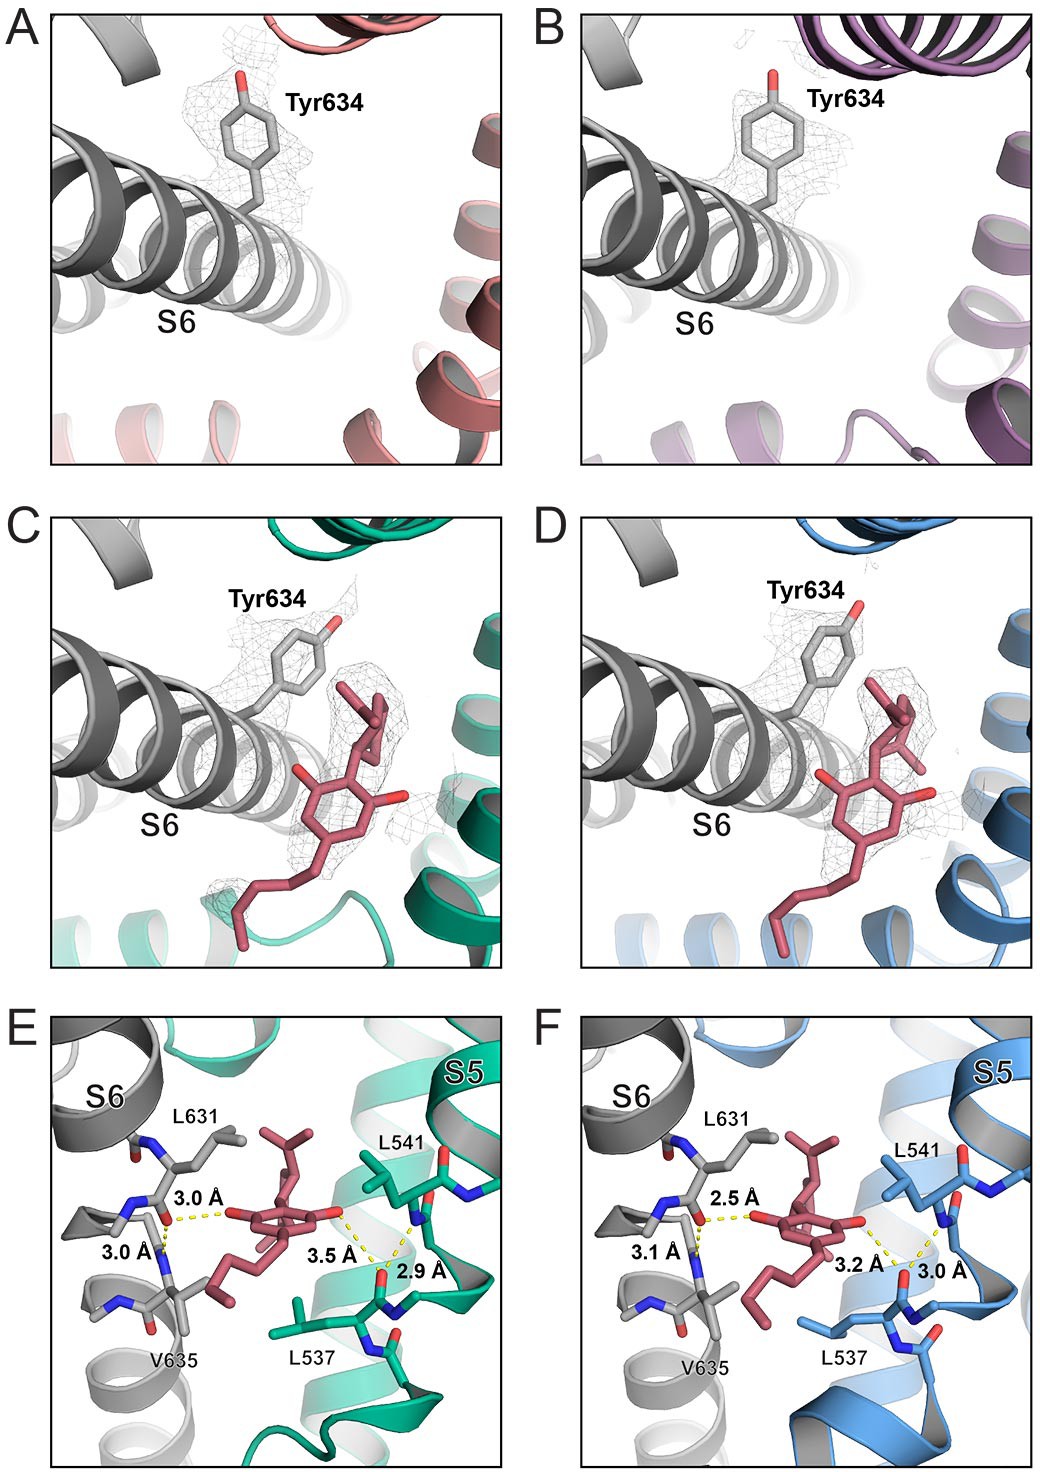
Hydrogen binding between CBD and the helical backbone.
The CBD binding pocket of (A) TRPV2CBD_1 (green) and (B) TRPV2CBD_2 (blue) represented as cartoons and sticks. Dashed yellow lines indicate measured distances and residues of interest are labeled.
Figure 2—figure supplement 3
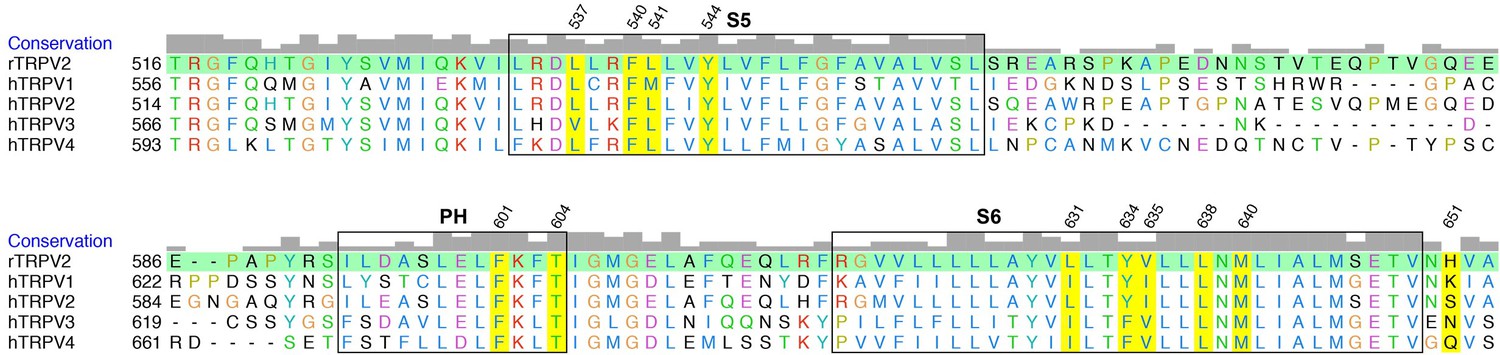
Sequence alignment of thermoTRPV channels.
Alignment of human thermo TRPV channels and rat TRPV2 (highlighted in green). Residues are colored using the Clustal X coloration scheme. Residues of interest in this study are highlighted in yellow.
Figure 2—figure supplement 4
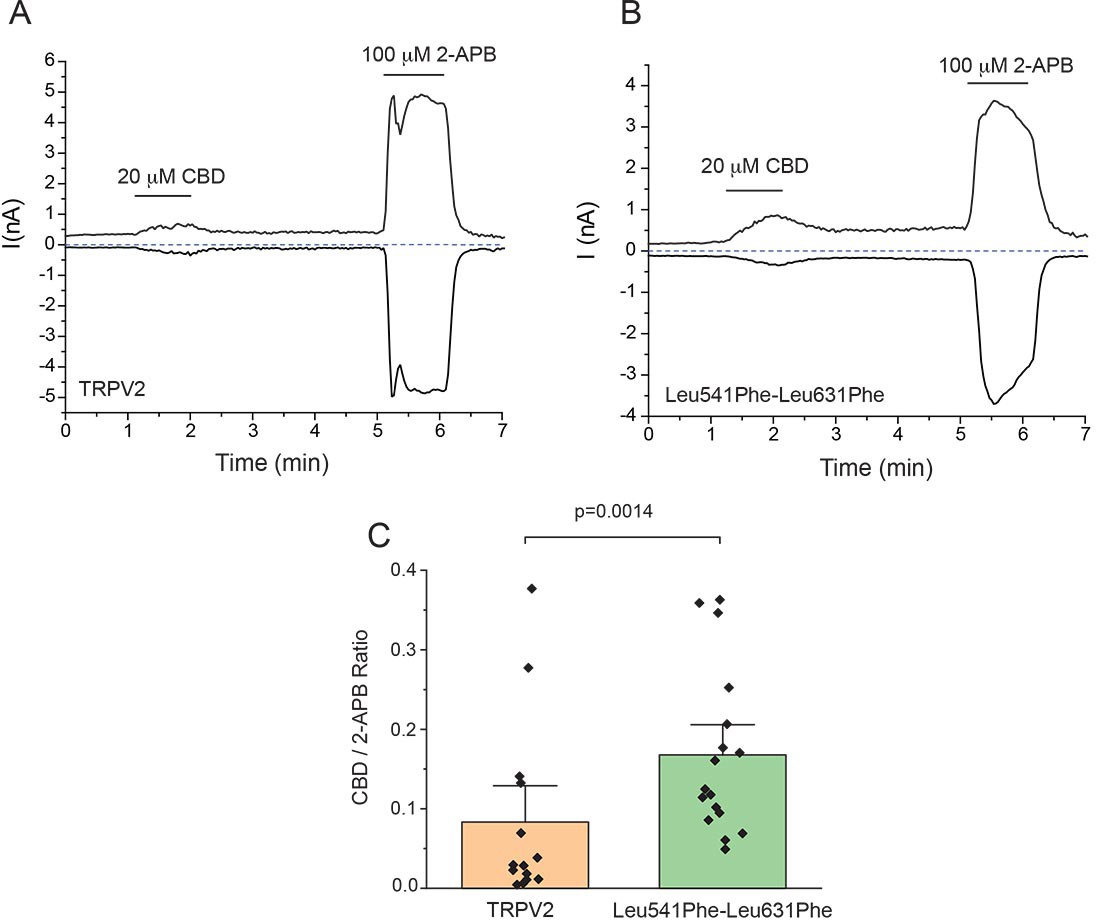
The double mutant L541F-L631F increases current responses to CBD.
Whole cell patch clamp experiments in HEK293T cells were performed as described in the Materials and methods section. Representative current traces in response to 20 μM CBD and 100 μM 2-APB at 100 mV (upward deflections) and at −100 mV (downward deflections) in cells transfected with (A) wild type TRPV2 and with (B) Leu541Phe-Leu631Phe mutant. (C) Summary of the ratio of currents induced by CBD and 2-APB. Statistical significance was determined by the non-parametric Kolmogorov Smirnov test.
Figure 3 with 3 supplements
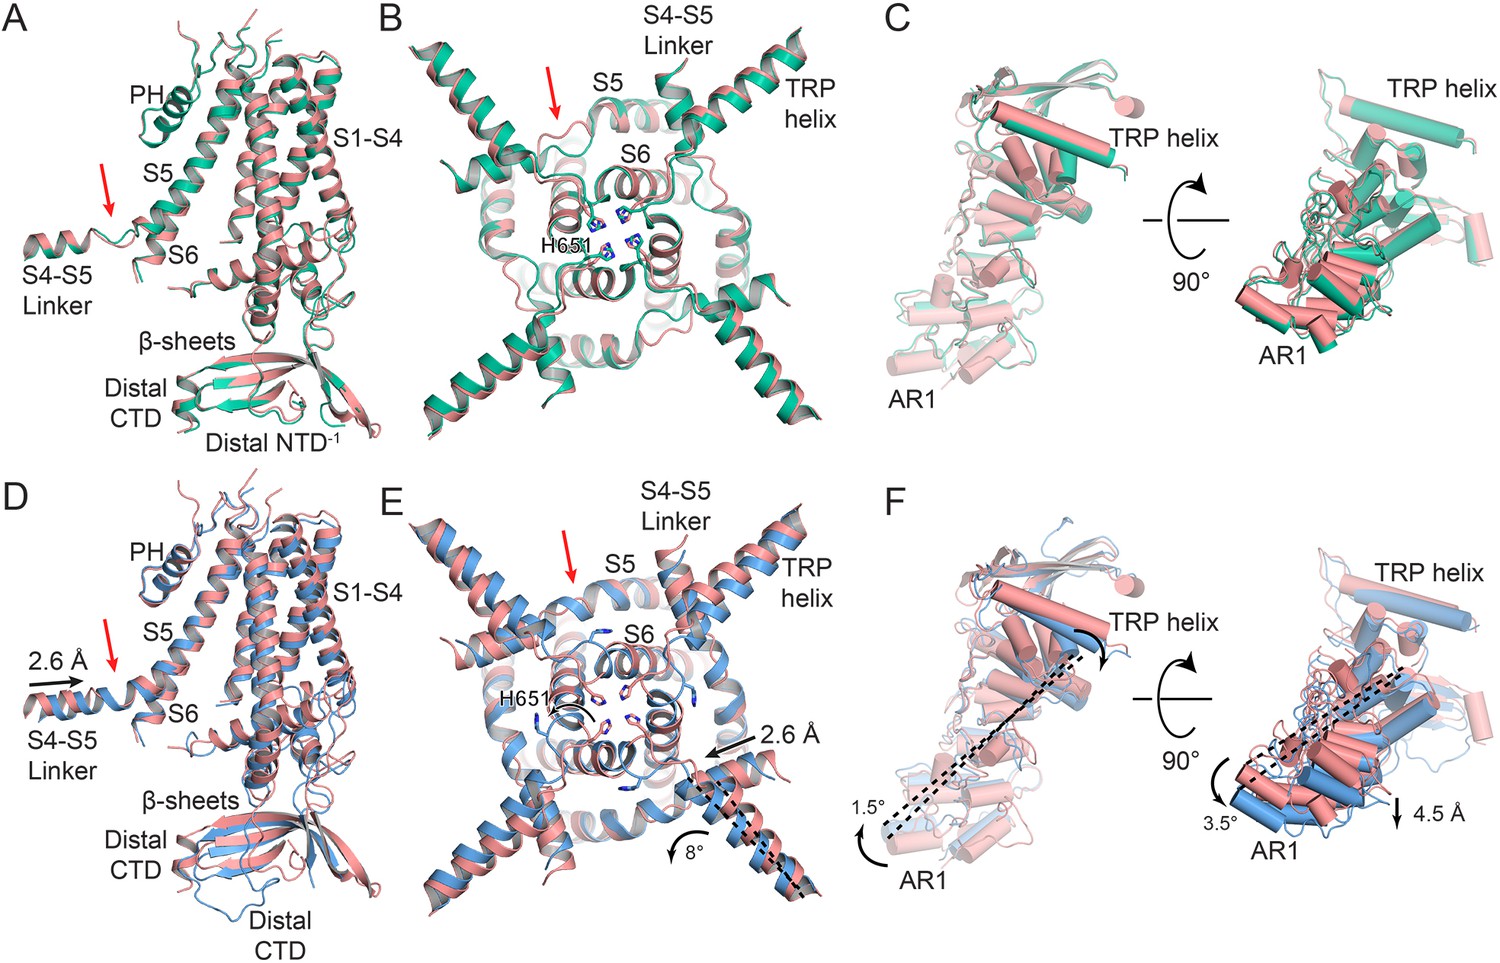
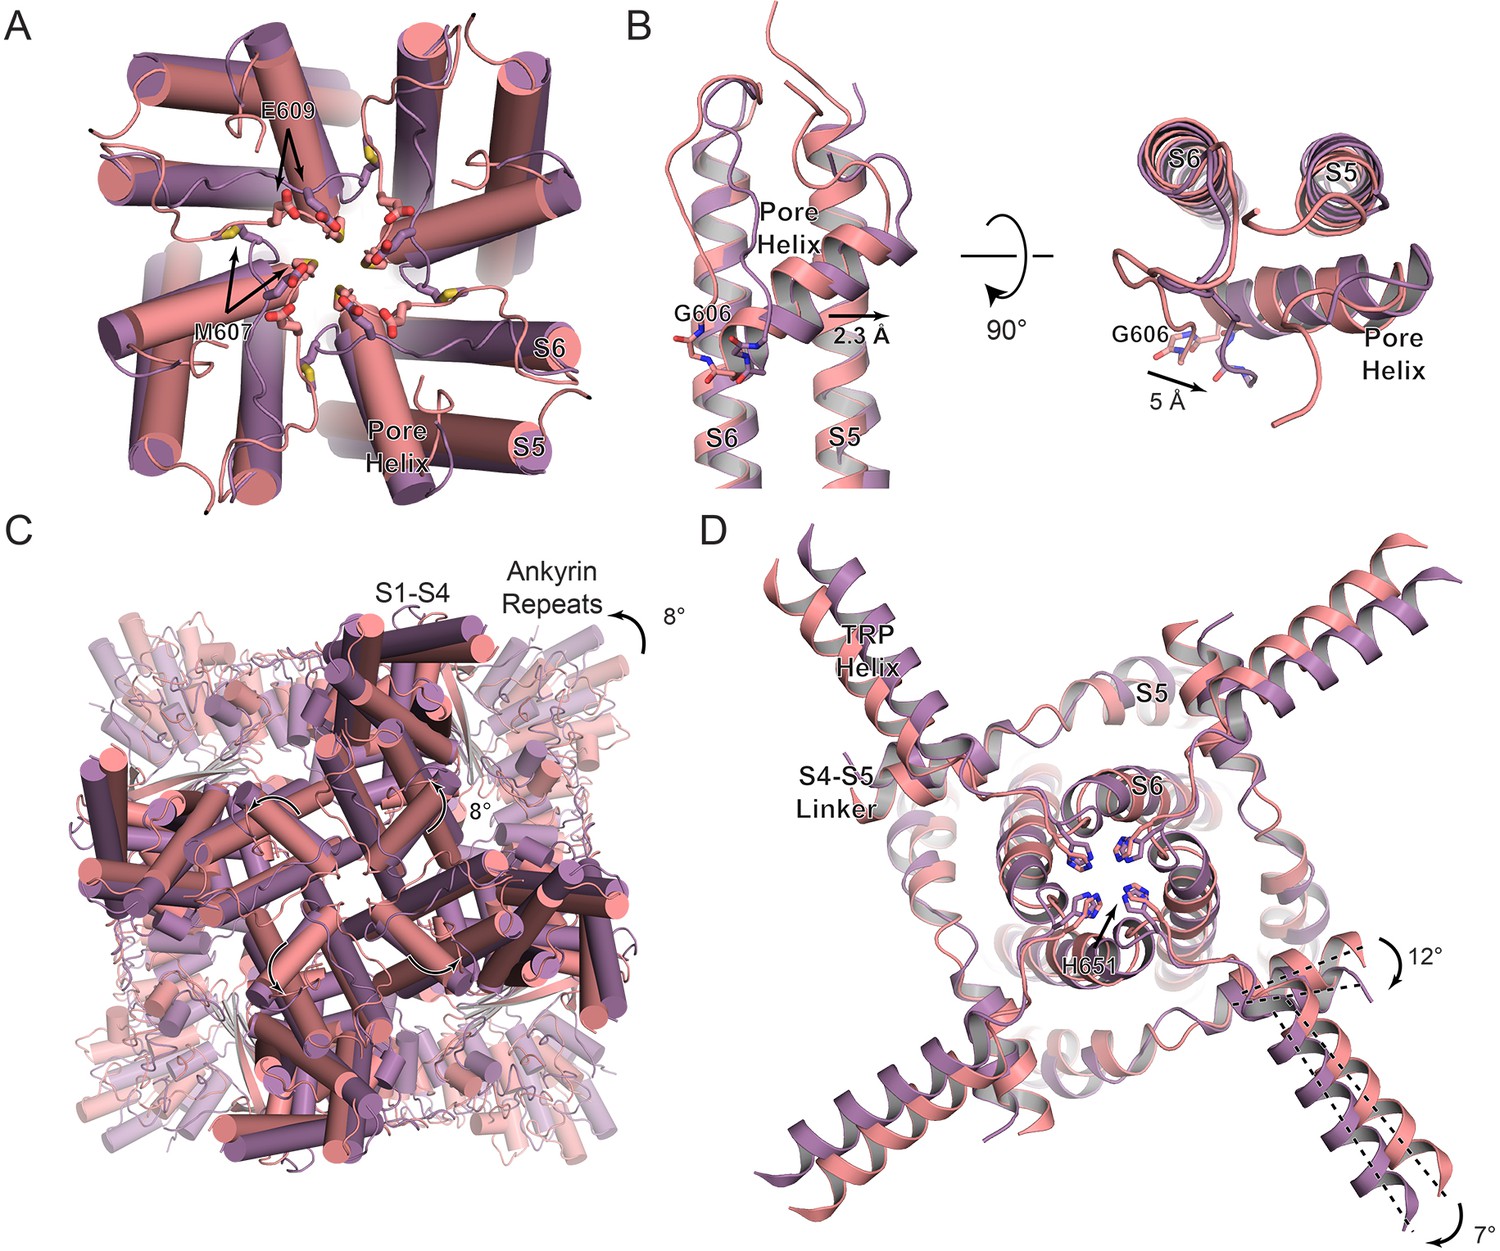
Conformational changes upon CBD binding.
(A) Overlay of the TRPV2APO_1 (salmon) and TRPV2CBD_1 (green) structures, aligned to the tetrameric pore (S5–PH–S6). (B) Zoom view from the intracellular side of the membrane on the overlay between TRPV2APO_1 (salmon) and TRPV2CBD_1 (green) structures. (C) Overlay of one ARD from the TRPV2APO_1 (salmon) and TRPV2CBD_1 (green) structures with helices displayed as cylinders. (D) Overlay of the TRPV2APO_1 (salmon) and TRPV2CBD_2 (blue) structures, aligned to the tetrameric pore (S5–PH–S6). (E) Zoom view from the intracellular side of the membrane on the overlay between TRPV2APO_1 (salmon) and TRPV2CBD_2 (blue) structures. (F) Overlay of one ARD in the TRPV2APO_1 (salmon) and TRPV2CBD_2 (blue) structures with helices displayed as cylinders. Residues of interest are represented as sticks and labeled. Red arrows indicate the junction between the S4-S5 linker and S5. Dashed black lines are references to indicate rotation. The measurements for rotation and lateral shifts are labeled and indicated with black arrows.
Figure 3—figure supplement 1
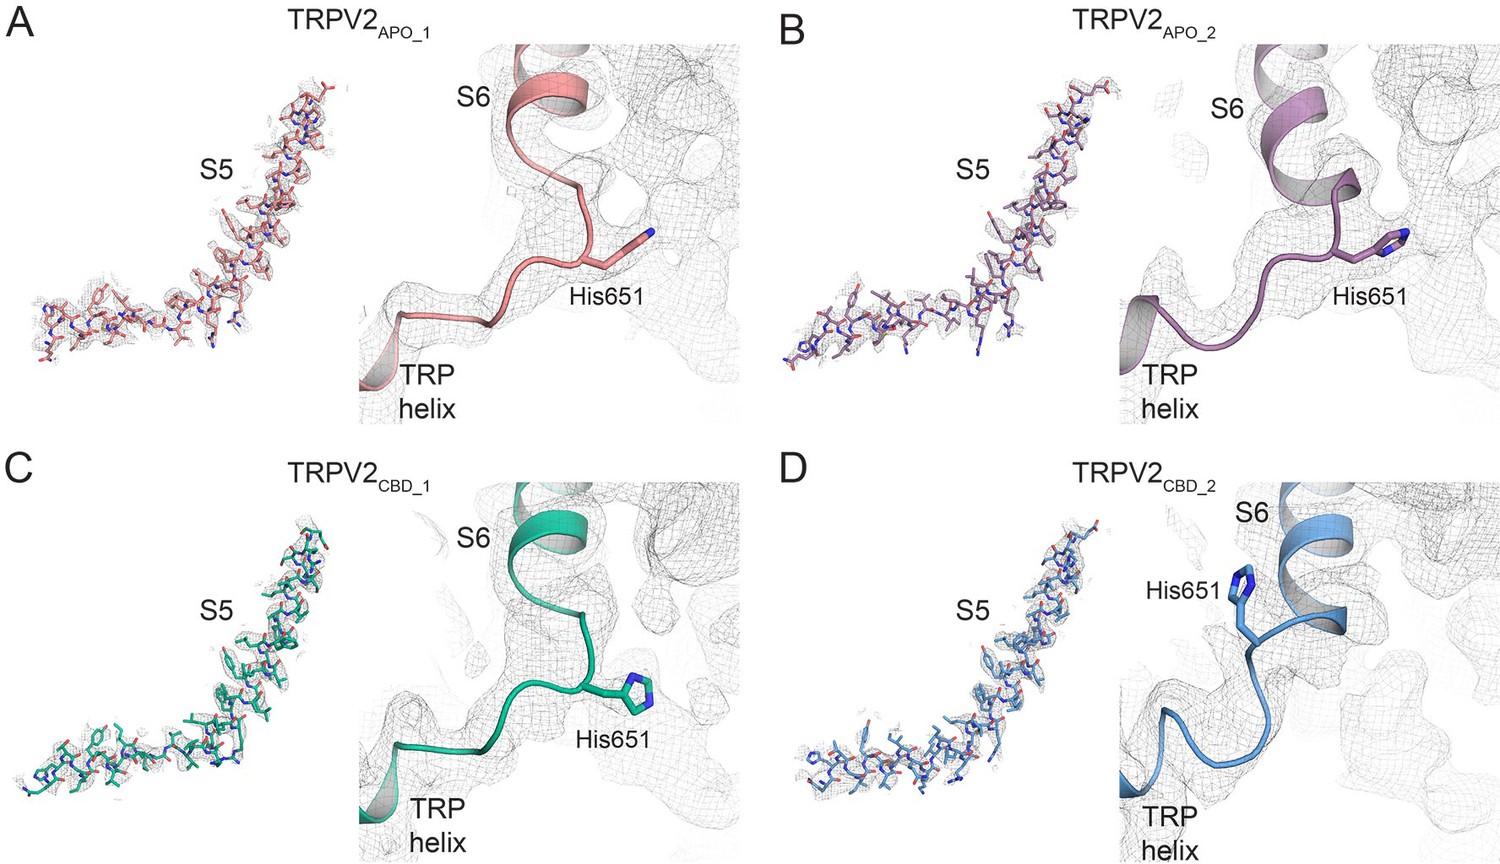
Cryo-EM map density around the S4-S5 linker, S5, and the TRP helices.
Density for (A) TRPV2APO_1 (salmon), (B) TRPV2APO_2 (purple), (C) TRPV2CBD_1 (green), and (D) TRPV2CBD_2 (blue) is contoured to σ = 5. The view of the S4-S5 linker and S5 is from a single monomer. The TRP helix tetramer is viewed from the intracellular side of the membrane.
Figure 3—figure supplement 2
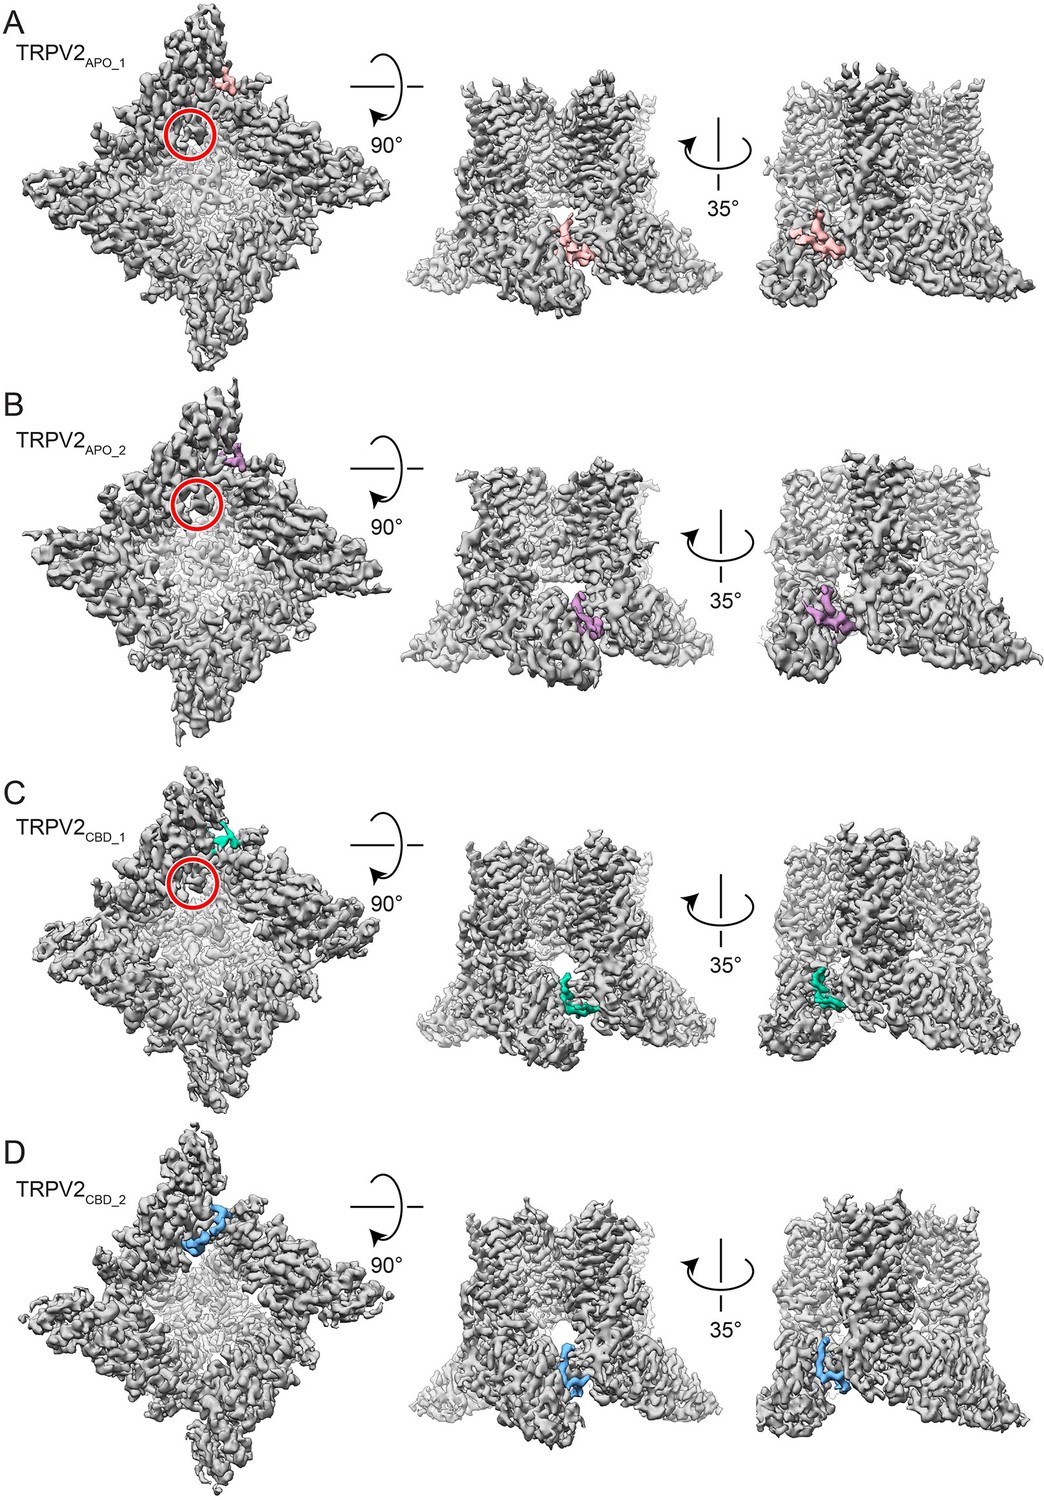
Cryo-EM maps highlighting the CTD and NTD.
Cryo-EM maps showing the overall channel in gray with the NTD and CTD highlighted. (A) Cryo-EM map of TRPV2APO_1 with density for the NTD colored salmon. (B) Cryo-EM map of TRPV2APO_2 with density for the NTD colored purple. (C) Cryo-EM map of TRPV2CBD_1 with density for the NTD colored green. (D) Cryo-EM map of TRPV2CBD_2 with density for the CTD colored blue. A red circle indicates the end of the CTD in TRPV2APO_1, TRPV2APO_2, and TRPV2CBD_1.
Figure 3—figure supplement 3
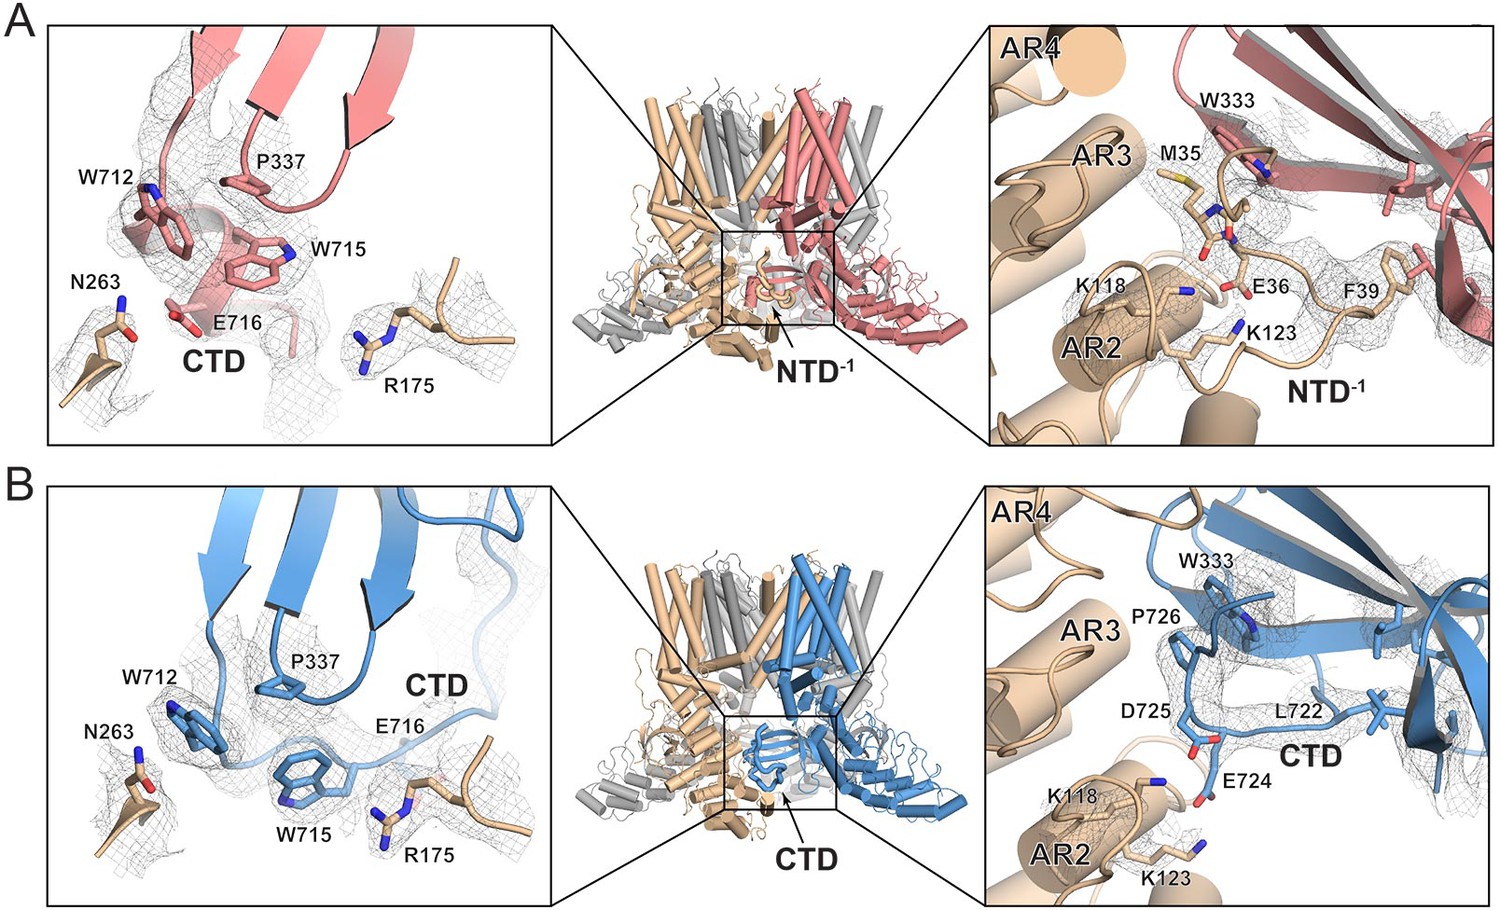
Cryo-EM map density around the CTD and NTD of TRPV2APO_1 and TRPV2CBD_2.
Model representation of the distal CTDs of (A) left panel) TRPV2APO_1 (salmon) and (B) left panel) TRPV2CBD_2 (blue). This view is of the back of the region indicated by the black square on the overall models (A–B) center panels). Model representation of the distal NTD of (A) right panel) TRPV2APO_1 (salmon) and the distal CTD of (B) right panel) TRPV2CBD_2 (blue). This view is of the front of the region indicated by the black square on the overall models (A–B) center panels). Chain A of each model is colored salmon (TRPV2APO_1) or blue (TRPV2CBD_2). For both models, the adjacent chain B is colored wheat. Residues of interest are represented as sticks. Cryo-EM map density is contoured to σ = 5.
Figure 4 with 2 supplements
Conformational changes between apo TRPV2 states.
(A) Overlay of the TRPV2APO_1 (salmon) and TRPV2APO_2 (purple) selectivity filter, viewed from the extracellular side of the membrane. (B) Zoom view of the overlay at S5-PH-S6. (C) Overlay of the TRPV2APO_1 (salmon) and TRPV2APO_2 (purple) structures, viewed from the extracellular side of the membrane. (D) Zoom view from the intracellular side of the membrane of the overlay of the TRPV2APO_1 (salmon) and TRPV2APO_2 (purple) structures. Residues of interest are represented as sticks and labeled. Dashed black lines are references to indicate rotation. The measurements for rotation and lateral shifts are labeled and indicated with black arrows.
Figure 4—figure supplement 1
Cryo-EM map density around the selectivity filter of TRPV2APO_1 and TRPV2APO_2.
Density for (A) TRPV2APO_1 (salmon) and (B) TRPV2APO_2 (purple) is contoured to σ = 5. The selectivity filter is viewed from the extracellular side of the membrane. Residues of interest are represented as sticks.
Figure 4—figure supplement 2
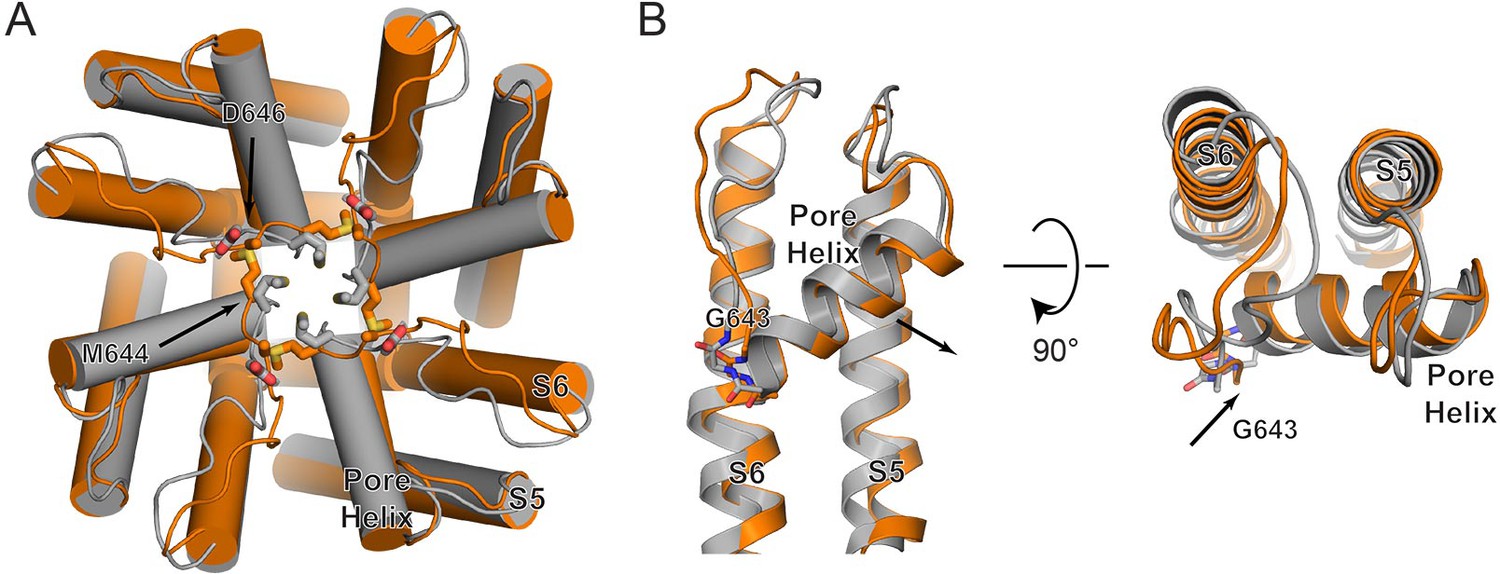
Conformational changes at the selectivity filter between TRPV1 apo and DkTx/RTX-bound structures in nanodiscs.
(A) Overlay of the TRPV1 apo state (PDB 5IRZ, gray) and TRPV1 DkTx/RTX-bound state (PDB 5IRX, orange) selectivity filter, viewed from the extracellular side of the membrane. (B) Zoom view of the overlay at S5-PH-S6. Residues of interest are represented as sticks and labeled. Shifts are with black arrows.
Tables
Table 1
Cryo-EM data collection and model statistics.
https://doi.org/10.7554/eLife.48792.013| TRPV2APO_1 (EMD-20677, PDB 6U84) | TRPV2APO_2 (EMD-20678, PDB 6U85) | TRPV2CBD_1 (EMD-20686, PDB 6U8A) | TRPV2CBD_2 (EMB-20682, PDB 6U88) | |
|---|---|---|---|---|
| Data collection and processing | ||||
| Magnification | 81,000x | 81,000x | ||
| Detector mode | super-resolution | counting | ||
| Voltage (kV) | 300 | 300 | ||
| Defocus range (μm) | 0.8–3.0 | 0.8–3.0 | ||
| Pixel size (Å) | 1.06 | 1.06 | ||
| Total extracted particles (no.) | 1,181,347 | 2,290,820 | ||
| Refined particles (no.) | 598,859 | 710,728 | ||
| Final particles (no.) | 42,407 | 14,332 | 23,944 | 36,153 |
| Symmetry imposed | C4 | C4 | C4 | C4 |
| Map sharpening B factor (Å2) | −82 | −88 | −51 | −38 |
| Map resolution (Å) FSC threshold | 3.7 0.143 | 4.0 0.143 | 3.4 0.143 | 3.2 0.143 |
| Model Refinement | ||||
| Model resolution cut-off (Å) | 3.7 | 4.0 | 3.4 | 3.2 |
| Model composition Nonhydrogen atoms Protein residues Ligands | 20,460 2520 0 | 20,140 2472 0 | 20,036 2468 CBD: 4 | 20,016 2444 CBD: 4 |
| R.M.S. deviations Bond lengths (Å) Bond angles (°) | 0.011 0.742 | 0.007 0.664 | 0.008 0.947 | 0.009 1.060 |
| Validation MolProbity score Clashscore Poor rotamers (%) CαBLAM outliers (%) EMRinger score | 1.69 5.36 0.90 1.14 1.72 | 2.06 11.75 0.18 0.84 3.03 | 1.37 3.39 0.37 0.50 2.61 | 1.38 4.23 0.55 2.18 2.55 |
| Ramachandran plot Favored (%) Allowed (%) Disallowed (%) | 93.97 6.03 0.00 | 92.31 7.69 0.00 | 96.38 3.62 0.00 | 96.97 3.03 0.00 |
Additional files
-
Transparent reporting form
- https://doi.org/10.7554/eLife.48792.026
Download links
A two-part list of links to download the article, or parts of the article, in various formats.
Downloads (link to download the article as PDF)
Open citations (links to open the citations from this article in various online reference manager services)
Cite this article (links to download the citations from this article in formats compatible with various reference manager tools)
Molecular mechanism of TRPV2 channel modulation by cannabidiol
eLife 8:e48792.
https://doi.org/10.7554/eLife.48792


