Differential impact of self and environmental antigens on the ontogeny and maintenance of CD4+ T cell memory
- University College London, United Kingdom
- Columbia University Medical Center, United States
- University of Glasgow, United Kingdom
- University of Oxford, United Kingdom
Figures
Figure 1 with 2 supplements
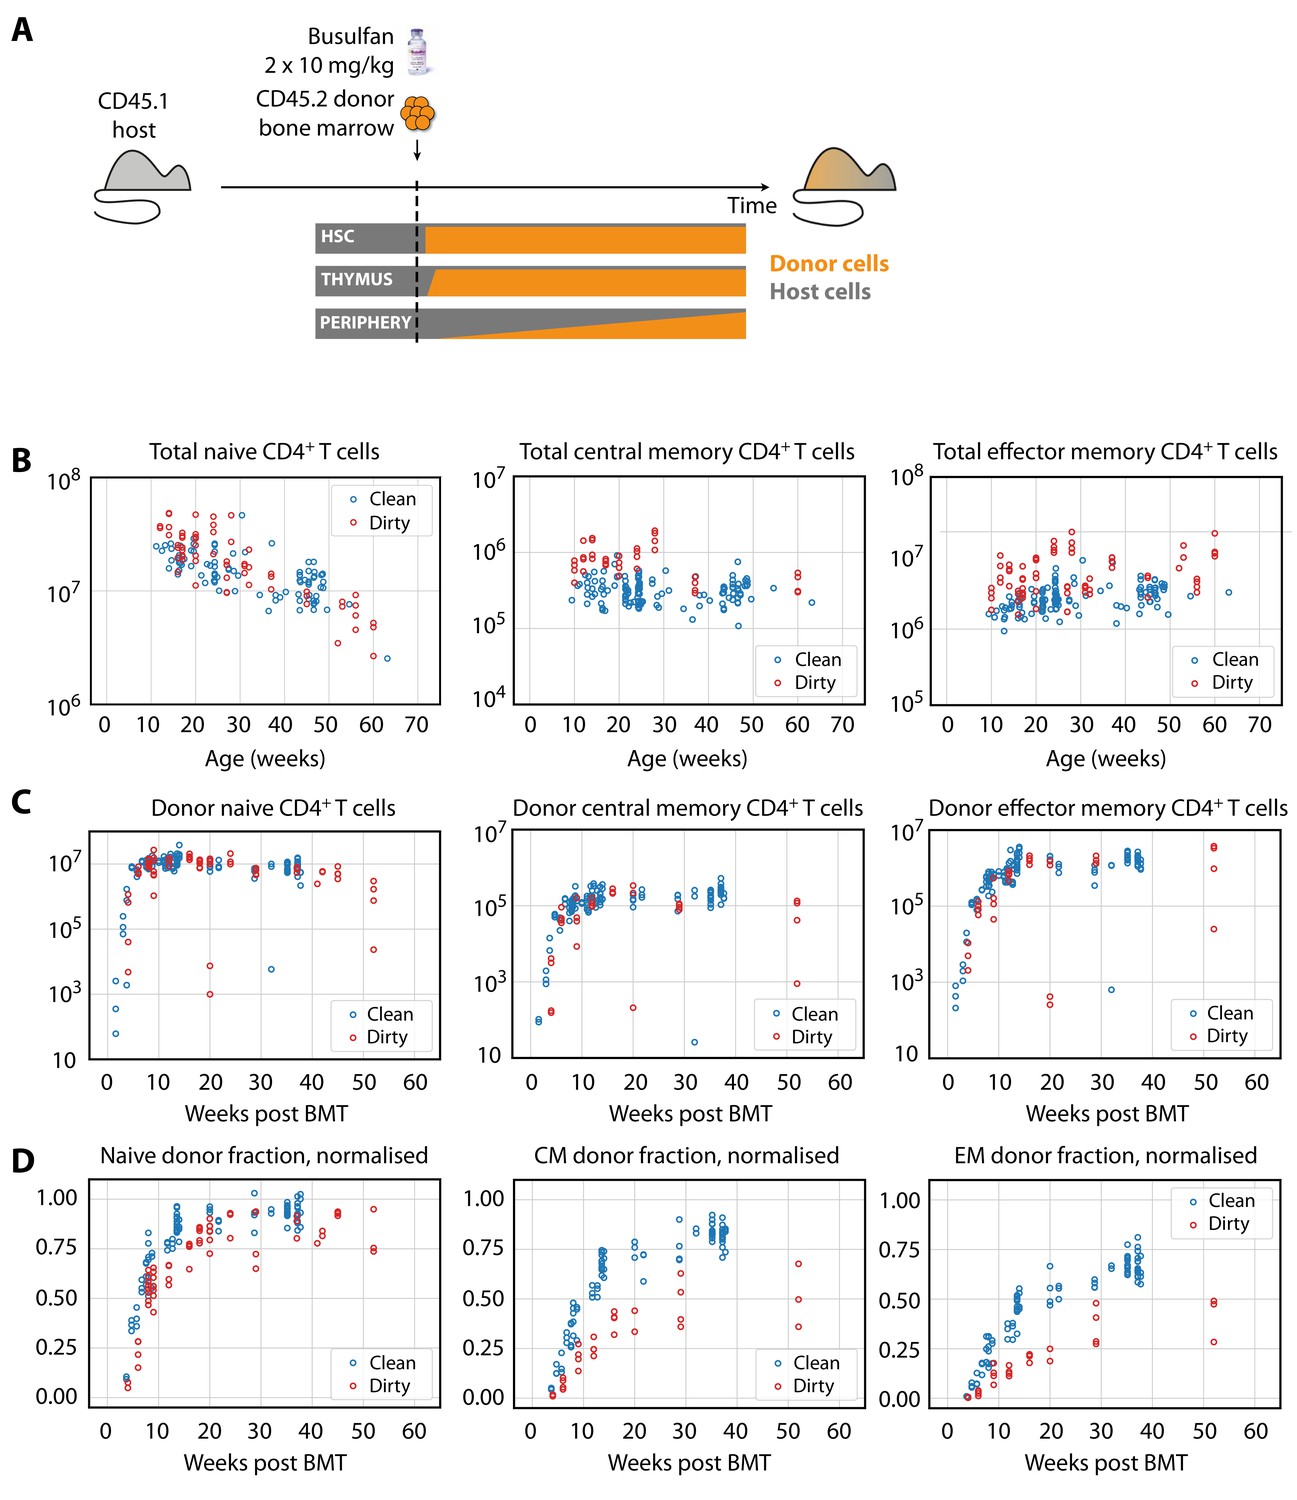
Characterising CD4+ T cell subsets in busulfan chimeric mice in clean and dirty environments.
(A) Generating bone marrow chimeras to map T cell homeostasis.
Donor T cells (orange) differentiate and percolate through the thymus and periphery, replacing host cells (grey). (B) Comparing total numbers of CD4+ naive, TCM and TEM cells in clean and dirty chimeric mice. (C) Numbers of donor-derived CD4+ subsets recovered from spleen and lymph nodes of clean and dirty chimeric mice. Bone marrow transplants (BMT) were performed in mice between ages 5–26 weeks. (D) The donor fraction (chimerism) within CD4+ T cell subsets, varying with time post BMT, normalised to the chimerism in the double-positive thymocytes in each mouse.
Figure 1—figure supplement 1
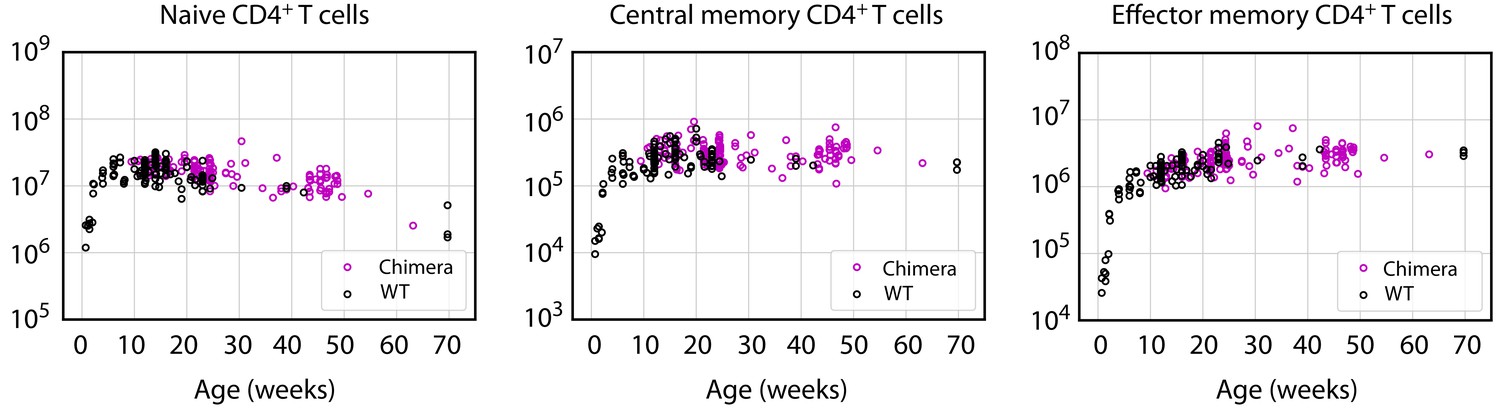
Busulfan chimeric mice exhibit normal numbers of CD4+ naive, central and effector memory T cells.
Figure 1—figure supplement 2
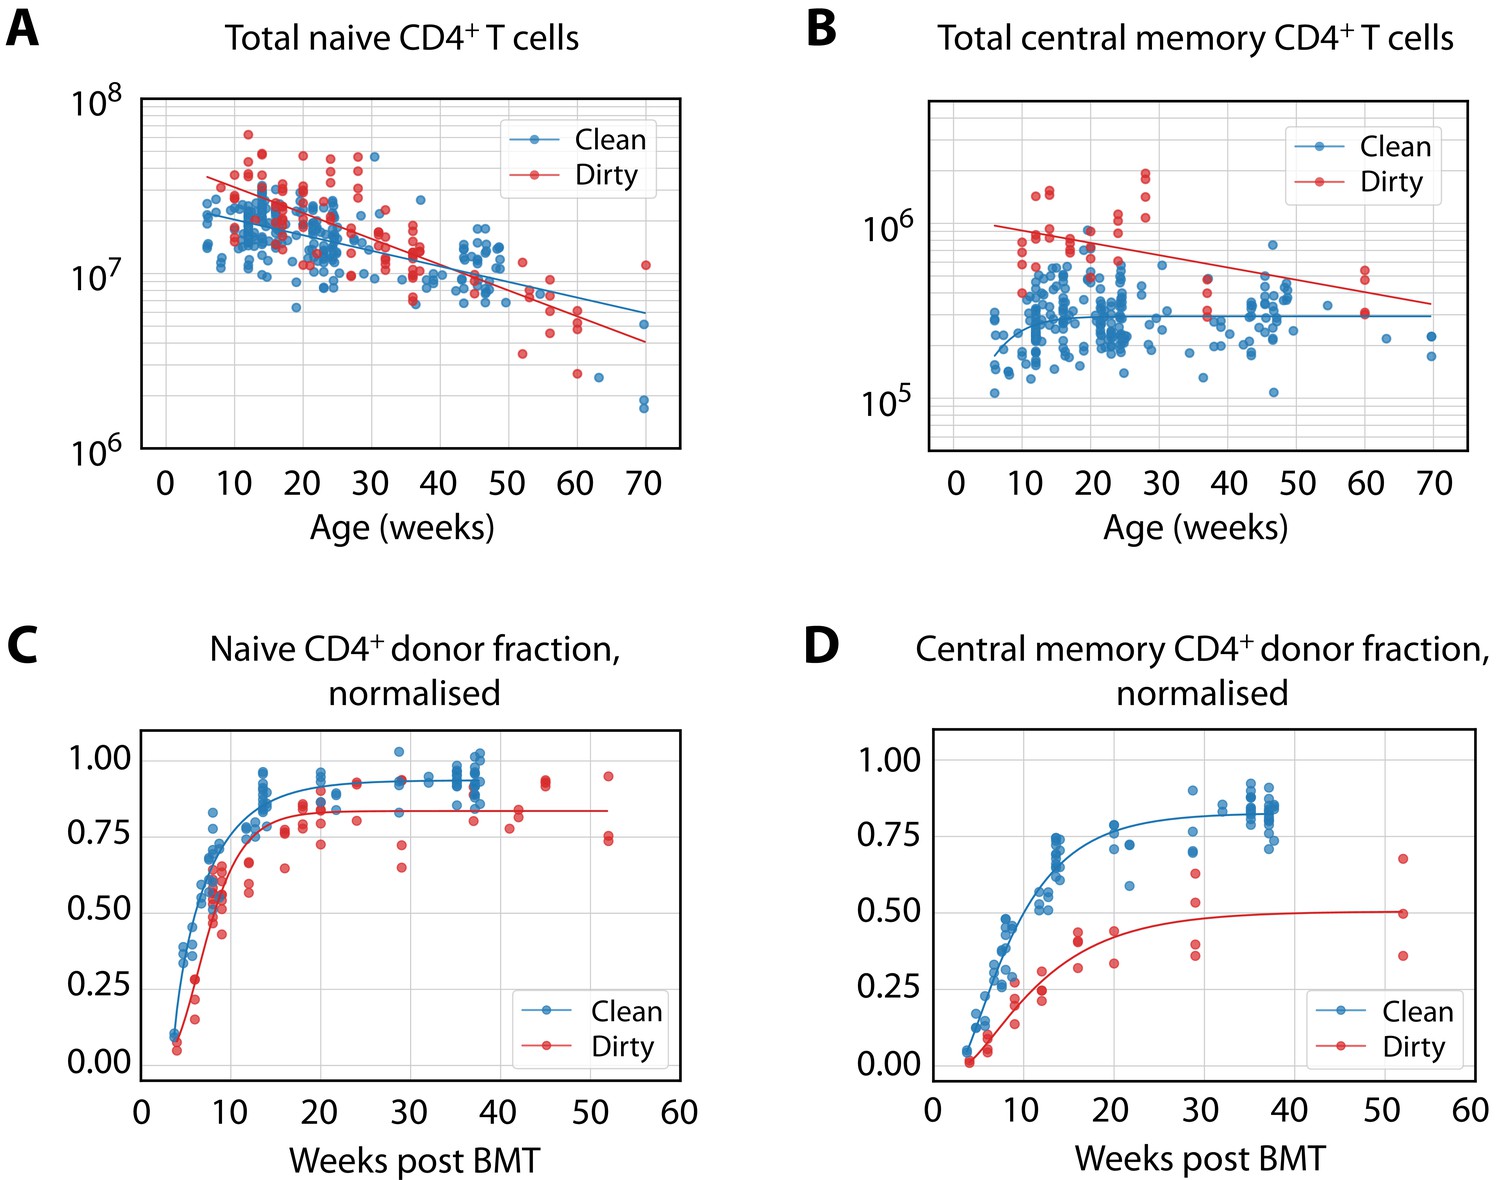
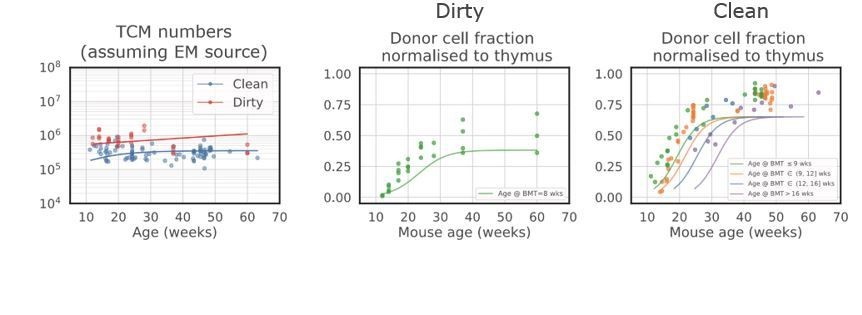
Empirical descriptions of the size and chimerism of the putative source populations for CD4+ TCM and TEM in adult mice.
(A–B) The timecourses of naive T cell numbers, and TCM numbers in dirty mice, were described with exponential decay (); TCM numbers in clean mice (B) were described with . (C–D) Donor fraction (normalised chimerism) curves in CD4+ naive T cells (C) and TCM (D) were described with the generalised logistic function using the pooled data from mice at multiple ages post-BMT; curves specific to different ages at BMT were very similar.
Figure 2
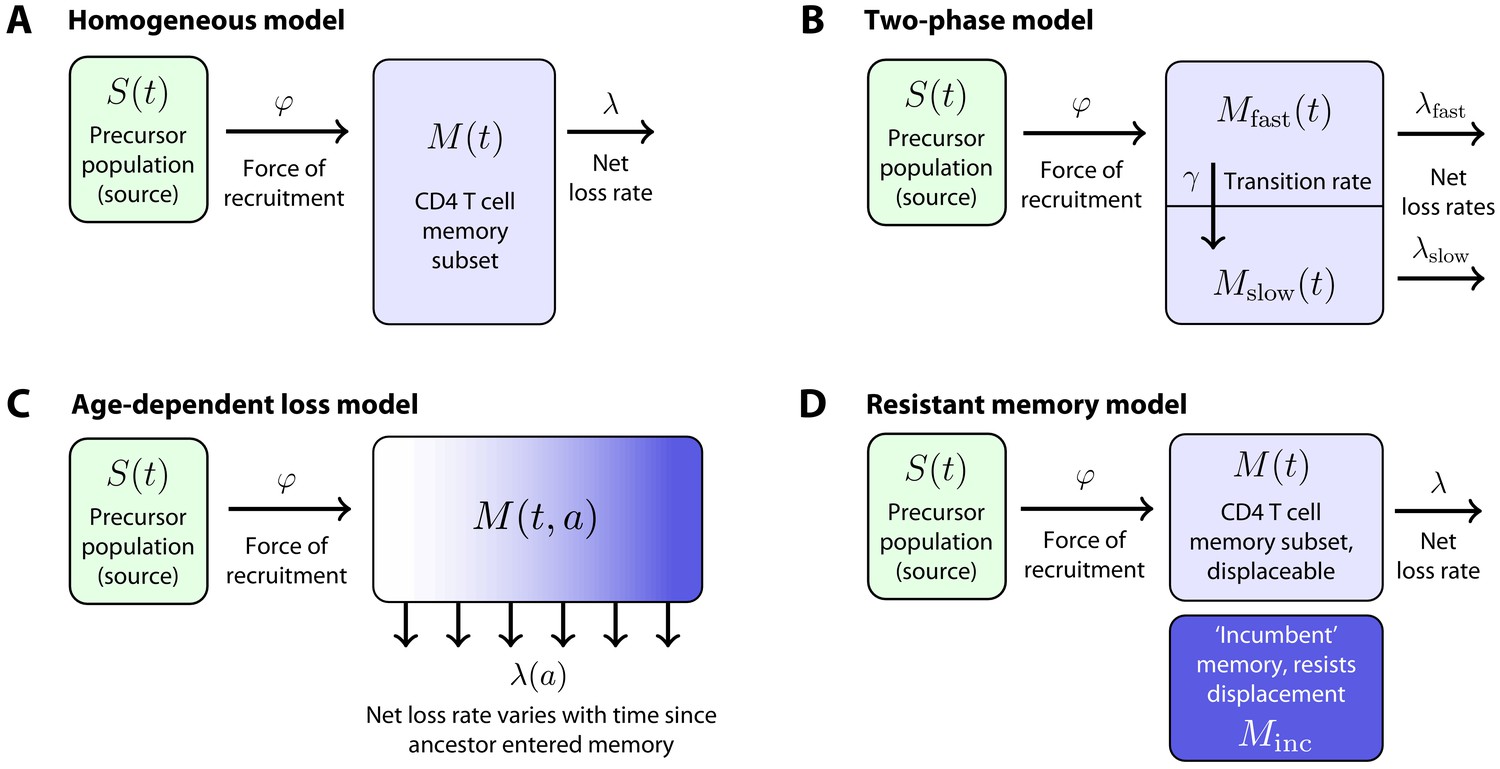
Models of the generation and maintenance of memory CD4+ T cell subsets in adult mice.
(A) New cells from a precursor (source) population of size flow in to a homogeneous memory subset at total rate . The force of recruitment is approximately the daily probability that any given cell from the source will be recruited into memory, multiplied by an expansion factor. This memory population may self-renew through division and be lost through death or differentiation and is continually supplemented by cells from the source. We assume that the net loss rate (loss minus division) is a constant, . (B) In a two-phase model of memory, new cells are recruited at rate into a population that has a high net loss rate and so is replaced by donor cells relatively quickly. These cells transition into a slower subset at constant rate and are then lost at net rate . (C) The age-dependent loss model; here, the net loss rate of memory is a continuous function of cell 'age' , defined as the time since a cell or its ancestor entered the memory pool. The model tracks the evolution of the population density of memory T cells of age at host age , . (D) The resistant memory model invokes a subpopulation of ‘incumbent’ memory cells which are presumed to be established early in life, stable in numbers, and not replenished from the source population. As in the homogeneous model, the source feeds a compartment of 'displaceable’ cells, with net loss rate .
Figure 3
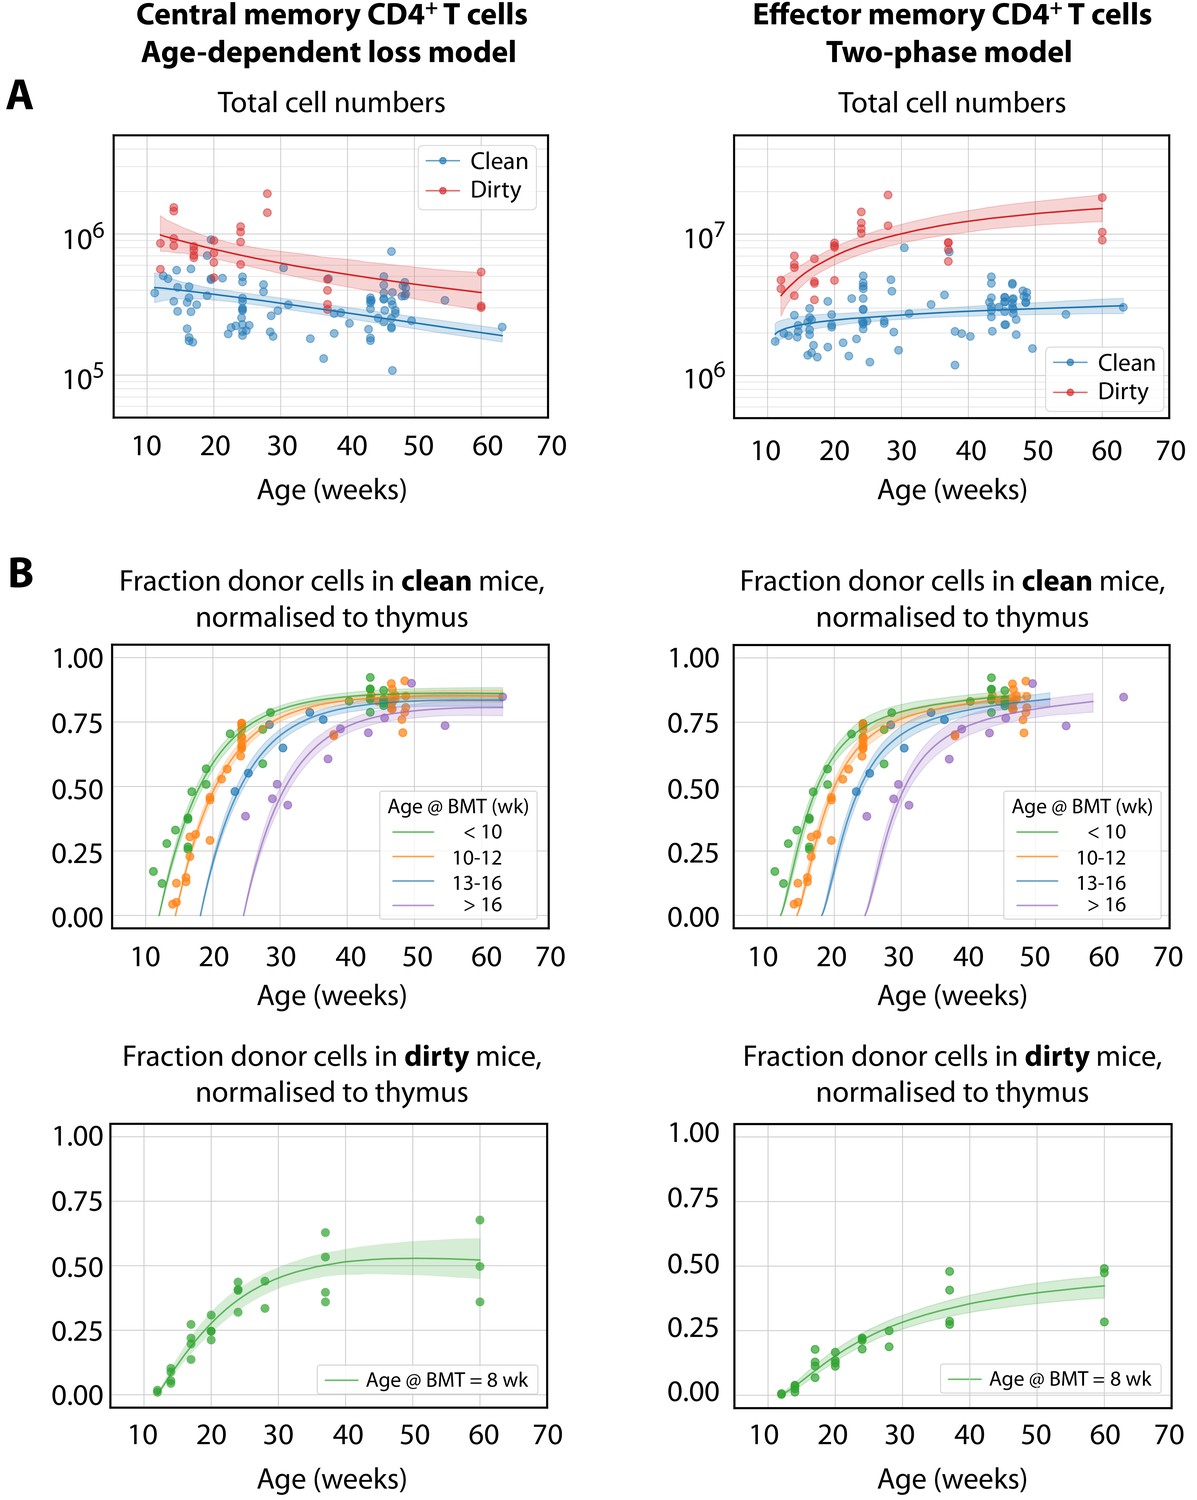
The best-fitting models of CD4+ MP T cell dynamics.
The age-dependent loss model was the best description of CD4+ TCM dynamics, and the two-phase model best described TEM. (A) Total (donor+host) numbers of memory T cells and (B) chimerism, from 4 weeks post bone marrow transplant (BMT). To visualise the fits, clean facility mice were grouped into small ranges of age at BMT, and the four curves show the model predictions for the median age within each group. All trajectories are described with the same parameters, differing only in the kinetics of the source population, which is age-dependent. The lower panels show the fitted trajectories of CD4+ TCM and TEM chimerism in mice in the dirty environment, all of which underwent BMT at a similar age.
Figure 4 with 1 supplement
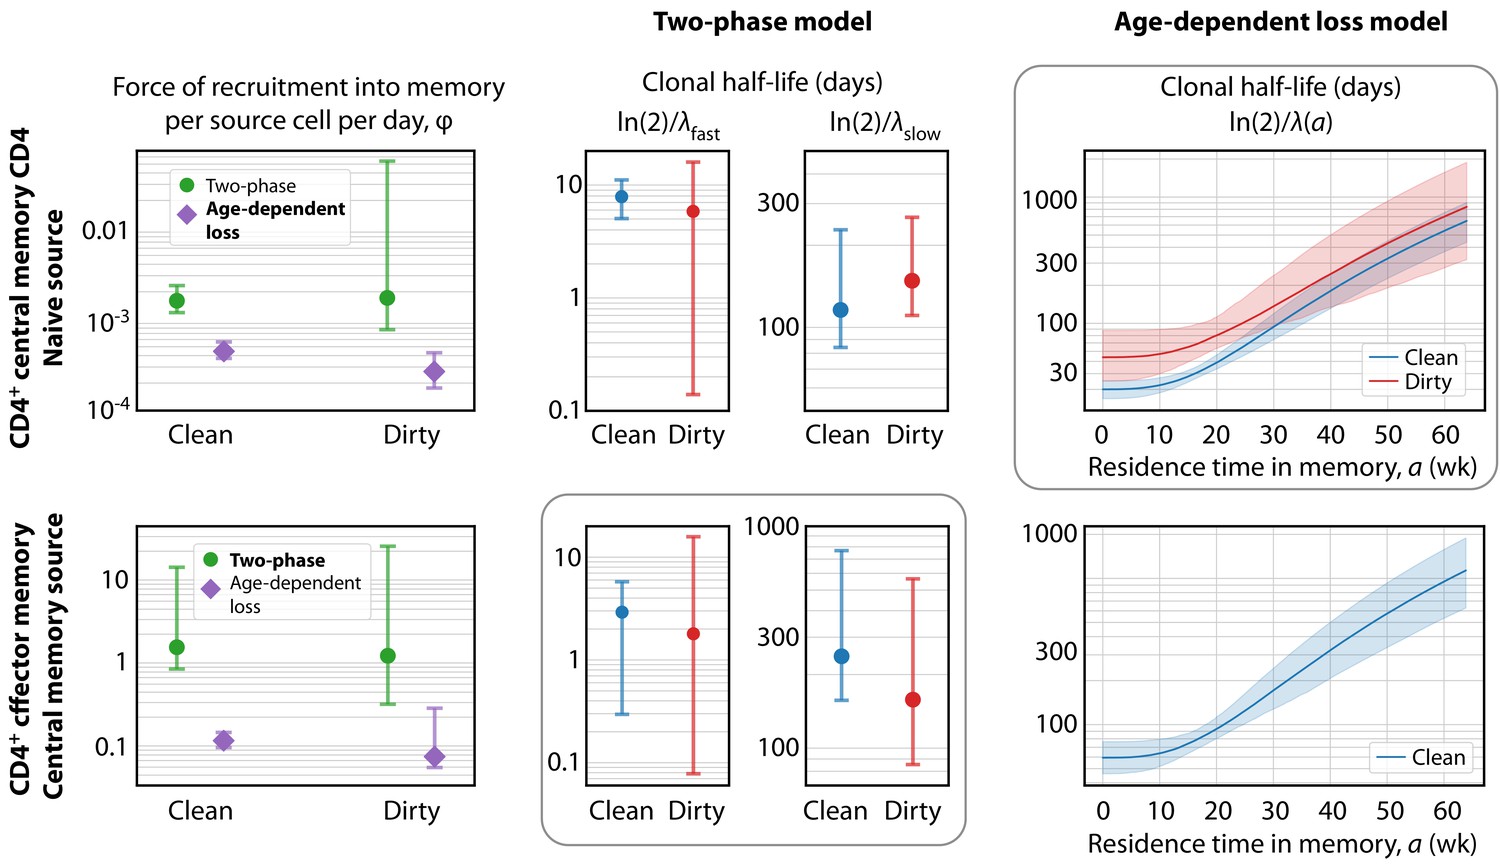
Key parameters describing the constitutive production of central and effector memory CD4+ T cells in adult mice.
Left panels: Estimates of the force of recruitment from the source () for each model and each population. Vertical bars represent bootstrapped 95% confidence intervals. The favoured model for each population is indicated in bold in the legend. Middle panels: The estimated clonal half-lives of fast and slow memory in the two-phase model. The enclosing box indicates that this model was favoured for TEM. Right panels: Estimates of the clonal half-lives, which vary with cell age, derived from the age-dependent loss model, favoured for TCM. For TEM in dirty mice, the estimated was close to zero and the clonal half-life is not shown. Shaded bands indicate the range of predicted half-lives arising from the 95% confidence intervals on . All parameter estimates are given in Table 2.
Figure 4—figure supplement 1
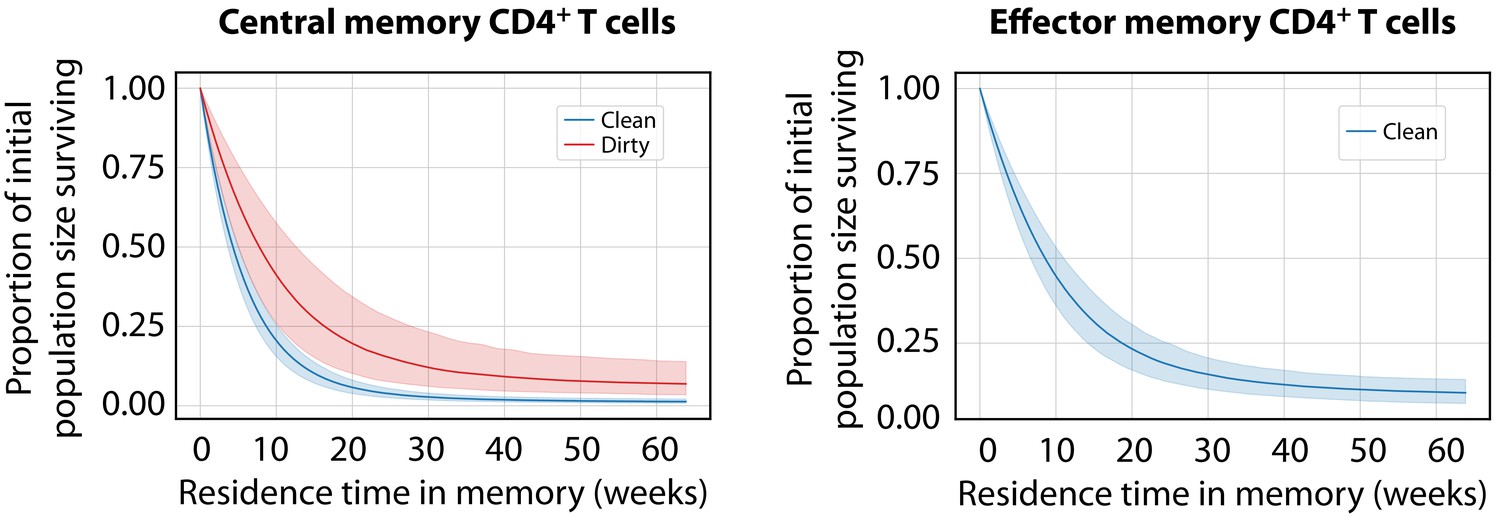
Predicted survival curves for populations entering CD4+ MP T cell compartments using the age-dependent loss model.
These curves are derived from the net loss rate , which is the balance of loss and self-renewal; therefore, they reflect the persistence of a self-renewing population with time since it entered memory, rather than the survival of individual cells. (The proportion of that population remaining a time after entering memory is ). For CD4+ TEM in dirty mice, was close to zero, implying that clones are almost self-sustaining.
Figure 5
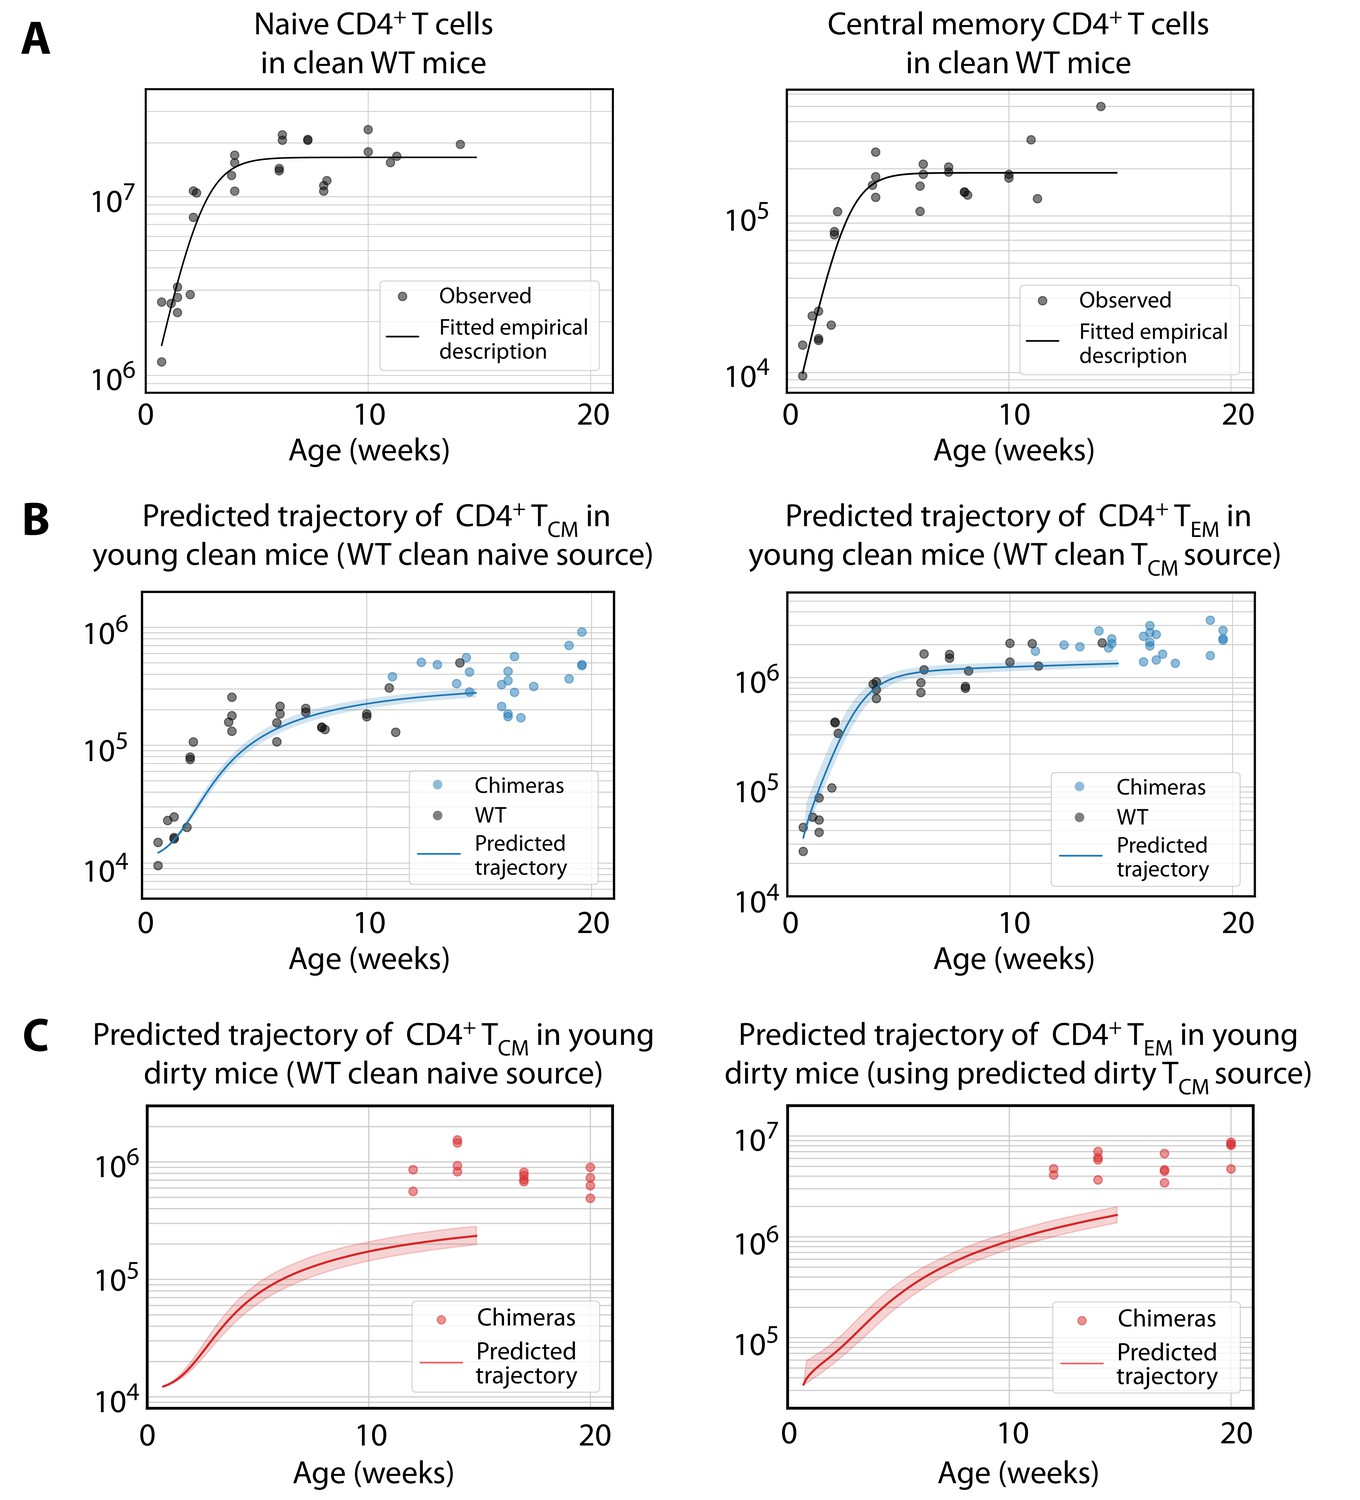
Predicting the establishment of CD4+ TCM and TEM in clean and dirty mice.
(A) The timecourses of numbers of CD4+ naive T cells and TCM recovered from the spleen and lymph nodes of wild-type (WT) mice housed in the clean facility at UCL, aged 5 days to 15 weeks. We fitted a descriptor function to both, using least squares on the log-transformed observations. (B) Using these curves to predict the development of CD4+ TCM and TEM in clean mice using the best-fitting model parameters from adults. Shaded regions indicate the spread of predictions over the 95% confidence intervals of the parameters. The black points (not used for fitting) are the numbers of CD4+ TCM and TEM recovered from clean WT mice. (C) Using CD4+ naive T cells from young clean mice as a source, we used the age-dependent loss model of TCM dynamics in adult dirty mice to predict their accumulation (left panel). This trajectory in turn was used to predict the accumulation of TEM in the same mice (right panel).
Figure 6
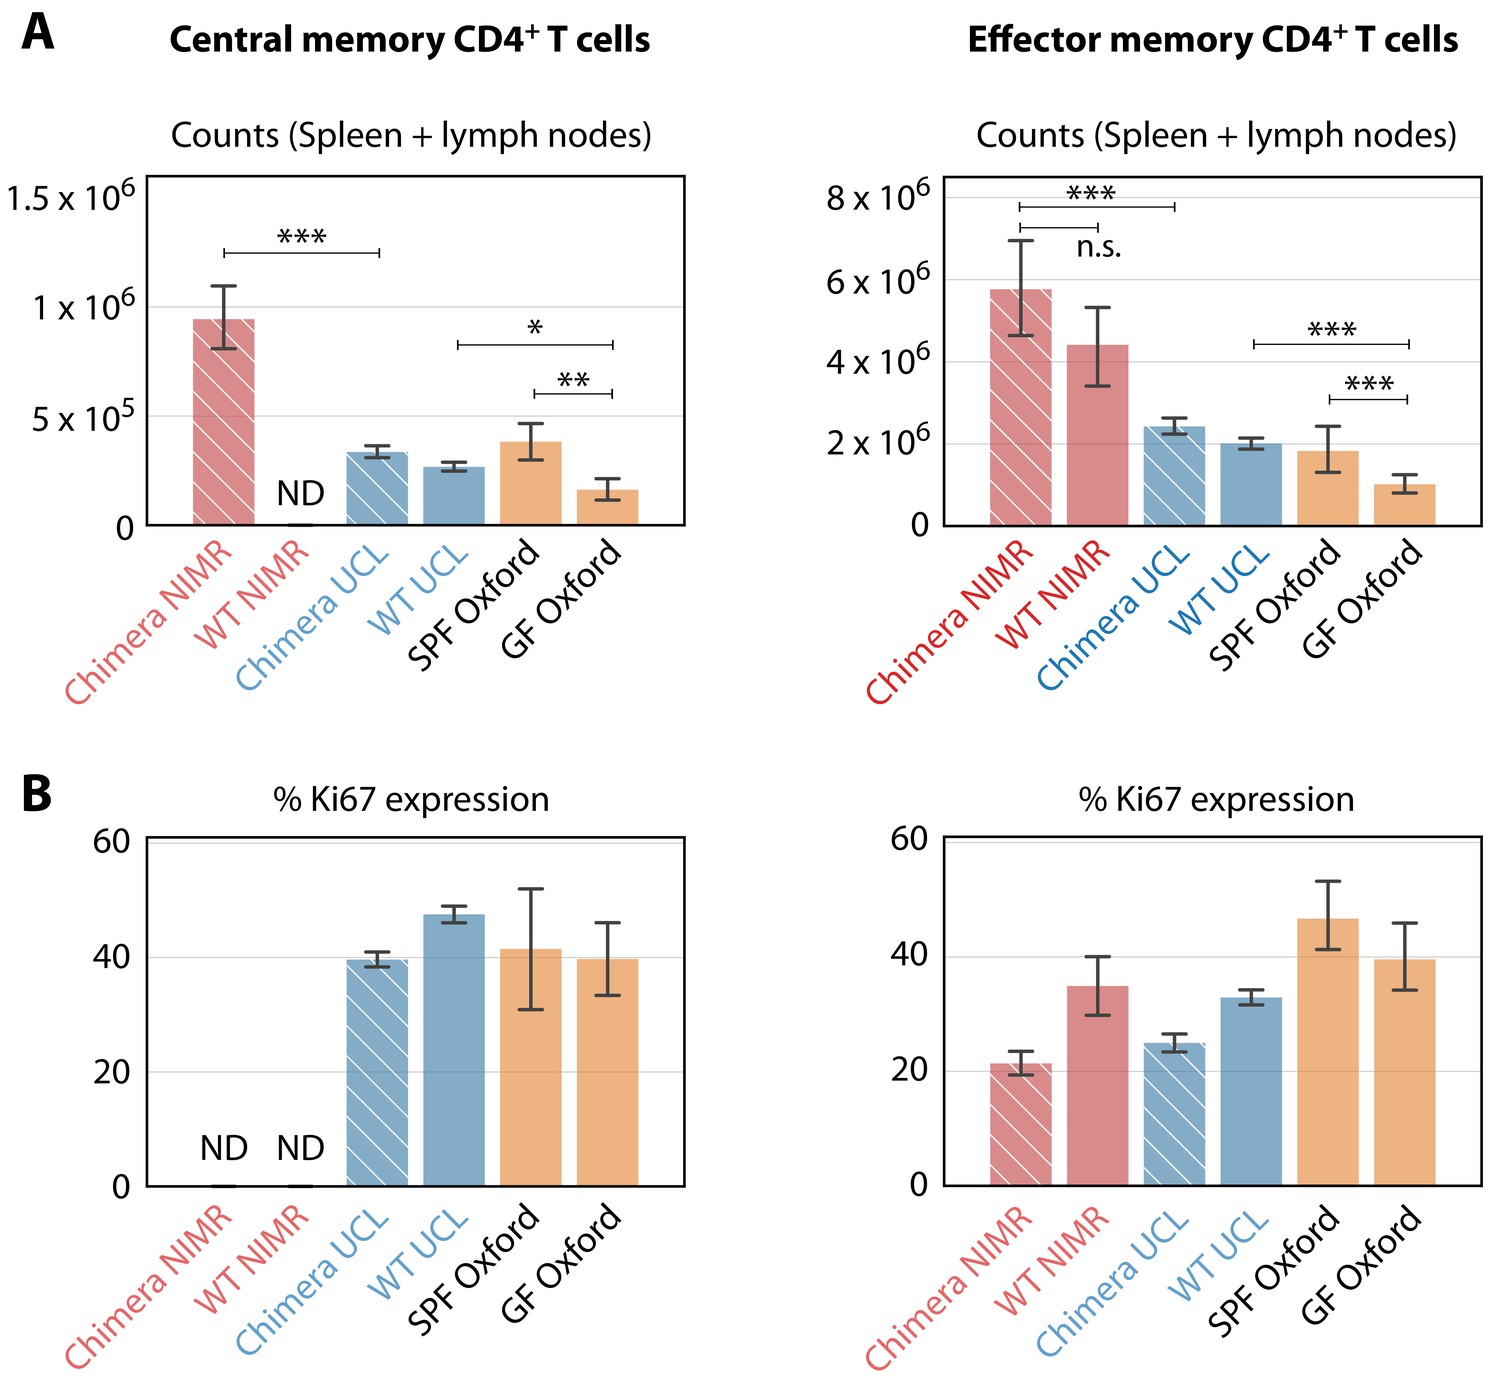
Comparing the numbers and proliferative activity (panels A and B respectively) of CD4+ TCM and TEM in adult mice, in different SPF and GF facilities.
Cross-hatched bars denote busulfan chimeras, solid bars denote WT mice. NIMR (red bars) and UCL (blue bars) are the ‘dirty’ and ‘clean’ facilities used for the bulk of the analysis presented here. ‘ND’ denotes data not available. * p < 0.05, ** p < 0.01, *** p < 0.001, using the Mann-Whitney test. Group sizes: Panels A; (28, 0, 78, 98, 4, 14) and (46, 11, 78, 98, 4, 14). Panels B; (0, 0, 74, 140, 4, 14) and (18, 4, 74, 140, 4, 14).
Figure 7

Modelling the ontogeny of CD4+ memory T cell subsets in different facilities.
Using the timecourse of CD4+ naive T cell numbers in young clean WT control mice (Figure 5A), and the parameters estimated in clean adult mice, we estimated the corrections to the force of recruitment needed from birth to age 11 weeks to generate the mean numbers of TCM in adults aged 10–28 weeks in each environment (left panel). These corrected TCM trajectories, together with the force of recruitment and loss rates estimated from clean adult mice, predicted the accumulation of CD4+ TEM up to age 11 weeks in all three environments (right panel).
Author response image 1
Best fit model in which CM cells are fed exclusively by EM cells.
The model underestimates the accumulation of CM donor chimerism, as it is constrained by the lower chimerism of the upstream EM cells.
Tables
Table 1
Measures of support (using differences in the corrected Akaike information criterion, AICc - AICcmin; see Materials and methods) for models in which CD4+ TCM derive directly from CD4+ naive T cells, and TEM derive either from naive T cells or TCM.
AICc differences are shown in bold, with zero indicating the model with strongest support, and positive differences representing reduced support, with differences of 10 or more generally considered highly significant. Figures in parentheses are the log likelihoods, reflecting the quality of fit of each model. We also show the number of parameters estimated for each model in each environment.
| CD4+ central memory | CD4+ effector memory | ||||
|---|---|---|---|---|---|
| Source population | Source population | ||||
| Model | Parameters | CD4+ naive | CD4+ naive | CD4+ central memory | |
| Homogeneous | 3 | 128 (10) | 89 (75) | 160 (39) | |
| Two-phase | 5 | 9 (74) | 29 (109) | 0 (124) | |
| Age-dependent loss | 4 | 0 (76) | 29 (107) | 10 (117) | |
| Resistant memory | 4 | 26 (63) | 45 (99) | 49 (97) | |
Table 2
Estimates of parameters governing CD4+ TCM and TEM homeostasis in adult mice.
| CD4+ TCM | CD4+ TEM | |||||
|---|---|---|---|---|---|---|
| Model | Parameter | Quantity | Clean | Dirty | Clean | Dirty |
| Two-phase | Force of recruitment (d–1) | 1.4 (1.2, 2.3) × 10-3 | 1.5 (0.77, 54) × 10-3 | 1.2 (0.76, 12) | 1.1 (0.29, 23) | |
| Daily cell influx at age = 20 wk | 2.3 (2.0, 3.9) × 10-3 | 3.2 (1.7, 120) × 104 | 36 (22, 370) × 104 | 84 (21, 1700) × 104 | ||
| Net loss rate of fast subset (d–1) | 0.082 (0.063, 0.14) | 0.10 (0.043, 5.2) | 0.23 (0.12, 2.4) | 0.39 (0.045, 9.0) | ||
| Net loss rate of slow subset (d–1) | 5.9 (3.0, 9.4) × 10-3 | 4.8 (2.7, 6.9) × 10-3 | 2.5 (0.81, 4.6) × 10-3 | 4.8 (1.0, 8.8) × 10-3 | ||
| Clonal half-life of fast subset (d) | 8.4 (5.0, 11) | 6.7 (0.14, 16) | 3.0 (0.30, 5.8) | 1.8 (0.078, 16) | ||
| Clonal half-life of slow subset (d) | 120 (75, 230) | 140 (101, 260) | 270 (150, 770) | 140 (75, 570) | ||
| % of memory transitioning to slow | 3.4 (0.46, 4.1) | 5.0 (0.18, 10) | 1.8 (0.21, 2.4) | 9.1 (0.36, 38) | ||
| Proportion slow at = 20 wk | 0.25 (0.12, 0.30) | 0.61 (0.45, 0.75) | 0.36 (0.25, 0.41) | 0.72 (0.41, 0.87) | ||
| Age-dependent | Force of recruitment (d–1) | 0.43 (0.38, 0.57) × 10-3 | 0.26 (0.18, 0.43) × 10-3 | 0.10 (0.086, 0.13) | 0.062 (0.049, 0.26) | |
| loss | Daily cell influx at age = 20 wk | 0.70 (0.62, 0.93) × 104 | 0.57 (0.39, 0.96) × 104 | 3.0 (2.5, 3.8) × 104 | 4.6 (3.7, 19) × 104 | |
| Net loss rate of new memory (d–1) | 2.2 (2.0, 2.7) × 10-2 | 1.2 (0.79, 2.0) × 10-2 | 1.2 (0.91, 1.5) × 10-2 | 1.1 (-44, 26) × 10-5 | ||
| Memory age threshold* (d) | 150 (140, 200) | 190 (130, 310) | 150 (130, 230) | NA | ||
-
95% confidence intervals are shown in parentheses. *In the age-dependent loss model, the threshold cell age defines the beginning of the more persistent phase of memory maintenance (); for TEM in dirty mice, estimates of were close to zero, and was poorly constrained.
Additional files
-
Source data 1
All data used in the study.
- https://cdn.elifesciences.org/articles/48901/elife-48901-data1-v2.xlsx
-
Transparent reporting form
- https://cdn.elifesciences.org/articles/48901/elife-48901-transrepform-v2.pdf
Download links
A two-part list of links to download the article, or parts of the article, in various formats.
Downloads (link to download the article as PDF)
Open citations (links to open the citations from this article in various online reference manager services)
Cite this article (links to download the citations from this article in formats compatible with various reference manager tools)
Differential impact of self and environmental antigens on the ontogeny and maintenance of CD4+ T cell memory
eLife 8:e48901.
https://doi.org/10.7554/eLife.48901


