Region-specific regulation of stem cell-driven regeneration in tapeworms
- Morgridge Institute for Research, United States
- University of Colorado School of Medicine, United States
- Howard Hughes Medical Institute, United States
- University of Wisconsin–Madison, United States
Figures
Figure 1 with 2 supplements
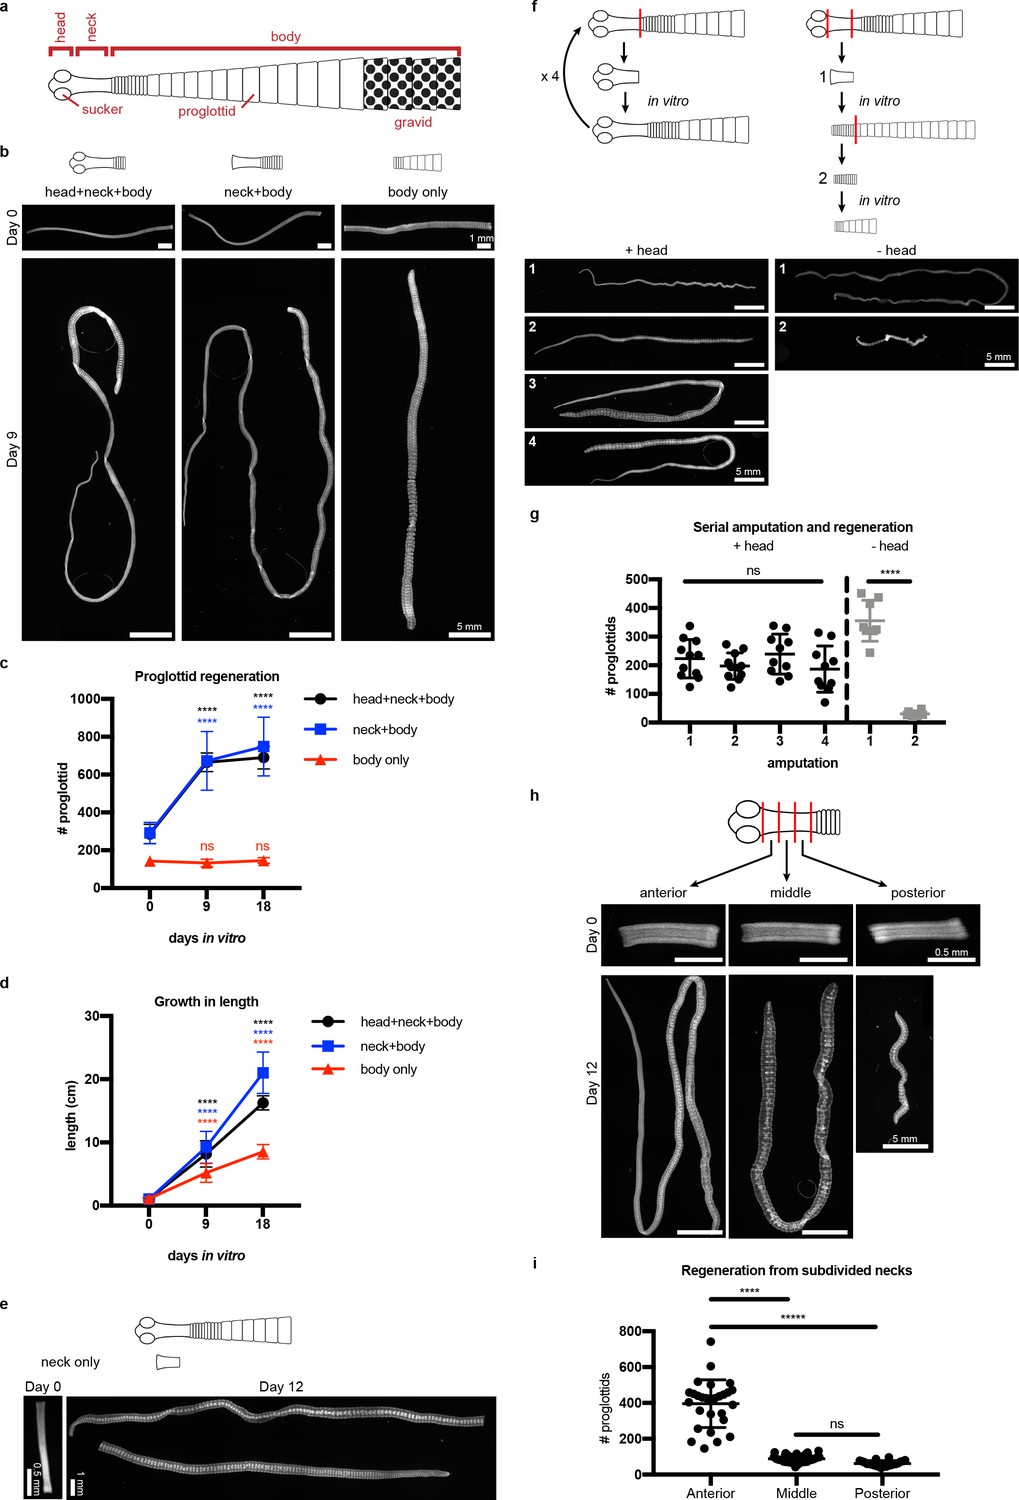
Regeneration competence of H. diminuta.
(a) Schematic of H. diminuta adults. (b) DAPI-stained 1 cm fragments grown in vitro. (c–d) Quantification of proglottid number and growth in length from (b). Error bars = SD, N = 2–5, n = 7–21; one-way ANOVA with Dunnett’s multiple comparison test, compared to day 0. (e) Representative DAPI-stained ‘neck only’ fragment regeneration. (f–g) 2 mm anterior fragments, with or without the head, grown in vitro for 12–15 days and then re-amputated serially. Error bars = SD, +head: one-way ANOVA with Tukey’s multiple comparison test, -head: Student’s t-test. (h–i) DAPI-stained 1 mm fragments from the anterior, middle, and posterior of the neck grown in vitro. Error bars = SD, N = 3, n = 22–29, one-way ANOVA with Tukey’s multiple comparison test.
Figure 1—figure supplement 1

Phenotypic description of regeneration-incompetent tissues of H. diminuta.
(a) Quantification of mean proglottid length (fragment length/# of proglottids). Mean proglottid length from body only fragments are significantly longer than mean proglottid length from either head+neck+body or neck+body fragments. Error bars = SD, N = 2–5, n = 7–21; one-way ANOVA with Tukey’s multiple comparison test done at each timepoint. (b), Confocal sections of the most mature proglottids from ‘body only’ fragments showing immature proglottids at day 0 and a gravid proglottid at day 9. t: testis, ga: genital anlagen, and u: uterus. (c), Micrographs of amputated heads over 30 days in vitro showing a failure to regenerate. White arrowheads point to examples shown in the insets.
Figure 1—figure supplement 2
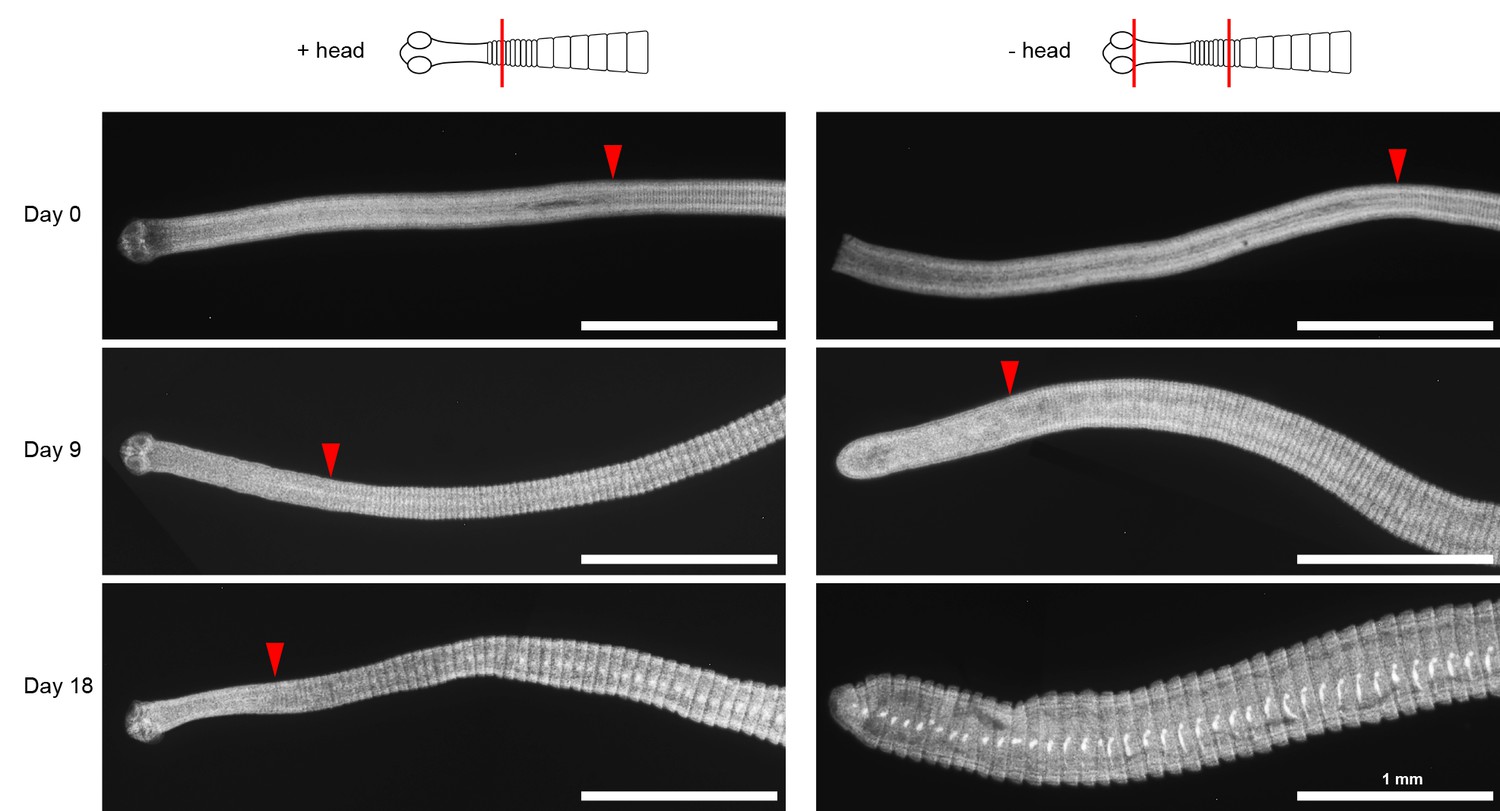
Unsegmented neck is depleted after decapitation.
DAPI-stained worms with or without decapitation were cultured in vitro for the indicated number of days. Red arrowheads mark the position of the first visible proglottid. After 18 days in vitro, the neck tissue is no longer identifiable in -head worms.
Figure 2 with 2 supplements
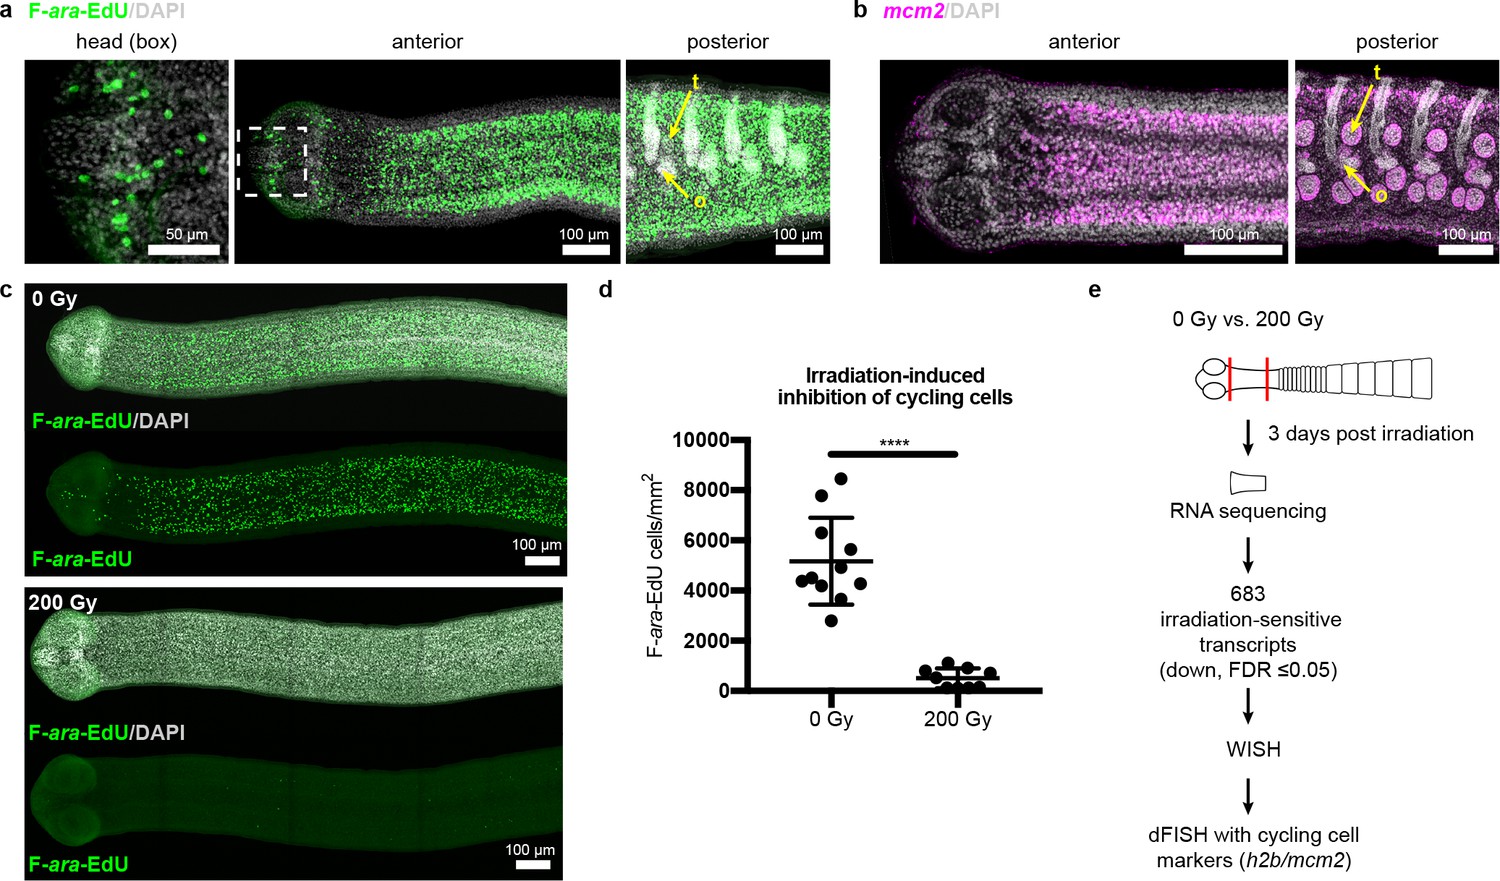
Cycling somatic cells are distributed throughout the tapeworm body and are irradiation sensitive.
(a-b) Maximum-intensity projections of confocal sections showing distribution of cycling cells by 2 hr uptake of F-ara-EdU (a) or FISH for mcm2 (b). Fewer cycling cells were found in the head (box), while abundant cycling cells were observed in both somatic and gonadal tissues throughout the body. t = testis, o = ovary. (c) Maximum-intensity projections of tile-stitched confocal sections after 1 hr uptake of F-ara-EdU (green) 3 days post-irradiation. (d) Quantification of F-ara-EdU+ cell inhibition from (c). Error bars = SD, N = 2, n = 11 and 9, Student’s t-test. (e) RNA-seq strategy to identify genes expressed in cycling cells. (Nuclei are counterstained with DAPI (gray) in this and all subsequent figures.).
Figure 2—figure supplement 1
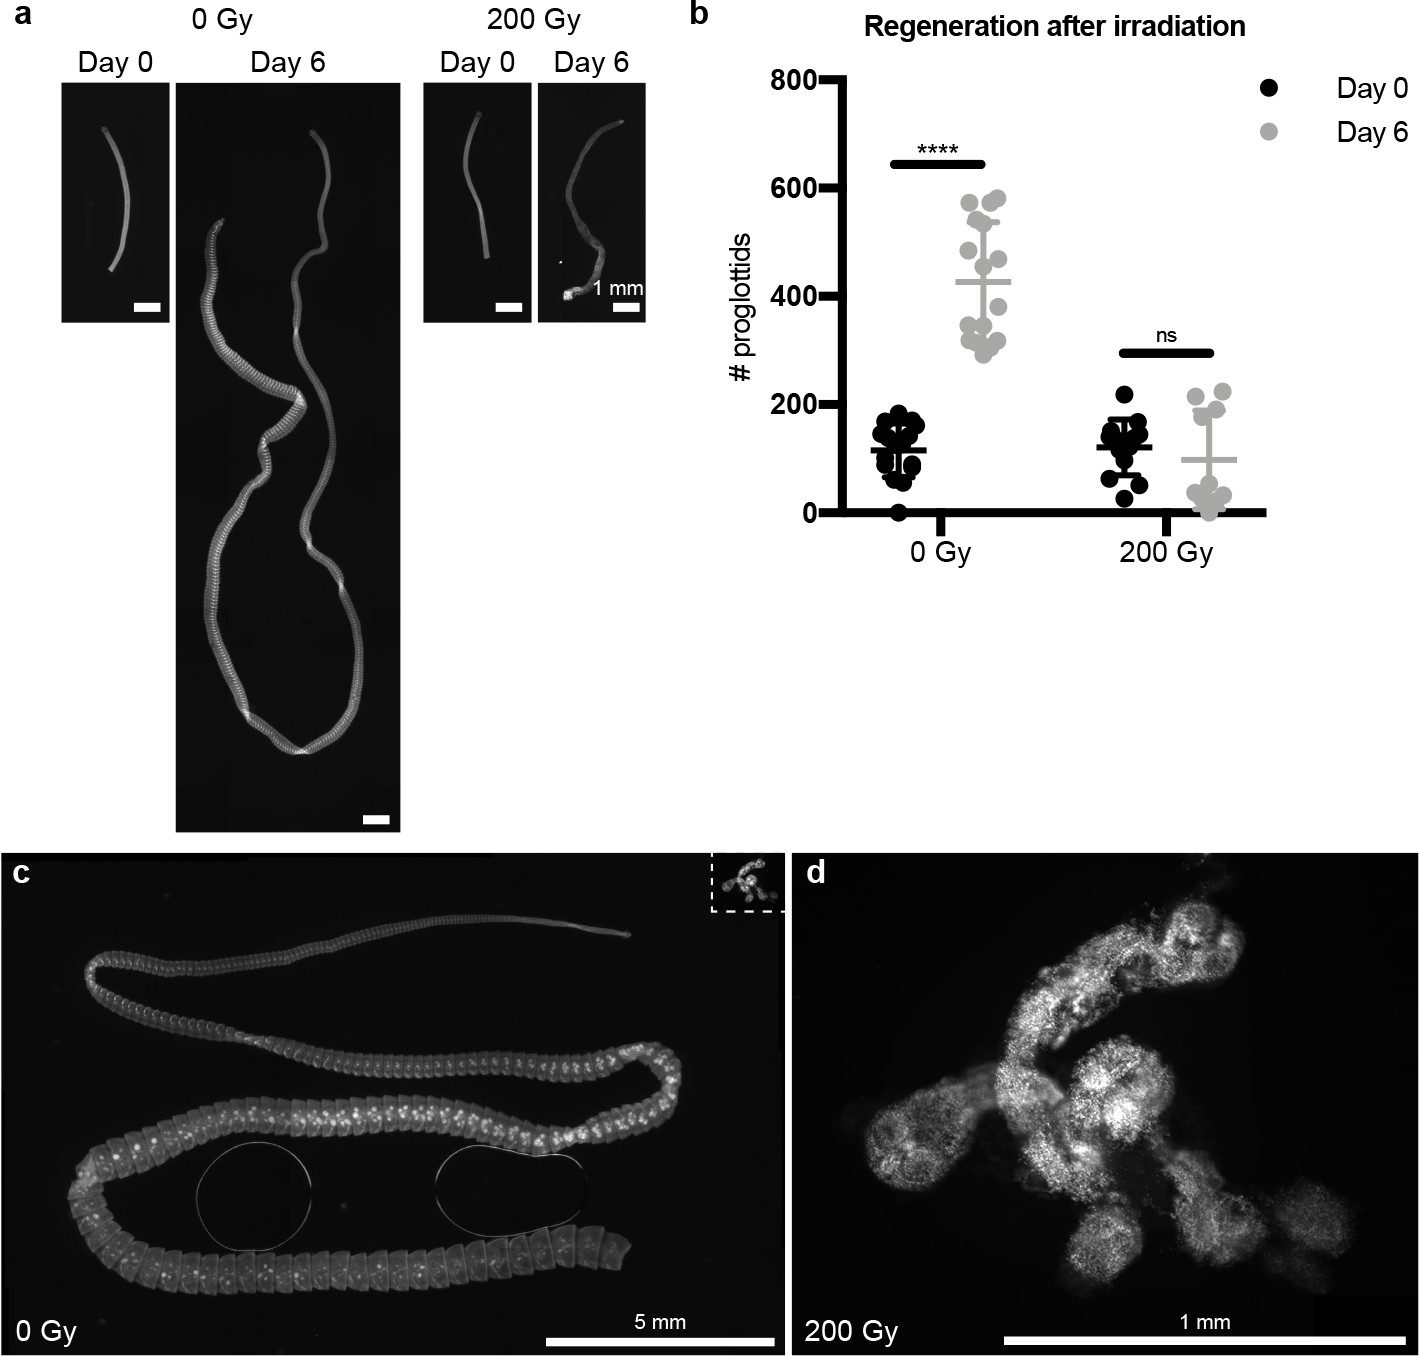
Irradiation inhibits tapeworm regeneration.
(a) DAPI staining of 5 mm anterior fragments from control and irradiated worms before and after 6 days in vitro culture. (b) Quantification of (a). Error bars = SD, N = 2, n = 10–16, one-way ANOVA with Tukey’s multiple comparison test. (c–d) Lethal dose of irradiation was revealed when 5 mm anterior fragments were amputated and grown in vitro for 1 month from worms exposed to 0 Gy or 200 Gy x-irradiation. The irradiated samples in (d) are shown to scale as an inset in (c).
Figure 2—figure supplement 2

Validation of RNA-seq by WISH after irradiation.
WISH (with Fast-Blue Development) from two regions of the tapeworm: anterior (left) and body (right), 3 days post-irradiation.
Figure 3 with 3 supplements
Expression screening for cycling cell markers.
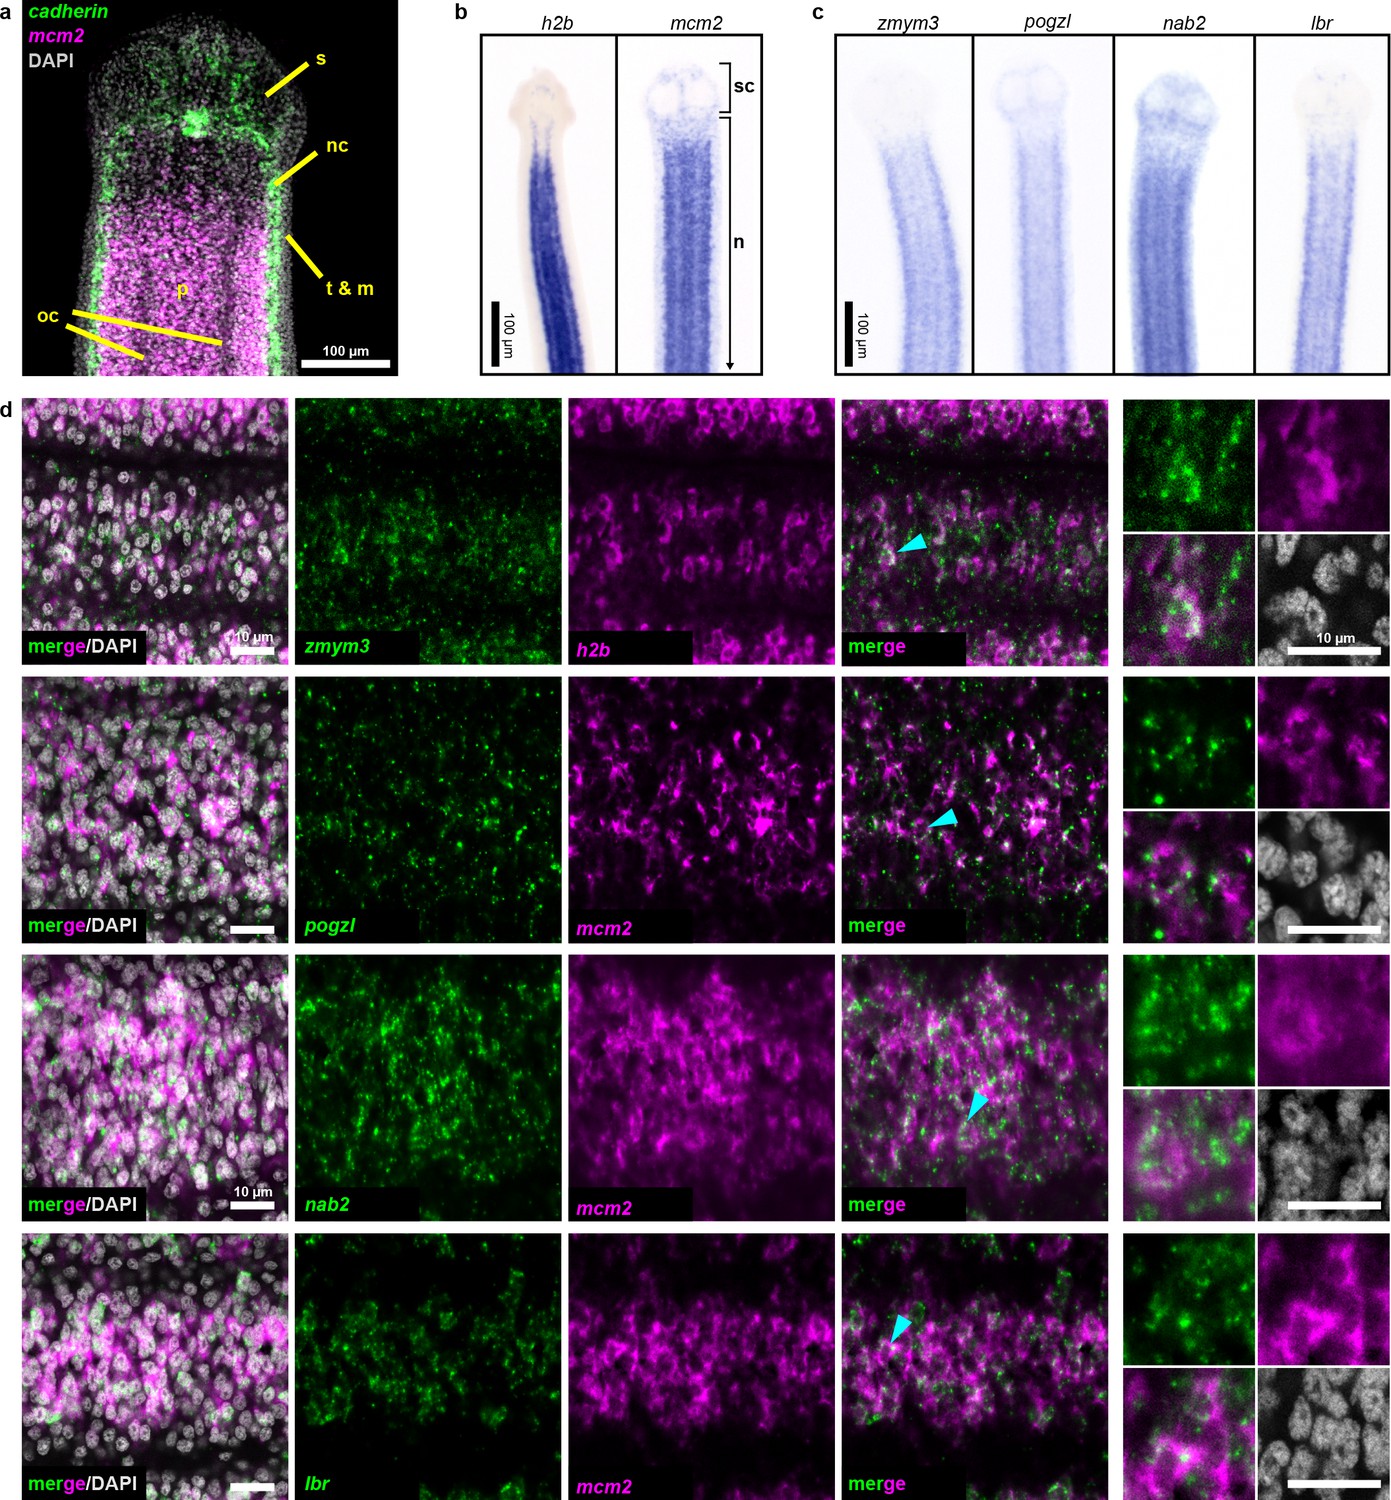
(a) Confocal section of a tapeworm anterior. Cycling cells (mcm2: magenta) in the neck parenchyma are between the nerve cords (cadherin: green). s: sucker, nc: nerve cord, oc: osmoregulatory canal, t: tegument, m: muscle, and p: parenchyma. (b) WISH of known cycling-cell markers h2b and mcm2. sc: scolex (head) and n: neck. (c) WISH for irradiation-sensitive transcripts expressed in the neck parenchyma. (d) Confocal sections of dFISH for irradiation-sensitive transcripts (green) with h2b or mcm2 (magenta) from neck parenchyma. Cyan arrowheads indicate cells magnified at the far right.
Figure 3—figure supplement 1
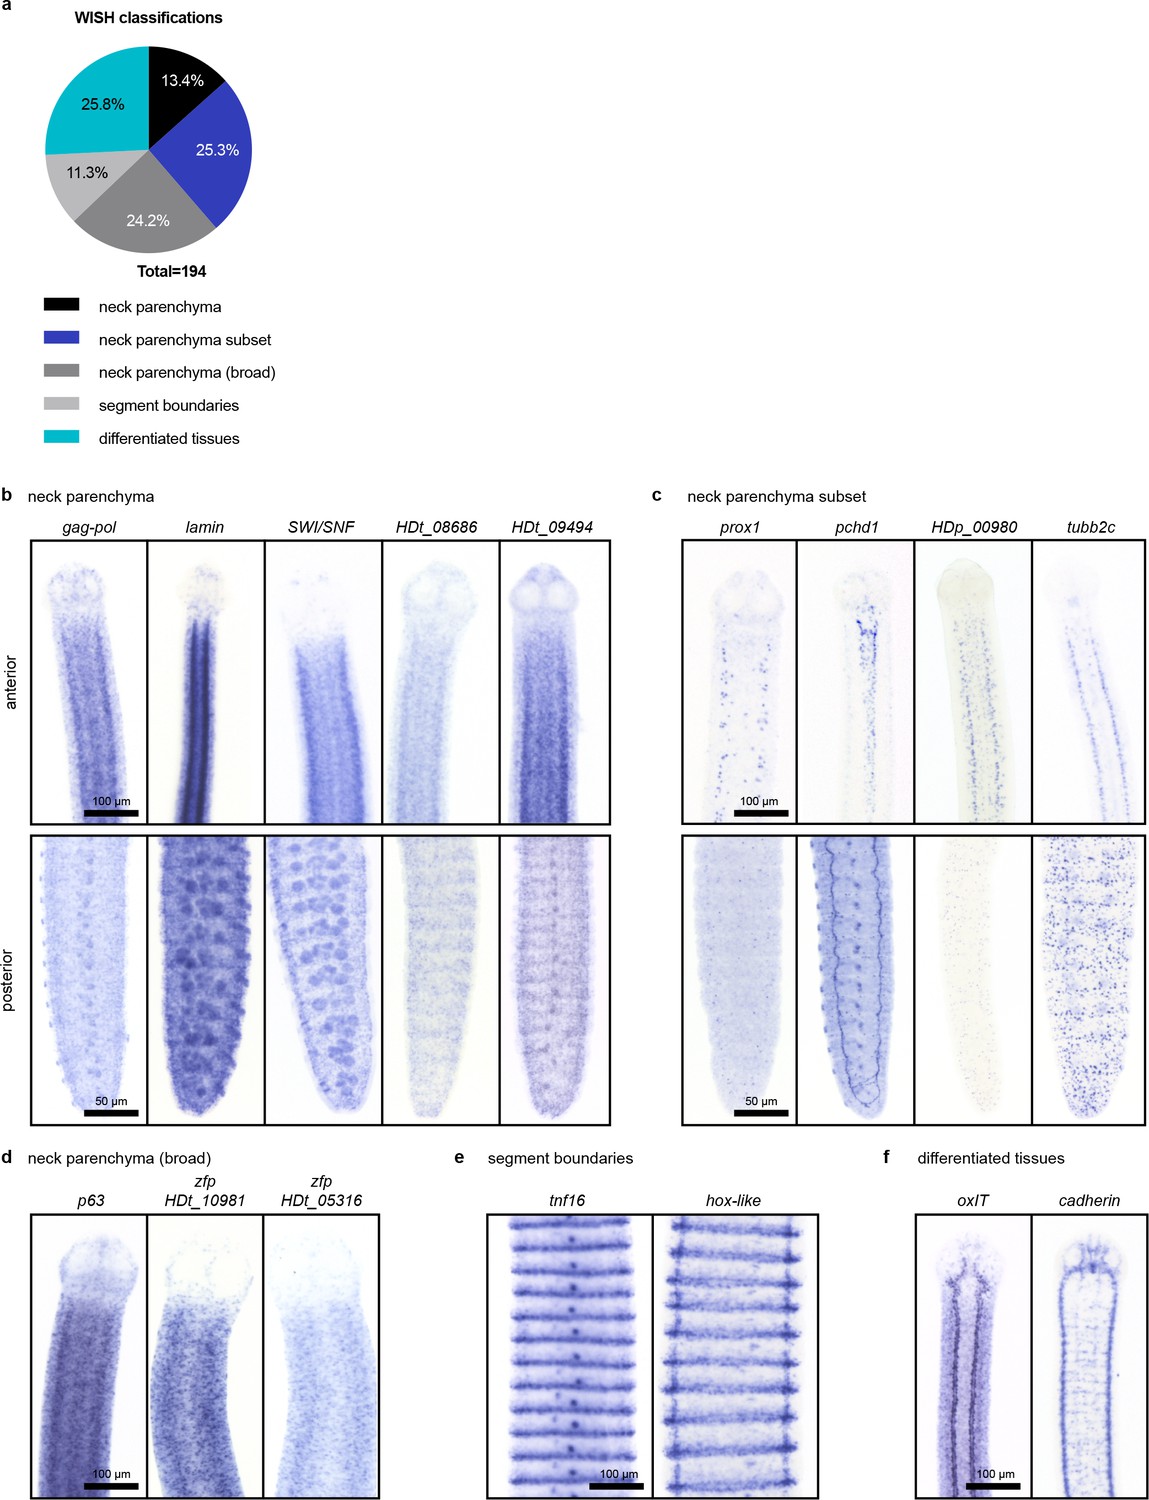
WISH patterns of irradiation-sensitive transcripts identified using RNA-seq.
(a) Classification of WISH expression patterns of irradiation-sensitive transcripts. (b–f) Examples of transcripts expressed in the neck parenchyma (b) in subsets of cells within the neck (c) in neck parenchyma and broadly toward the animal edge where differentiated muscle and tegument are located (d) at segment boundaries (e) and in differentiated tissues (f) like the osmoregulatory canals (left) and nervous system (right).
Figure 3—figure supplement 2
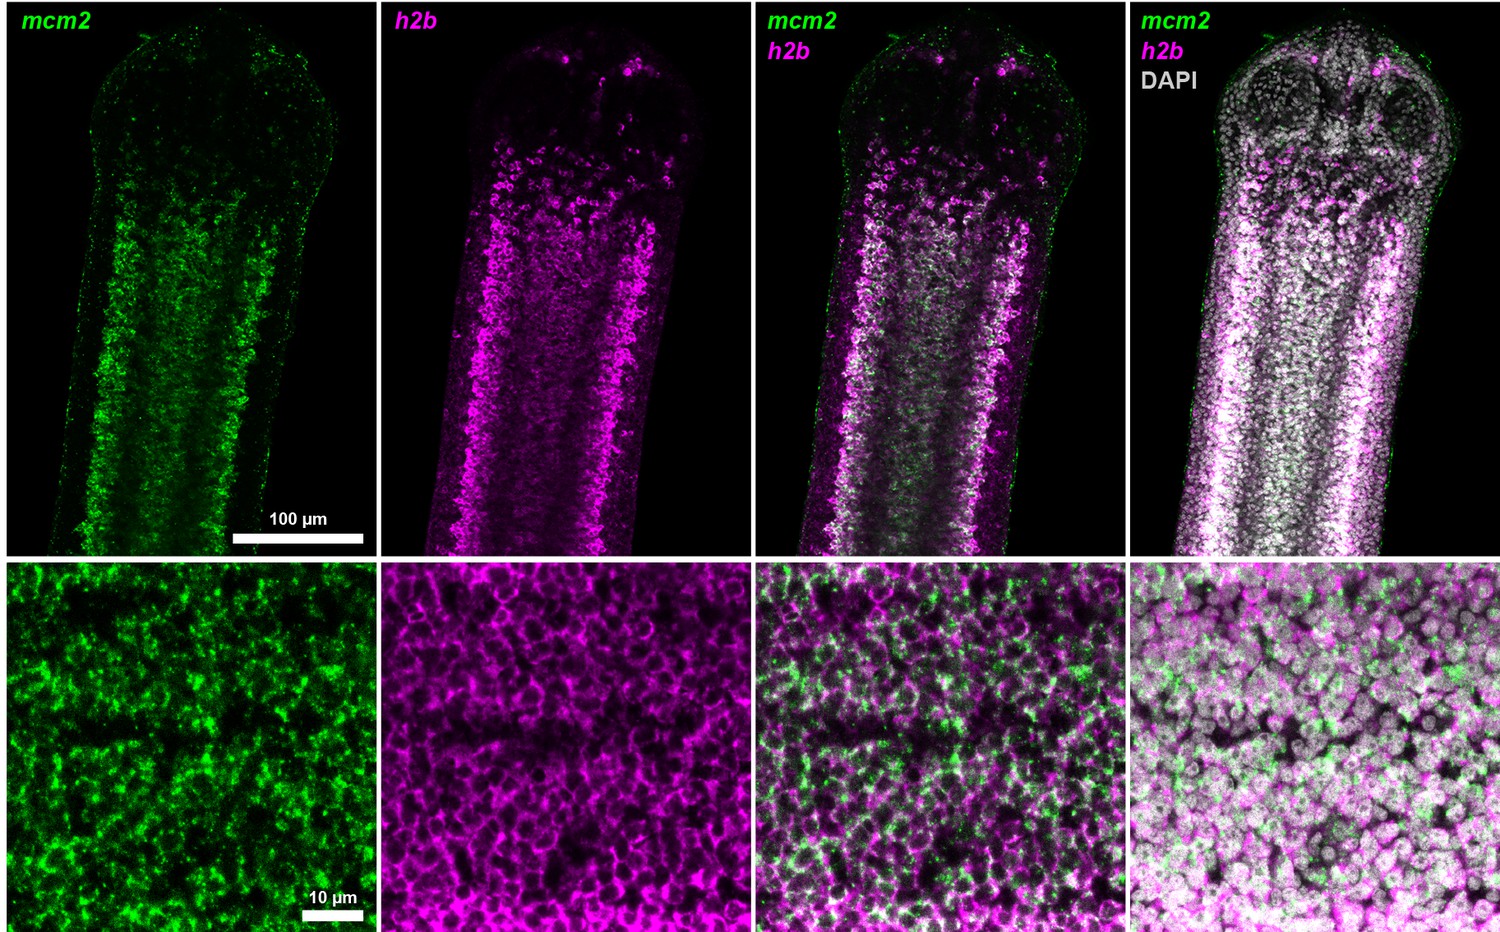
Coexpression of mcm2 and h2b.
Confocal section of dFISH to detect mcm2 (green) and h2b (magenta) in the neck parenchyma at low (top) and high (bottom) magnification.
Figure 3—figure supplement 3
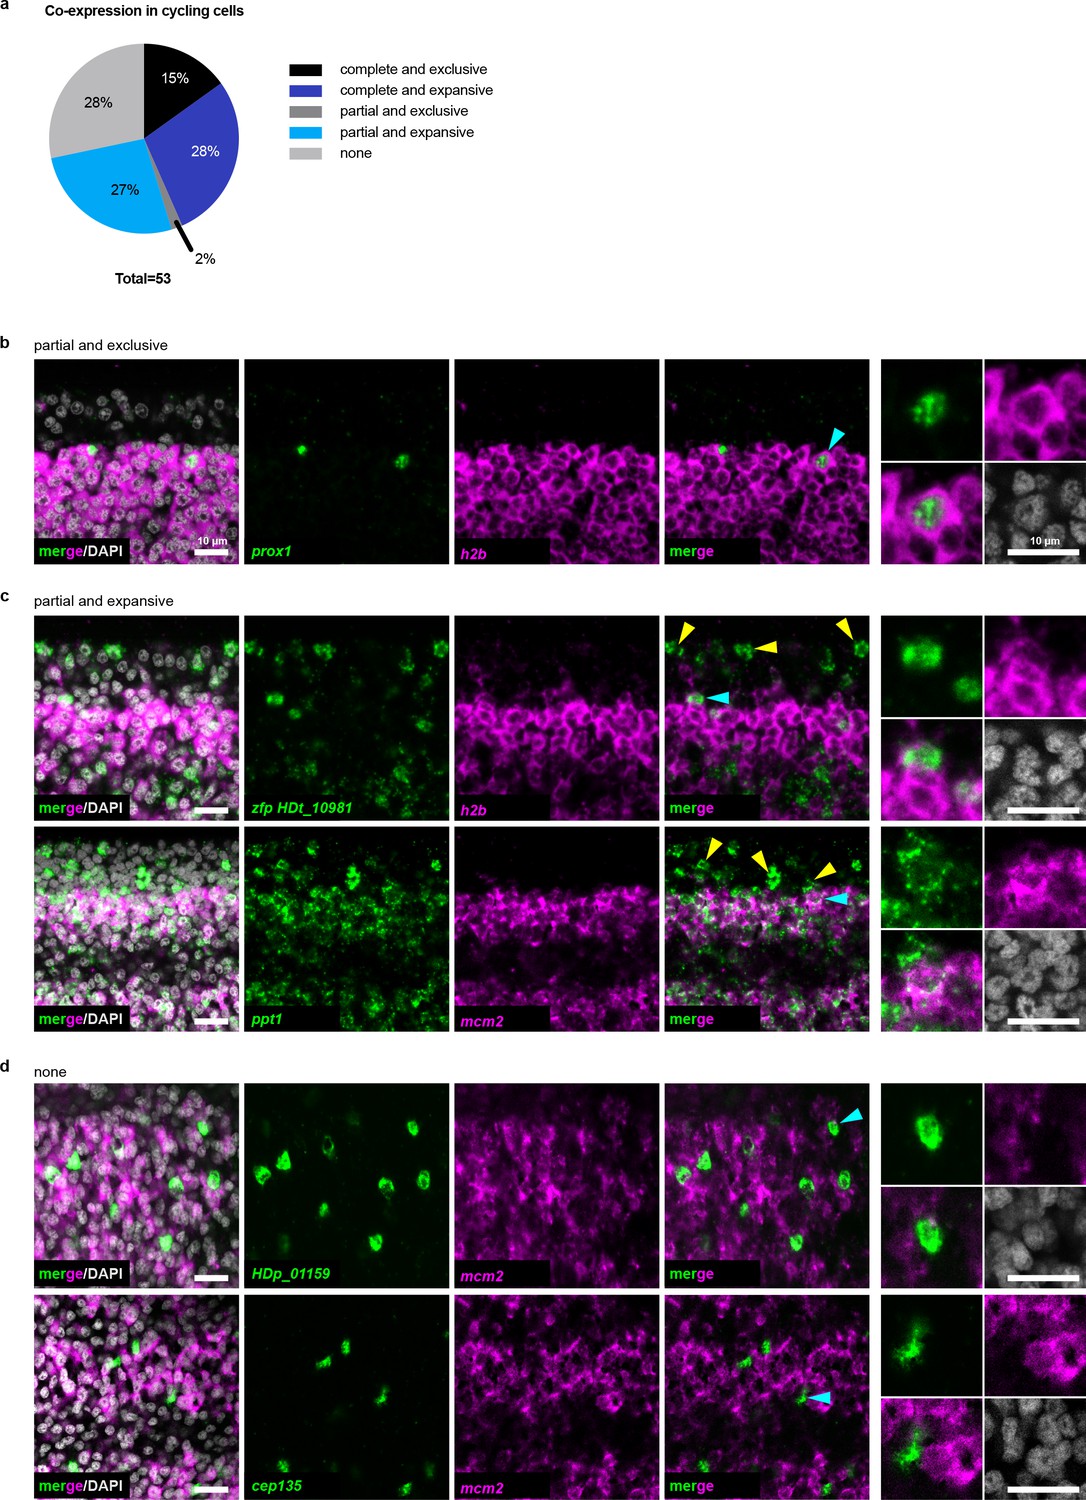
The cycling somatic cell population is heterogeneous.
(a) Summary of different co-expression patterns obtained from 53 dFISH experiments. Also refer to Supplementary file 1b. (b–d) Confocal sections of dFISH to detect irradiation-sensitive transcripts (green) with h2b or mcm2 (magenta). Cyan arrowheads indicate cells magnified at the far right. For (c) yellow arrowheads point to examples of expression in non-cycling cells.
Figure 4 with 2 supplements
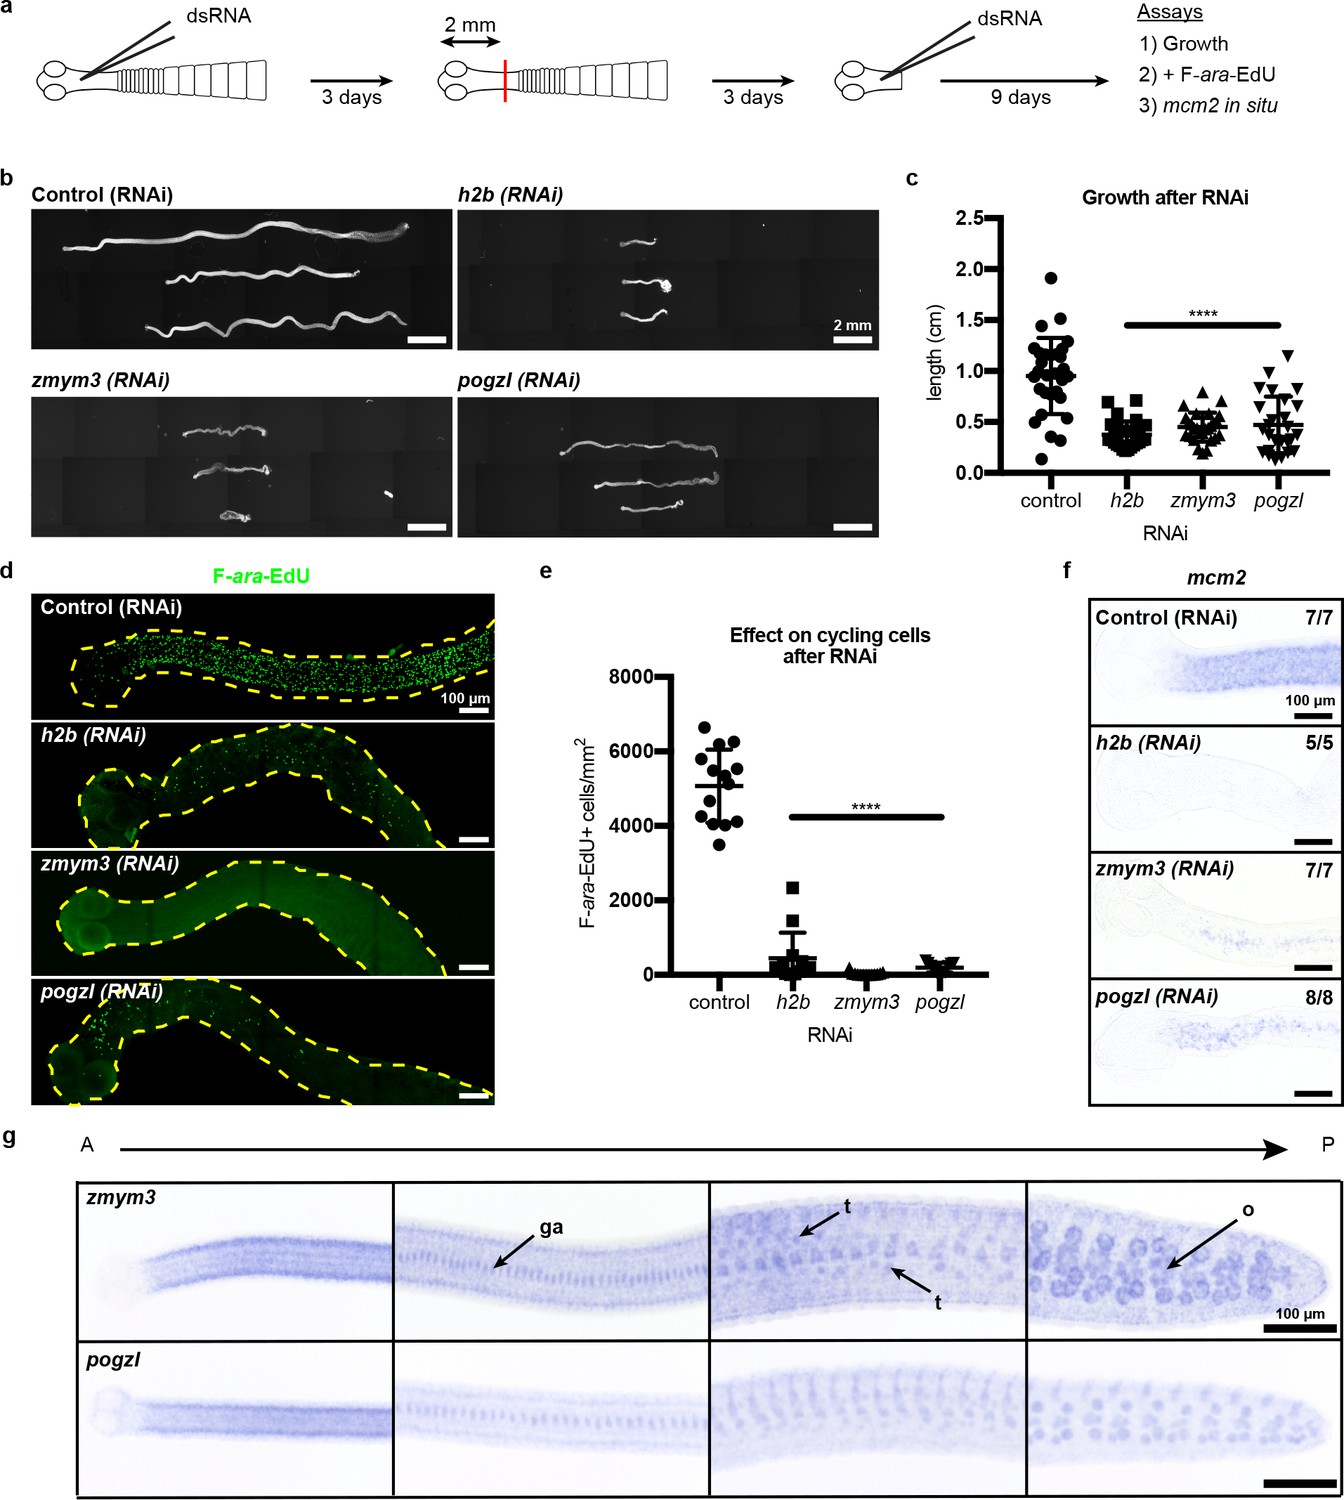
RNAi to identify genes required for growth and regeneration in H. diminuta.
(a) Schematic of RNAi paradigm. (b) DAPI-stained worms after RNAi knockdown of h2b, zmym3, and pogzl. (c) Quantification of worm lengths after RNAi. Error bars = SD, N = 3–4, n = 26–37, one-way ANOVA with Dunnett’s multiple comparison test compared to control. (d-e) Maximum-intensity projections (d) and quantification (e) of cycling-cell inhibition after 1 hr F-ara-EdU uptake following RNAi. Worms with degenerated necks were excluded from analysis. Error bars = SD, N = 3, n = 11–14, one-way ANOVA with Dunnett’s multiple comparison test compared to control. (f) mcm2 WISH on worm anteriors after RNAi. (g) WISH of zmym3 and pogzl sampled from anterior to posterior of adult 6-day-old worms. ga: genital anlagen; t: testis; o: ovary.
Figure 4—figure supplement 1
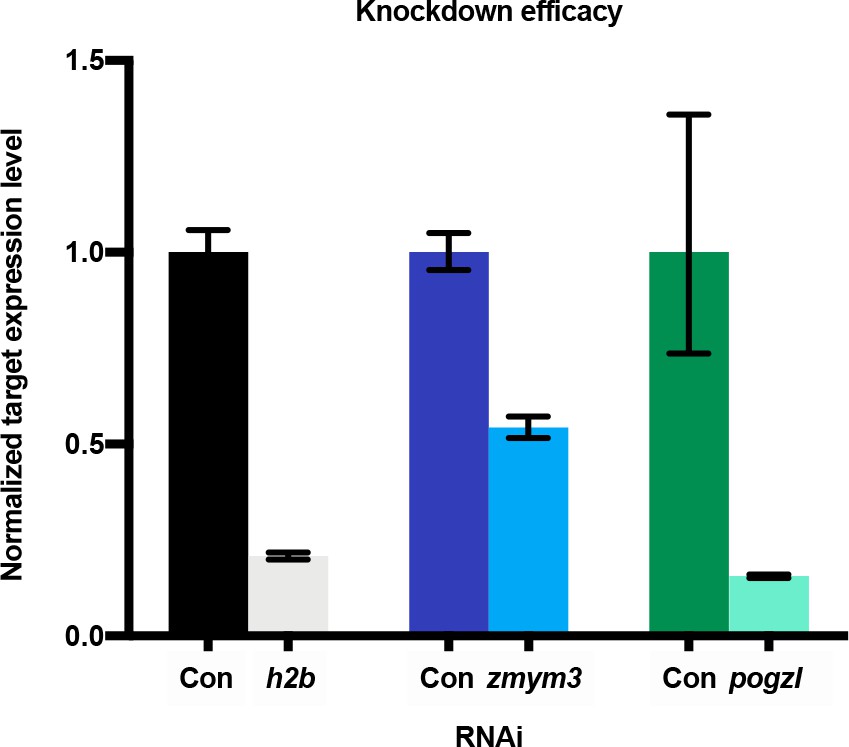
Validation of target gene knockdown by quantitative PCR.
Knockdown of h2b, zmym3, or pogzl in whole worms observed after RNAi. Error bars: RQ min/max, N = 2, n = 3 each.
Figure 4—figure supplement 2
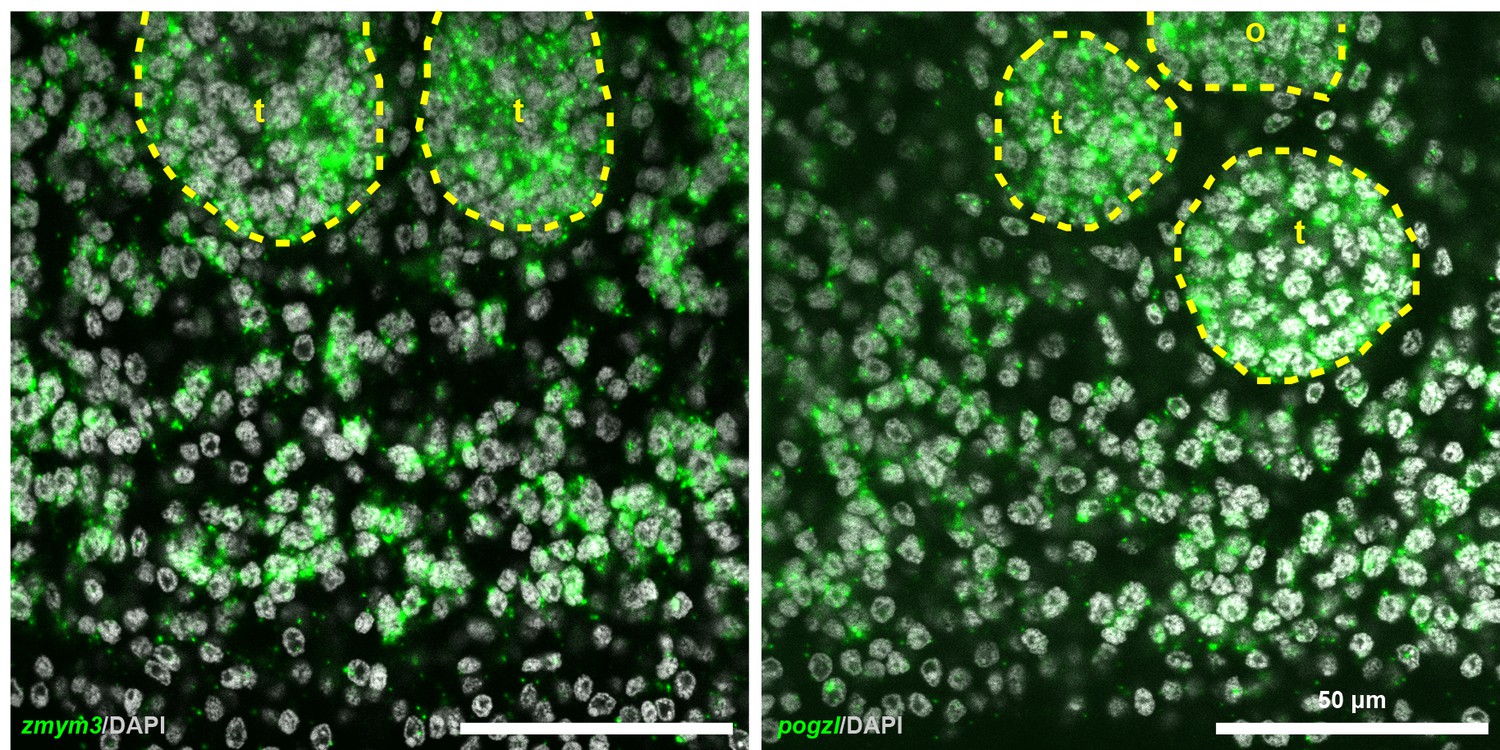
Expression of zmym3 and pogzl in posterior proglottids.
Confocal sections of in situ hybridizations showing expression of cycling-cell transcripts in the gonads as well as in the non-gonadal parenchyma. t: testis and o: ovary.
Figure 5
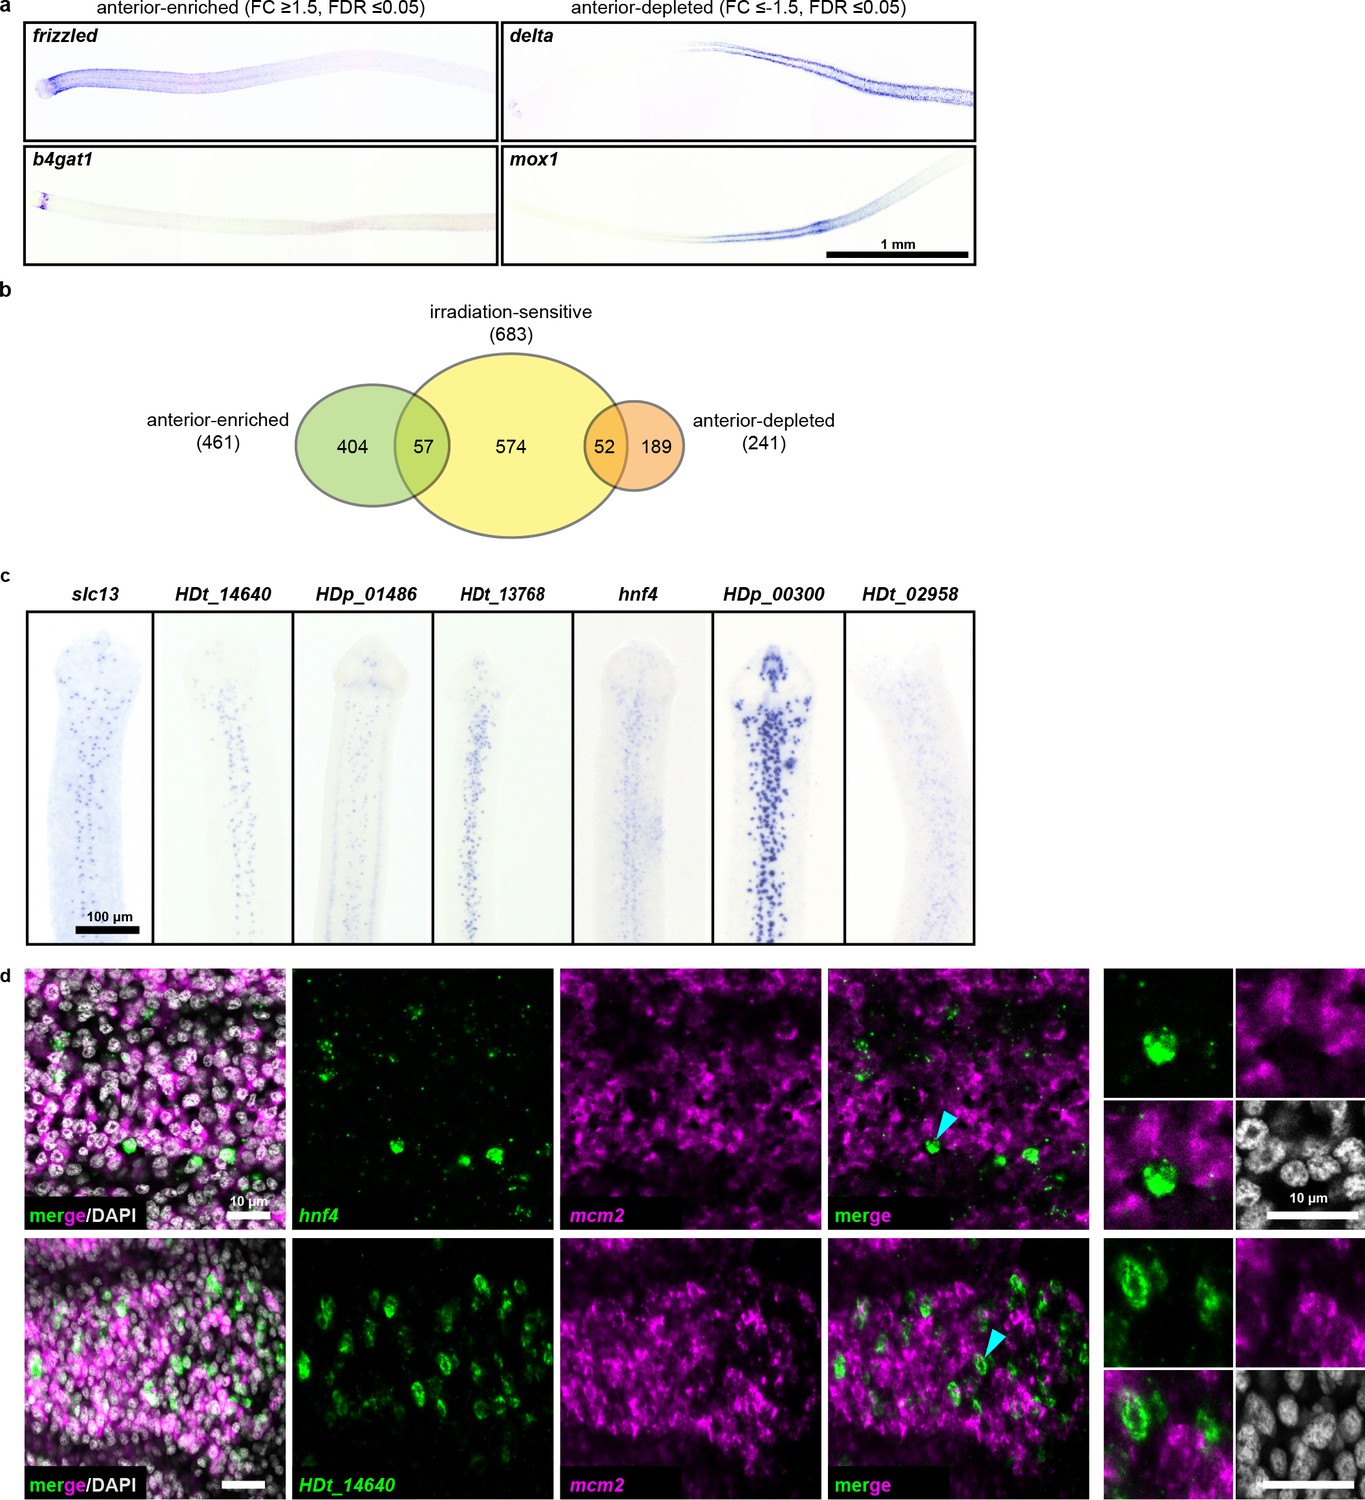
RNA-seq identifies anterior-enriched transcripts that are expressed predominantly in non-cycling cells.
(a) WISH of tapeworm anteriors for transcripts that were anterior-enriched (FC ≥1.5, FDR ≤ 0.05) or -depleted (FC ≤−1.5, FDR ≤ 0.05) by RNA-seq. Panels oriented anterior facing left. (b) Differential gene expression analyses of 1 mm anterior, middle, and posterior neck fragments overlaid with irradiation-sensitive transcripts. (c) WISH of transcripts that were anterior-enriched and irradiation-sensitive by RNA-seq that showed expression in a subset of cells in the neck parenchyma. (d) Confocal sections from dFISH of anterior-enriched transcripts (green) and mcm2 (magenta). Cyan arrowheads indicate cells that are magnified at the far right.
Figure 6 with 2 supplements

Stem cell activity depends on cycling cells but is not confined to cells from the neck.
(a-b) DAPI-stained worms after rescue with cell transplantations from whole-worm donors (a) or sourced from depicted donors (b). (c) Quantification of rescue phenotypes from pooled experiments. Number of animals listed above bars. (d) Model for head-dependent neck maintenance and proglottid formation. (e) Models of head-dependent or -independent stem cell niches.
Figure 6—figure supplement 1
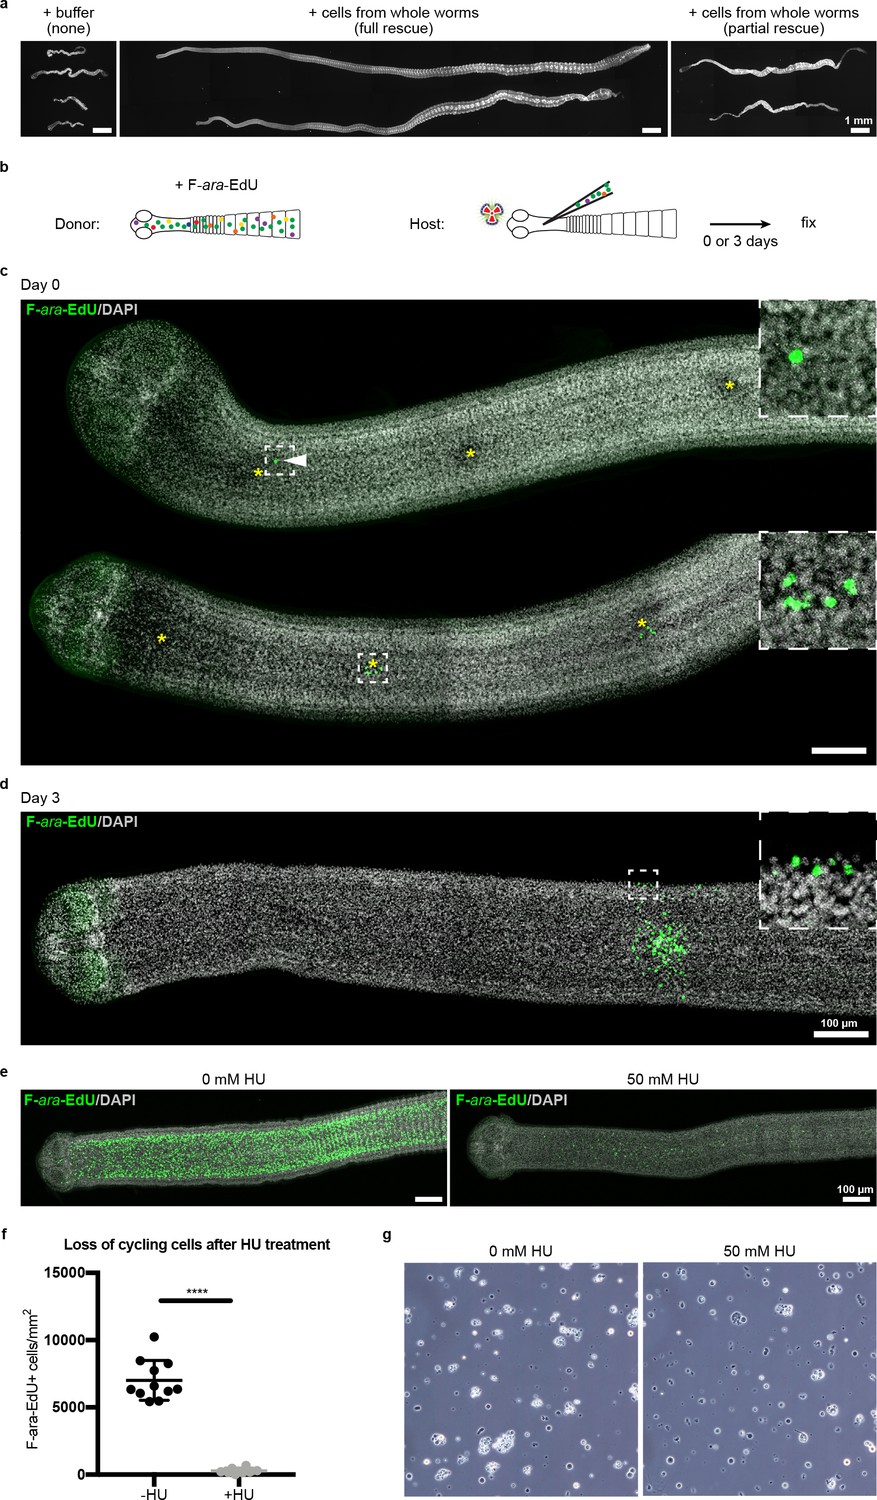
Stem cell activity depends on cycling cells.
(a) DAPI-stained worms showing phenotypes observed after attempted rescue of irradiation-induced lethality. No rescue results in degenerated worms with no proglottids, full rescue results in normal worms with multiple proglottids, and partial rescue refers to worms with visible proglottids but with defects such as contracted necks. (b) Schematic for rescue experiment using donors with labeled cycling cells. (c–d) Maximum-intensity projections of tile-stitched confocal sections 0 or 3 days post-transplantation according to (b). Injections sites marked with asterisks. White arrowhead points to a single transplanted cell. After 3 days, large colonies of F-ara-EdU+ (green) cells could be detected with some labeled cells incorporated into terminally differentiated tissues at the animal edge (inset). (e) Maximum-intensity projections of tile-stitched confocal sections after 1 hr F-ara-EdU uptake (green) from control worms or worms cultured with hydroxyurea (HU) for 6 days. (f) Quantification of cycling cells from (e). Error bars = SD, N = 3, n = 11 and 8, Student’s t-test. (g) Cell morphology with or without HU treatment prior to transplantation.
Figure 6—figure supplement 2
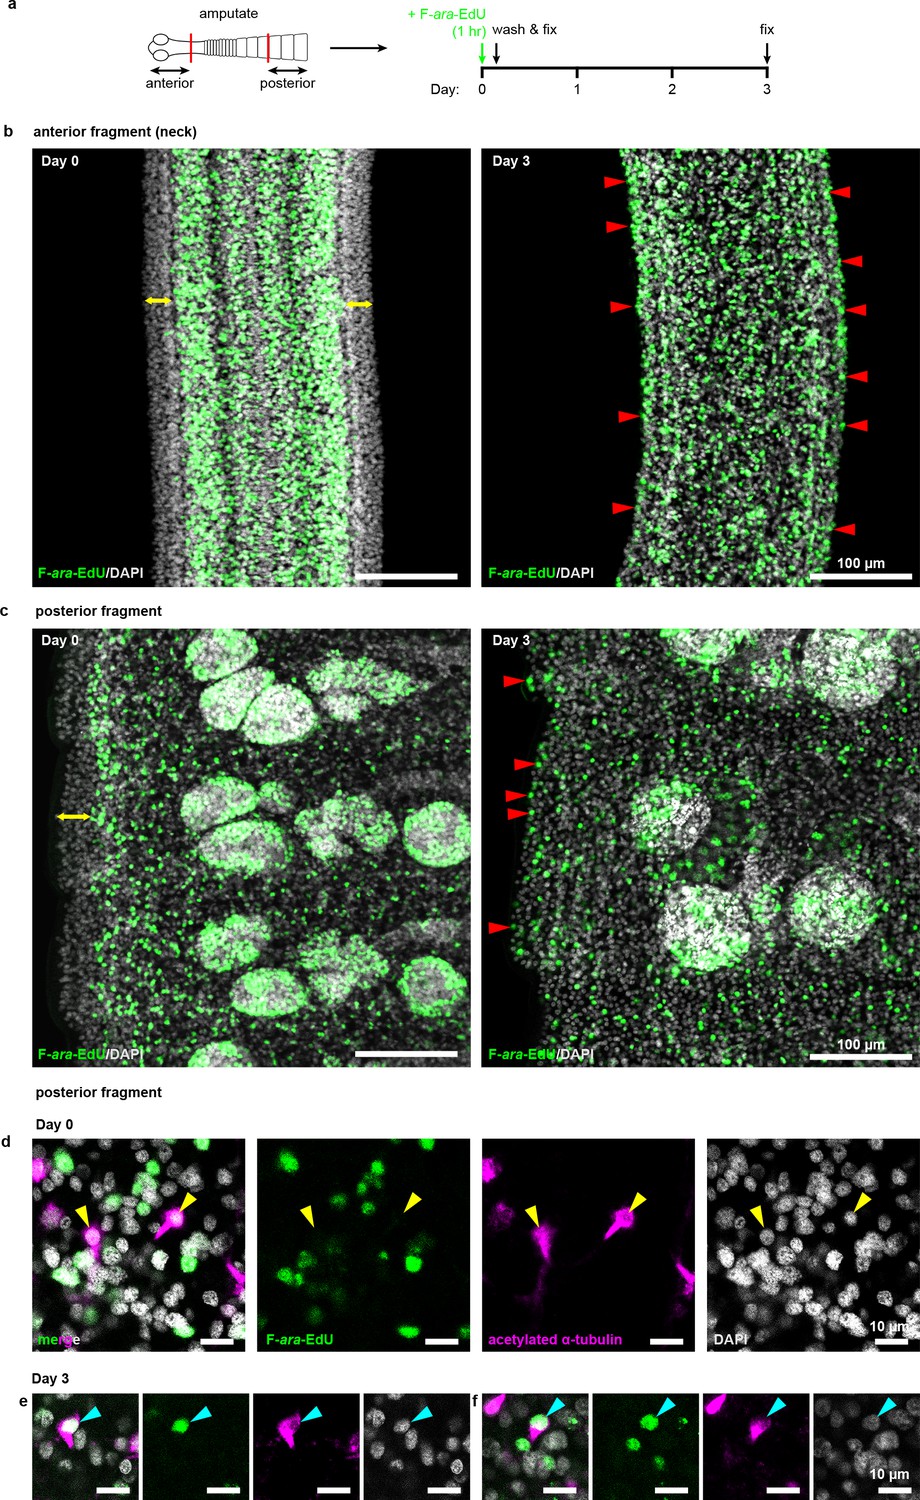
Cycling cells give rise to multiple lineages in both anterior and posterior fragments.
(a) Schematic of F-ara-EdU pulse-chase protocol to label cycling cells from 2 mm amputated fragments and detect their progeny after 3 days. (b–c) Confocal sections of both anterior and posterior fragments on day 0 showing the absence of F-ara-EdU (green) at the animal edge (yellow double-headed arrows) where differentiated muscle and tegument are located. After 3 days, F-ara-EdU has chased into the edge-most nuclei (examples marked by red arrowheads). (d-f) Confocal sections from posterior fragments after F-ara-EdU pulse-chase in combination with acetylated α-tubulin antibody staining to label flame cells (magenta). Yellow arrowheads point to F-ara-EdU- flame cell nuclei at day 0 (d) which are exclusively post-mitotic. Cyan arrowheads point to two examples of flame cell nuclei that are F-ara-EdU+ after 3 days chase (e–f).
Tables
Key resources table
| Reagent type (species) or resource | Designation | Source or reference | Identifiers | Additional information |
|---|---|---|---|---|
| Strain, (Hymenolepis diminuta) | BioSample accession SAMN11958994 | Carolina Biologicals | Cat# 132232 | |
| Antibody | anti-Oregon Green 488-HRP antibody (rabbit polyclonal) | Invitrogen | A21253 | IF(1:1000) |
| Antibody | anti-DIG-AP (sheep polyclonal) | Sigma Aldrich | Cat# 11093274910 | IF(1:2000) |
| Antibody | anti-DIG-POD (sheep polyclonal) | Sigma Aldrich | Cat#: 11207733910 | IF(1:2000) |
| Antibody | anti-DNP-HRP (rabbit polyclonal) | Vector Laboratories | Cat#: MB-0603 | IF(1:2000) |
| Antibody | anti-acetylated α-tubulin (mouse monoclonal) | Santa Cruz | Cat#: sc-23950 | IF(1:500) |
| Sequence-based reagent | PCR primers | This paper | Supplementary file 1E | |
| Sequence-based reagent | Transcriptome Shotgun Assembly (Hymenolepis diminuta) | DDB/ENA/Genbank | GHNR01000000 | |
| Sequence-based reagent | Sequence Read Archives for transcriptome assembly | DDB/ENA/Genbank | PRJNA546290 | SRX6045715- SRX6045719 |
| Sequence-based reagent | Sequence Read Archives for differential gene expression | DDB/ENA/Genbank | PRJNA546293 | SRX6064929- SRX6064933 |
| Recombinant DNA reagent | Plasmid- pJC53.2 | Addgene | 26536 | |
| Chemical compound, drug | F-ara-EdU | Sigma Aldrich | T511293 | 0.1 μM (in 1% final DMSO concentration) |
| Chemical compound, drug | Oregon green 488-azide | Invitrogen | O10180 | 100 μM |
| Chemical compound, drug | Hydroxyurea | Sigma Aldrich | Cat#: H8627 | 50 mM |
Additional files
-
Supplementary file 1
Supplementary file 1a Irradiation-sensitive transcripts identified by RNA-seq.
Supplementary file 1b Summary of dFISH experiments with irradiation-sensitive transcripts and cycling cell markers h2b and/or mcm2. Supplementary file 1c Comparative analysis of verified tapeworm cycling-cell transcripts to gene expression datasets for planarian neoblasts. Supplementary file 1d Anterior-enriched and anterior-depleted neck transcripts by RNA-seq. Supplementary file 1e Sequences and primers for all genes reported.
- https://doi.org/10.7554/eLife.48958.020
-
Transparent reporting form
- https://doi.org/10.7554/eLife.48958.021
-
Reporting standard 1
MINSEQE: Minimum Information about a high-throughput Nucleotide SeQuencing Experiment - a proposal for standards in functional genomic data reporting.
- https://cdn.elifesciences.org/articles/48958/elife-48958-repstand1-v2.pdf
Download links
A two-part list of links to download the article, or parts of the article, in various formats.
Downloads (link to download the article as PDF)
Open citations (links to open the citations from this article in various online reference manager services)
Cite this article (links to download the citations from this article in formats compatible with various reference manager tools)
Region-specific regulation of stem cell-driven regeneration in tapeworms
eLife 8:e48958.
https://doi.org/10.7554/eLife.48958


