Neural tracking of speech mental imagery during rhythmic inner counting
- Peking University, China
- Sanbo Brain Hospital, Capital Medical University, China
- The University of Hong Kong, China
Figures
Figure 1

Sensor-level responses in neural tracking of speech mental imagery.
(a) Under the mental imagery condition (left), a sequence of pure tones was presented with 250 ms onset-to-onset intervals. The participants were asked to loudly count in their minds by grouping every five numbers (with the imagery task), forming an imagery-rate frequency of 0.8 Hz and a stimulus-rate frequency of 4 Hz. Under the baseline condition (right), the participants passively listened to the same sounds without performing a task. (b) Significant spectral peaks were found at 0.8 Hz and its harmonics under the mental imagery condition, and significant 4 Hz peaks were found under both conditions (paired one-sided t test, FDR corrected). The topographic distribution was right-lateralized at 4 Hz but not at 0.8 Hz. The shaded area represents the standard error (SE). ***p<0.001, *p<0.05, m.s. represents marginally significant.
-
Figure 1—source data 1
MEG sensor-level responses data.
- https://doi.org/10.7554/eLife.48971.003
Figure 2
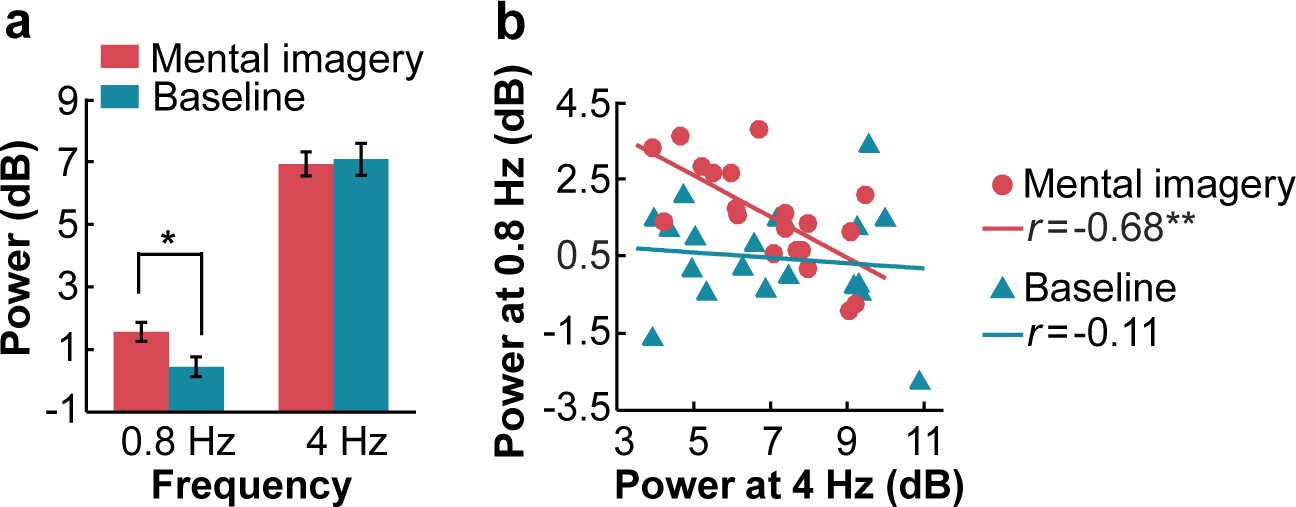
Power of spectral peaks at the imagery-rate frequency and stimulus-rate frequency.
(a) Mental imagery increased the peak power at the imagery-rate frequency of 0.8 Hz. No significant difference in peak power at 4 Hz was observed between the conditions. (b) A significant negative correlation was observed between the grand averaged power at 4 Hz and 0.8 Hz under the mental imagery condition but not under the baseline condition. **p<0.01, *p<0.05.
-
Figure 2—source data 1
Data for the power of spectral peaks.
- https://doi.org/10.7554/eLife.48971.005
Figure 3
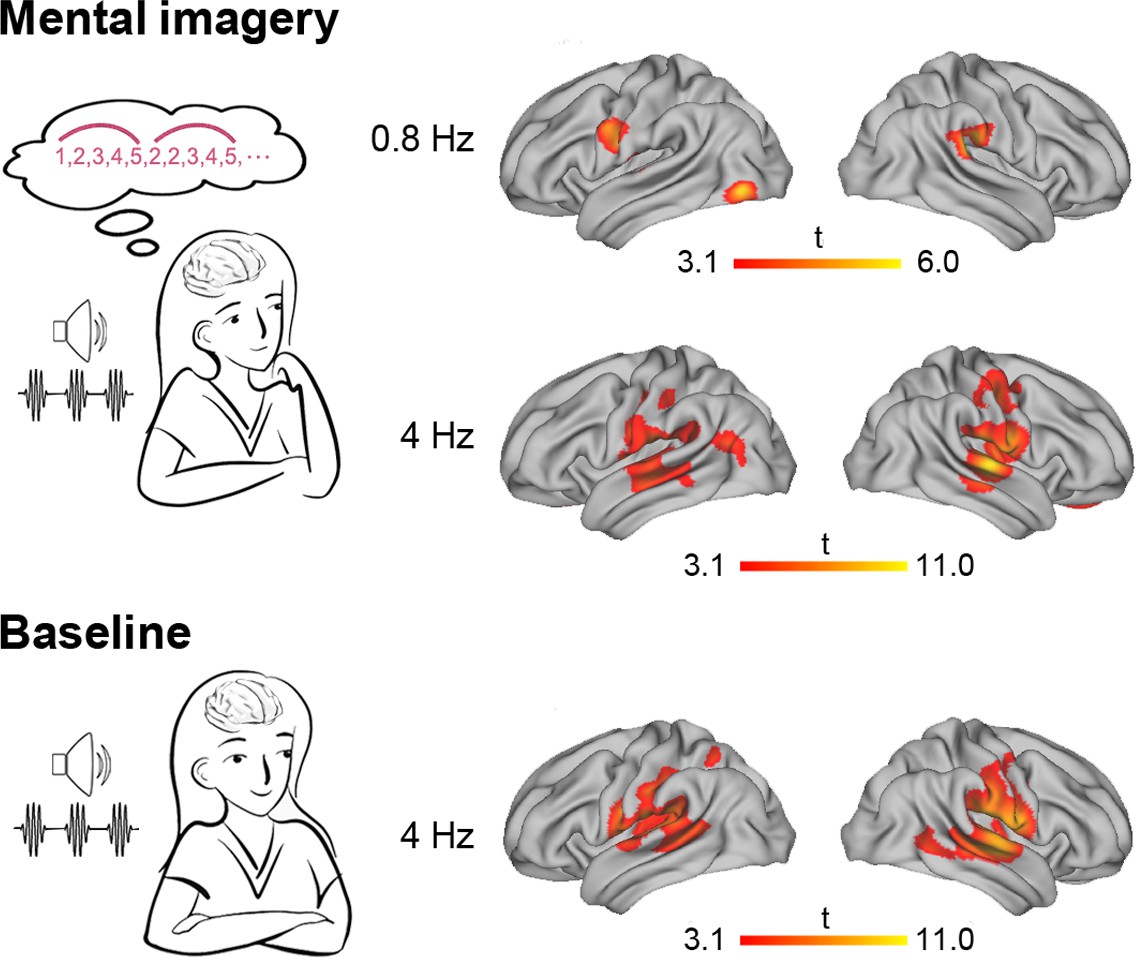
Source-level brain activation at the imagery-rate frequency and stimulus-rate frequency.
Under the mental imagery condition (upper panel), the left central-frontal lobe, the left inferior occipital gyrus and the right inferior parietal lobe were activated at an imagery-rate frequency of 0.8 Hz, and a distributive brain network extending from the auditory cortex to the frontal and parietal regions was activated at a stimulus-rate frequency of 4 Hz (cluster level p<0.01, FWE corrected with a voxel-level threshold of p<0.001). Under the baseline condition (lower panel), stimulus-induced brain activation centring in the auditory temporal cortex was observed at 4 Hz.
Figure 4
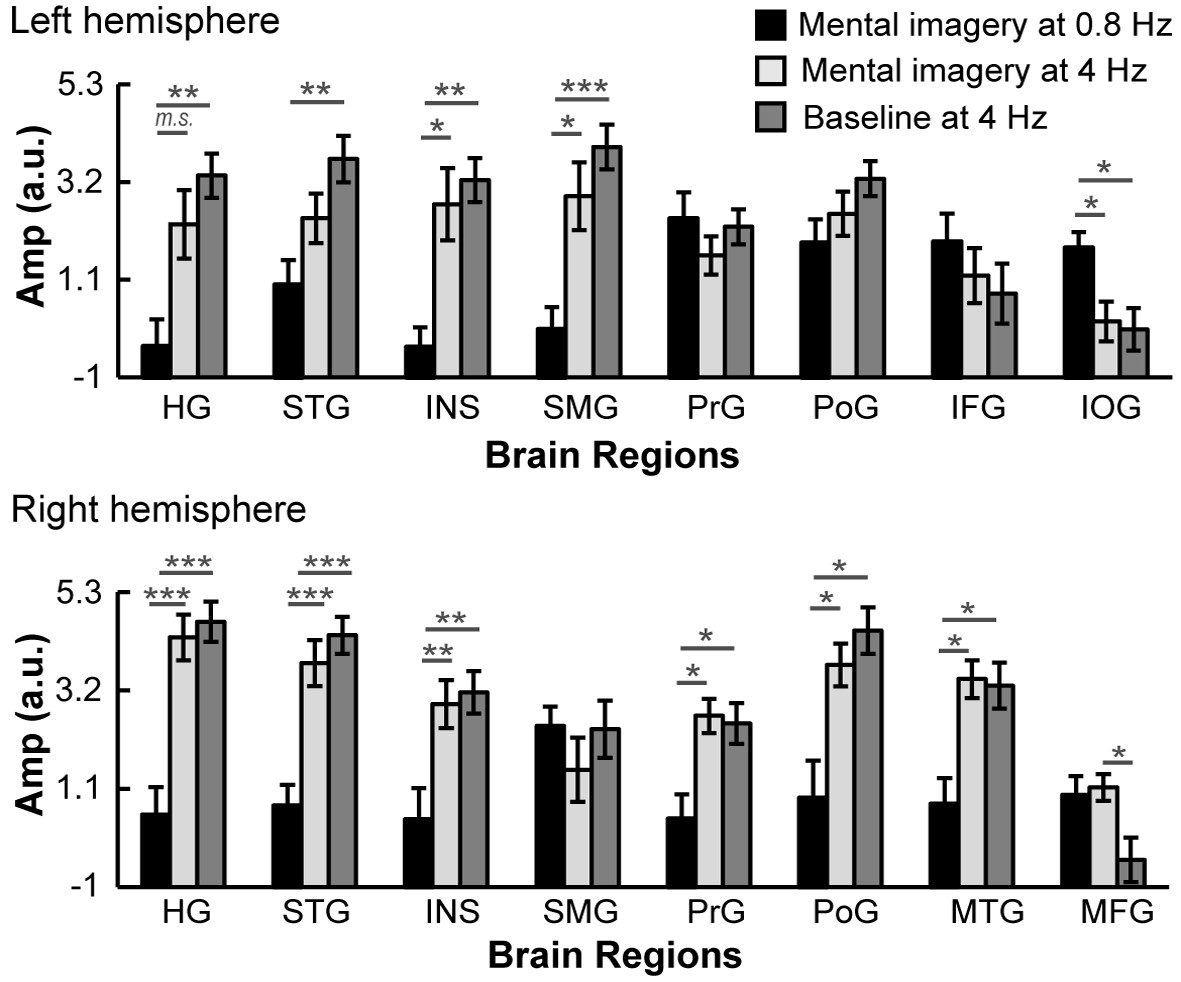
Comparisons of ROI activation among three significant spectral peaks.
The brain activation in the left IOG at 0.8 Hz under the mental imagery condition was stronger than that at 4 Hz. The brain activation in the right MFG at 4 Hz under the mental imagery condition was stronger than that under the baseline condition. In the left HG, left STG, left INS, left SMG, right HG, right STG, right INS, right PrG, right PoG and right MTG, the activation at 4 Hz under the mental imagery condition and/or the baseline condition was stronger than that at 0.8 Hz under the mental imagery condition. Multiple comparisons were Bonferroni corrected. ***p<0.001, **p<0.01, *p<0.05, m.s. represents marginally significant.
-
Figure 4—source data 1
ROI activation data.
- https://doi.org/10.7554/eLife.48971.009
Figure 5 with 1 supplement
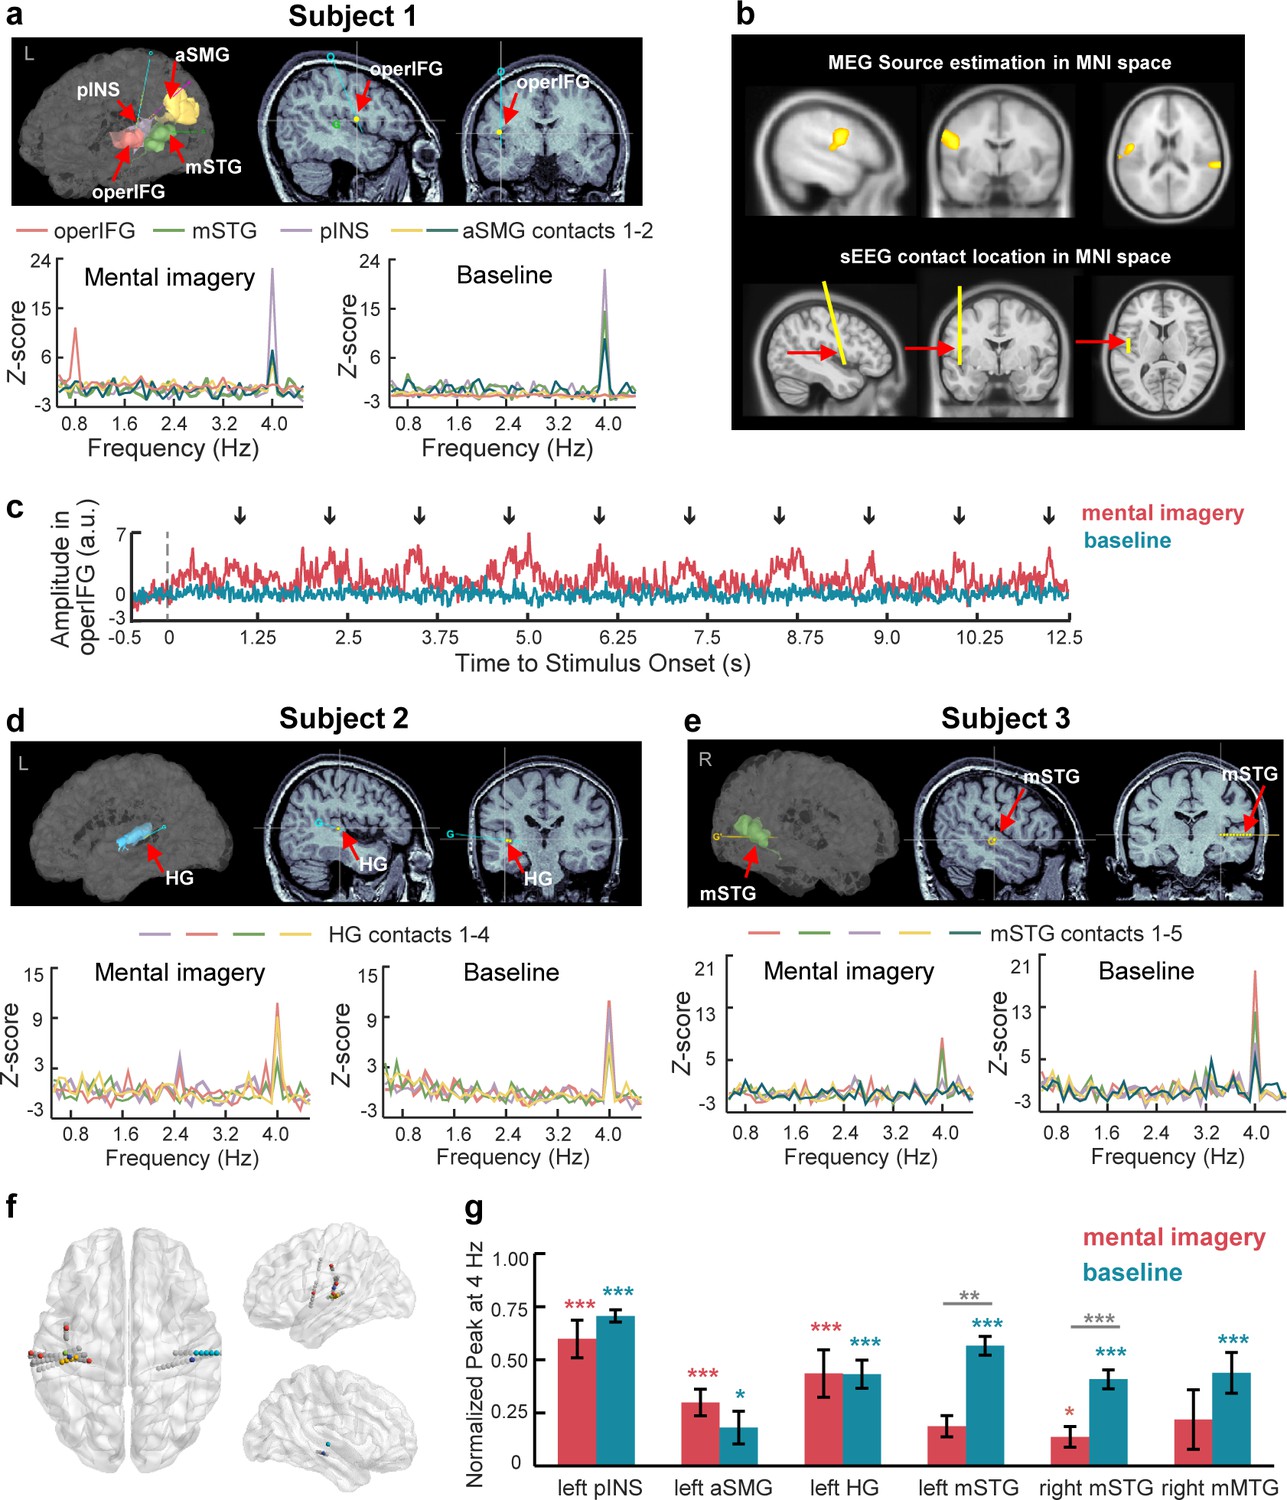
SEEG responses to speech mental imagery.
(a) Subject one with contacts in the left operIFG, middle STG, posterior INS and anterior SMG. Significant spectral responses at 0.8 Hz were detected in the operIFG, and the remaining contacts were responsive to the 4 Hz frequency. (b) The cluster including the operIFG from MEG sources is presented in the upper panel. The electrode with contact in the operIFG in Subject one was projected in the MNI space and is shown in the lower panel. SEEG localization supports the MEG source estimation results. (c) Averaged time course of high gamma activity in the operIFG in Subject 1. Periodical changes presented every 1.25 s (0.8 Hz) with increasing amplitude near the onset of the last number (black arrow) in each mentally constructed group under the mental imagery condition (red line) but not the baseline condition (blue line). (d) Subject two with contacts in the left HG. Significant spectral peaks were observed at 4 Hz in the HG. (e) Subject three with contacts in the right middle STG. Significant spectral peaks were observed at 4 Hz in the middle STG. (f) Contact locations in the MNI space. Different colored marks represent each subject’s responsive contacts with significant spectral peaks at 0.8 Hz and/or 4 Hz. Gray marks represent non-responsive contacts with no significant spectral peaks. (g) In each brain region with contacts responsive at 4 Hz, the normalized peaks were significantly larger than zero under the baseline condition (blue stars). Among these peaks, the normalized peaks were significant in the left posterior INS, left anterior SMG, left HG and right middle STG (red stars). The peaks in the bilateral middle STG were smaller under the mental imagery condition than the baseline condition (gray stars). ***p<0.001, **p<0.01, *p<0.05.
-
Figure 5—source data 1
sEEG response data.
- https://doi.org/10.7554/eLife.48971.012
Figure 5—figure supplement 1
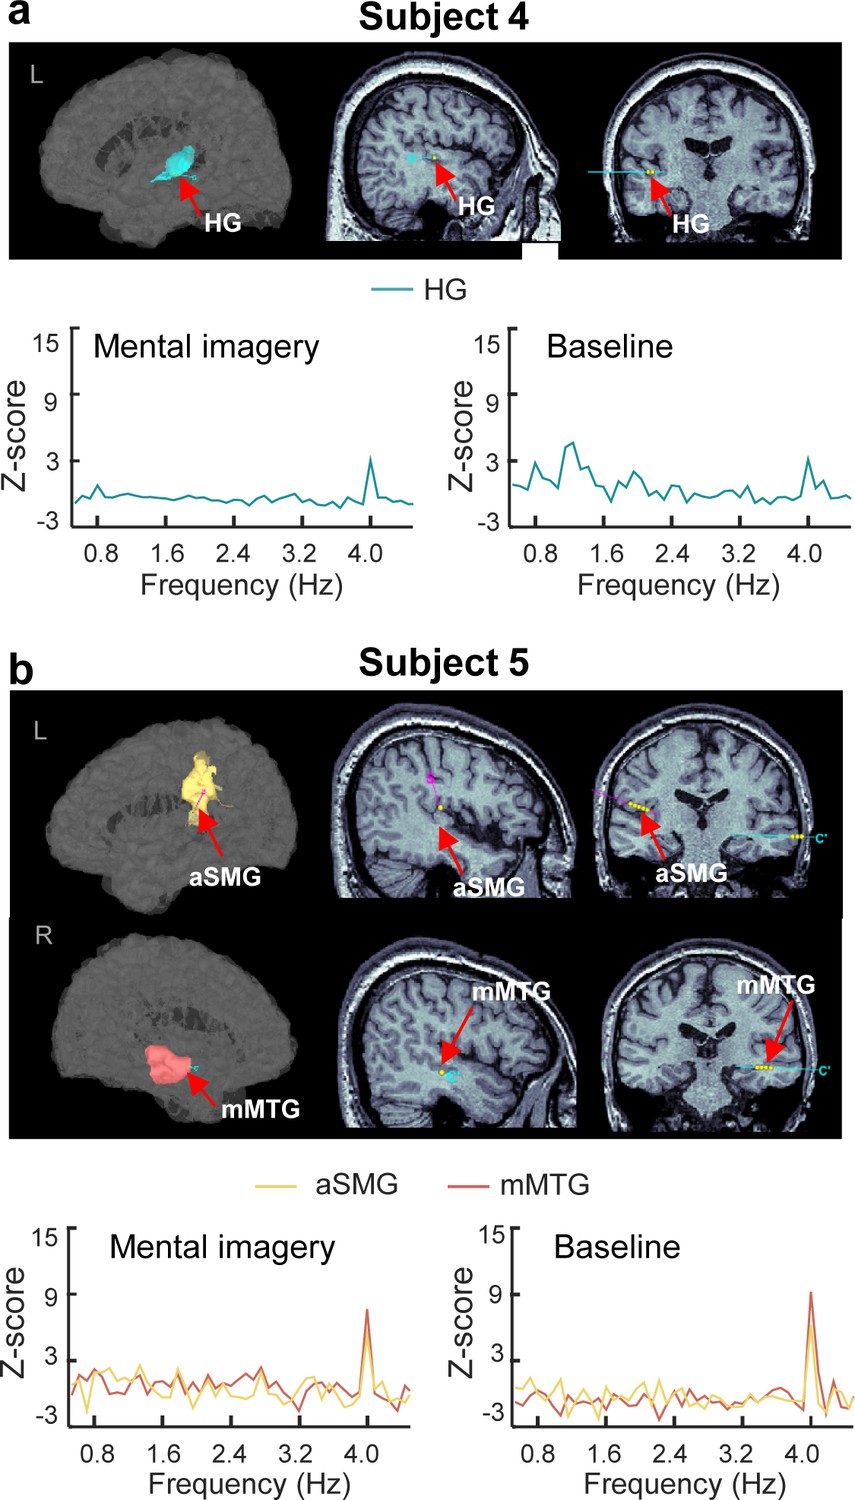
SEEG results of subjects 4–5.
(a) Subject four with a contact in the left HG. A significant spectral peak was observed at 4 Hz in the imagery condition. (b) Subject five with contacts in the left anterior SMG and right middle MTG. Significant spectral peaks were observed at 4 Hz in the anterior SMG under both conditions and in the middle MTG under the baseline condition.
Tables
Table 1
Major brain activity at the source level.
https://doi.org/10.7554/eLife.48971.006| Brain region | Peak MNI coordinate | T value | ||
|---|---|---|---|---|
| X | Y | Z | ||
| Imagery condition at 0.8 Hz | ||||
| R postcentral gyrus | 56 | −22 | 29 | 4.0 |
| L postcentral gyrus | −51 | -7 | 23 | 4.9 |
| L precentral gyrus | −50 | -6 | 21 | 4.7 |
| L inferior frontal gyrus | −46 | 3 | 28 | 3.2 |
| L inferior occipital gyrus | −40 | −75 | -6 | 5.3 |
| R supramarginal gyrus | 60 | −31 | 24 | 6.0 |
| Imagery condition at 4 Hz | ||||
| R superior temporal gyrus | 61 | −12 | 8 | 10.9 |
| L superior temporal gyrus | −51 | -5 | 5 | 5.7 |
| R middle temporal gyrus | 67 | −19 | -3 | 8.5 |
| L Heschl’s gyrus | −50 | -7 | 5 | 5.3 |
| R Heschl’s gyrus | 58 | −10 | 8 | 10.3 |
| R postcentral gyrus | 59 | −16 | 17 | 8.2 |
| L postcentral gyrus | −57 | −19 | 17 | 6.4 |
| R precentral gyrus | 55 | 0 | 19 | 7.3 |
| L precentral gyrus | −50 | -6 | 21 | 4.7 |
| R insula | 46 | −10 | 8 | 6.9 |
| L insula | −46 | -9 | 2 | 3.8 |
| R middle frontal gyrus | 6 | 50 | −11 | 4.0 |
| L supramarginal gyrus | −58 | −21 | 17 | 6.2 |
| Baseline condition at 4 Hz | ||||
| R superior temporal gyrus | 56 | −16 | 1 | 11.0 |
| L superior temporal gyrus | −50 | −18 | 12 | 7.3 |
| R middle temporal gyrus | 55 | −27 | 0 | 7.3 |
| L Heschl’s gyrus | −42 | −22 | 12 | 7.0 |
| R Heschl’s gyrus | 54 | −13 | 8 | 10.8 |
| R postcentral gyrus | 61 | −15 | 15 | 8.8 |
| L postcentral gyrus | −53 | −11 | 18 | 8.7 |
| R precentral gyrus | 45 | -8 | 29 | 6.3 |
| L precentral gyrus | −54 | -4 | 21 | 5.9 |
| R insula | 48 | −10 | 4 | 6.9 |
| L insula | −38 | −24 | 22 | 6.8 |
| L supramarginal gyrus | −43 | −27 | 23 | 8.3 |
Table 2
Statistical details for the sEEG results
https://doi.org/10.7554/eLife.48971.013| Contact localization | Subject no. | Df | T | Corrected P | Cohen’s d |
|---|---|---|---|---|---|
| Mental imagery condition at 4 Hz | |||||
| L posterior insula | 1 | 19 | 5.57 | <0.001 | 1.24 |
| L anterior supramarginal gyrus | 1 | 19 | 3.40 | 0.034 | 0.76 |
| 1 | 19 | 2.99 | 0.084 | 0.67 | |
| 5 | 18 | 3.29 | 0.046 | 0.75 | |
| L Heschl’s gyrus | 2 | 15 | 5.00 | 0.002 | 1.25 |
| 2 | 15 | 4.64 | 0.004 | 1.16 | |
| 4 | 19 | 4.57 | 0.002 | 1.02 | |
| R middle superior temporal gyrus | 3 | 19 | 4.08 | 0.007 | 0.91 |
| 3 | 19 | 5.29 | <0.001 | 1.18 | |
| Baseline condition at 4 Hz | |||||
| L middle superior temporal gyrus | 1 | 19 | 4.47 | 0.003 | 1.00 |
| L posterior insula | 1 | 19 | 8.06 | <0.001 | 1.80 |
| L anterior supramarginal gyrus | 1 | 19 | 3.35 | 0.037 | 0.75 |
| 5 | 18 | 3.43 | 0.034 | 0.79 | |
| L Heschl’s gyrus | 2 | 19 | 4.41 | 0.003 | 0.99 |
| 2 | 19 | 4.58 | 0.002 | 1.02 | |
| 2 | 19 | 4.60 | 0.002 | 1.03 | |
| 2 | 19 | 3.44 | 0.031 | 0.77 | |
| R middle superior temporal gyrus | 3 | 19 | 5.29 | <0.001 | 1.18 |
| 3 | 19 | 4.35 | 0.004 | 0.97 | |
| 3 | 19 | 3.81 | 0.013 | 0.85 | |
| 3 | 19 | 3.97 | 0.009 | 0.89 | |
| 3 | 19 | 3.79 | 0.014 | 0.85 | |
| R middle middle temporal gyrus | 5 | 18 | 4.52 | 0.003 | 1.34 |
Additional files
-
Transparent reporting form
- https://doi.org/10.7554/eLife.48971.014
Download links
A two-part list of links to download the article, or parts of the article, in various formats.
Downloads (link to download the article as PDF)
Open citations (links to open the citations from this article in various online reference manager services)
Cite this article (links to download the citations from this article in formats compatible with various reference manager tools)
Neural tracking of speech mental imagery during rhythmic inner counting
eLife 8:e48971.
https://doi.org/10.7554/eLife.48971


