Chromatinization of Escherichia coli with archaeal histones
- Medical Research Council London Institute of Medical Sciences, United Kingdom
- Faculty of Medicine, Imperial College London, United Kingdom
Figures
Figure 1 with 2 supplements
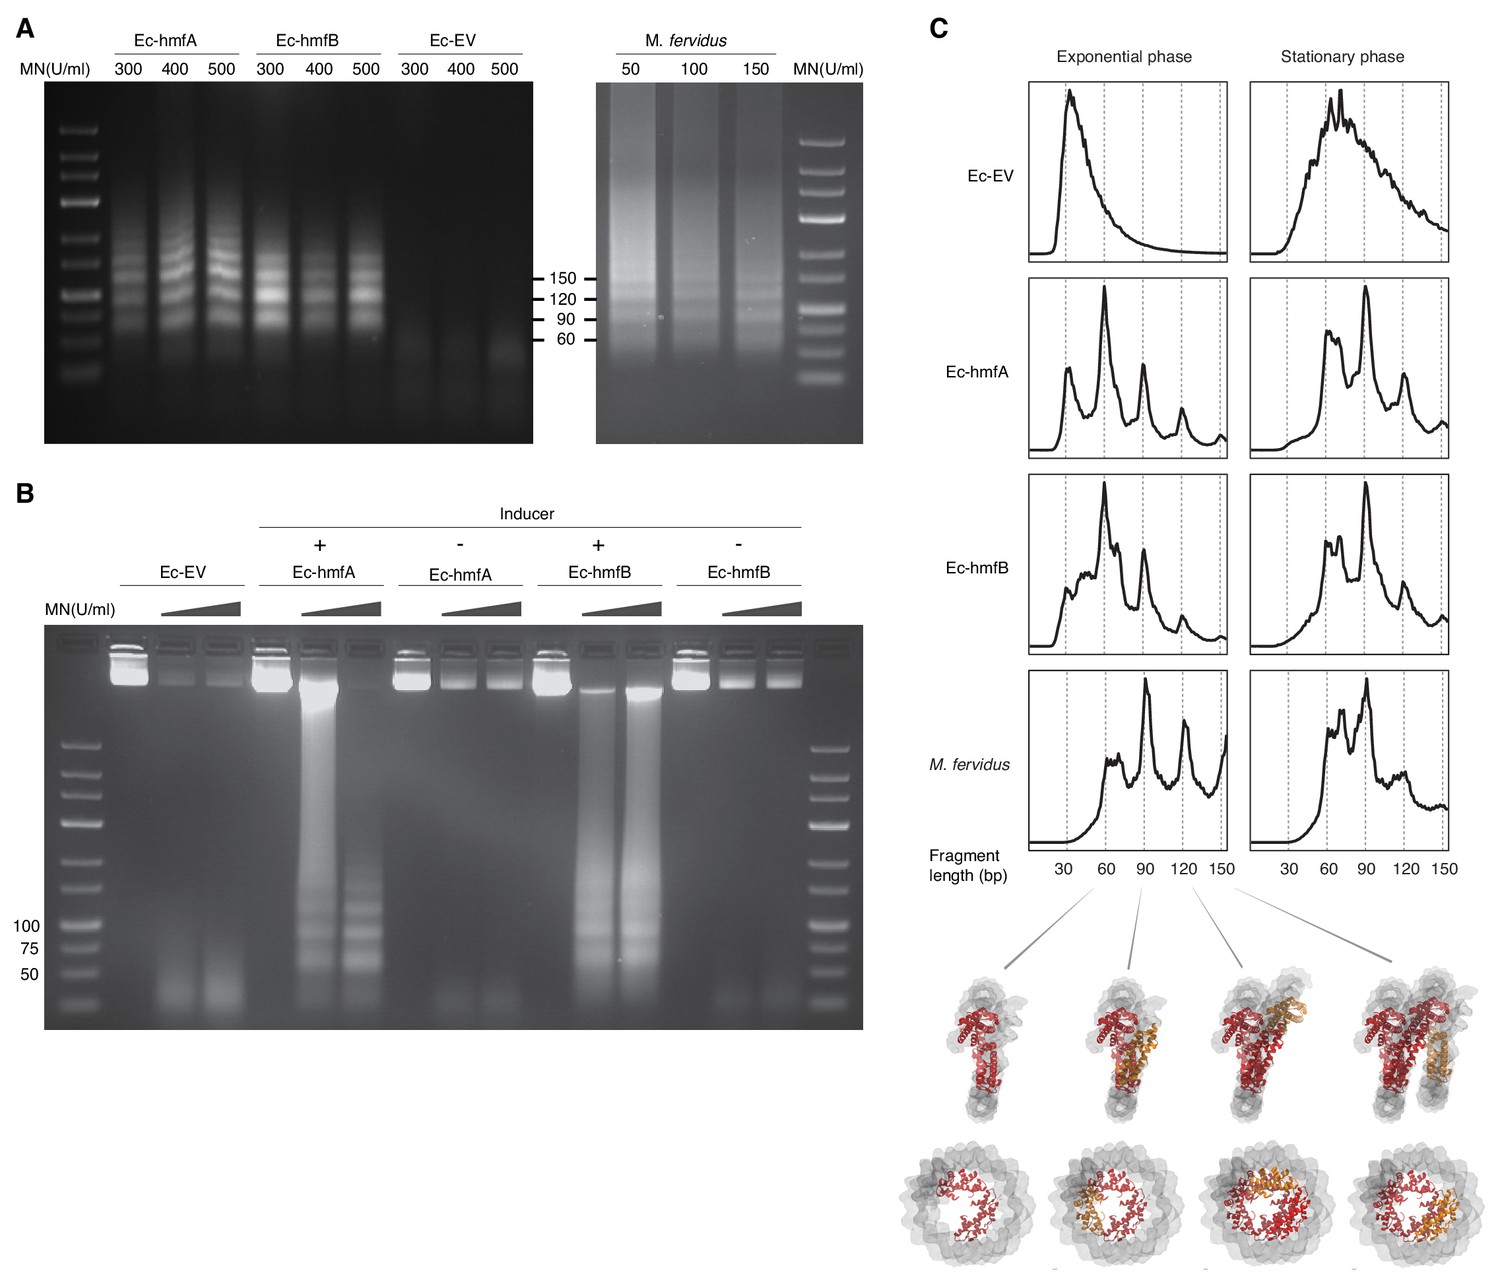
MNase digestion of M. fervidus and E. coli strains expressing M. fervidus histones.
(A) Agarose gel showing profiles of DNA fragments that remain protected at different MNase (MN) concentrations. (B) Ladder-like protection profiles are only observed when hmfA/B expression is induced. (C) Length distribution profiles of sequenced fragments show peaks of protection at multiples of 30 bp in histone-expressing strains. Structural views below highlight how these 30 bp steps would correspond to the addition or removal of histone dimers, starting from the crystal structure of a hexameric HMfB complex (PDB: 5t5k), which wraps ~90 bp of DNA.
Figure 1—figure supplement 1
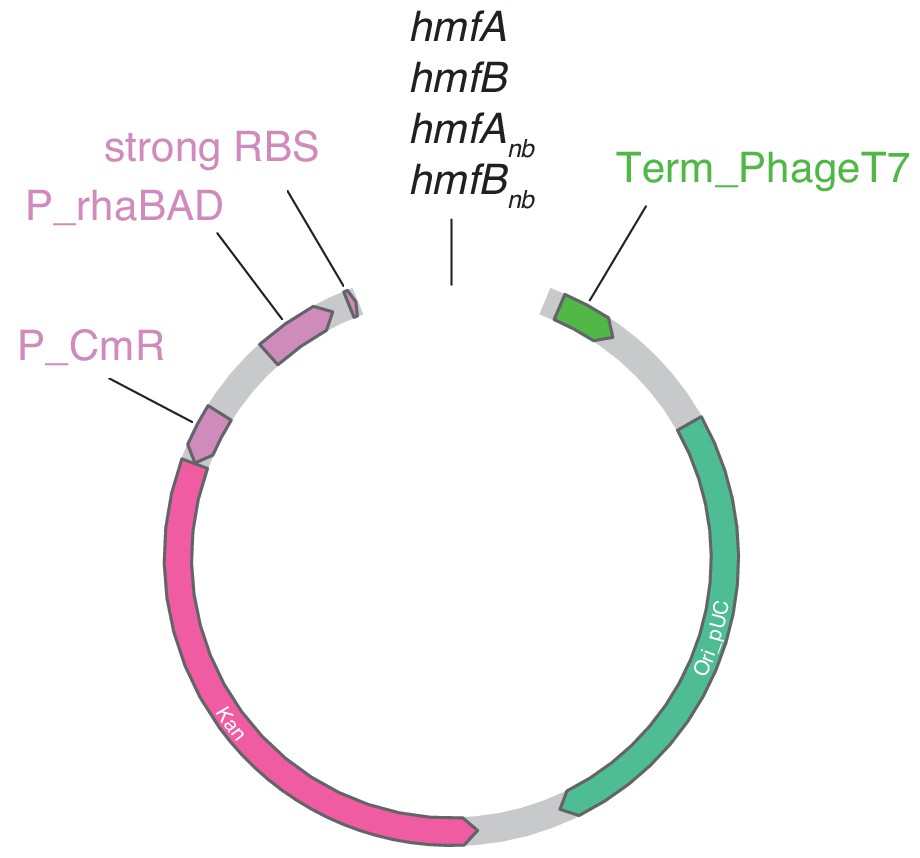
Layout of pD681-derived plasmids used in this study.
https://doi.org/10.7554/eLife.49038.003
Figure 1—figure supplement 2
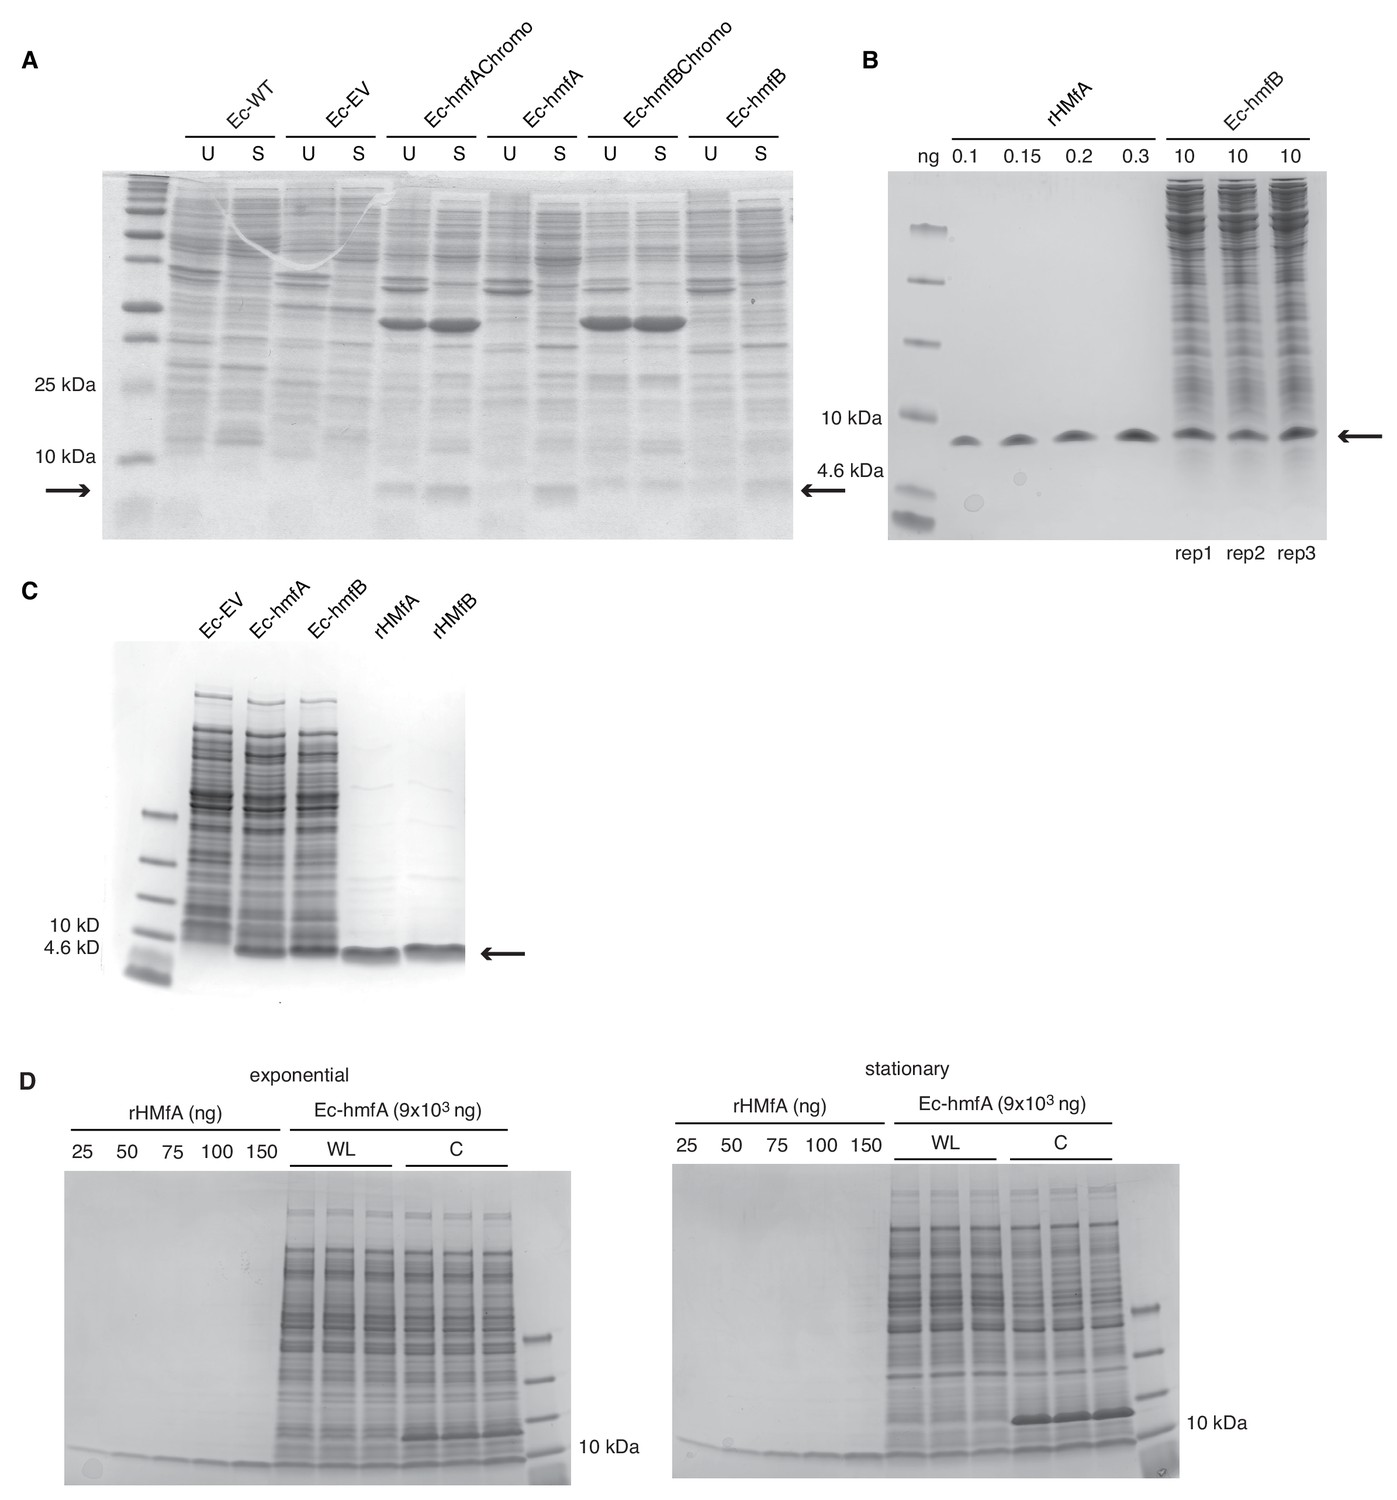
Detection and quantification of HMf expression in E. coli.
(A) Polyacrilamide gel comparing soluble (S) and unsoluble (U) fractions obtained by lysis of transformant strains (Ec-EV, Ec-hmfA, Ec-hmfB) and wild type E. coli (Ec-WT). Ec-hmfAChromo and Ec-hmfBChromo are histone-expressing strains that also bear a chromogenic protein. These were not further analysed in this study (see Materials and methods). (B) HMfA/B protein levels in the transformant strain was estimated from SDS-PAGE bands by densiometry. 10 ng of cell lysate was loaded onto a precast tris-tricine gel and the intensity of the band corresponding to HMfB (arrow) was compared to a standard curve made with increasing amounts of purified recombinant rHMfA (see Materials and methods). (C) Tris-tricine gel showing HMfA and HMfB expression in the soluble fraction of cell lysate and after Heparin-column purification. Ec-EV is included as negative control. (D) As in B. but quantifying both chromatin fraction (C) and whole cell lysate (WL). 9 μg of whole cell lysate and chromatin fraction (see Materials and methods) were loaded in triplicate and the intensity of the band corresponding to HMfA was compared to a standard curve made with increasing amounts of purified recombinant rHMfA. The same initial number of cells was harvested 2 hr post-induction (left panel) and ~17 hr post-induction (right panel). The pronounced band visible in C but not WL corresponds to lysozyme.
Figure 2 with 1 supplement
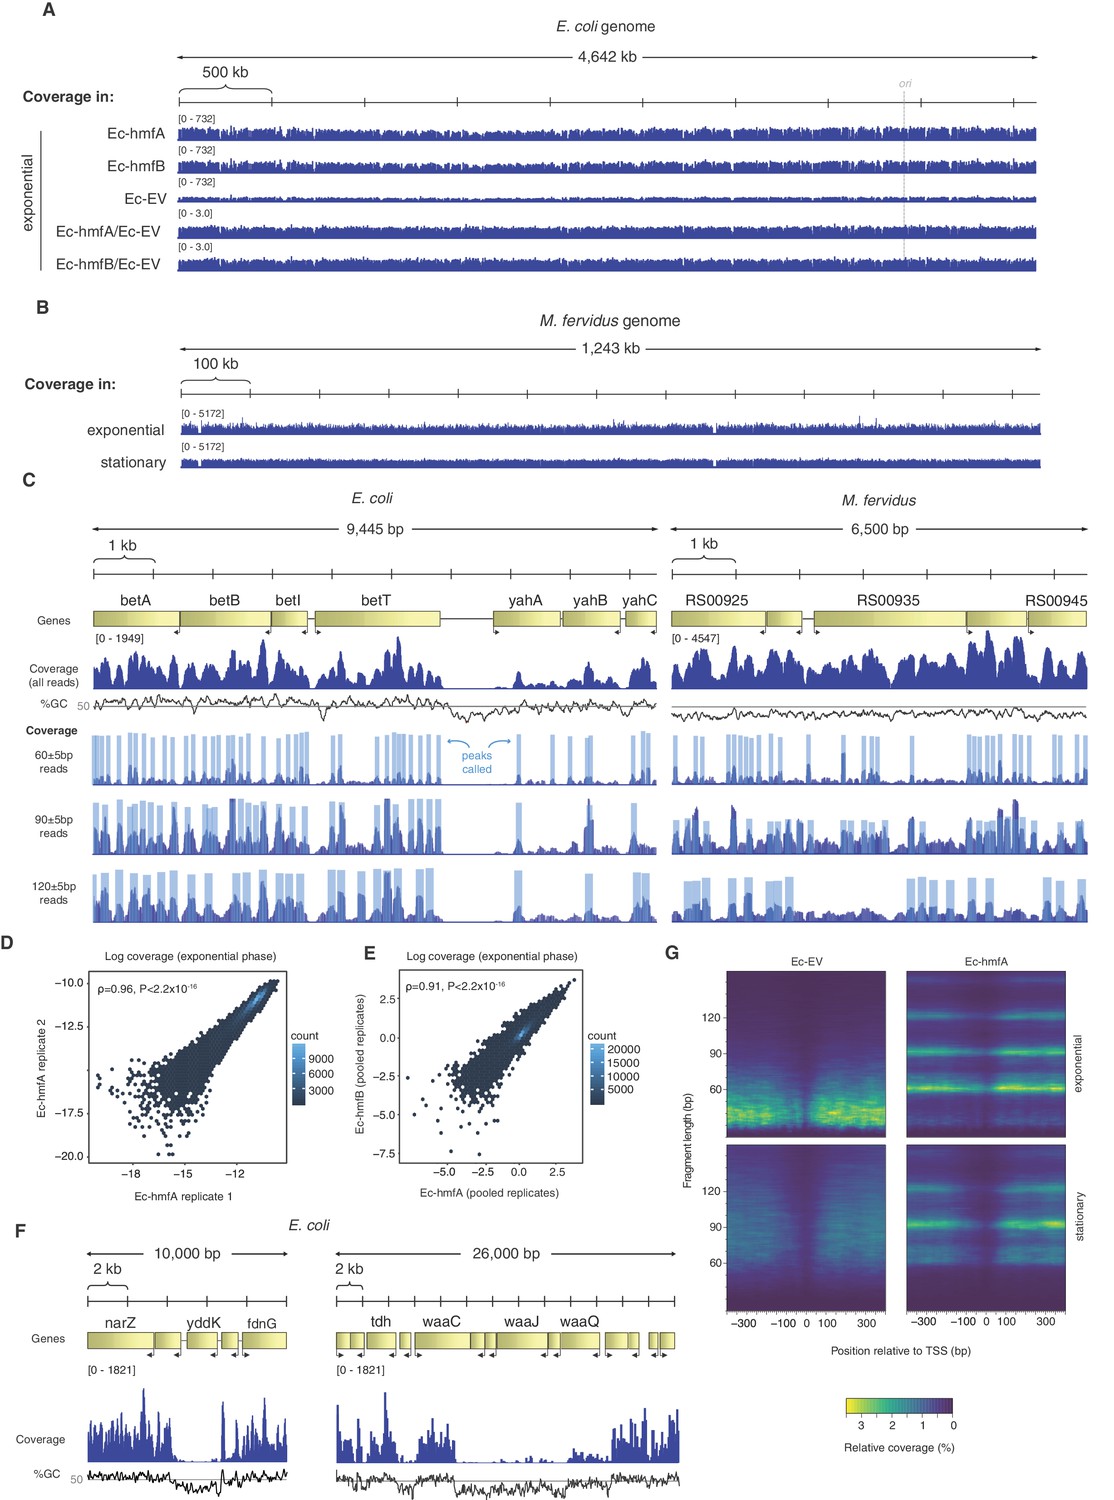
Distribution of MNase-protected fragments across the E. coli genome.
(A) Genome-wide coverage (and normalized coverage) tracks of MNase-protected fragments along the E. coli K-12 MG1655 and (B) the M. fervidus genome. (C) Fragments of defined size cluster into footprints in E. coli and M. fervidus, as illustrated for two example regions. (D) Correlation in coverage measured for two biological replicates of Ec-hmfA. Coverage here is expressed as a proportion of total reads in a given replicate. (E) Correlation in normalized coverage between Ec-hmfA and Ec-hmfB. Reads were pooled across replicates for each strain. (F) Two examples from Ec-hmfA highlighting that drops in coverag frequently correspond to regions of low GC content. (G) Coverage as a function of both distance from experimentally defined transcriptional start sites (see Materials and methods) and fragment size.
Figure 2—figure supplement 1
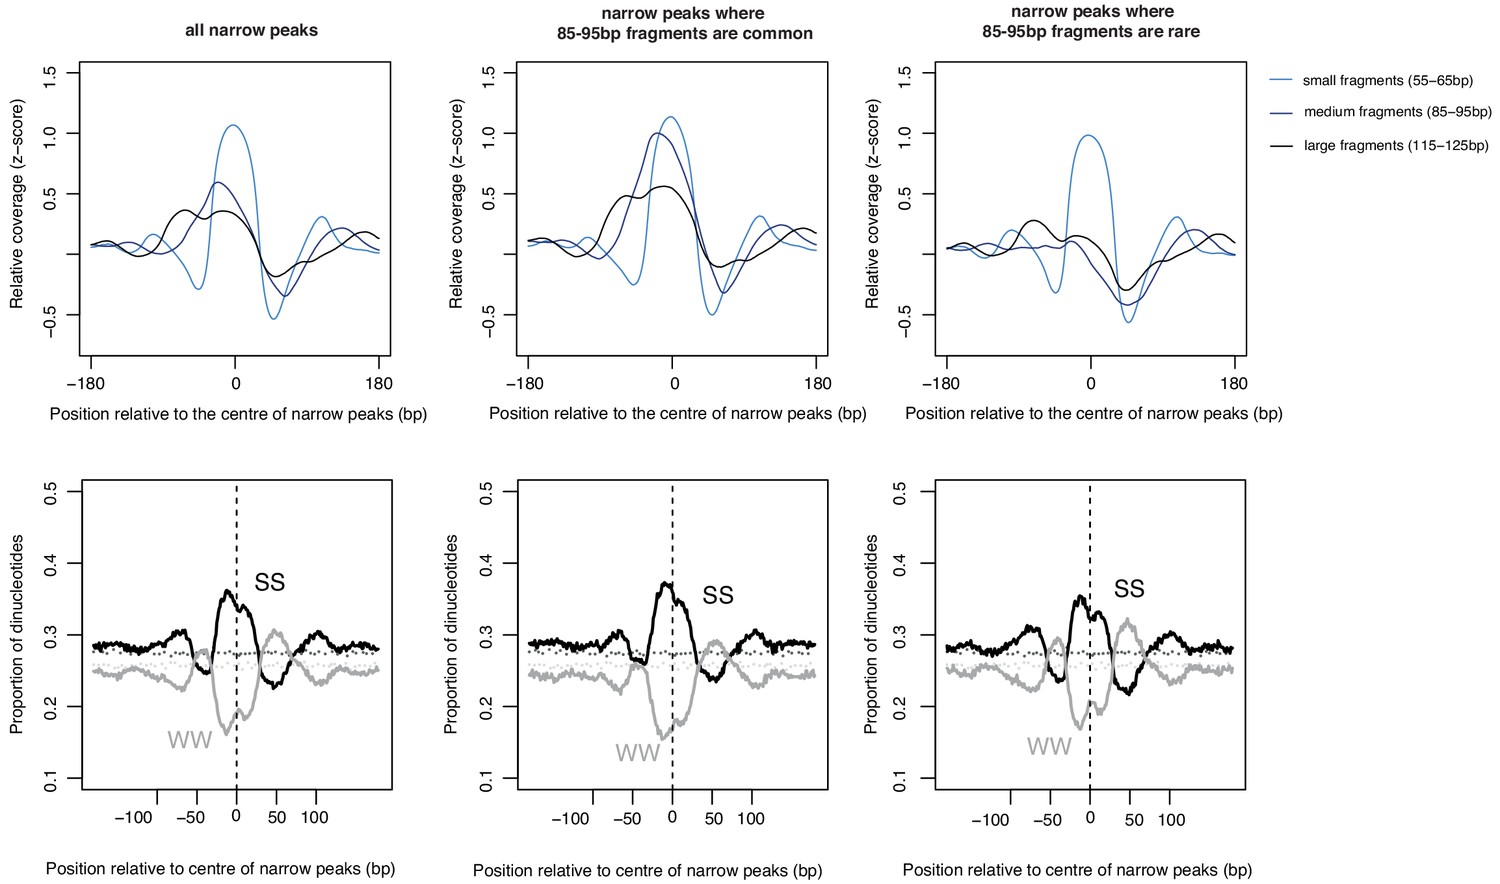
Sequence-dependent oligomer extension dynamics.
The upper left panel shows the coverage of fragments of different lengths at peaks called based on small (55–65 bp) fragments in E. coli. Coverage for a subset of those peaks where medium-sized (85–95 bp) fragments are common (>70 th percentile) or rare (<30 th percentile) is shown alongside. The panels below illustrate average dinucleotide composition at these peaks (S = G or C; W = A or T). Note the WW enrichment flanking the subset of narrow peaks where longer fragments are rare, that is where tetramers rarely get extended into longer oligomers. These patterns are very similar to what is observed in M. fervidus native chromatin digests (see Hocher et al., 2019), supporting the notion that sequence-dependent oligomerization is an intrinsic property of archaeal histones.
Figure 3
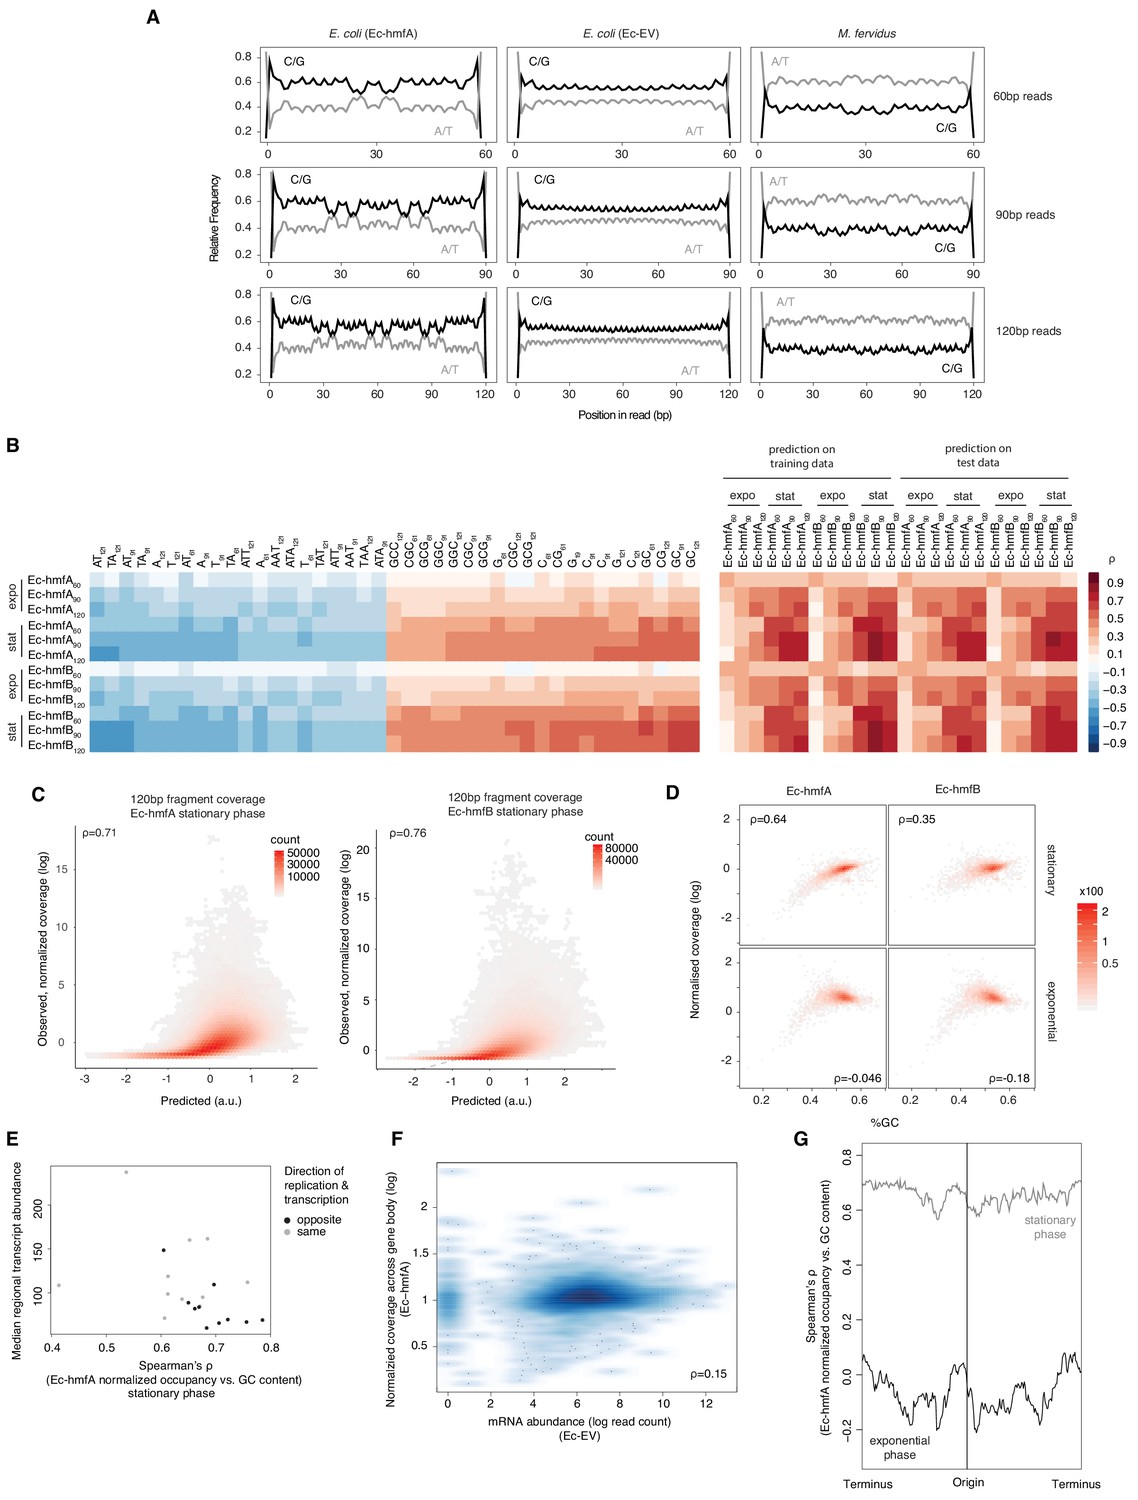
Sequence and other predictors of histone occupancy in E. coli.
(A) Read-internal nucleotide enrichment profiles for reads of exact length 60/90/120 bp. Symmetric enrichments are evident for Ec-hmfA and M. fervidus native fragments but not Ec-EV. (B) Left panel: top and bottom 20 individually most informative k-mers to predict fragment size-specific normalized histone occupancy in different strains. Red and blue hues indicate positive and negative correlations between k-mer abundance and normalized occupancy, respectively. Right panel: performance of the full LASSO model on training and test data (see Materials and methods). expo: exponential phase; stat: stationary phase. (C) Correlations between predicted and observed coverage of 120 ± 5 bp fragments predicted at single-nucletoide resolution across the genome. All p<0.001. (D) GC content and normalized coverage are positively correlated in stationary but not exponential phase. All p<0.001. Coverage and GC content are measured by gene. (E) The correlation between GC content and occupancy is stronger in genomic regions where transcriptional output is lower. Regional transcriptional output is computed as median transcript abundance in a 200-gene window. To assess potential interactions between replication and transcription, windows are computed separately for genes where the directions of transcription and replication coincide and those where they differ. (F) There is no negative correlation between mRNA abundance in Ec-EV and normalized histone occupancy in Ec-hmfA, suggesting that low levels of transcription do not facilitate higher occupancy. (G) The strength of the correlation between GC content and occupancy varies along the E. coli chromosome. Correlations are computed for 500 neighbouring genes using a 20-gene moving window.
Figure 4 with 3 supplements
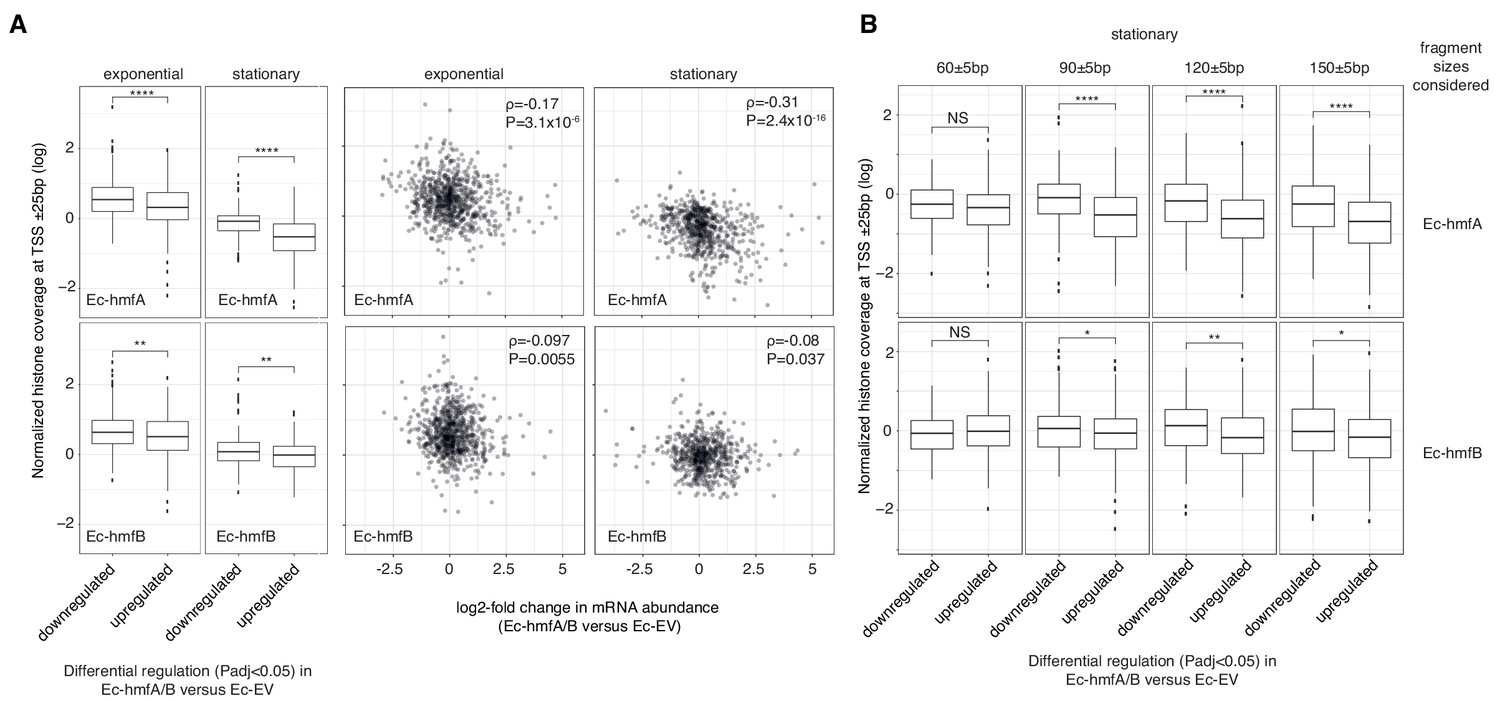
The impact of archaeal histones on transcription in E. coli.
(A) Reduced transcript abundance in histone-expressing strains is associated with higher average histone occupancy at the TSS. Top panels: Ec-hmfA. Bottom panels: Ec-hmfB (B) Genes that are significantly downregulated in histone-expressing strains exhibit higher coverage of large (90+bp) but not small (60 bp) fragments. Top panels: Ec-hmfA. Bottom panels: Ec-hmfB. ****p<0.001; ***p<0.005; **p<0.01; *p<0.05.
Figure 4—figure supplement 1
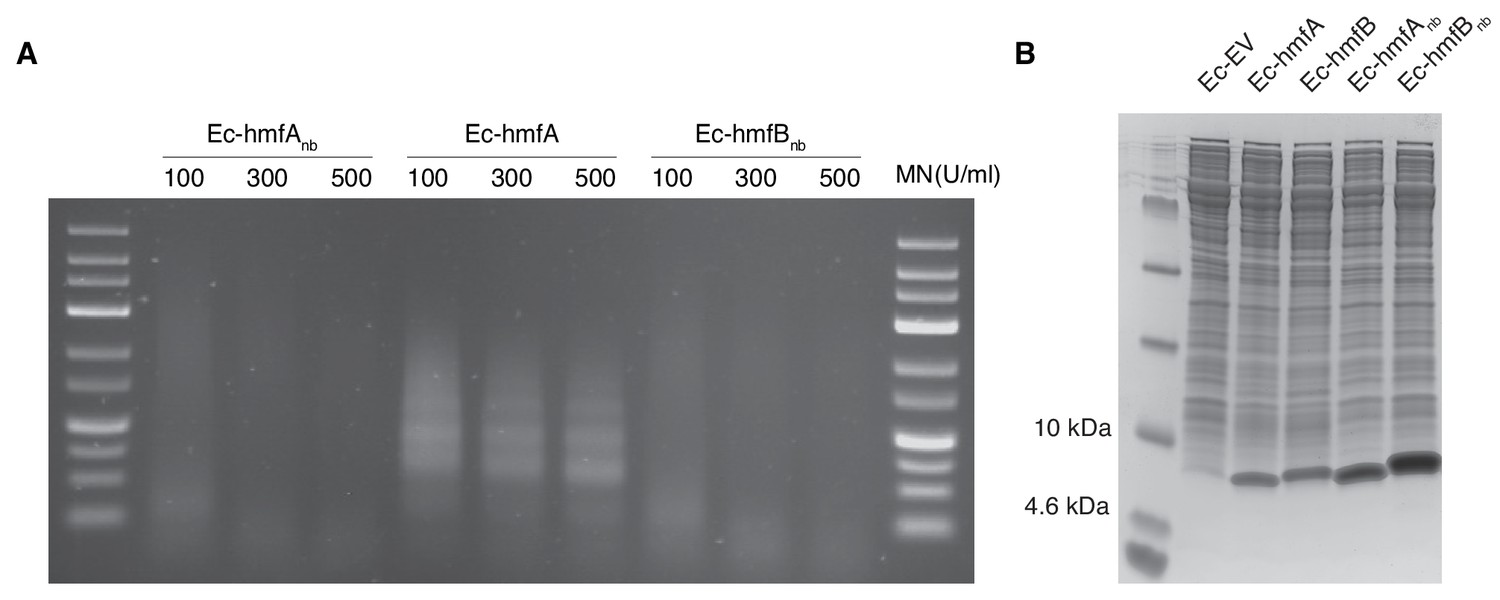
Expression of non-binding histone mutants.
(A) Agarose gel comparing the MNase digestion profiles of Ec-hmfA to strains expressing non-binding HMfA and HMfB mutants. (B) Coomassie staining of the soluble fractions of cell lysates from all transformant strains discussed in this study. Note that non-binding histone variants are - for unknown reasons - more highly expressed than their DNA-binding progenitors and might, by virtue of this higher expression and their different sequence, trigger qualitatively and quantitatively different responses. This makes an indirect comparison (comparing Ec-hmfA/B to Ec-EV after factoring out shared responses with Ec-hmfAnb/Bnb versus Ec-EV, as described in the main text) preferable to directly comparing differential expression in Ec-hmfA/B versus Ec-hmfAnb/Bnb.
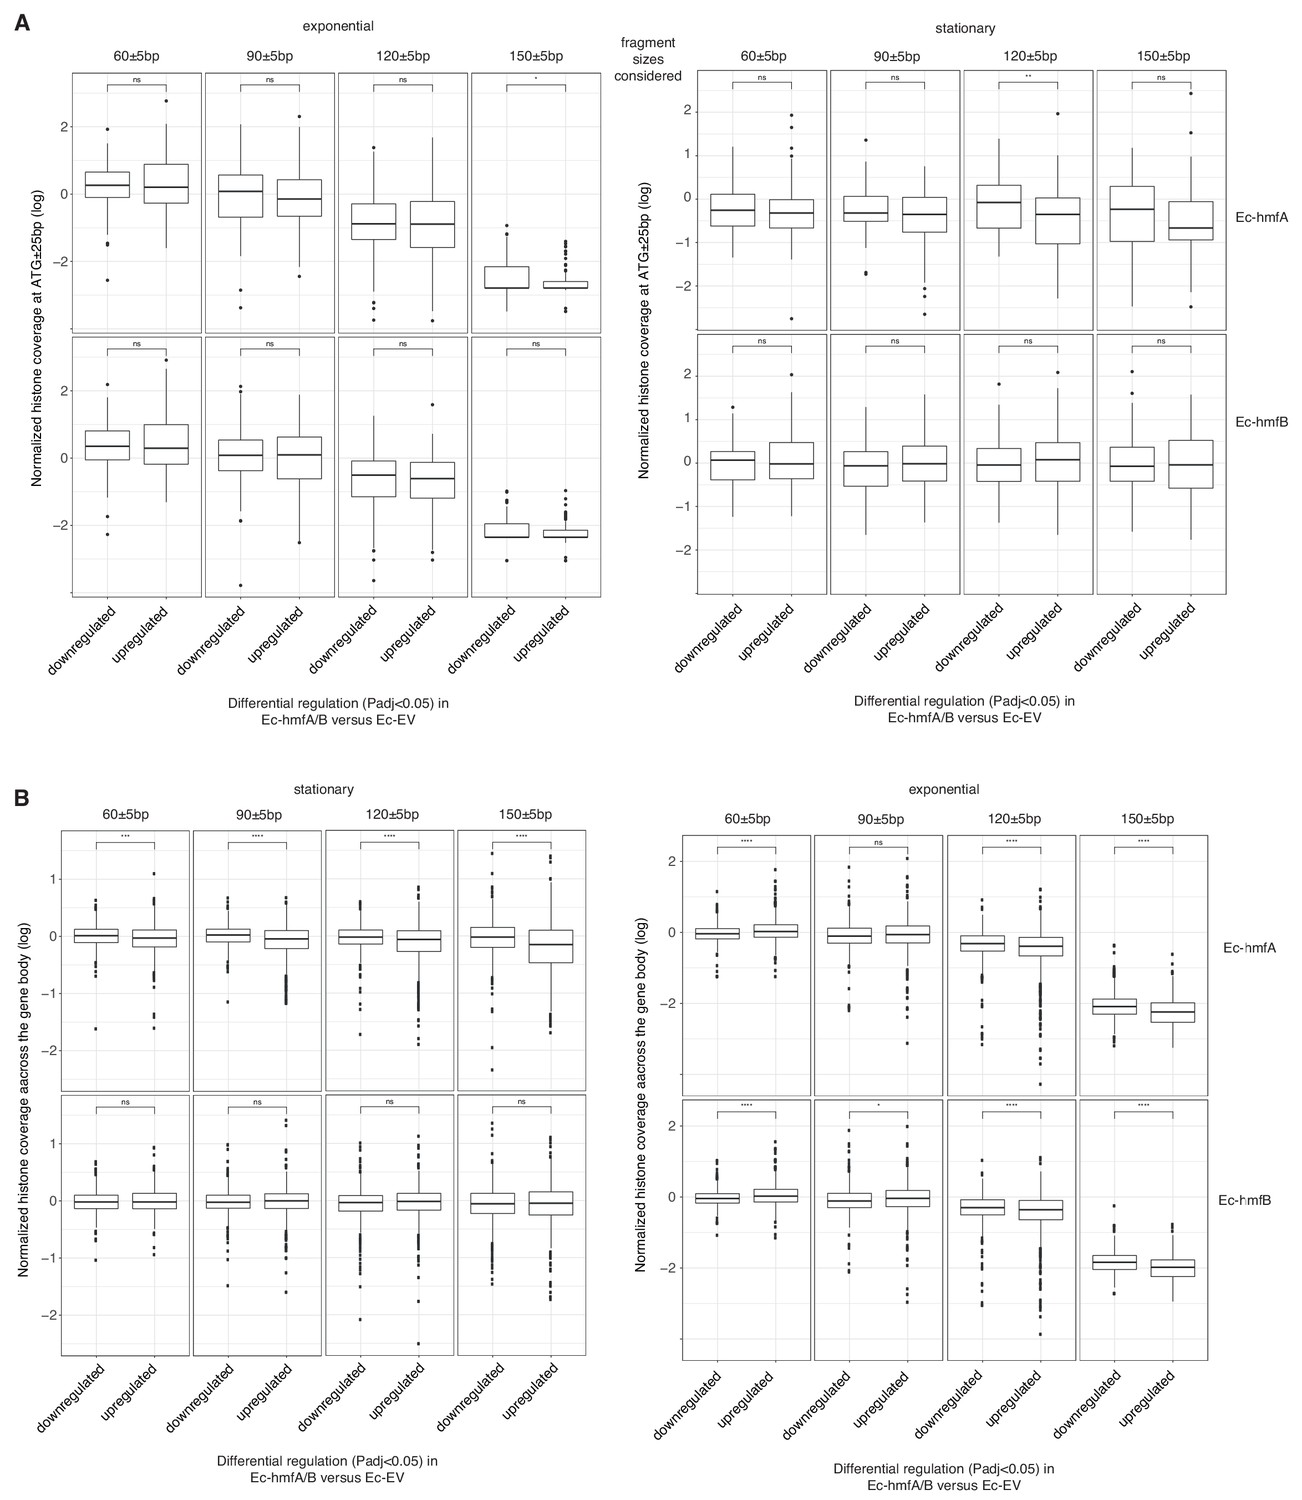
Figure 4—figure supplement 2
The impact of archaeal histones in E. coli on transcription.
(A) Reduced transcript abundance in histone-expressing strains is not associated with higher average histone occupancy around the ATG (± 25 bp). Only 5’ genes in operons that are represented in Figure 4A are considered in this analysis, to enable a fair comparison between occupancy at transcription and translation start sites. (B) Histone occupancy across the gene body for genes that are significantly up- or down-regulated in histone-expressing strains. ****p<0.001; ***p<0.005; **p<0.01; *p<0.05; expo: exponential phase; stat: stationary phase.
Figure 4—figure supplement 3
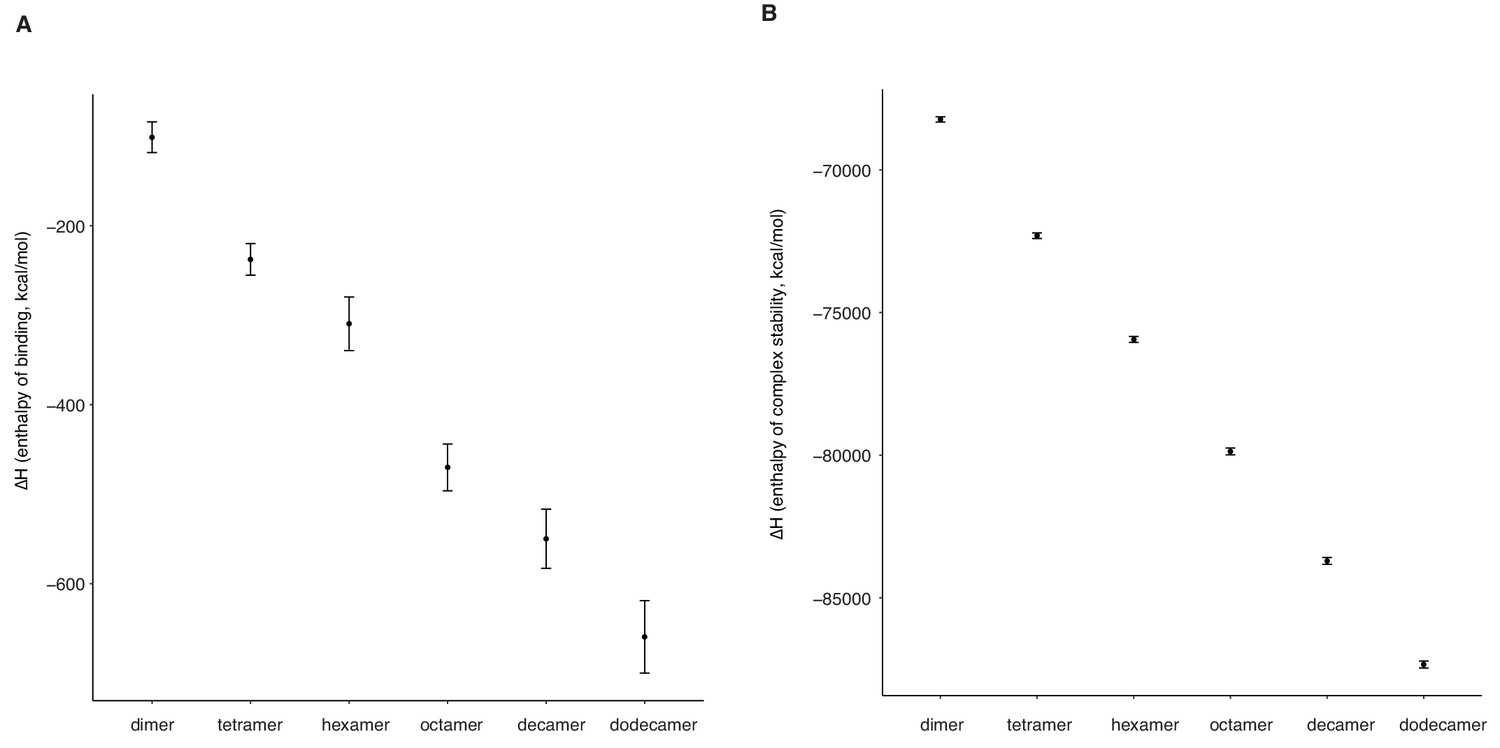
Longer oligomeric histone-DNA complexes are more stable and have higher DNA affinity.
(A) DNA-binding affinity and (B) complex stability of different histone-DNA complexes of different length, measured as the change in enthalpy (∆H, see Materials and methods) in molecular dynamics simulations based on the hexameric HMfB:DNA crystal structure (PDB ID: 5t5k).
Figure 5 with 1 supplement
The impact of archaeal histones on E. coli growth.
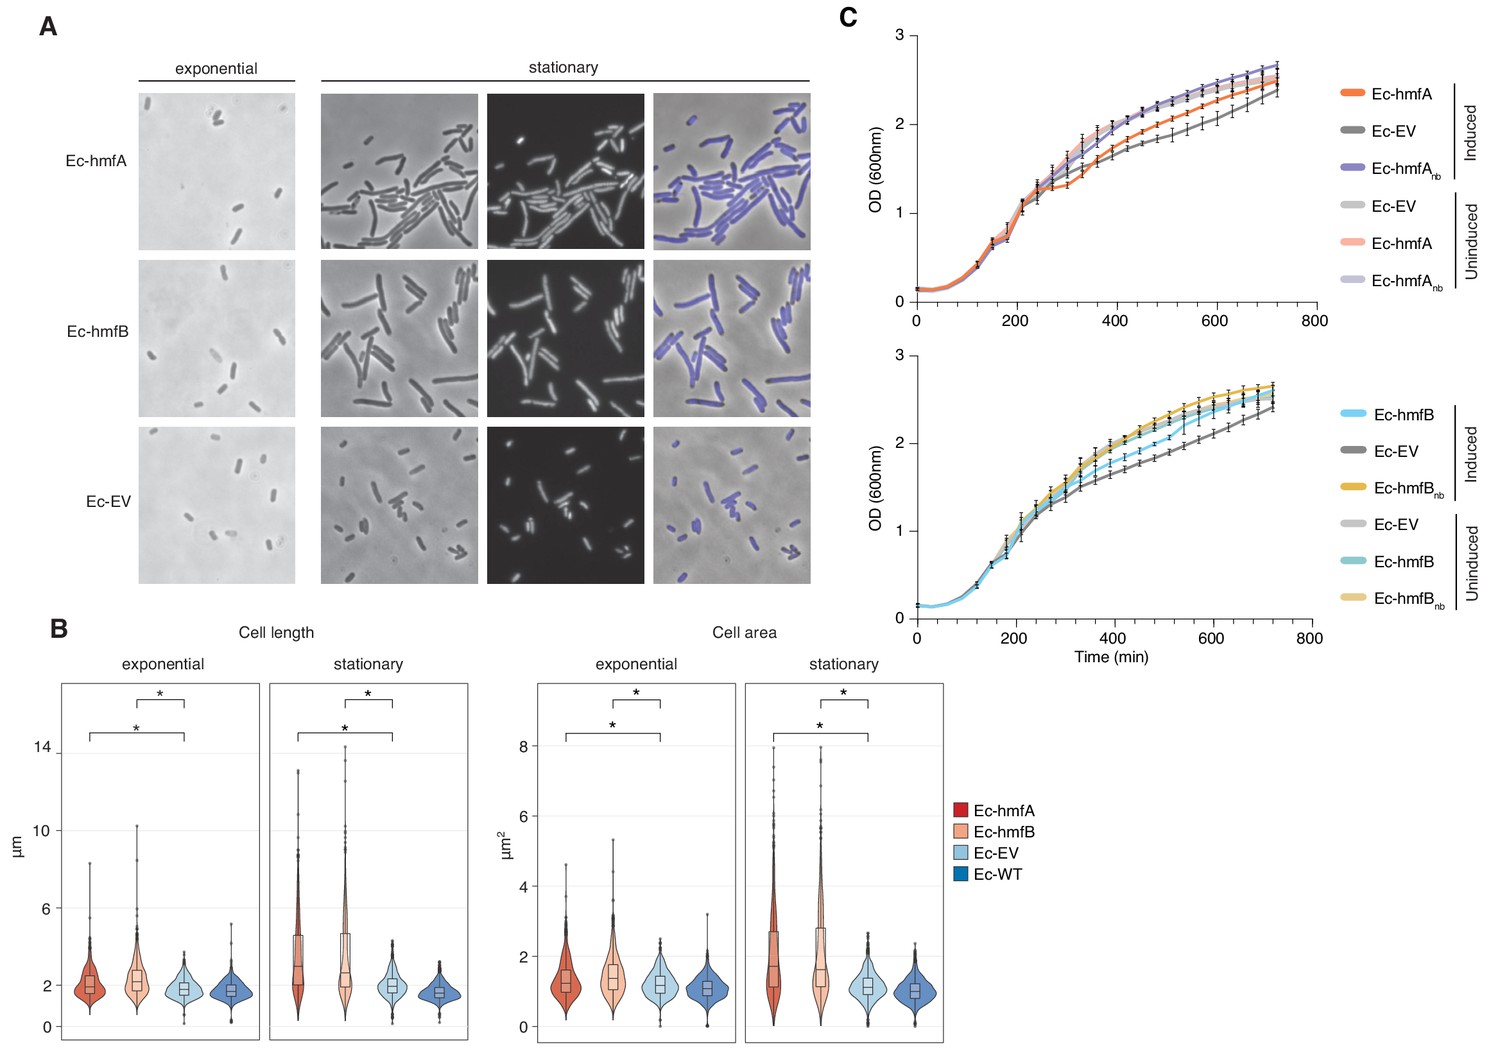
(A) Morphological changes triggered by HMfA and HMfB expression. Compared to the empty vector control, Ec-hmfA and Ec-hmfB become significantly longer, particularly toward the final stage of the cell cycle. DAPI staining suggests that the increase in cell length is not due to impaired cell division. Magnification 100x. (B) Quantification of cell length and area in histone-expressing and control strains. Some unexpectedly low values are likely attributable to debris being misidentified as cells. *p<0.0001. (C) Growth curves for induced and uninduced histone-expressing and control strains. Rhamnose was added for induction at 200 min.
Figure 5—figure supplement 1
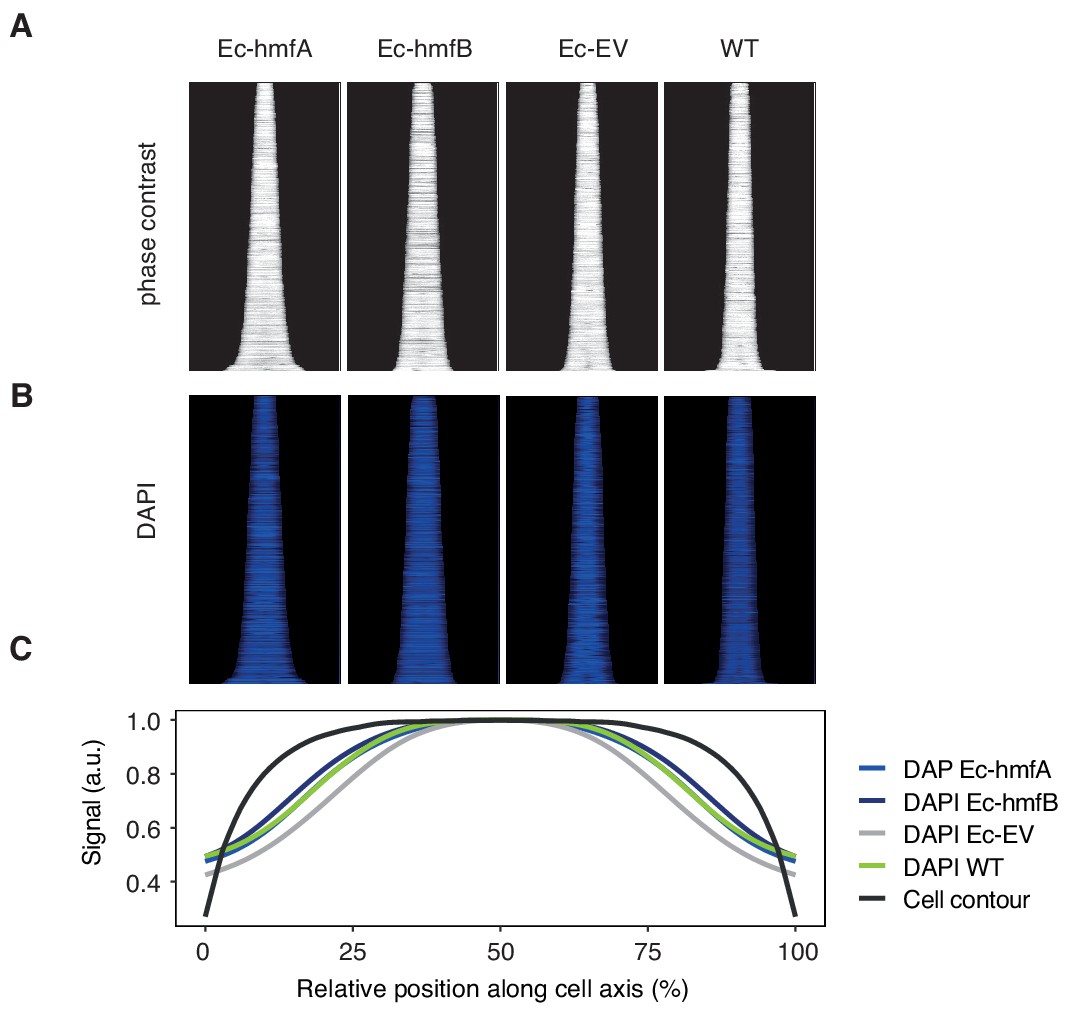
No evidence for altered nucleoid/cytoplasm ratio in histone-expressing cells.
Ordered arrays of (A) cell sizes, as determined by phase contrast microscopy, and (B) DAPI-stained nucleoids in different E. coli strains. (C) Averaged cell contour and DAPI signals are very similar across strains. Averaging was carried out within a size range (1 μm-2.5μm) well populated by poth Ec-EV and Ec-hmfA/B to ensure that differences are not driven by different cell size distributions. See Materials and methods for details on image quantification.
Figure 6
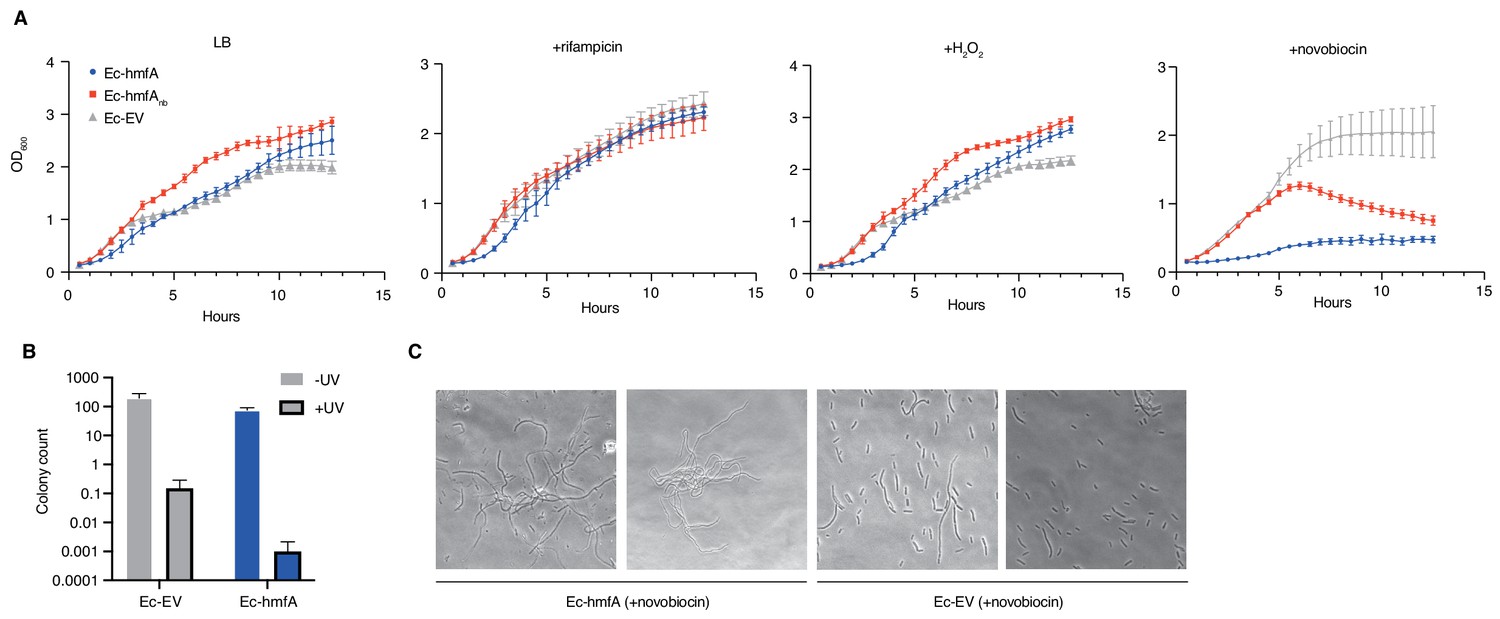
Growth responses of histone-expressing E. coli strains under stress.
(A) Growth curves for pre-induced histone-expressing E. coli strains and controls in LB medium and LB medium with added rifampicin, H2O2, or novobiocin. See Materials and methods for growth/induction protocol and drug/chemical concentrations. (B) Colony counts for E. coli strains exposed to UV radiation or left untreated (all p<0.05). (C) Novobiocin treatment of Ec-hmfA results in a strong filamentation phenotype.
Figure 7 with 1 supplement
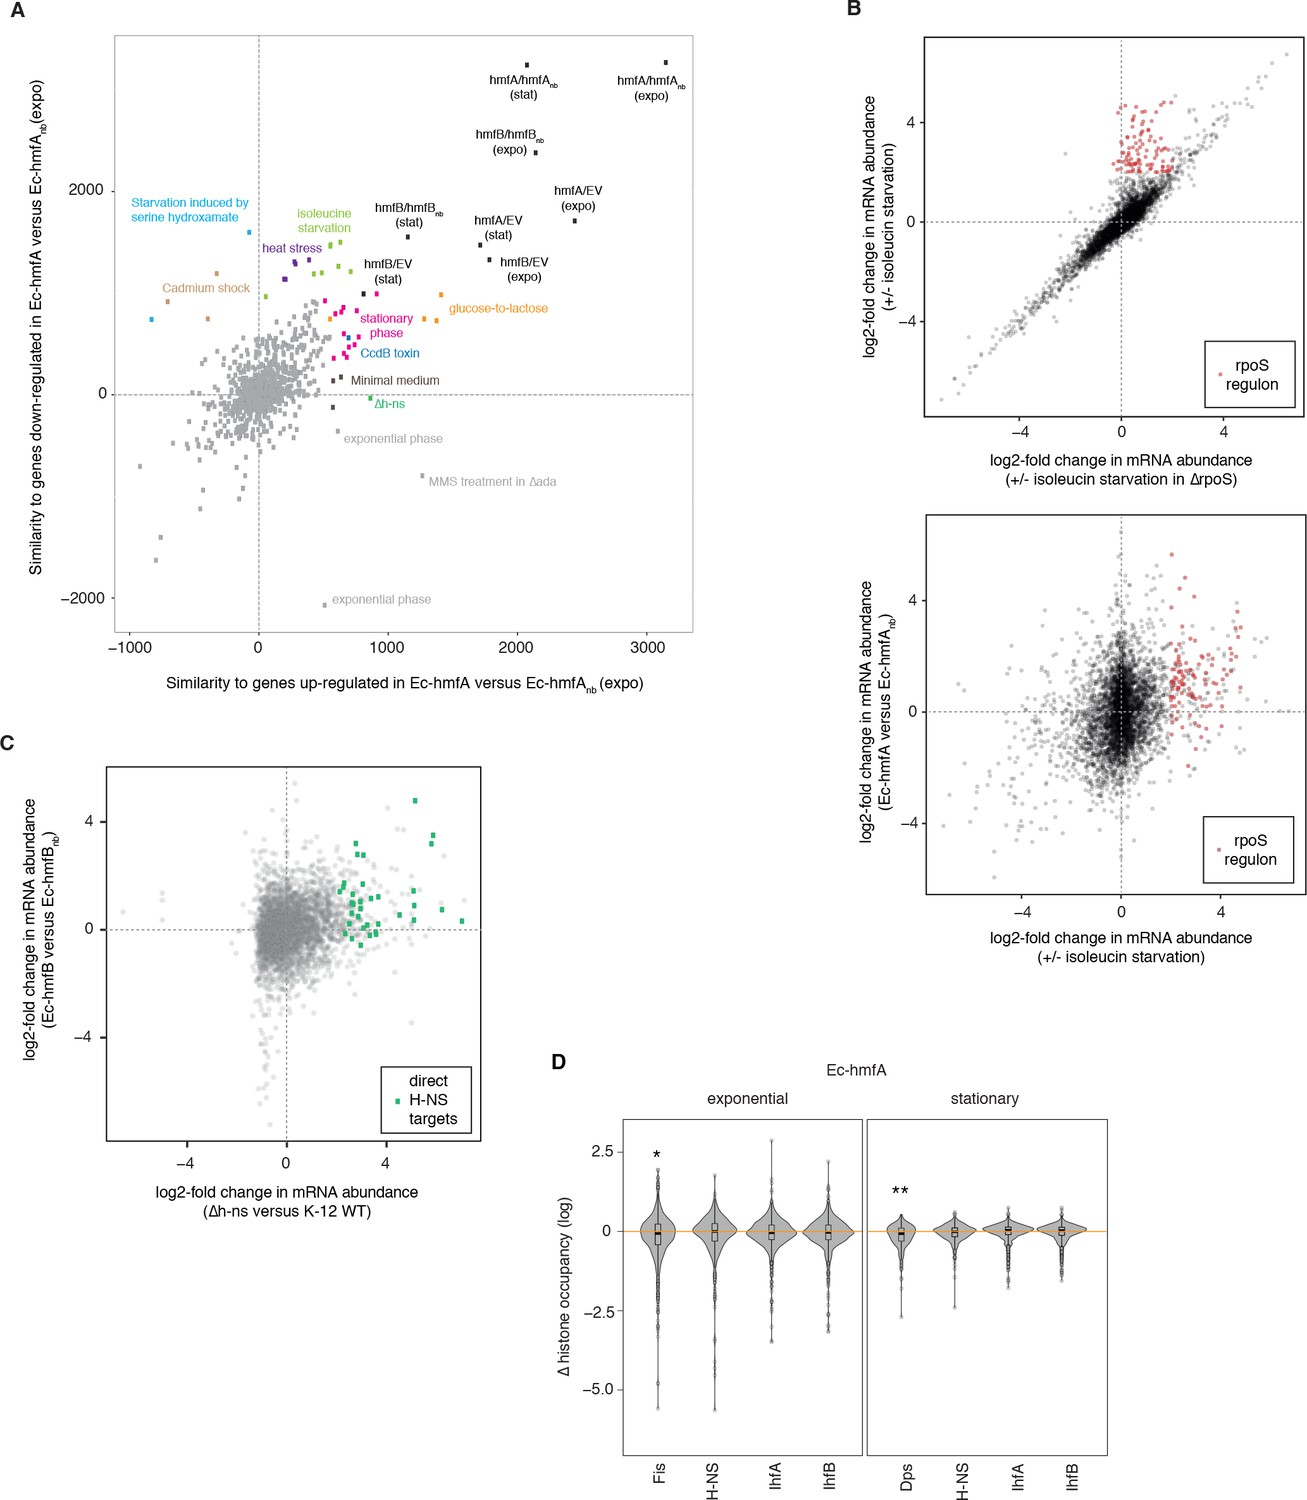
Global transcriptional responses in histone-expressing strains highlight effects on E. coli physiology and native chromatin organization.
(A) Comparative analysis of global transcriptional responses, comparing up- or down-regulated genes in Ec-hmfA (versus Ec-hmfAnb) to other perturbations (underlying data provided as Figure 7A – source data). Perturbations with high similarity to Ec-hmfA versus Ec-hmfAnb along at least one dimension are highlighted and coloured according to the nature of the perturbation. Values < 0 indicate overall dissimilarity, equivalent to a negative correlation coefficient between the transcriptional responses. Note that the absolute similarity values here have no intrinsic meaning; only the relative distance from the maximum, hmfA/hmfAnb (expo), is meaningful. Note also that similarity should only be interpreted in reference hmfA/hmfAnb (expo). Points labelled ‘exponential phase’ constitute rare cases where, in the original study, differential expression was assessed as expo/stat rather than the more common stat/expo. When flipped, these fall into or close to the pink cluster of stationary phase datasets. (B) Genes controlled by RpoS (identified by comparing the response to isoleucine starvation in WT and ΔrpoS cells, upper panel) are upregulated upon isoleucin starvation but also in histone-expressing strains (illustrated for Ec-hmfA in the lower panel). Based on GSE11087 as provided in GenexpDB. (C) Correspondence between transcriptomic changes in Ec-hmfB versus Ec-hmfBnb and a Δh-ns strain (GSE123554). Direct H-NS targets, as inferred by Gawade et al. (2019), are highlighted in green. (D) Histone occupancy in regions previously found to be bound or unbound by a particular nucleoid-associated protein in E. coli. ∆ histone occupancy is defined as the difference in histone occupancy in a region bound by a given NAP and the nearest unbound region downstream. Negative ∆(histone occupancy) values therefore indicate greater histone occupancy in areas not bound by the focal NAP, suggestive of competition for binding or divergent binding preferences. *p<0.005 **p<0.001.
-
Figure 7—source data 1
Similarity to transcriptional responses observed in previous perturbations.
Column 1. Comparison ID as provided GenexpDB. Column 2. Similarity with genes upregulated in Ec-hmfA (versus Ec-hmfAnb). Column 3. Similarity with genes downregulated in Ec-hmfA (versus Ec-hmfAnb). Column 4. Description of condition pairs as provided in GenexpDB.
- https://doi.org/10.7554/eLife.49038.017
Figure 7—figure supplement 1
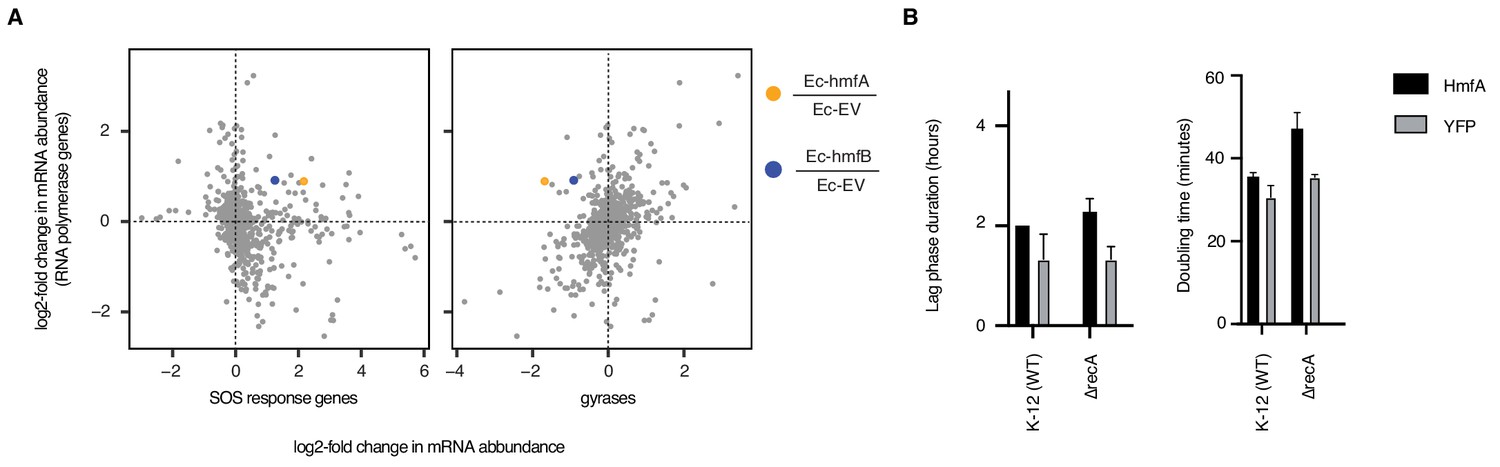
The impact of archaeal histones on transcription in E. coli.
(A) Upregulation of SOS response genes (dinB, dinD, sulA, recA, sbmC, recN), as defined by Khil and Camerini-Otero (2002), and downregulation of gyrases (gyrA/B) in histone-expressing strains. For simplicity, differential regulation is shown as a single mean value across genes. The response is contextualized by considering fold-changes for the same genes in >1000 other perturbations (see main text and Materials and methods). Histone-expressing strains are unusual in showing strong down-regulation of gyrase genes in the face of increased RNA polymerase expression. (B) Deletion of recA, a gene required for the induction of the SOS response, exacerbates slow growth and lag phase extension but is not lethal.
Figure 8
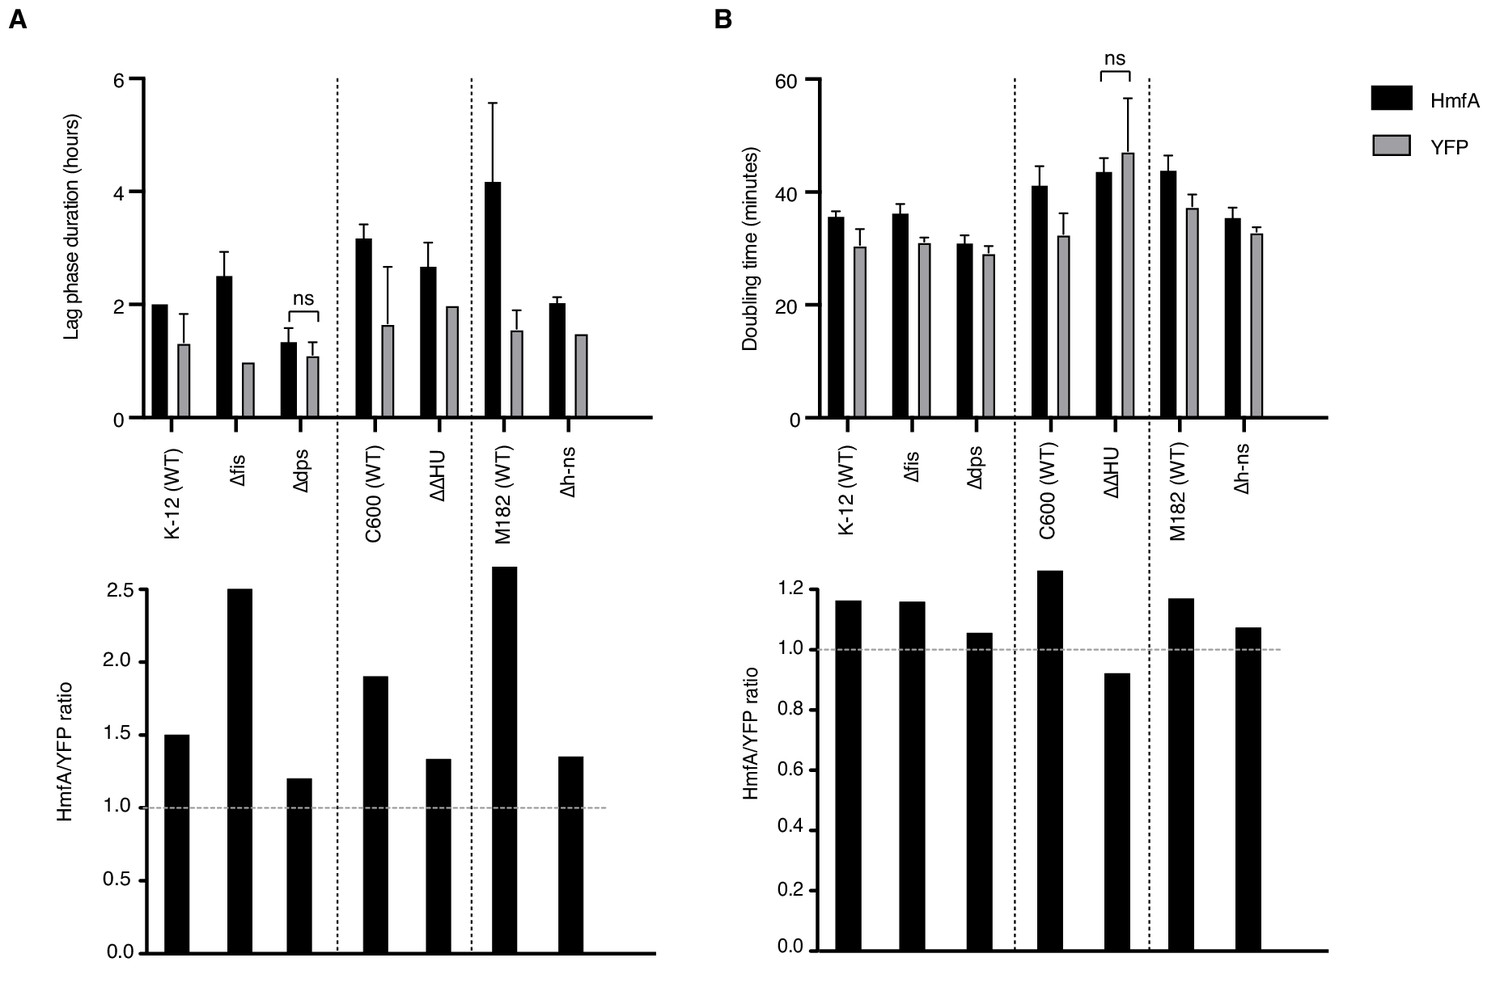
Effects of histone expression in NAP deletion strains.
(A) Duration of lag phase, operationally defined as the time between inoculation and the point of maximum growth rate, in cultures of YFP- and HmfA-expressing cells from different genetic backgrounds. (B) Doubling time at the point of maximum growth rate as determined by curve fitting. All pairwise comparisons significant at p<0.05 unless indicated. Different genetic backgrounds are separated by dotted vertical lines.
Figure 9
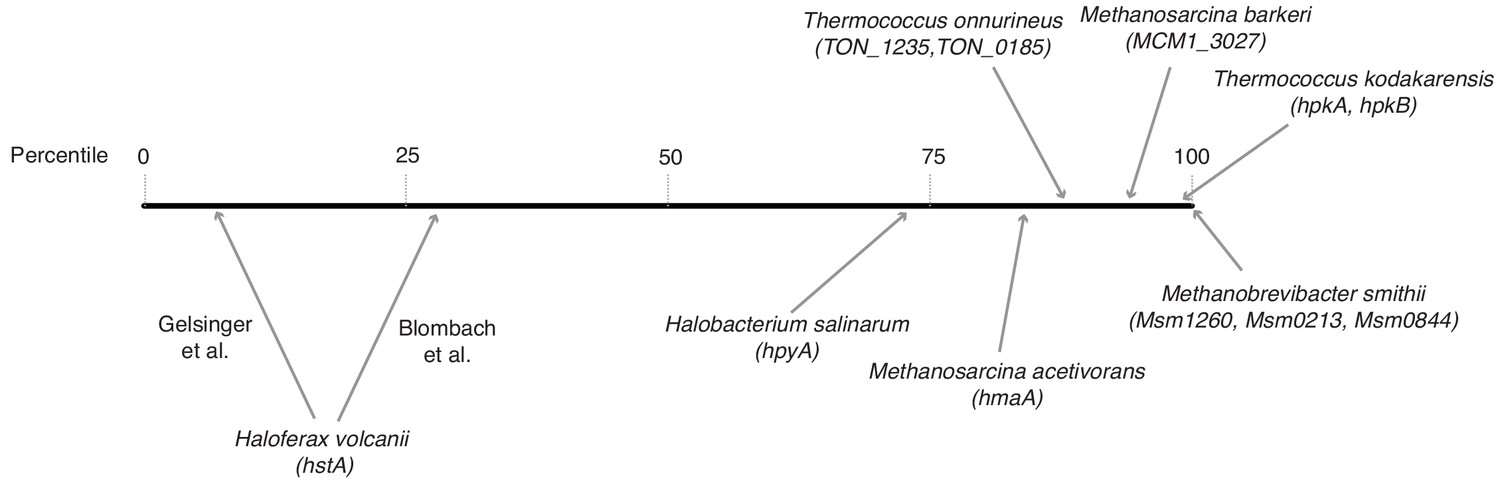
Relative transcript levels of histone genes across different archaeal species.
Histones were assigned a percentile rank based on their relative expression in a given species and transcriptomic dataset (0 = least abundant mRNA in the dataset; 100 = most abundant mRNA in the dataset). For species with more than one histone gene, transcript levels were summed across histone genes. Because of significant variability between studies, two separate estimates are given for H. volcanii. Data sources: H. salinarum (Gene Expression Omnibus accession GSE99730), M. barkeri (GSE70370), T. onnurineus (GSE85760), M. acetivorans (GSE64349), M. smithii (GSE25408), H. volcanii (Blombach et al., 2018 Nucl Acid Res 46:2308–2320; Gelsinger and DiRuggiero, 2018 J Bacteriol 200:e00779-17), T. kodakarensis (Jäger et al., 2014 BMC Genomics 15:684).
Author response image 1
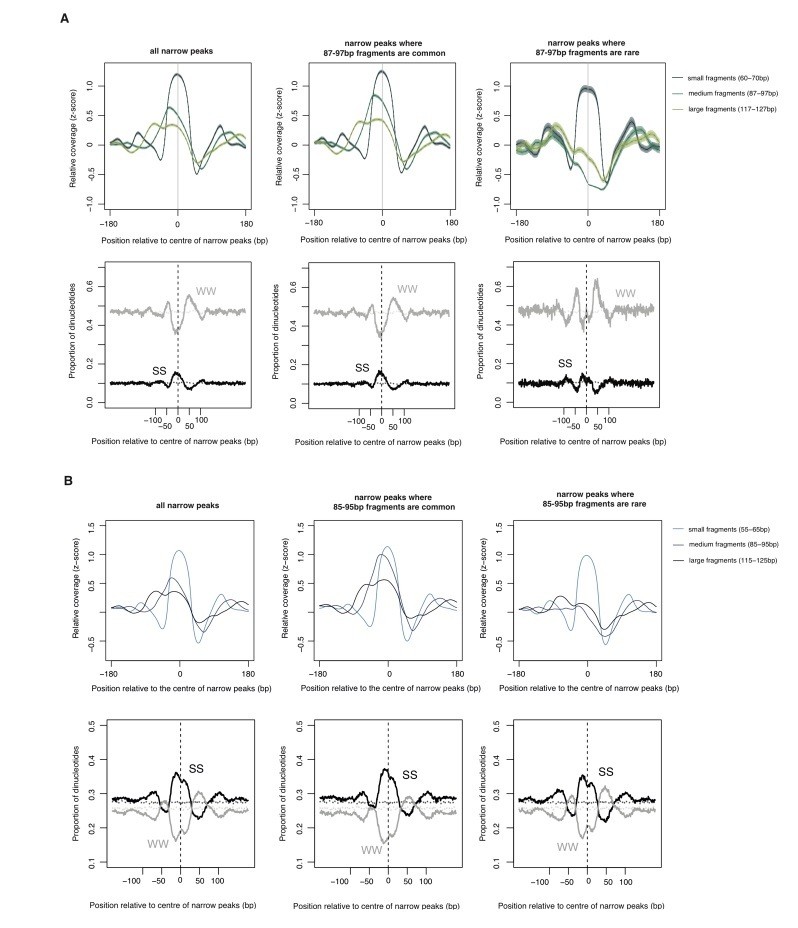
The relationship between oligomer formation and the underlying sequence.
(A) The upper half of this figure corresponds to Figure S4b in Hocher et al.2019, bioRxiv: 564930. The data are for M. fervidus native chromatin digests. The figure compares different types of narrow peaks, i.e. peaks principally formed by tetramers. Narrow peaks where longer fragments are common (i.e. extension is likely to occur, central panel) are compared with narrow peaks where longer fragments are rare (i.e. extension is uncommon, right panel). Narrow peaks where extension rarely happens are associated with significantly elevated flanking AT content (see Hocher et al. for quantification, W=A or T, S=G or C). (B) Patterns very similar to those observed in (A) are also evident in E. coli expressing HMfA, supporting the notion that sequence-dependent oligomerization behaviour is an intrinsic property of archaeal histones.
Author response image 2
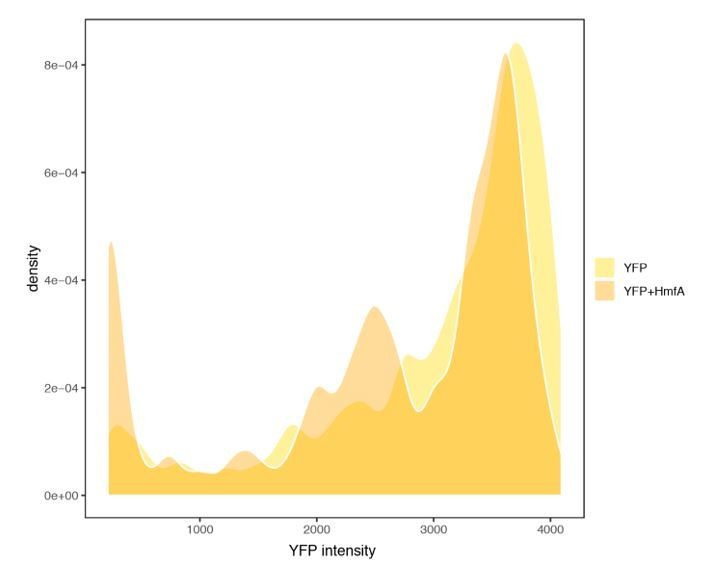
YFP expression measured in cells with or without concurrent expression of HmfA.
https://doi.org/10.7554/eLife.49038.026Additional files
-
Supplementary file 1
E. coli K-12 MG1655-derived strains constructed for this study.
- https://doi.org/10.7554/eLife.49038.020
-
Supplementary file 2
Fourier filtering parameters.
- https://doi.org/10.7554/eLife.49038.021
-
Supplementary file 3
Outliers in differential expression analysis.
- https://doi.org/10.7554/eLife.49038.022
-
Transparent reporting form
- https://doi.org/10.7554/eLife.49038.023
Download links
A two-part list of links to download the article, or parts of the article, in various formats.
Downloads (link to download the article as PDF)
Open citations (links to open the citations from this article in various online reference manager services)
Cite this article (links to download the citations from this article in formats compatible with various reference manager tools)
Chromatinization of Escherichia coli with archaeal histones
eLife 8:e49038.
https://doi.org/10.7554/eLife.49038


