Stepwise polarisation of developing bilayered epidermis is mediated by aPKC and E-cadherin in zebrafish
- Tata Institute of Fundamental Research, India
Figures
Figure 1 with 5 supplements
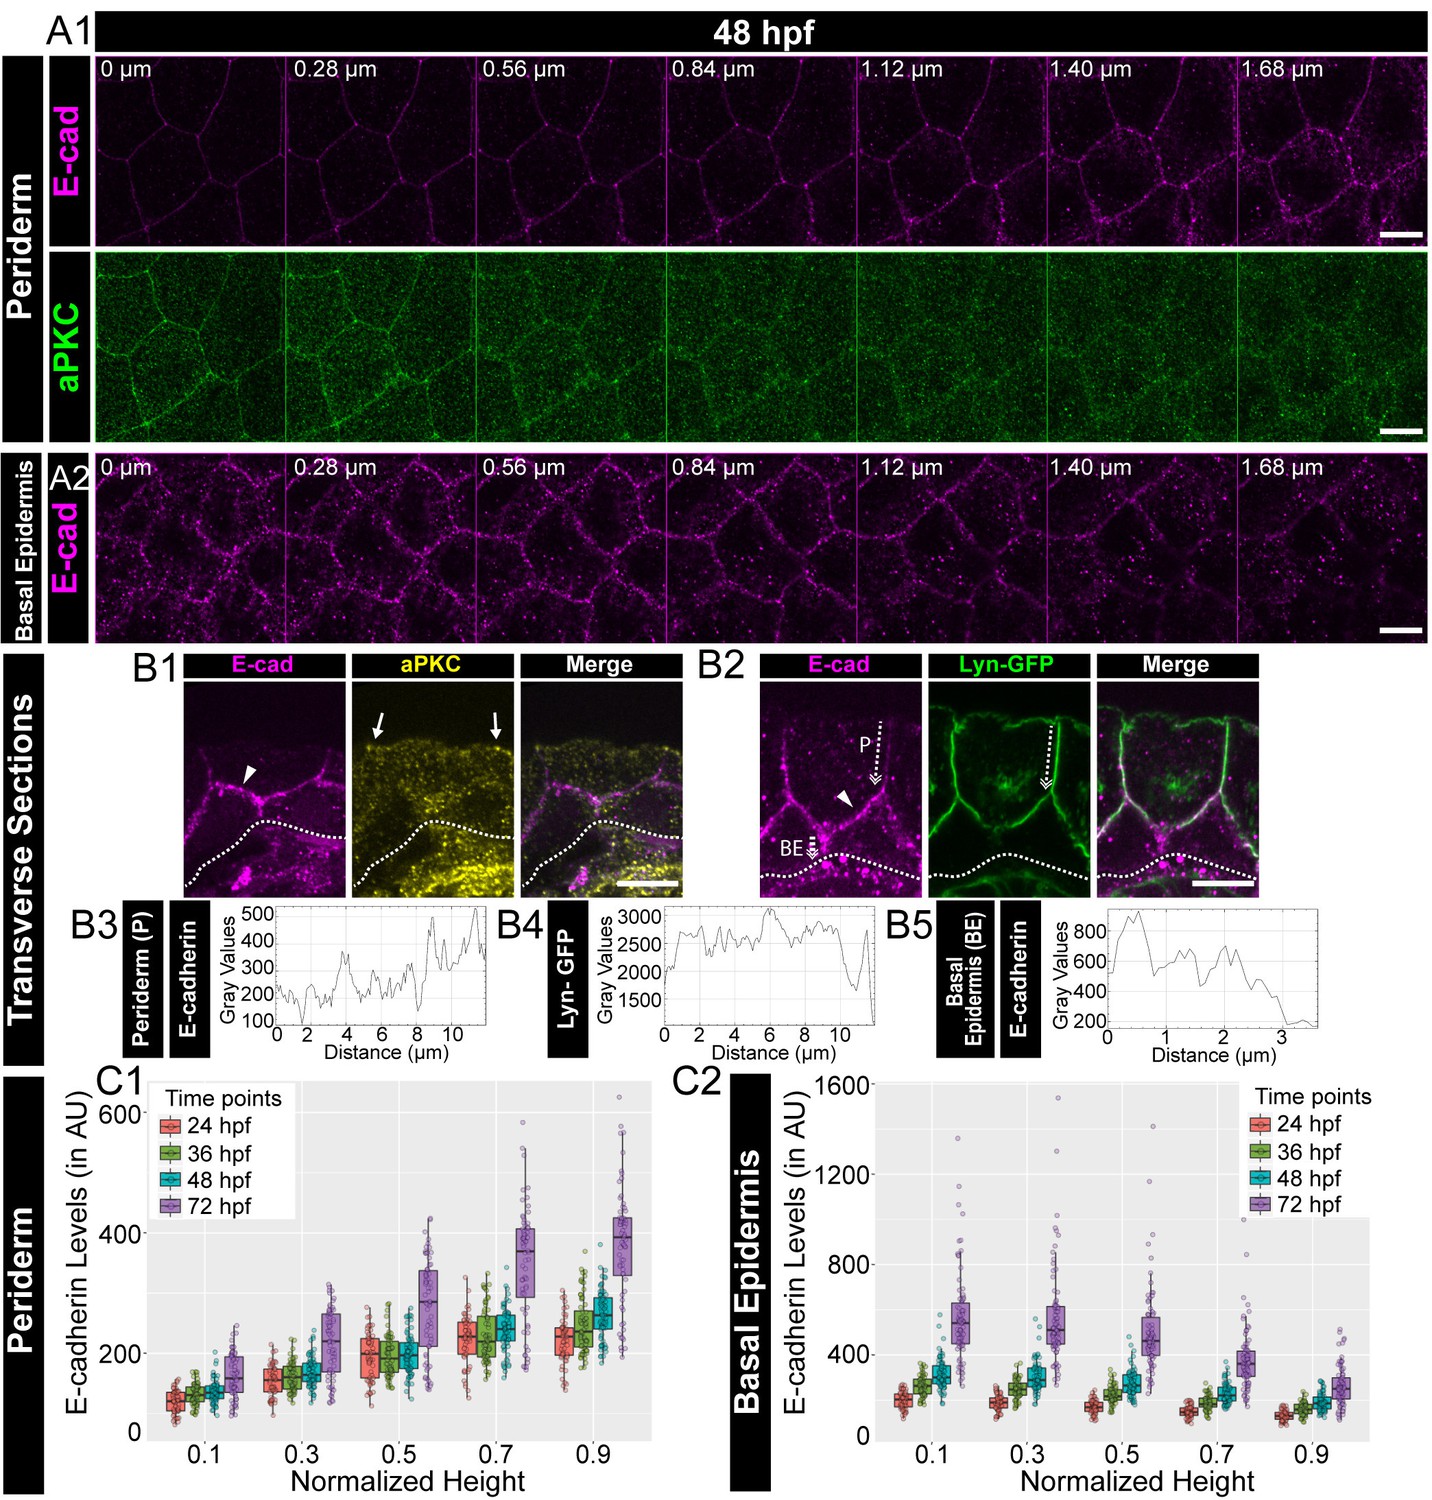
Polarised localisation of E-cadherin in zebrafish bilayered epidermis during early development.
Confocal images of the periderm (A1) and basal epidermis (A2) showing localisation of E-cadherin (magenta) and aPKC (green) along various cell-heights at 48hpf in wild type embryos. Note 0 µm is the apical most section in both periderm as well as in the basal epidermis. Transverse sections of the epidermis covering the eye showing localisation of (B1) E-cadherin (magenta) and aPKC (yellow) and (B2) E-cadherin (magenta) and Lyn-GFP (green). Dotted arrows mark the cell boundary (B2) used for line intensity profiles for E-cadherin (B3) and Lyn-GFP (B4) in the Periderm (P) and for E-cadherin (B5) in Basal epidermis (BE). Quantification of E-cadherin levels along apicobasal axis at the normalised cell heights in the periderm (C1) and the basal epidermis (C2) at different developmental time points. Arrowheads in B1 and B2 point to maximum levels of E-cadherin at the interface of the two layers. Solid arrows in B1 point to aPKC localisation. Dotted lines mark the base of the epidermis. Scale bar is equivalent to 10 µm (A1, A2, B1, B2). AU = Arbitrary Units. Source file with fluorescence intensities for periderm and basal epidermis is available as Figure 1—source data 1 and 2 respectively.
-
Figure 1—source data 1
Fluorescence intensities of E-cadherin localisation in the periderm of wild type embryos at different deveoplmental time points.
In this source dataset and all the remaining datasets, the coloumn 'mean' corresponds to the mean fluorescence intensities.
- https://cdn.elifesciences.org/articles/49064/elife-49064-fig1-data1-v1.csv
-
Figure 1—source data 2
Fluorescence intensities of E-cadherin localisation in the basal epidermis of wild type embryos at different deveoplmental time points.
- https://cdn.elifesciences.org/articles/49064/elife-49064-fig1-data2-v1.csv
Figure 1—figure supplement 1
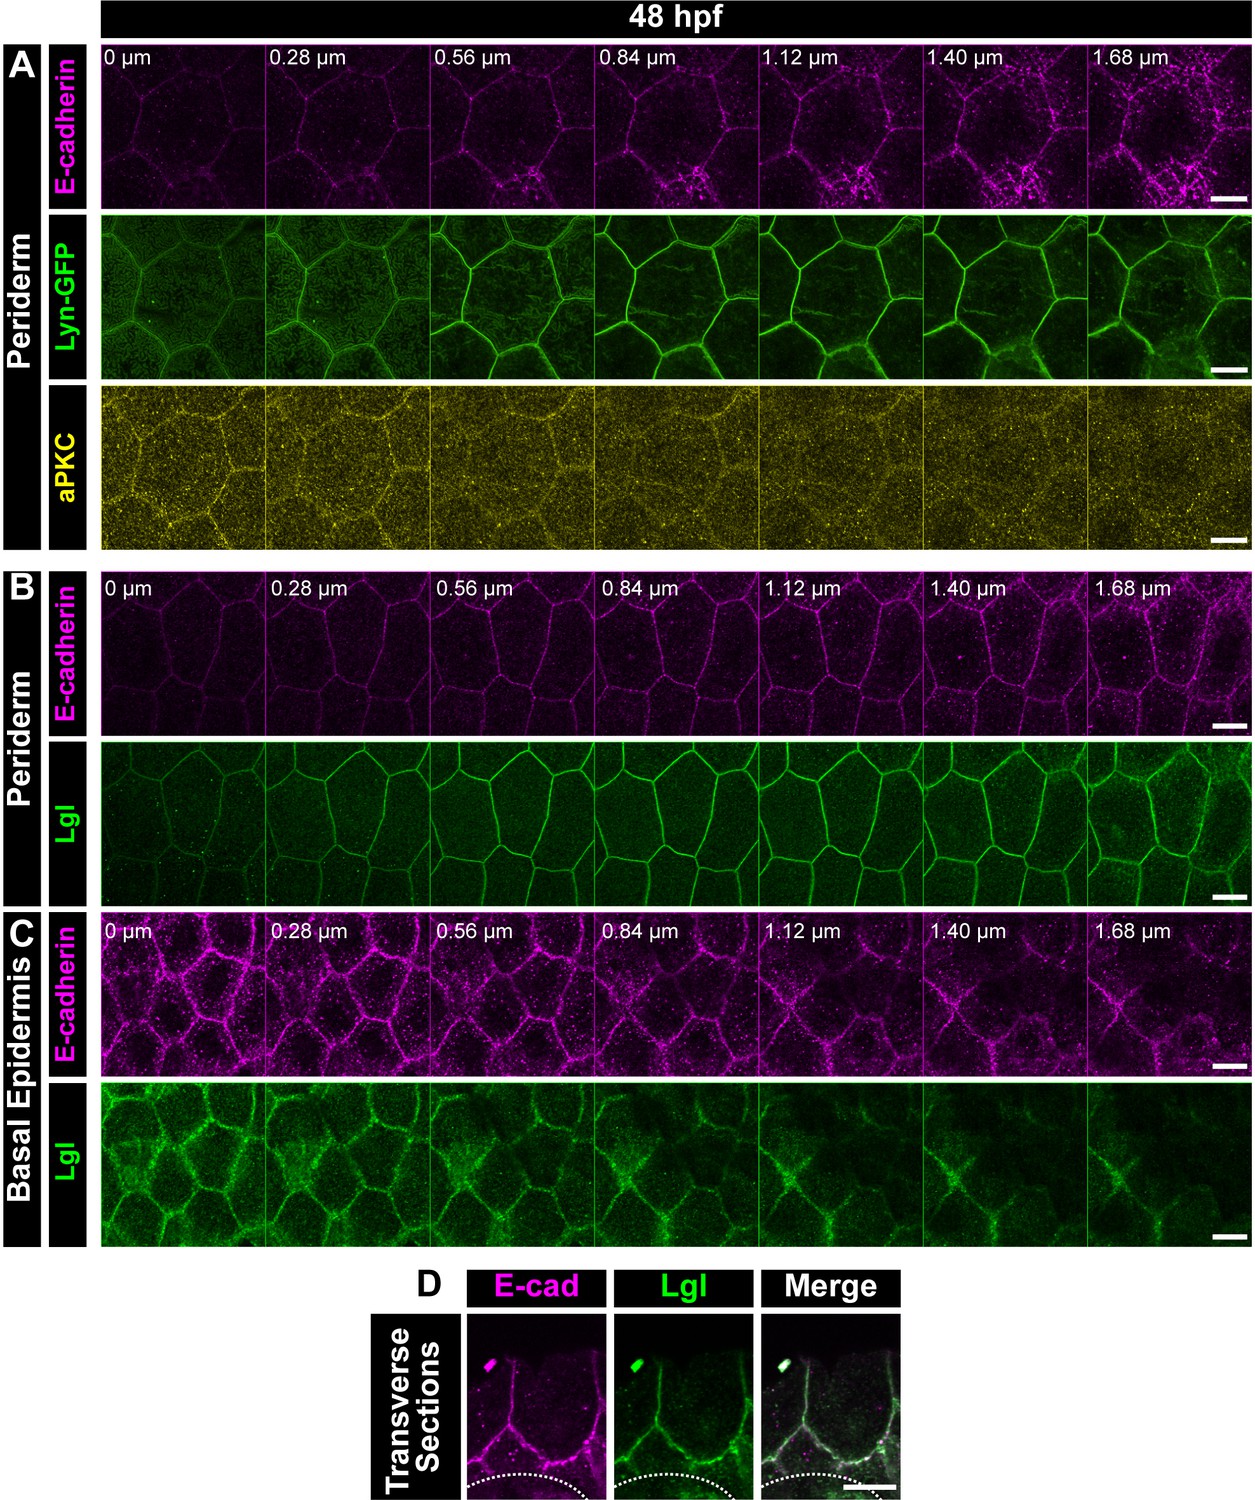
Localisation of E-cadherin with cell polarity markers in the zebrafish embryonic epidermis.
Confocal Z-stack showing localisation of E-cadherin (magenta), Lyn-GFP (green) and aPKC (yellow) in the periderm (A). Confocal Z-stacks depicting the apical to basal localisation of Lgl2 (green) and E-cadherin (magenta) in the periderm (B) and basal epidermis (C) at 48hpf. Transverse section of the epidermis over the eye showing localisation of E-cadherin (magenta) and Lgl2 (green) (D). Dotted lines in (D) mark the base of the epidermis. 0 µm = apical; Scale bar represents 10 µm (A, B, C, D).
Figure 1—figure supplement 2
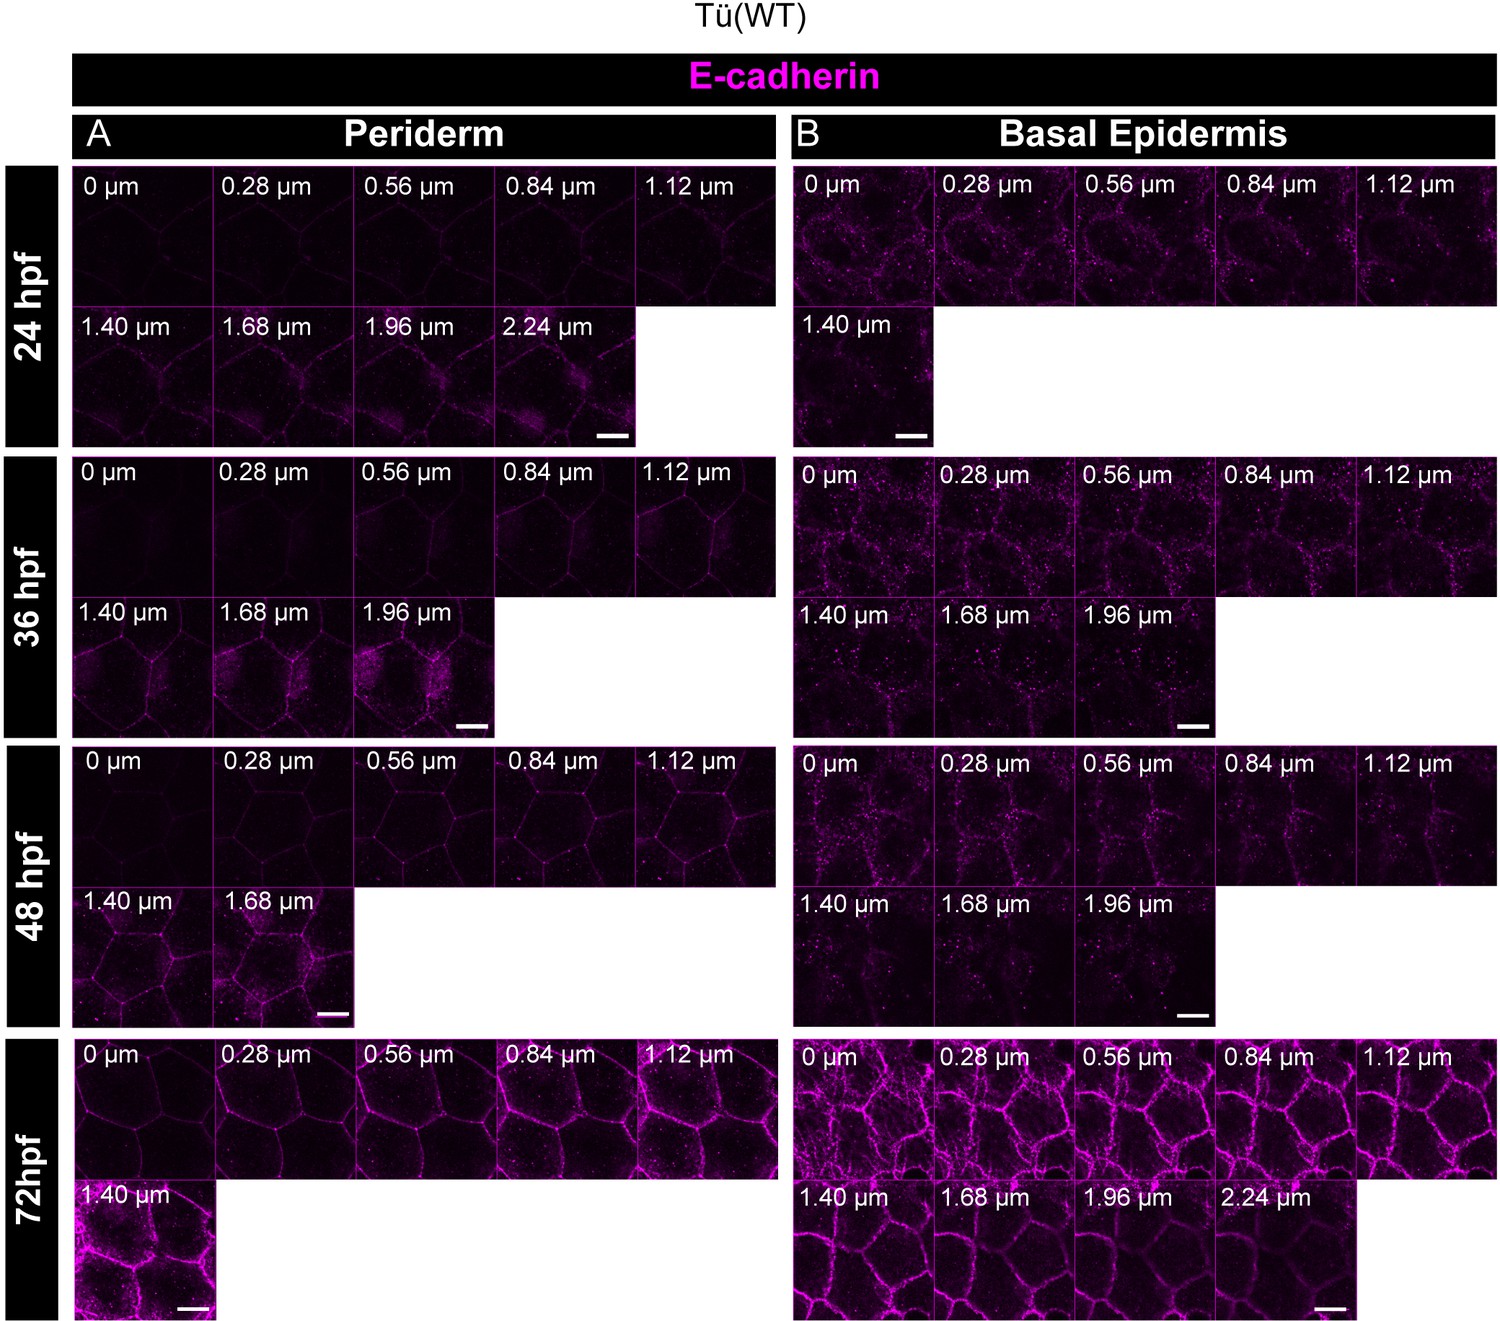
E-cadherin localisation is polarised during early epidermis development.
Confocal analysis of E-cadherin (magenta) immunolocalisation along the apicobasal axis (0 µm is apical) in the periderm (A) and basal epidermis (B) in wild-type embryos from 24hpf to 72hpf. Scale bar equals to 10 µm.
Figure 1—figure supplement 3
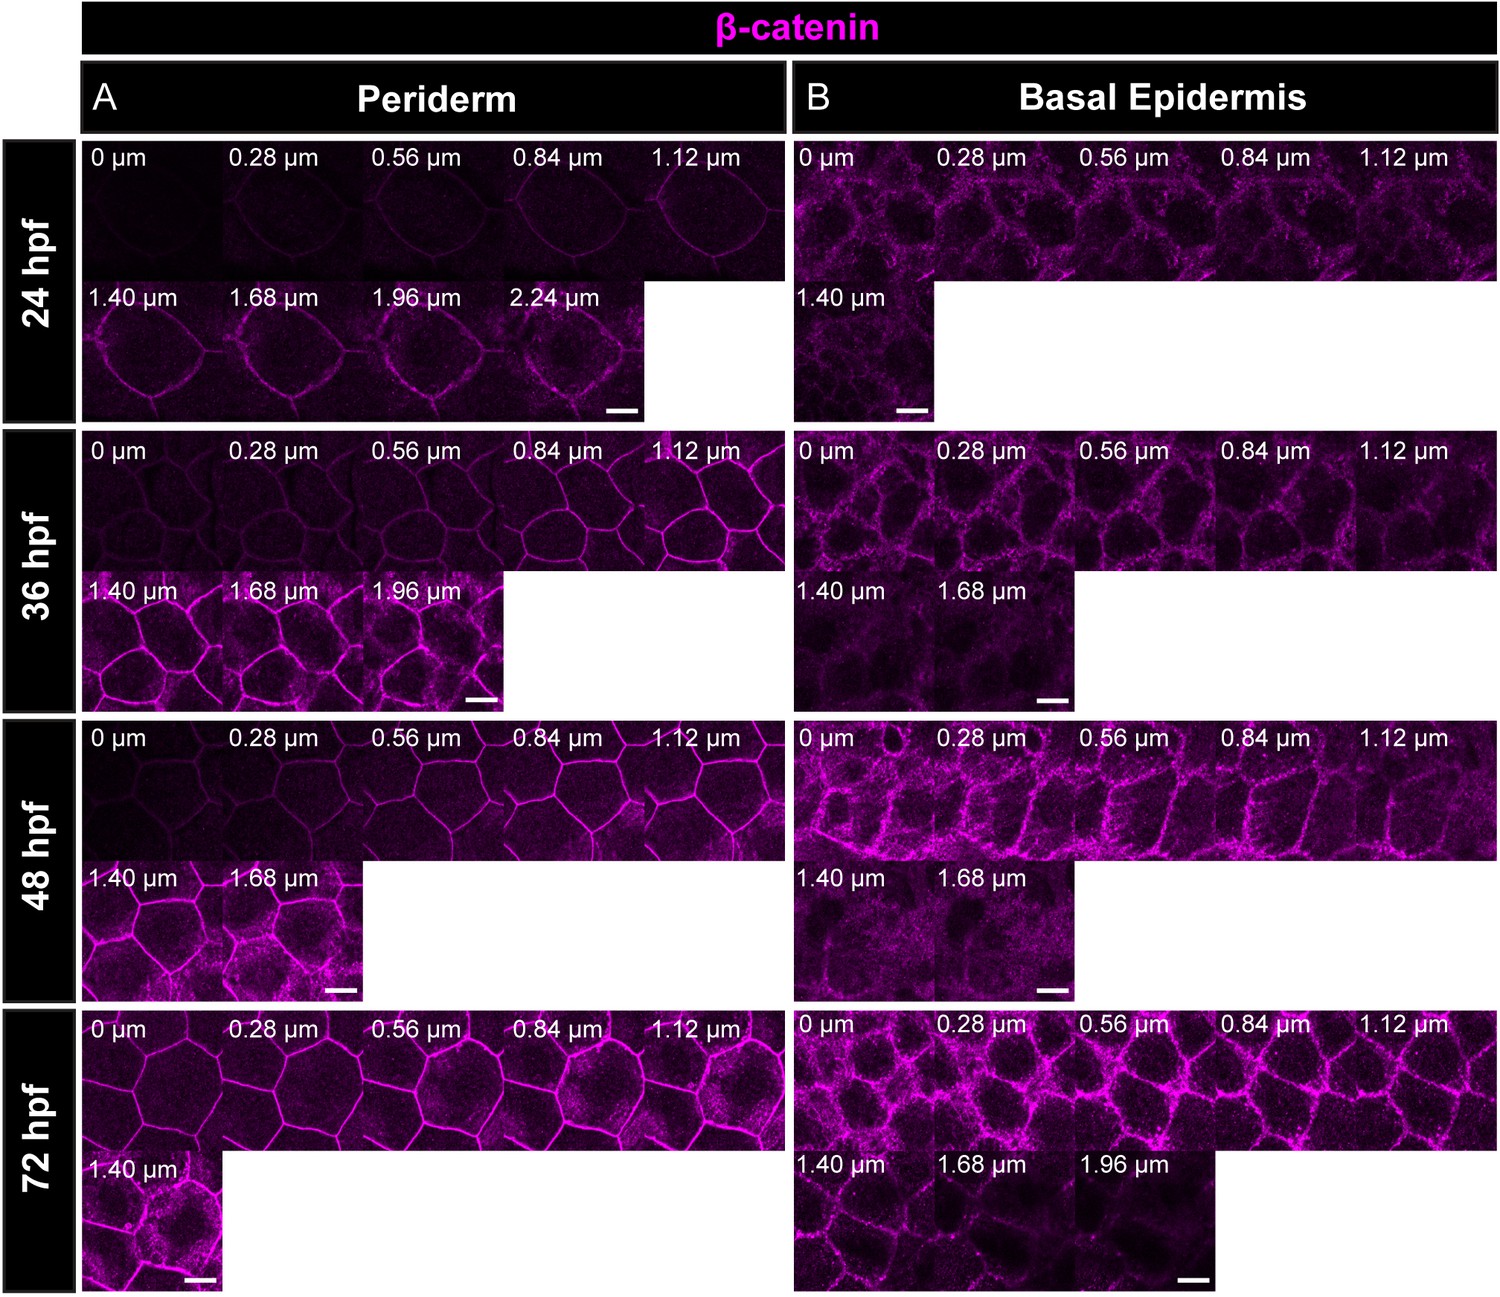
Localisation of β-catenin in the periderm and basal epidermis indicates the presence of adherens junctions during the epidermis development.
Immunostaining of β-catenin reveals that the adherens junctions are present along the apicobasal axis in periderm (A) and basal epidermis (B) at the mentioned time-points. 0 µm = apical; Scale bar represents 10 µm.
Figure 1—figure supplement 4
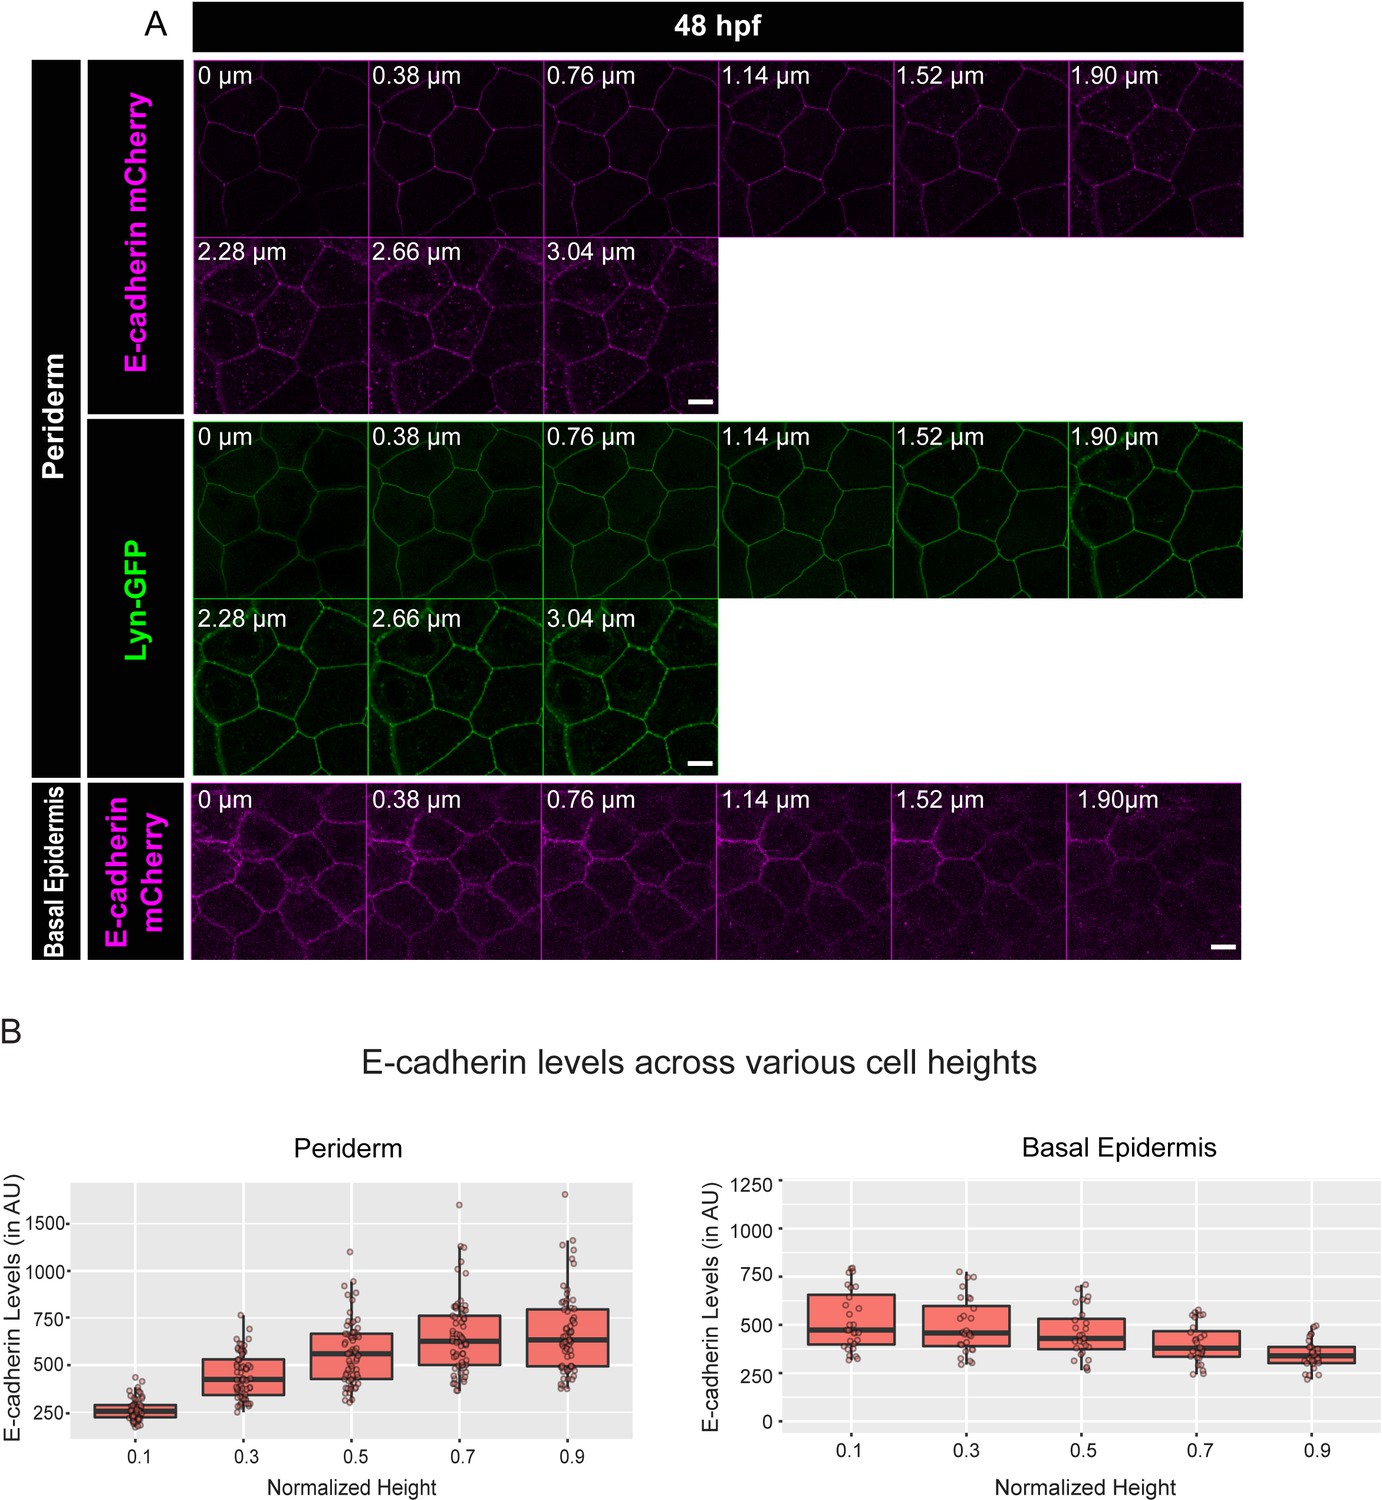
Live imaging analysis confirms that E-cadherin localises in a polarised manner in the early developing epidermis.
Live confocal analysis (A) of E-cadherin-mCherry (magenta) and Lyn-GFP (Green) localisation along the apicobasal axis (0 µm is apical) in the periderm and basal epidermis in wild-type embryos at 48hpf. Quantification of E-cadherin levels along apicobasal axis at the normalised cell heights in the periderm and basal epidermis (B). Scale bar equals to 10 µm. Source file with fluorescence intensities for periderm and basal epidermis is available as Figure 1—figure supplement 4—source data 1 and 2, respectively.
-
Figure 1—figure supplement 4—source data 1
Fluorescence intensities of E-cadherin-mCherry in the periderm of live wild type embryos in the background of Lyn-GFP at 48hpf.
- https://cdn.elifesciences.org/articles/49064/elife-49064-fig1-figsupp4-data1-v1.csv
-
Figure 1—figure supplement 4—source data 2
Fluorescence intensities of E-cadherin-mCherry in the basal epidermis of live wild type embryos in the background of Lyn-GFP at 48hpf.
- https://cdn.elifesciences.org/articles/49064/elife-49064-fig1-figsupp4-data2-v1.csv
Figure 1—video 1
Localisation of E-cadherin and aPKC in the epidermal bilayer.
Movie of confocal slices showing localisation of E-cadherin (magenta), and aPKC (yellow) with respect to Lyn-GFP (green) in the periderm and basal epidermis. Note that at the transition between periderm and basal epidermis, E-cadherin strands plausibly mark the auto-cellular junctions formed within epidermal cells wrapping the axons.
Figure 2 with 4 supplements
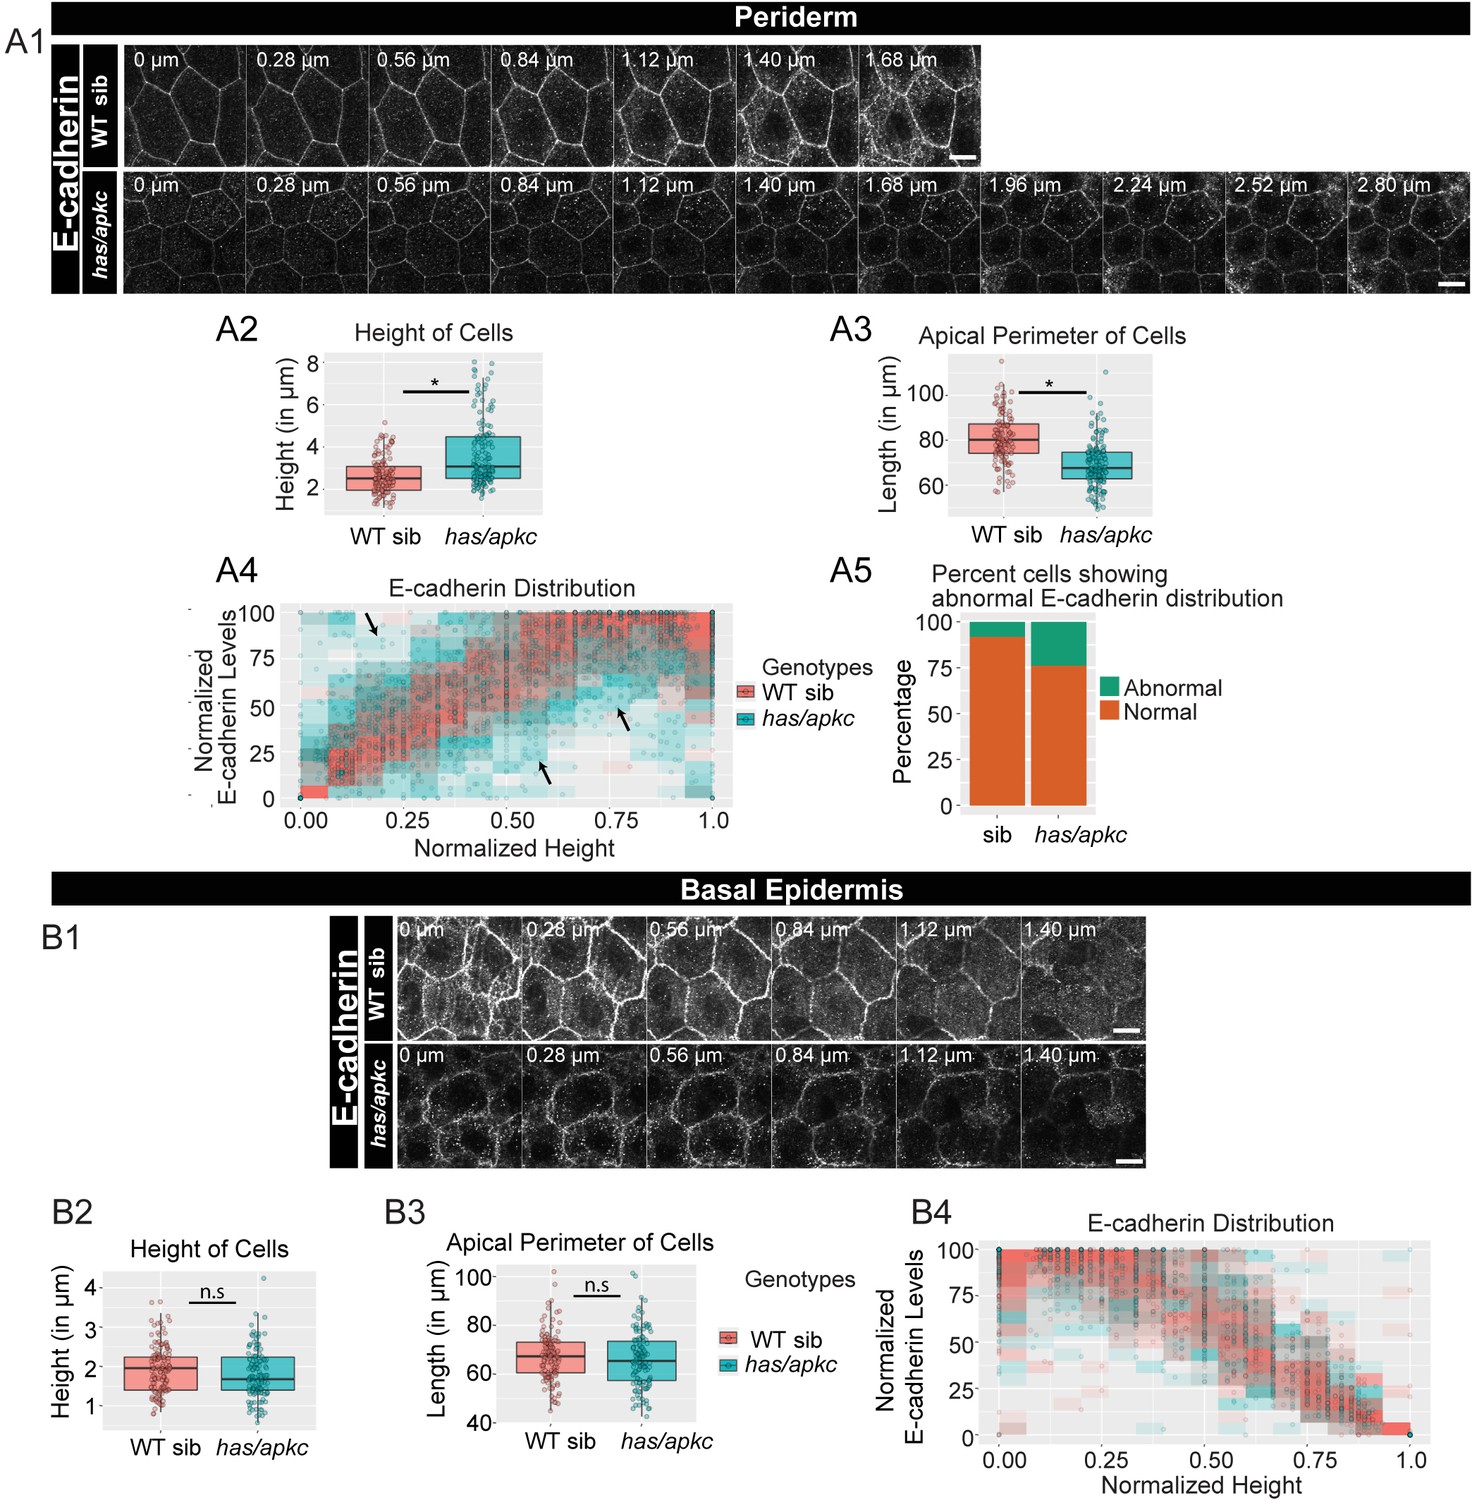
has/apkc function is required to restrict the noise in E-cadherin polarity.
Immunolocalisation of E-cadherin along the apicobasal axis (0 µm is apical) in wild-type (WT) sibling and has/apkc mutant in the periderm (A1) and basal epidermis (B1) at 48hpf. Comparison of height of cells (A2, B2) and apical perimeter (A3, B3) in the periderm (A2, A3) and basal epidermis (B2, B3) of the two genetic conditions. Graphs showing polarised localisation of E-cadherin across normalised cell height in the periderm (A4) and basal epidermis (B4). A graph showing noise index in E-cadherin localisation in WT siblings versus has/apkc mutants (A5). Arrows in A4 pointing to the abnormal localisation of E-cadherin. Scale bars in A1, B1 are equivalent to 10 µm. AU = Arbitrary Units; WT = wild type, sib = sibling/s and has/apkc = has/apkc mutants. Asterisk indicates significant difference at p<0.05 and n.s. means non-significant difference observed by Mann Whitney U test. Source file with fluorescence intensities for periderm and basal epidermis is available as Figure 2—source data 1 and 2, respectively. Statistical analysis with p values for all the graphs of periderm and basal epidermis is available as Figure 2—source data 3 and 4, respectively.
-
Figure 2—source data 1
Fluorescence intensities of E-cadherin and measurements of cellular attributes in the periderm of has/apkc mutants and WT siblings at 48 hpf.
- https://cdn.elifesciences.org/articles/49064/elife-49064-fig2-data1-v1.csv
-
Figure 2—source data 2
Fluorescence intensities of E-cadherin and measurements of cellular attributes in the basal epidermis of has/apkc mutants and WT siblings at 48 hpf.
- https://cdn.elifesciences.org/articles/49064/elife-49064-fig2-data2-v1.csv
-
Figure 2—source data 3
Statistical summaries of comparisons of cellular attributes and assessment of polarity in the periderm of has/apkc mutants and WT siblings presented in Figure 2 A2-A5.
- https://cdn.elifesciences.org/articles/49064/elife-49064-fig2-data3-v1.docx
-
Figure 2—source data 4
Statistical summaries of comparisons of cellular attributes in the basal epidermis of has/apkc mutants and WT siblings presented in Figure 2 B2-B3.
- https://cdn.elifesciences.org/articles/49064/elife-49064-fig2-data4-v1.docx
Figure 2—figure supplement 1
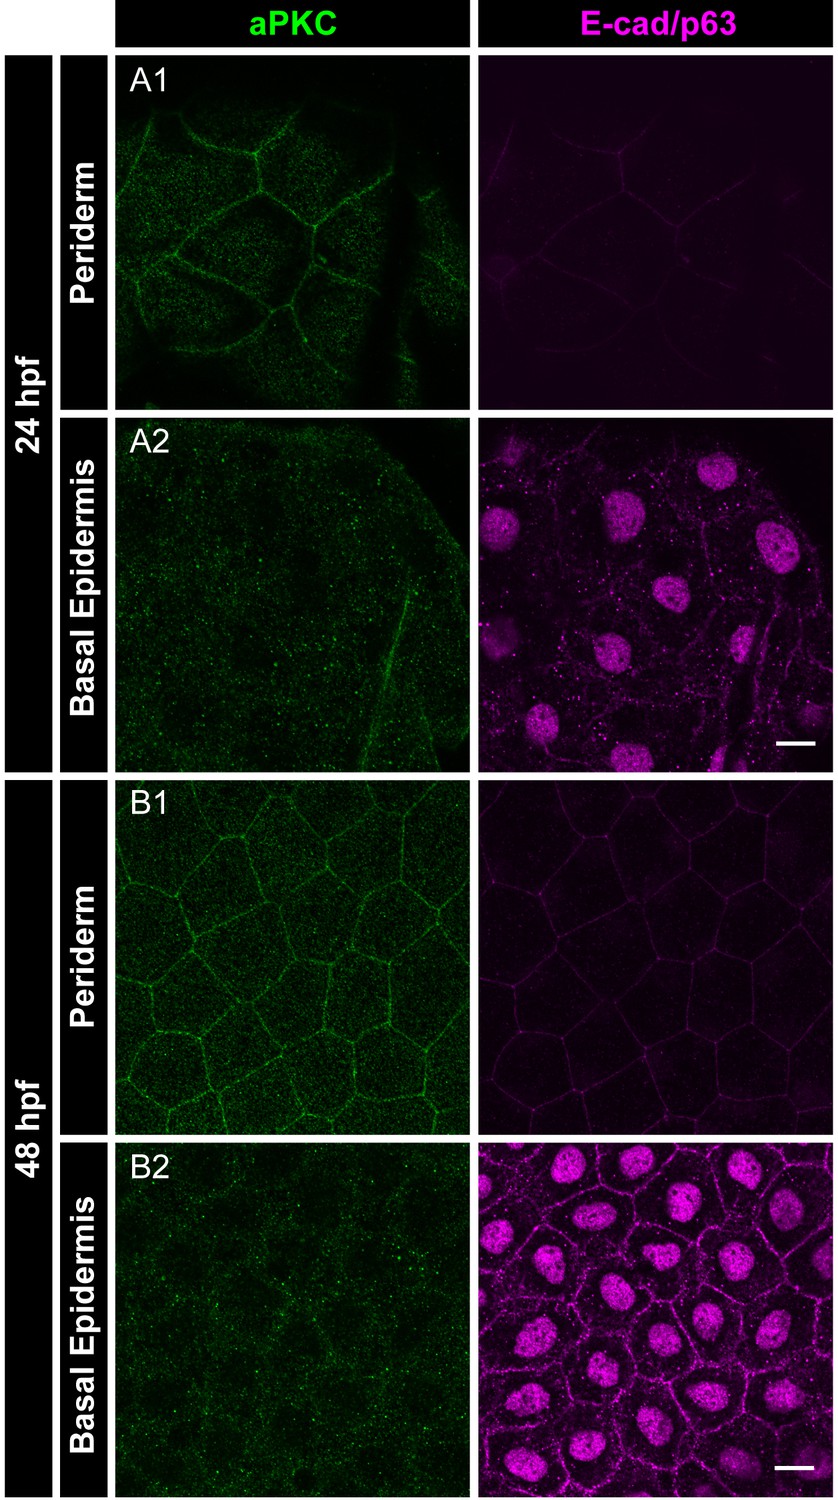
Localisation of aPKC in the periderm at different developmental stages.
Immunolocalisation of aPKC (green) and E-cadherin as well as p63 (basal epidermis marker; both magenta) in the periderm and basal epidermis at 24hpf (A1, A2) and 48hpf (B1, B2) showing absence of aPKC in the basal epidermis. Scale bar in A2 and B2 corresponds to 10 µm.
Figure 2—figure supplement 2
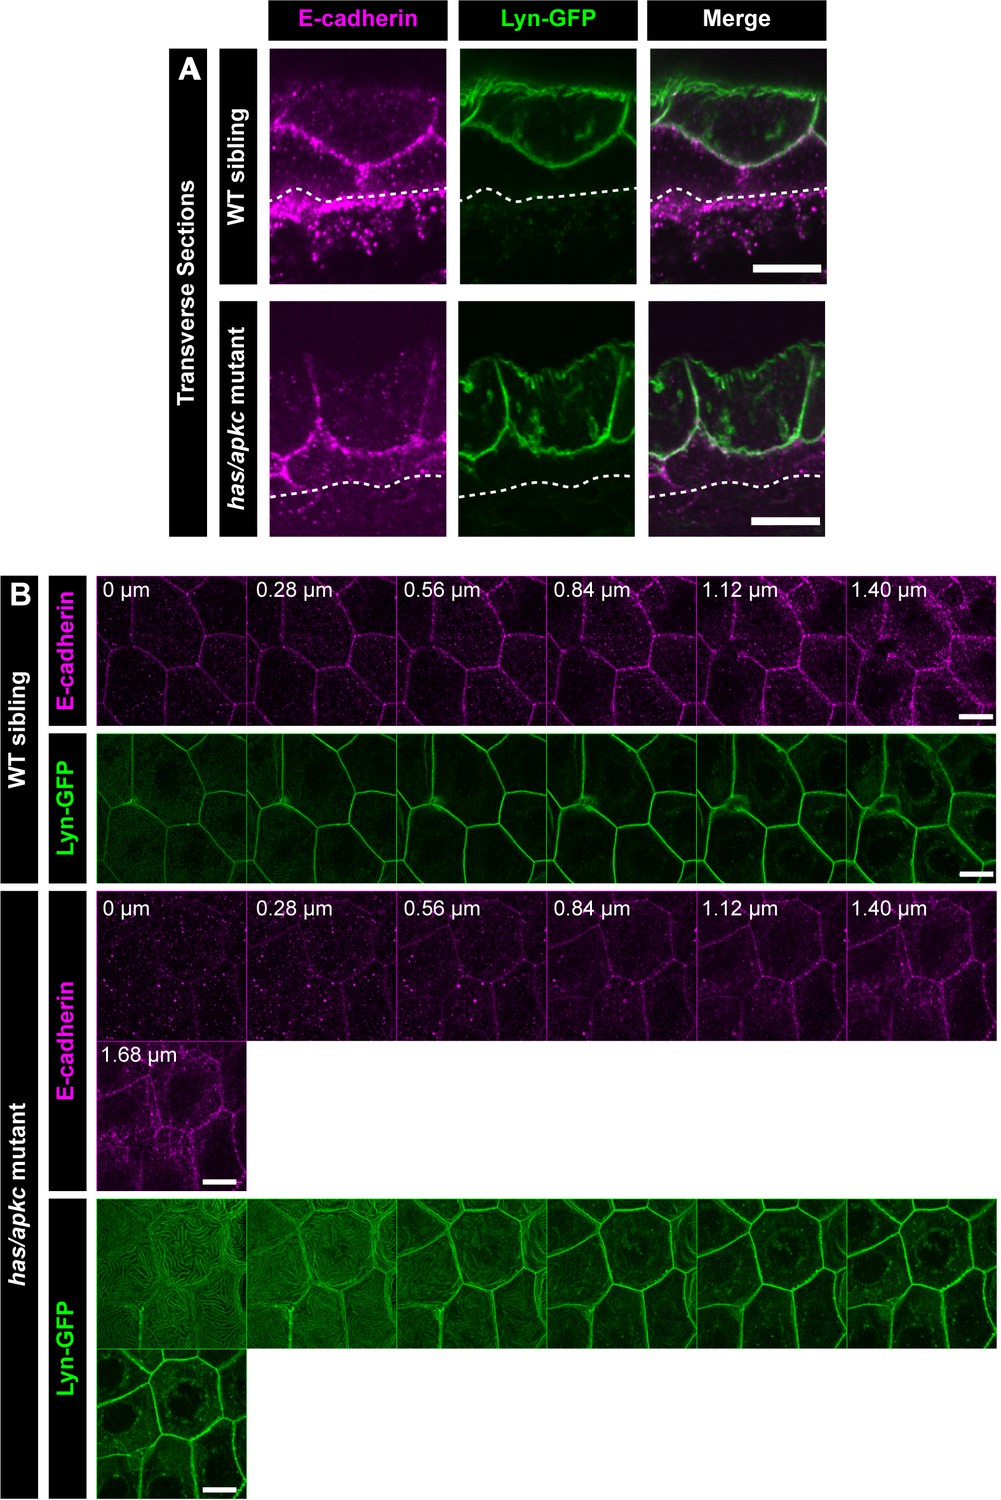
E-cadherin localisation with respect to Lyn-GFP in has/apkc mutants in the periderm.
Transverse section through the dorsal head epidermis at 48hpf showing localisation of E-cadherin (magenta) and Lyn-GFP (green) along the apicobasal axis in WT siblings and has/apkc mutants (A). Dotted lines in (A) mark the base of the epidermis. Confocal micrographs showing localisation of E-cadherin (magenta) and Lyn-GFP (green) along the apicobasal axis (0 µm is apical) in the periderm in WT sibling and has/apkc mutant embryos at 48hpf (B). Scale bar represents 10 µm (A, B).
Figure 2—figure supplement 3
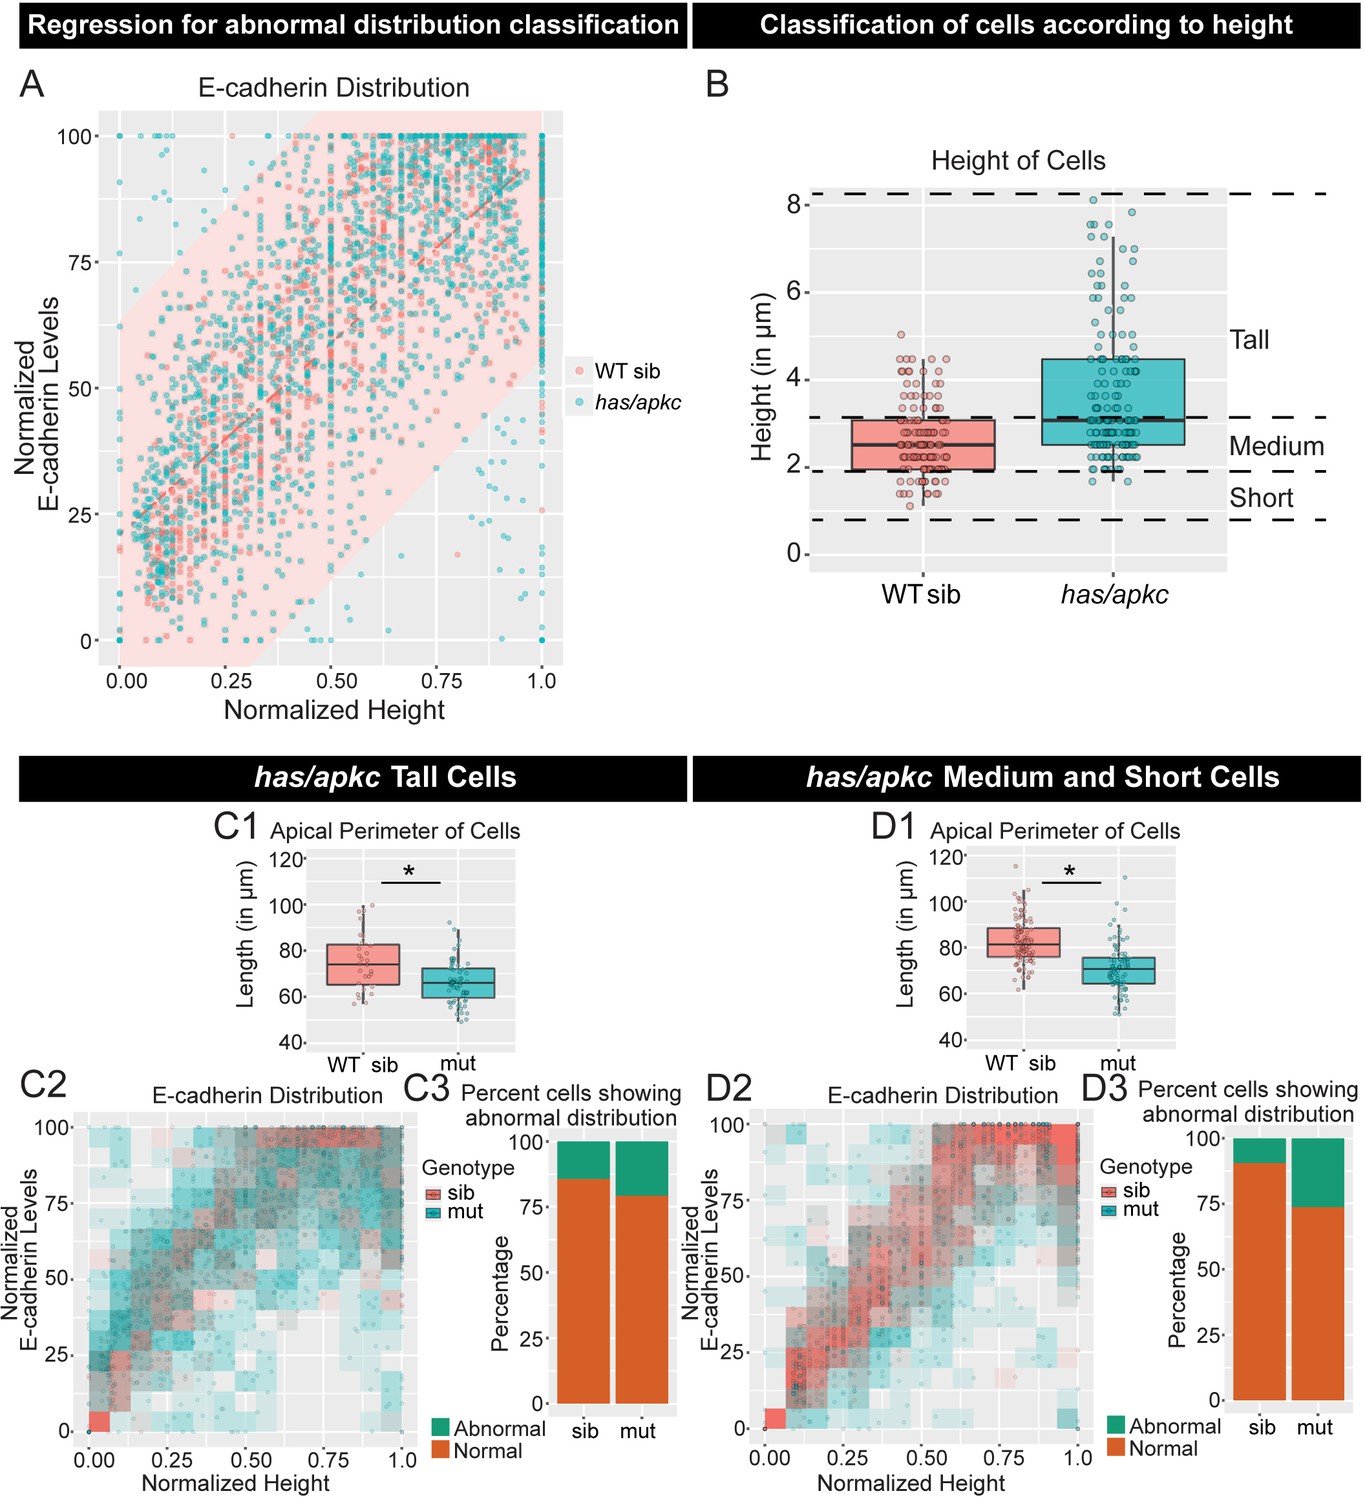
has/apkc regulates polarised localisation of E-cadherin independent of peridermal cell height.
Regression analysis of normalised E-cadherin intensity plotted against normalised cell-height (A) performed on data presented in Figure 2A4. The red line marks the regression line and red shaded area marks the 99% prediction limits as per the sibling data. The points outside the red area are considered to have abnormal distribution. The wild type siblings (WT sib) and has/apkc mutant cells are classified according to the height as tall, medium or short cells (B). The apical perimeter was reduced in both tall and medium/short cells (C1, D1) in has/apkc mutant embryos. A graphical representation of E-cadherin localisation along the apicobasal axis (C2, D2) and the noise index (C3, D3) in has/apkc mutants show a decrease in robustness of E-cadherin polarity in both tall (C2, C3) and medium/short cells (D2, D3). Asterisk indicates significant difference (p<0.05) and n.s. means non-significant difference by Mann Whitney U statistical test. AU = Arbitrary Units; WT sib = wild type siblings; has/apkc = has/apkc mutants; mut = has/apkc mutants. Source file with fluorescence intensities for tall and medium/short cells is available as Figure 2—figure supplement 3—source data 1 and 2, respectively. Statistical analysis with p values for all the graphs of tall and medium/short cells is available as Figure 2—figure supplement 3—source data 3 and 4, respectively.
-
Figure 2—figure supplement 3—source data 1
Fluorescence intensities of E-cadherin localisation and apical perimeter of tall cells of has/apkc mutants and WT siblings at 48 hpf for Figure 2—figure supplement 3 C1-C3.
- https://cdn.elifesciences.org/articles/49064/elife-49064-fig2-figsupp3-data1-v1.csv
-
Figure 2—figure supplement 3—source data 2
Fluorescence intensities of E-cadherin localization and apical perimeter of medium/short cells of has/apkc mutants and WT siblings at 48 hpf for Figure 2—figure supplement 3 D1-D3.
- https://cdn.elifesciences.org/articles/49064/elife-49064-fig2-figsupp3-data2-v1.csv
-
Figure 2—figure supplement 3—source data 3
Statistical summary of comparison of apical perimeter and polarity assessment between tall cells in has/apkc mutants and WT siblings presented in Figure 2—figure supplement 3 C1-C3.
- https://cdn.elifesciences.org/articles/49064/elife-49064-fig2-figsupp3-data3-v1.docx
-
Figure 2—figure supplement 3—source data 4
Statistical summary of comparison of apical perimeter and polarity assessment between medium/short cells in has/apkc mutants and WT siblings presented in Figure 2—figure supplement 3 D1-D3.
- https://cdn.elifesciences.org/articles/49064/elife-49064-fig2-figsupp3-data4-v1.docx
Figure 2—figure supplement 4
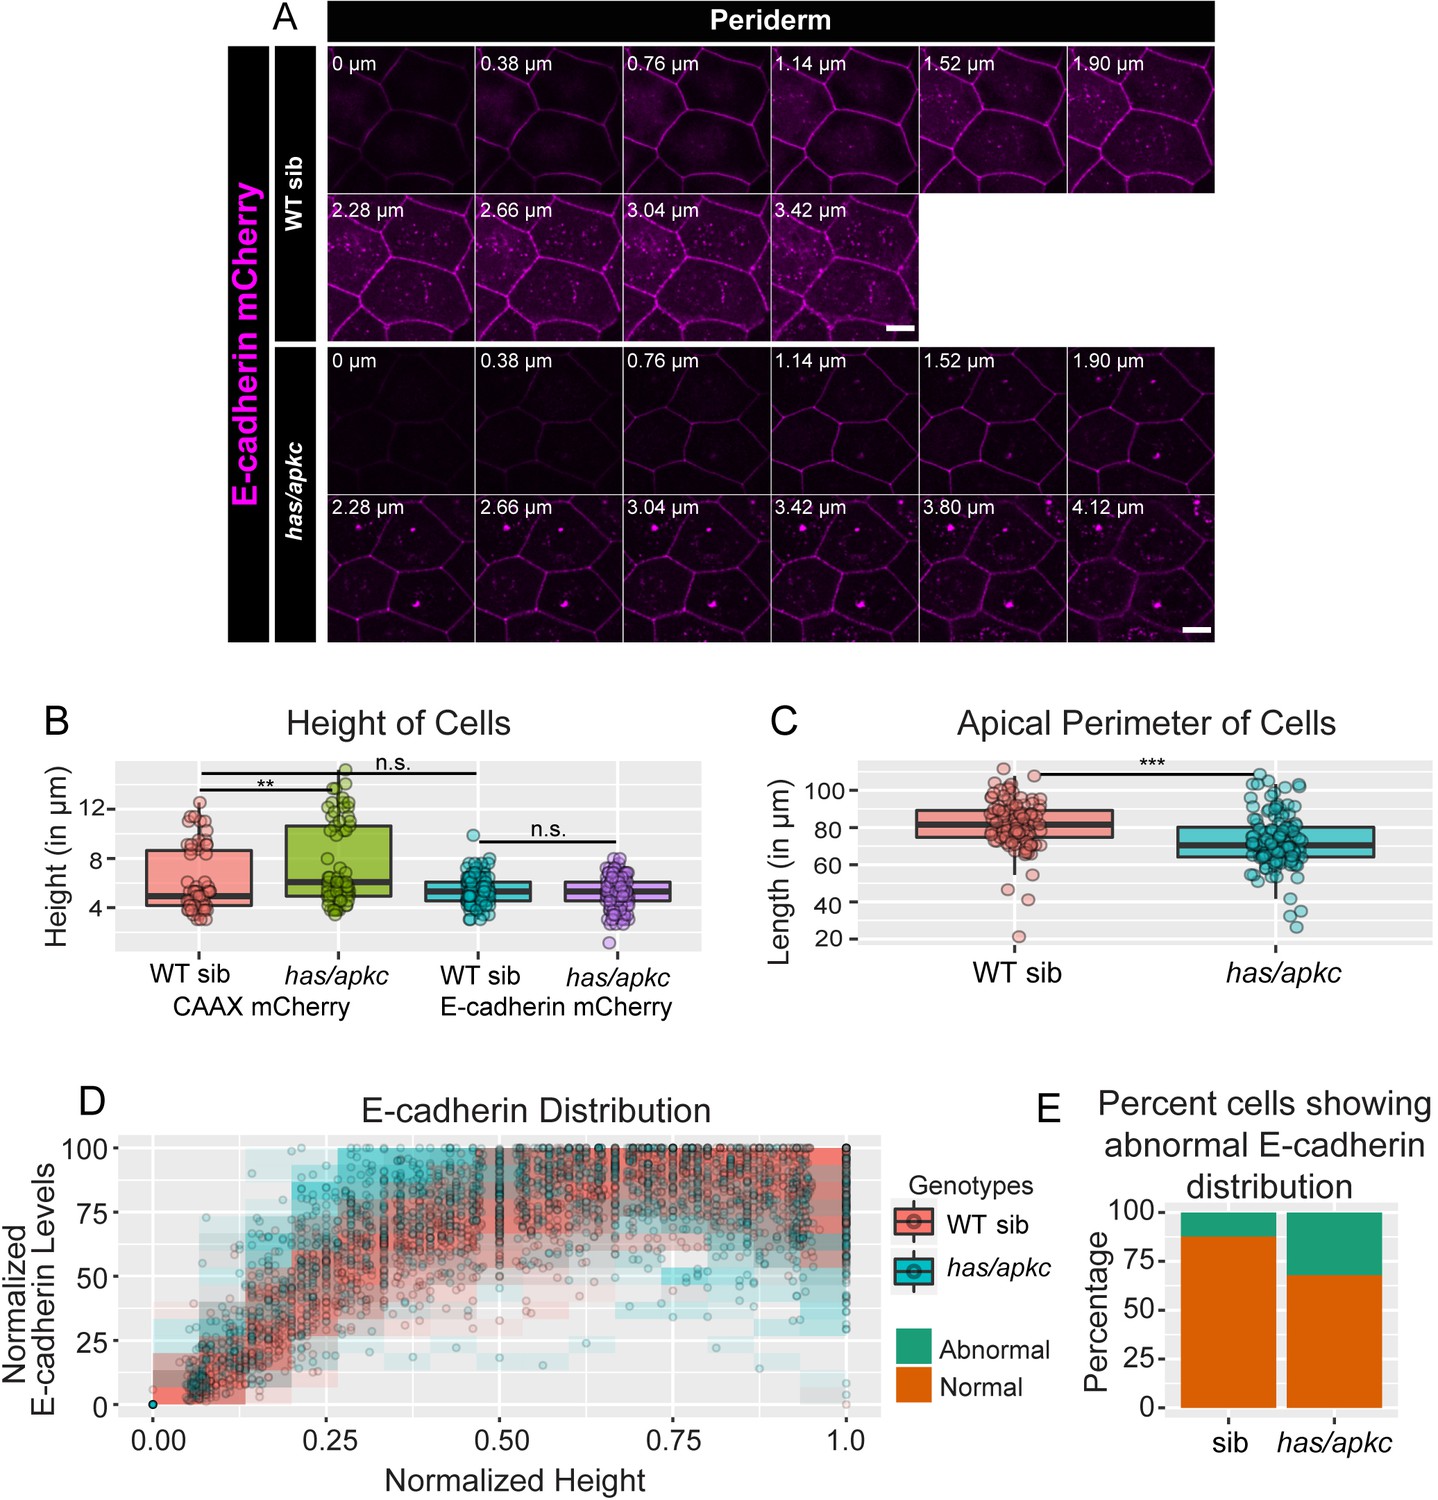
Demonstration of polarity defect in has/apkc mutant embryos in live expressing exogenous E-cadherin-mCherry.
Localisation of E-cadherin-mCherry (magenta) in the periderm of live wild type (WT) sibling and has/apkc mutant embryos at 48 hpf (A). Comparison of heights (B) and apical perimeter (C) in the periderm of wild-type sibling and has/apkc mutant embryos injected with E-cadherin-mCherry and CAAX-mCherry (B) or just E-cadherin-mCherry (C). Distribution of normalised E-cadherin intensities plotted against normalised heights in given genotypes (D). The stacked bar graph (E) shows the percentage of cells showing abnormal polarised distribution in live in wild type (WT) sibling and has/apkc mutant embryos. Scale bar represents 10 µm. WT = wild type; sib = siblings; has/apkc = has/apkc mutants; mut = has/apkc mutants. Source file with fluorescence intensities is available as Figure 2—figure supplement 4—source data 1. Statistical analysis with p values for all the graphs is available as Figure 2—figure supplement 4—source data 2.
-
Figure 2—figure supplement 4—source data 1
Fluorescence intensities of E-cadherin-mCherry in the periderm of has/apkc mutants and WT siblings imaged live at 48hpf.
- https://cdn.elifesciences.org/articles/49064/elife-49064-fig2-figsupp4-data1-v1.csv
-
Figure 2—figure supplement 4—source data 2
Statistical summaries of comparisons of cellular attributes and assessment of polarity in has/apkc mutants and WT siblings.
- https://cdn.elifesciences.org/articles/49064/elife-49064-fig2-figsupp4-data2-v1.docx
Figure 3
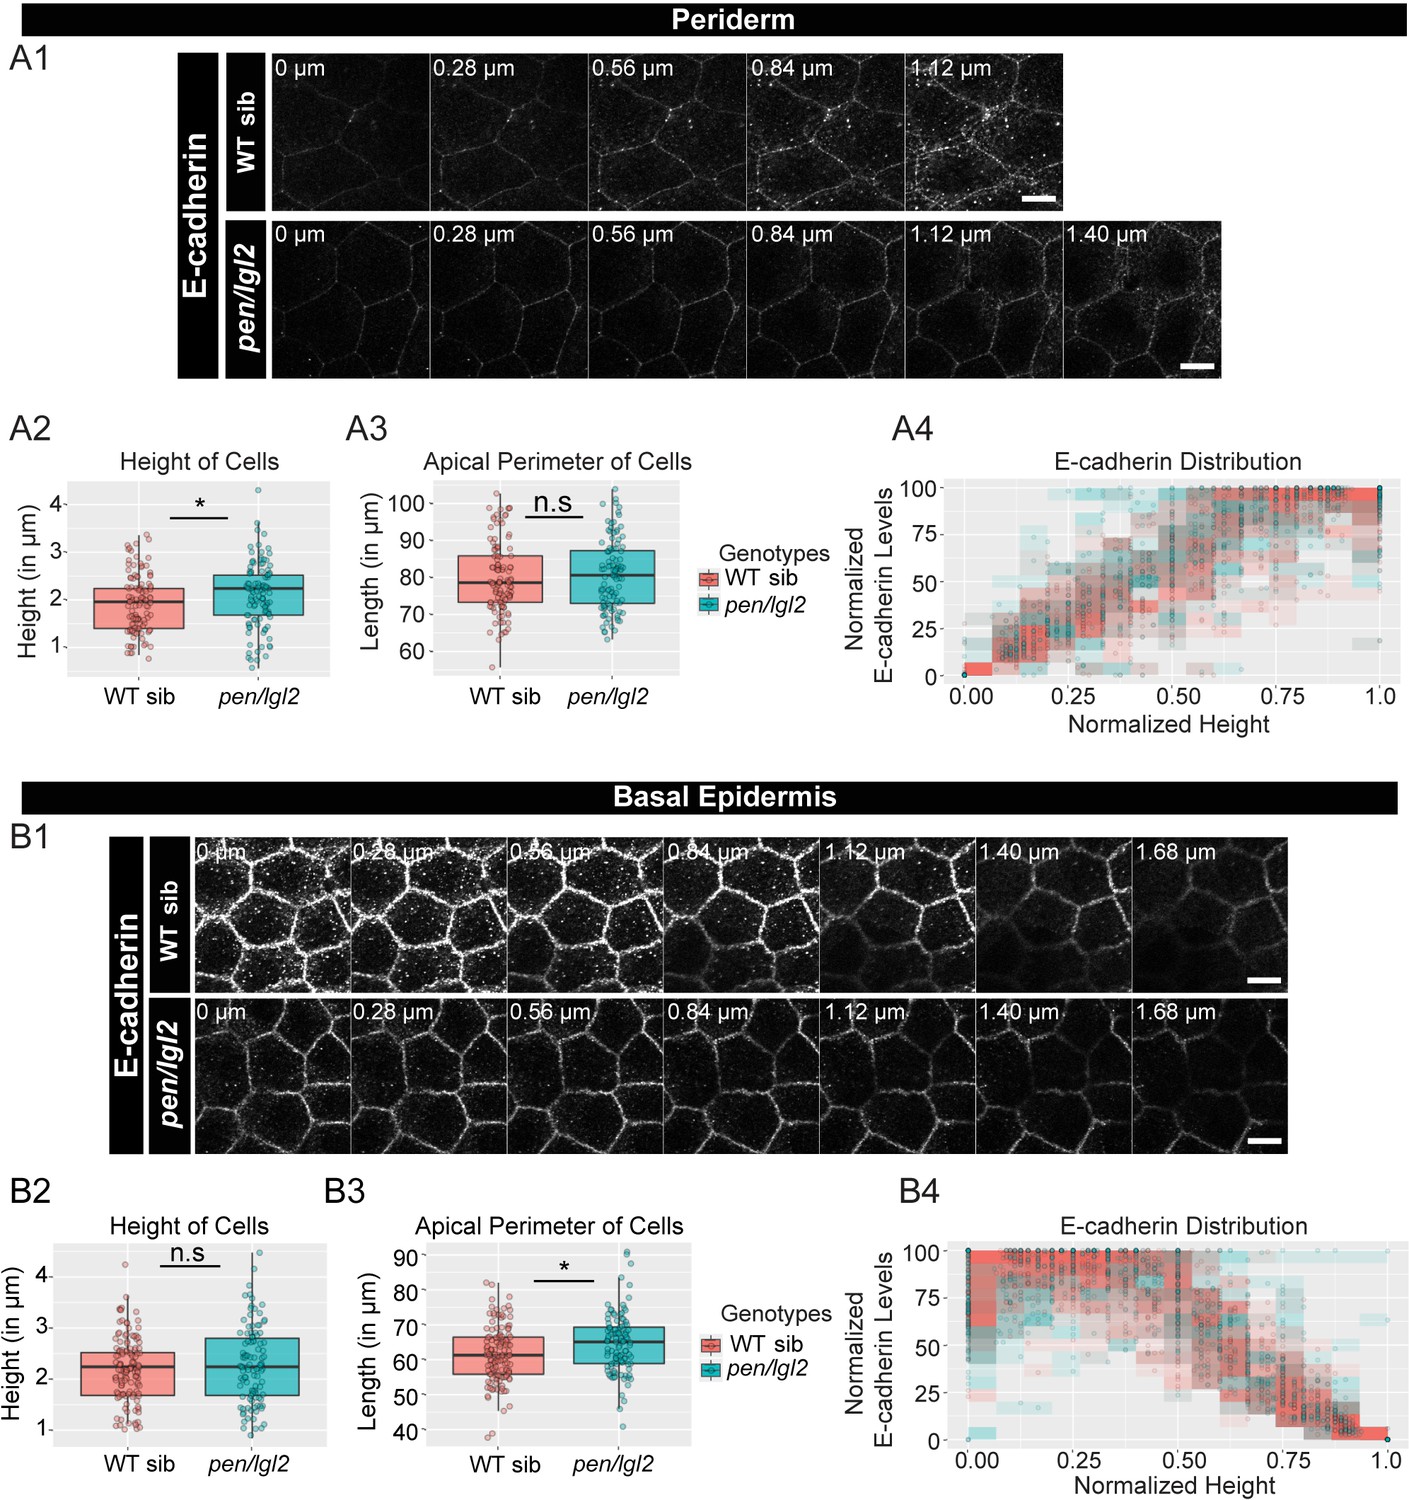
The loss of pen/lgl2 function has no effect on E-cadherin polarity.
Immunolocalisation of E-cadherin at various cell heights (0 µm is apical) along the apicobasal axis in wild-type sibling (WT sib) and pen/lgl2 mutant in the periderm (A1) and basal epidermis (B1) at 72hpf. Comparison between WT siblings and pen/lgl2 mutants in the periderm (A2–A4) and the basal epidermis (B2–B4) for height of cells (A2, B2) and apical perimeter (A3, B3). Graphs showing polarised distribution of E-cadherin across normalised cell height in the periderm (A4) and basal epidermis (B4) in WT siblings and pen/lgl2 mutants. Scale bar corresponds to 10 µm in A1 and B1. AU = Arbitrary Units; WT = wild type and sib = sibling/s. Asterisk indicates significant difference (p<0.05) and n.s. means non-significant difference by Mann Whitney U statistical test. Source file with fluorescence intensities for periderm and basal epidermis is available as Figure 3—source data 1 and 2, respectively. Statistical analysis with p values for all the graphs of periderm and basal epidermis is available as Figure 3—source data 3 and 4, respectively.
-
Figure 3—source data 1
Fluorescence intensities of E-cadherin localization and measurements of cellular attributes in the periderm of pen/lgl2 mutants and WT siblings at 72hpf.
- https://cdn.elifesciences.org/articles/49064/elife-49064-fig3-data1-v1.csv
-
Figure 3—source data 2
Fluorescence intensities of E-cadherin localization and measurements of cellular attributes in the basal epidermis of pen/lgl2 mutants and WT siblings at 72hpf.
- https://cdn.elifesciences.org/articles/49064/elife-49064-fig3-data2-v1.csv
-
Figure 3—source data 3
Statistical summaries of comparisons of cellular attributes in the periderm of pen/lgl2 mutants and WT siblings presented in Figure 3 A2-A3.
- https://cdn.elifesciences.org/articles/49064/elife-49064-fig3-data3-v1.docx
-
Figure 3—source data 4
Statistical summaries of comparisons of cellular attributes in the basal epidermis of pen/lgl2 mutants and WT siblings presented in Figure 3 B2-B3.
- https://cdn.elifesciences.org/articles/49064/elife-49064-fig3-data4-v1.docx
Figure 4 with 3 supplements
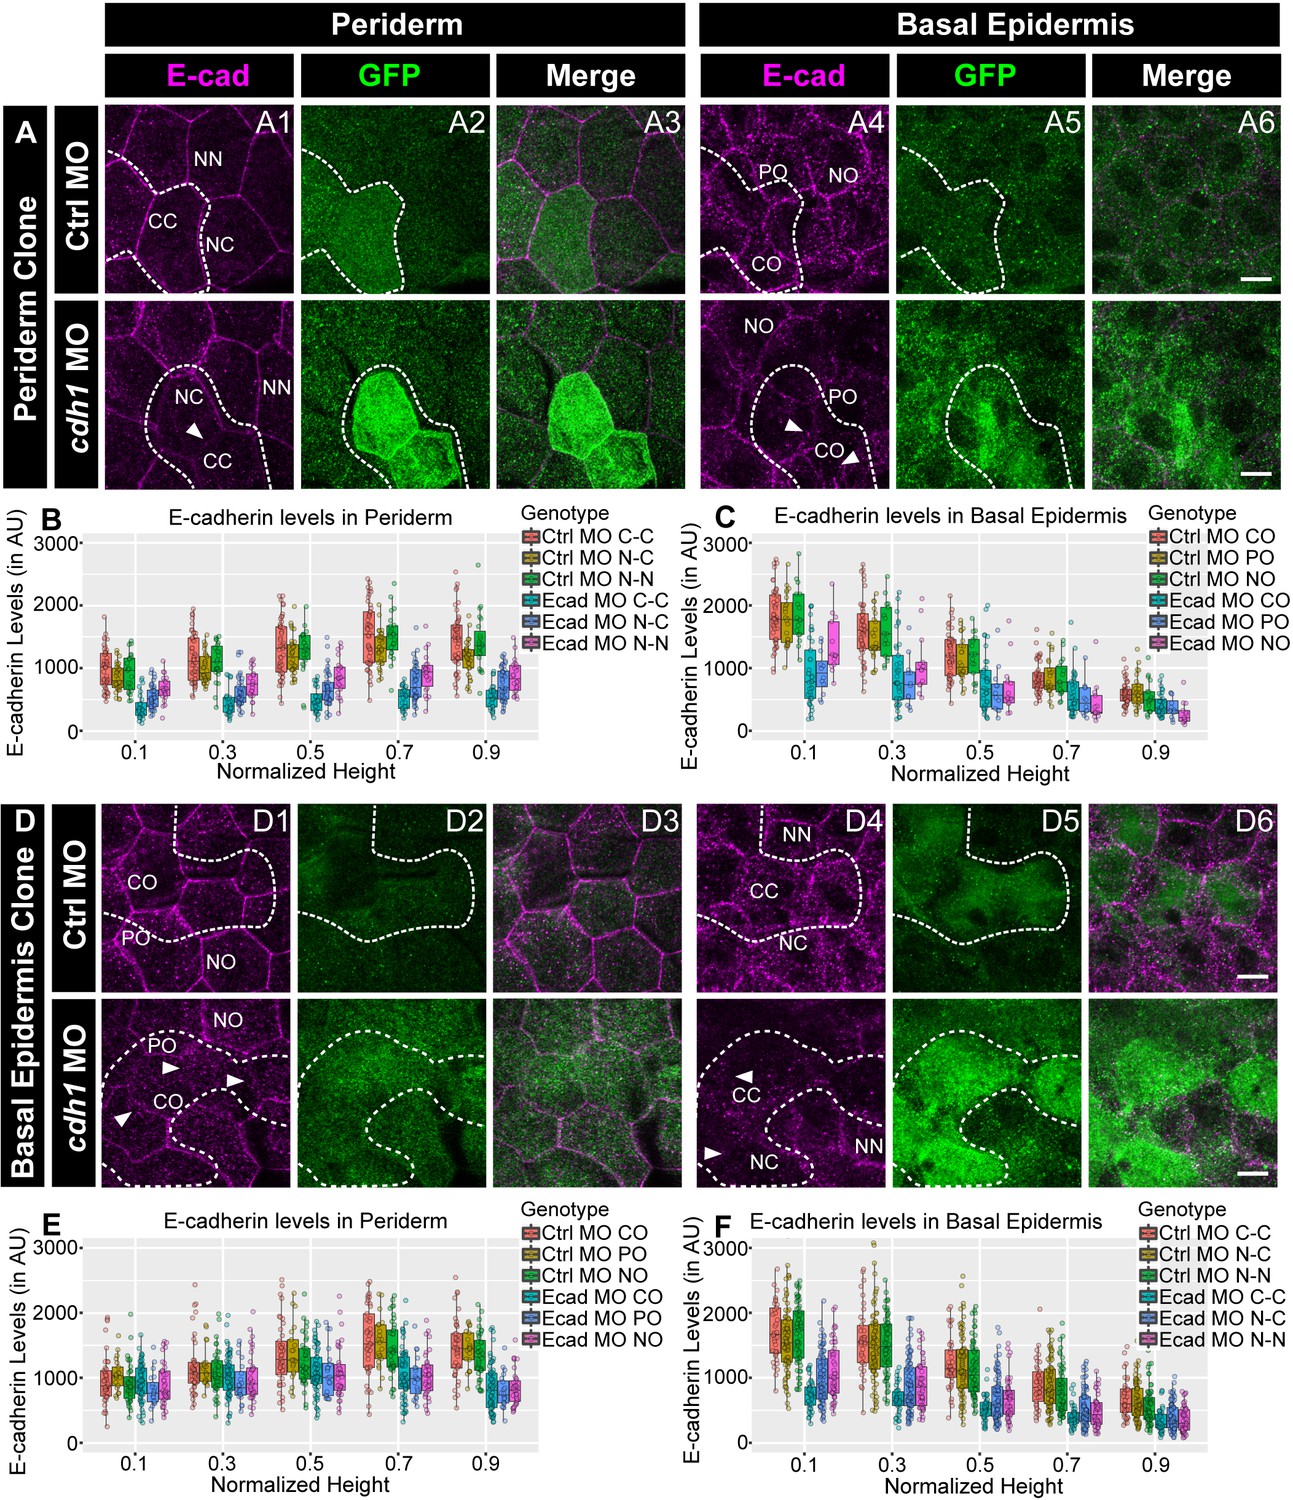
E-cadherin in one epidermal layer regulates E-cadherin localisation in the adjacent layer in a layer non-autonomous manner.
Confocal images of E-cadherin (magenta) localisation in GFP clones (green) carrying cadherin-1 morpholino (cdh-1 MO) and control morpholino (Ctrl MO) in the periderm (A) and basal epidermis (D). (A1–A3) shows peridermal clone and its effect on E-cadherin localisation in the basal epidermal cells (A4–A6). (D4–D6) show a basal epidermis clone and its effect on E-cadherin localisation in the periderm (D1–D3). Graphs showing effect on E-cadherin levels across normalised cell height in the periderm (B, E) and basal epidermis (C, F) across different boundaries upon knockdown of e-cadherin in a clonal manner. The boundaries Clone-Clone (C–C), Clone-Non-clone (N–C), and Non clone-Non clone (N–N) are within the same layer with respect to the clones whereas boundaries showing Complete Overlap (CO), Partial Overlap (PO), and No Overlap (NO) are in the cells of the juxtaposed layer. Dotted line in (A1, A2) represents the position of the peridermal clone and the basal epidermal region below the clone (A4, A5). Similarly, dotted lines in (D4, D5) mark the clones in the basal epidermis and the peridermal region above the clone (D1, D2). Arrowheads point to the loss/reduction in E-cadherin staining at the cell membranes. Scale bar represents 10 µm in (A6, D6). AU = Arbitrary Units. Source file with fluorescence intensities for peridermal clone and E-cadherin analysis at the boundaries in the periderm (B) and basal epidermis (C) is available as Figure 4—source data 1 and 2, respectively. Fluorescence intensities for basal epidermal clones and analysis at the boundaries in periderm (E) and basal epidermis (F) is available as Figure 4—source data 3 and 4, respectively. Statistical analysis consisting of intensity comparisons is available as Figure 4—source data 5.
-
Figure 4—source data 1
Fluorescence intensities of E-cadherin localisation along different boundaries of the peridermal cells when the clones are in the periderm for Figure 4B.
- https://cdn.elifesciences.org/articles/49064/elife-49064-fig4-data1-v1.csv
-
Figure 4—source data 2
Fluorescence intensities of E-cadherin localisation along different boundaries of the basal epidermal cells when clones are in the periderm for Figure 4C.
- https://cdn.elifesciences.org/articles/49064/elife-49064-fig4-data2-v1.csv
-
Figure 4—source data 3
Fluorescence intensities of E-cadherin localisation along different boundaries of the peridermal cells when clones are in the basal epidermis for Figure 4E.
- https://cdn.elifesciences.org/articles/49064/elife-49064-fig4-data3-v1.csv
-
Figure 4—source data 4
Fluorescence intensities of E-cadherin localisation along different boundaries of the basal epidermal cells when clones are in the basal epidermis for Figure 4F.
- https://cdn.elifesciences.org/articles/49064/elife-49064-fig4-data4-v1.csv
-
Figure 4—source data 5
Statistical summaries of comparisons between E-cadherin levels along cdh1 MO and Ctrl MO boundaries presented in Figure 4B, C, E, F.
- https://cdn.elifesciences.org/articles/49064/elife-49064-fig4-data5-v1.docx
Figure 4—figure supplement 1
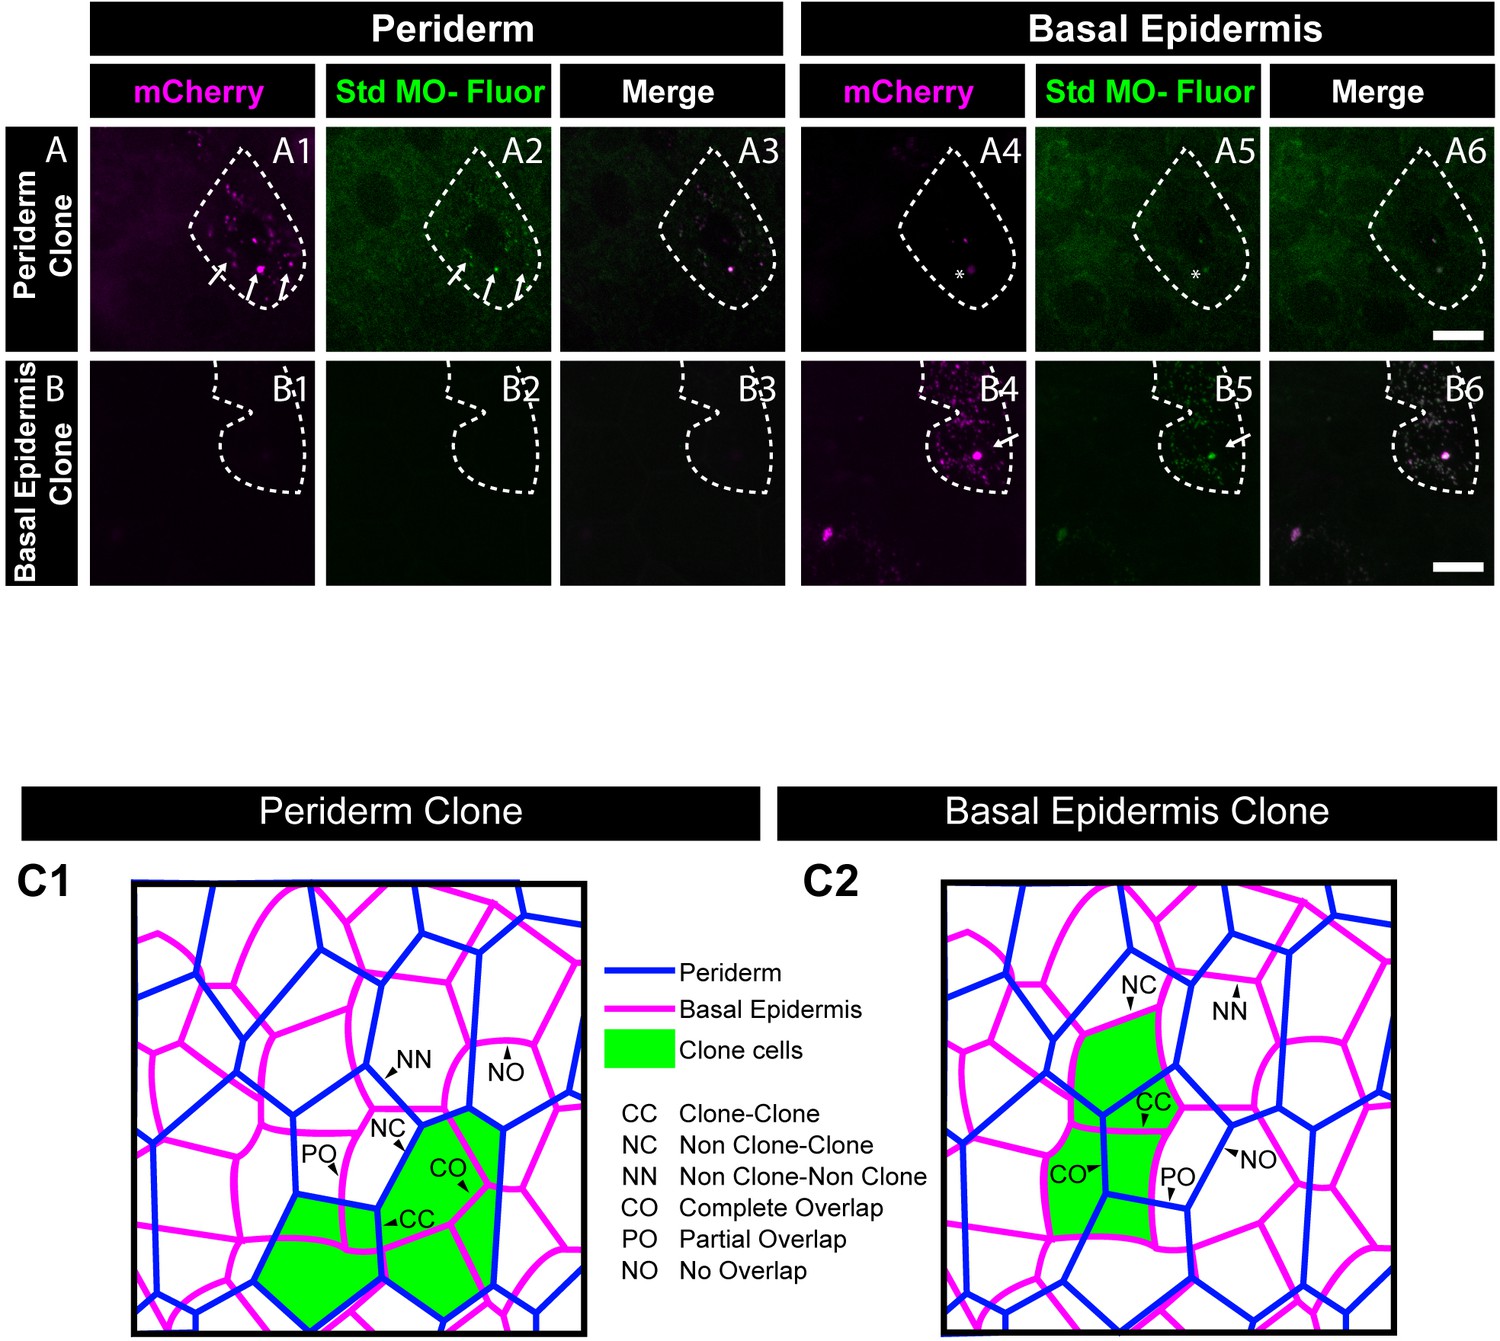
Analysis of co-segregation of 3’- Carboxyfluorescein Standard Morpholino and mCherry; schematic showing classification of boundaries used for E-cadherin quantifications.
Morpholino tagged with Carboxyfluorescein (A2, B2, A5, and B5) and mCherry (A1, B1, A4 and B4) showing co-segregation in peridermal clones (A1–A3) but no localisation in basal epidermis (A4–A6). Similarly, clones in basal epidermis showing co-localisation with mCherry (B4–B6) but no localisation in periderm (B1–B3). Arrows point to cells showing co-segregation of labelled morpholino and mCherry. Dotted line in (A1, A2, A3) represents the position of the peridermal clone and the basal epidermal region below the clone (A4, A5, A6). Similarly, dotted lines in (B4, B5, and B6) mark the clones in the basal epidermis and the peridermal region above the clone (B1, B2, and B3). Asterisk marks fluorescence bleed through. Scale bar represents 10 µm (A6, B6). Std MO- Fluor = 3’- Carboxyfluorescein Standard Morpholino. Schematic (C1, C2) showing different types of boundaries defined for quantifications. The two epidermal layers, periderm (blue) and basal epidermis (magenta), overlaid on top of each other having either peridermal clone (green in C1) or basal epidermal clone (green in C2). Arrowheads demonstrate different types of boundaries namely, clone-clone (CC), Non-clone-Clone (NC), and Non clone-Non clone (NN) for analysing layer autonomous effect and complete overlap (CO), partial overlap (PO), and no overlap (NO) (C1, C2) for analysis of layer non autonomous effect.
Figure 4—figure supplement 2
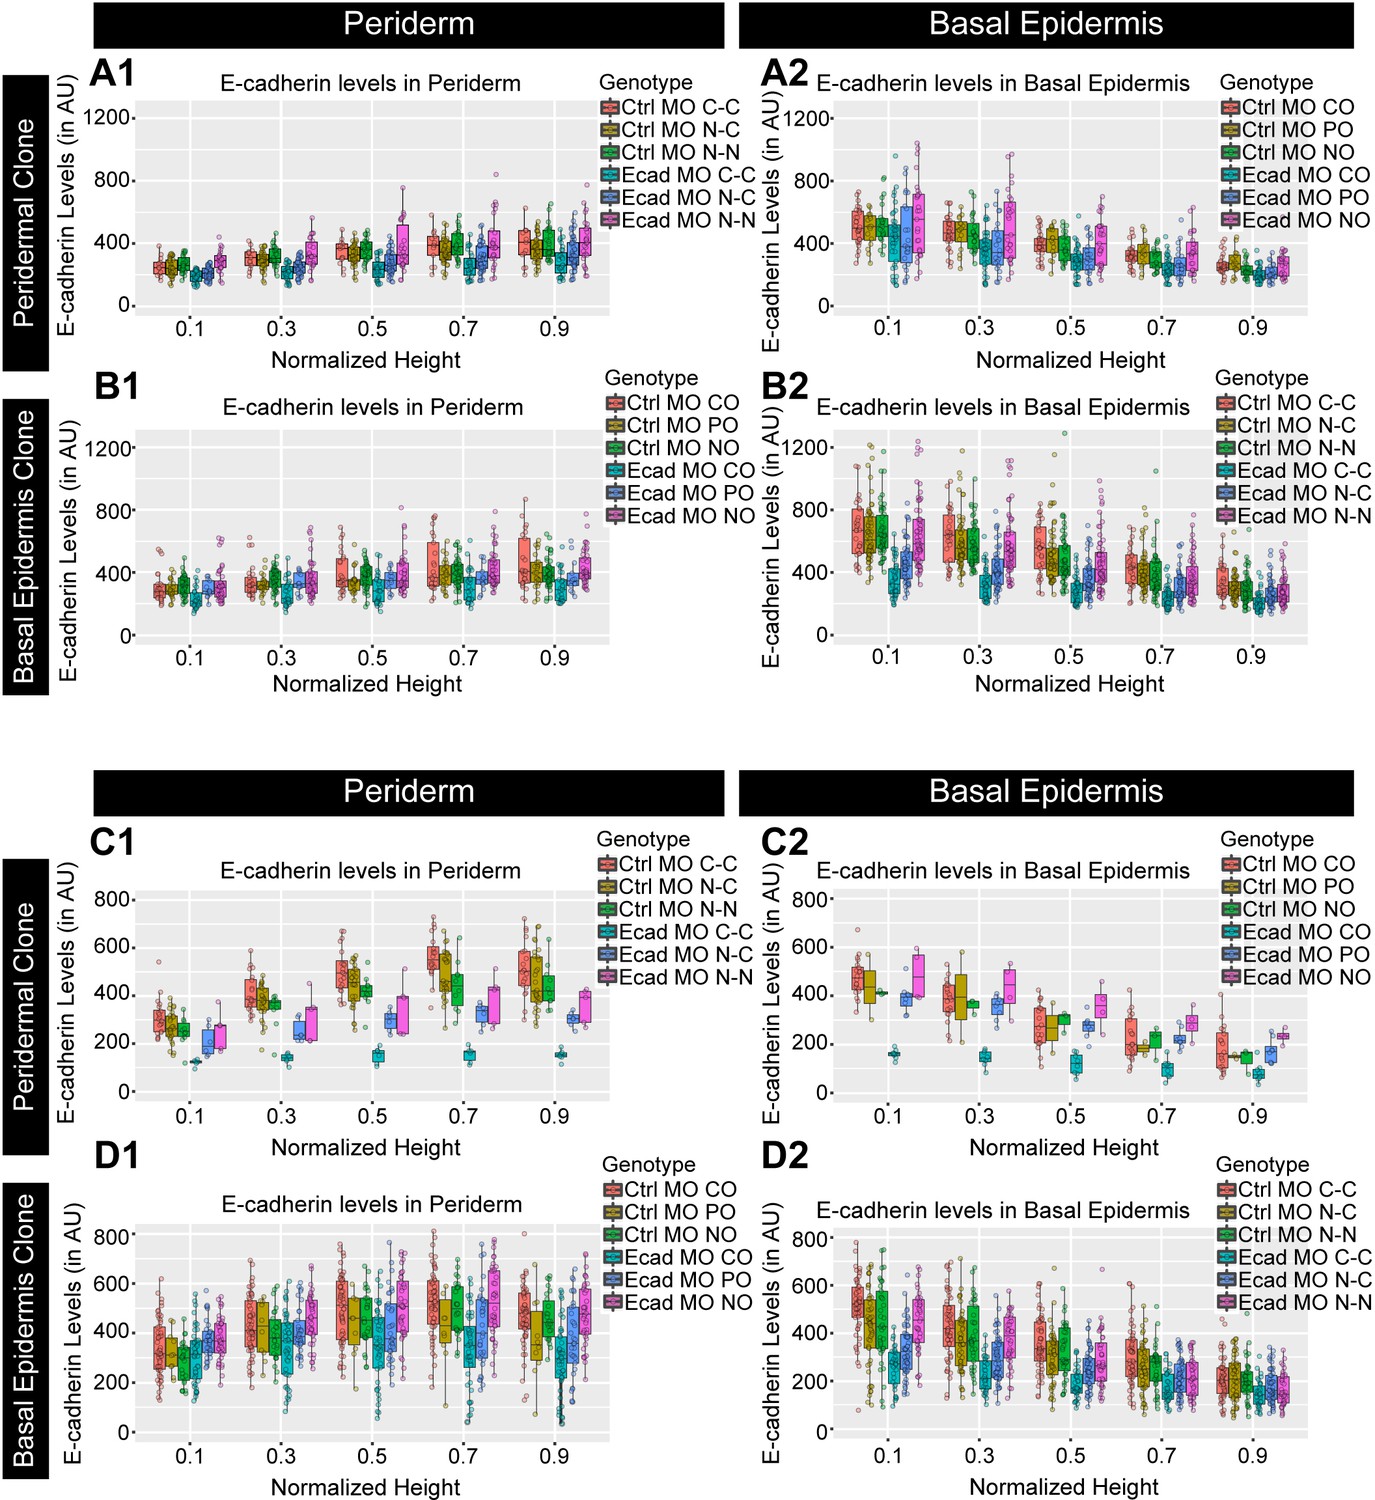
Quantification of E-cadherin levels in two additional experimental sets to assess the cell autonomous and non-autonomous effect of e-cadherin knockdown.
Graphs showing polarised localisation of E-cadherin along normalised cell height in the periderm (A1, B1, C1, D1) and basal epidermis (A2, B2, C2, D2) across various boundaries mentioned upon knockdown of e-cadherin, for two independent experiments (A1–B2 and C1–D2). AU = Arbitrary Units. Source file for fluorescence intensities for the second set of peridermal clones and boundaries analysed in the periderm (A1) and basal epidermis (A2) is available as Figure 4—figure supplement 2—source data 1 and 2, respectively. Fluorescence intensities for basal epidermal clones in the second set and analysis of boundaries in the periderm (B1) and basal epidermis (B2) are available in Figure 4—figure supplement 2—source data 3 and 4, respectively. Source file with fluorescence intensities for peridermal clones in the third set and analysis of boundaries in the periderm (C1) and basal epidermis (C2) is available as Figure 4—figure supplement 2—source data 5 and 6, respectively. Fluorescence intensities for the third set of basal epidermal clones and boundaries analysed in the periderm (D1) and basal epidermis (D2) is available as Figure 4—figure supplement 2—source data 7 and 8, respectively. Statistical analysis with p values for all the graphs is available as Figure 4—figure supplement 2—source data 9.
-
Figure 4—figure supplement 2—source data 1
Fluorescence intensities of E-cadherin localisation along different boundaries of the peridermal cells when clones are in the periderm for Figure 4—figure supplement 2 A1 (second set).
- https://cdn.elifesciences.org/articles/49064/elife-49064-fig4-figsupp2-data1-v1.csv
-
Figure 4—figure supplement 2—source data 2
Fluorescence intensities of E-cadherin localisation along different boundaries in the basal epidermis when clones are in the periderm for Figure 4—figure supplement 2 A2 (second set).
- https://cdn.elifesciences.org/articles/49064/elife-49064-fig4-figsupp2-data2-v1.csv
-
Figure 4—figure supplement 2—source data 3
Fluorescence intensities of E-cadherin localisation along different boundaries in the periderm when clones are in the basal epidermis for Figure 4—figure supplement 2 B1 (second set).
- https://cdn.elifesciences.org/articles/49064/elife-49064-fig4-figsupp2-data3-v1.csv
-
Figure 4—figure supplement 2—source data 4
Fluorescence intensities of E-cadherin localisation along different boundaries in the basal epidermis when clones are in basal epidermis for Figure 4—figure supplement 2 B2 (second set).
- https://cdn.elifesciences.org/articles/49064/elife-49064-fig4-figsupp2-data4-v1.csv
-
Figure 4—figure supplement 2—source data 5
Fluorescence intensities of E-cadherin localisation along various boundaries in the periderm when clones are in the periderm for Figure 4—figure supplement 2 C1 (third set).
- https://cdn.elifesciences.org/articles/49064/elife-49064-fig4-figsupp2-data5-v1.csv
-
Figure 4—figure supplement 2—source data 6
Fluorescence intensities of E-cadherin localisation along different boundaries in the basal epidermis when clones are in the periderm for Figure 4—figure supplement 2 C2 (third set).
- https://cdn.elifesciences.org/articles/49064/elife-49064-fig4-figsupp2-data6-v1.csv
-
Figure 4—figure supplement 2—source data 7
Fluorescence intensities of E-cadherin across different boundaries in the periderm when clones are in the basal epidermis for Figure 4—figure supplement 2 D1 (third set).
- https://cdn.elifesciences.org/articles/49064/elife-49064-fig4-figsupp2-data7-v1.csv
-
Figure 4—figure supplement 2—source data 8
Fluorescence intensities of E-cadherin across different boundaries in the basal epidermis when the clones are in the basal epidermis for Figure 4—figure supplement 2 D2 (third set).
- https://cdn.elifesciences.org/articles/49064/elife-49064-fig4-figsupp2-data8-v1.csv
-
Figure 4—figure supplement 2—source data 9
Statistical summaries of comparisons between E-cadherin levels along cdh1 MO and Ctrl MO boundaries presented in Figure 4—figure supplement 2 A1, A2, B1, B2, C1, C2, D1, D2.
- https://cdn.elifesciences.org/articles/49064/elife-49064-fig4-figsupp2-data9-v1.docx
Figure 4—figure supplement 3
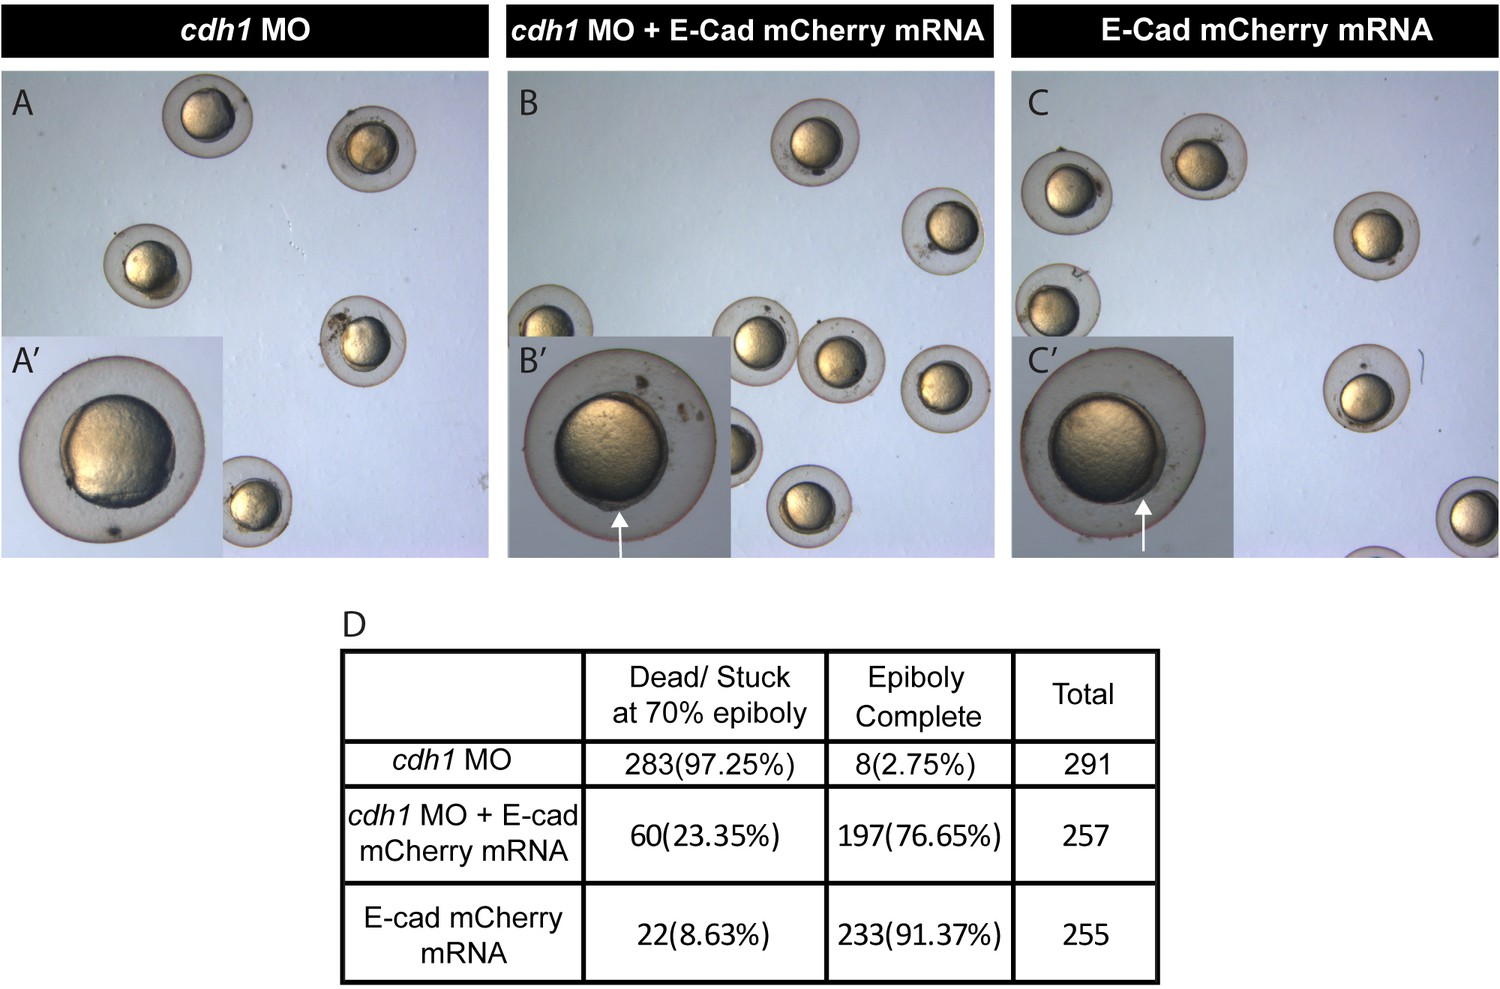
Rescue of e-cadherin (cdh-1) morphant phenotype by e-cadherin mRNA.
Brightfield image of zebrafish embryos injected with Cdh-1 MO (A), Cdh-1 MO with mCherry tagged e-cad mRNA (B) and just e-cad-mCherry mRNA (C). Insets show a high zoom image of one of the embryos showing its stage; cdh-1 MO embryos are stuck at epiboly (A’), but the cdh-1MO + e-cad mRNA (B’) and e-cad mRNA (C’) embryos cross the epiboly stages. The numbers of embryos from various genotypes at the 70% epiboly stages are quantified in the table (D). Arrow shows the initiation of tail bud formation in (B’, C’).
Figure 5 with 4 supplements
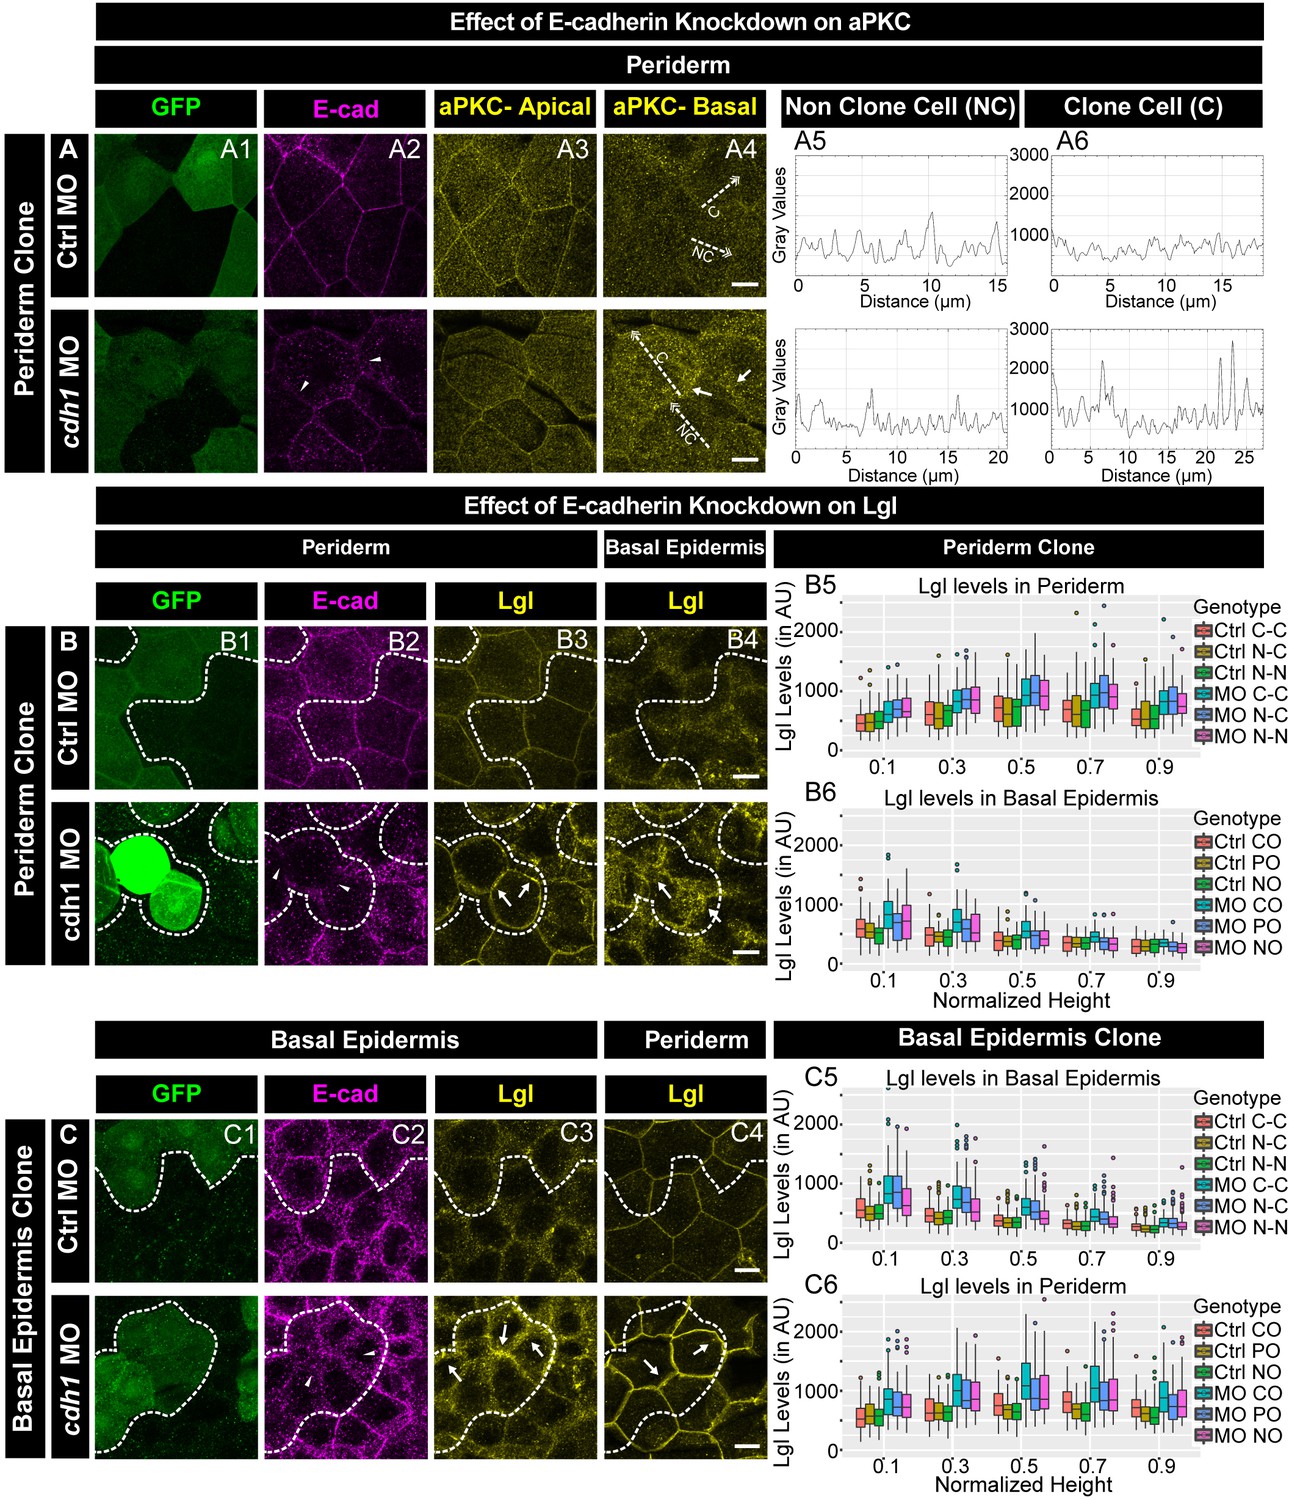
E-cadherin regulates localisation of aPKC and Lgl2 in the epidermis.
Confocal images showing GFP marked clones (A1, B1, C1) marking cadherin-1 morpholino (cdh-1 MO) or control MO (Ctrl MO) and immunolocalisation of E-cadherin (A2, B2, C2), aPKC (A3, A4) and Lgl2 (B3, B4, C3, C4). Arrowhead marks the loss of E-cadherin in morphant cells (A2, B2, C2). Different z-stacks depicting apical (A3) or basal domains (A4) of peridermal cells showing aPKC immunostaining. Arrow shows enrichment of aPKC in the basal domain of the cdh-1 morphant cells (A4). Intensity profiles for aPKC in the basal domain in non-clone (NC) cells (A5) and clone (C) cells (A6) were measured along the dotted arrows (in A4). Lgl staining in the periderm (B3, C4) or basal epidermis (B4, C3). Arrows show the high levels of Lgl in the morphant or juxtaposed cells (B3, B4, C3, and C4) upon e-cadherin knockdown. Graphs showing levels of Lgl across normalised cell height in the periderm (B5, C6) and basal epidermis (B6, C5) across different boundaries mentioned. Dotted line indicates the position of the clone in the periderm (B1–B3) or basal epidermis (C1–C3) and corresponding region in basal epidermis (B4) or periderm (C4), respectively. Scale bar represents 10 µm in (A4, B4, C4). AU = Arbitrary Units. Source file with fluorescence intensities for peridermal clone and boundary analysis in periderm (B5) and basal epidermis (B6) is available as Figure 5—source data 1 and 2, respectively. Fluorescence intensities for basal epidermis clone and analysis of boundaries in basal epidermis (C5) and periderm (C6) is available as Figure 5—source data 3 and 4, respectively. Statistical analysis of intensity comparisons along with p values is available as Figure 5—source data 5.
-
Figure 5—source data 1
Fluorescence intensities of Lgl along different boundaries in the periderm when clones are in the periderm for Figure 5 B5.
- https://cdn.elifesciences.org/articles/49064/elife-49064-fig5-data1-v1.csv
-
Figure 5—source data 2
Fluorescence intensities of Lgl along different boundaries in the basal epidermis when clones are in the periderm for Figure 5 B6.
- https://cdn.elifesciences.org/articles/49064/elife-49064-fig5-data2-v1.csv
-
Figure 5—source data 3
Fluorescence intensities of Lgl along different boundaries in the basal epidermis when the clones are in the basal epidermis for Figure 5 C5.
- https://cdn.elifesciences.org/articles/49064/elife-49064-fig5-data3-v1.csv
-
Figure 5—source data 4
Fluorescence intensities of Lgl along different boundaries in periderm when the clones are in basal epidermis for Figure 5 C6.
- https://cdn.elifesciences.org/articles/49064/elife-49064-fig5-data4-v1.csv
-
Figure 5—source data 5
Statistical summaries of comparisons of Lgl levels between cdh1 MO and Ctrl MO boundaries presented in Figure 5 B5, B6, C5, C6.
- https://cdn.elifesciences.org/articles/49064/elife-49064-fig5-data5-v1.docx
Figure 5—figure supplement 1
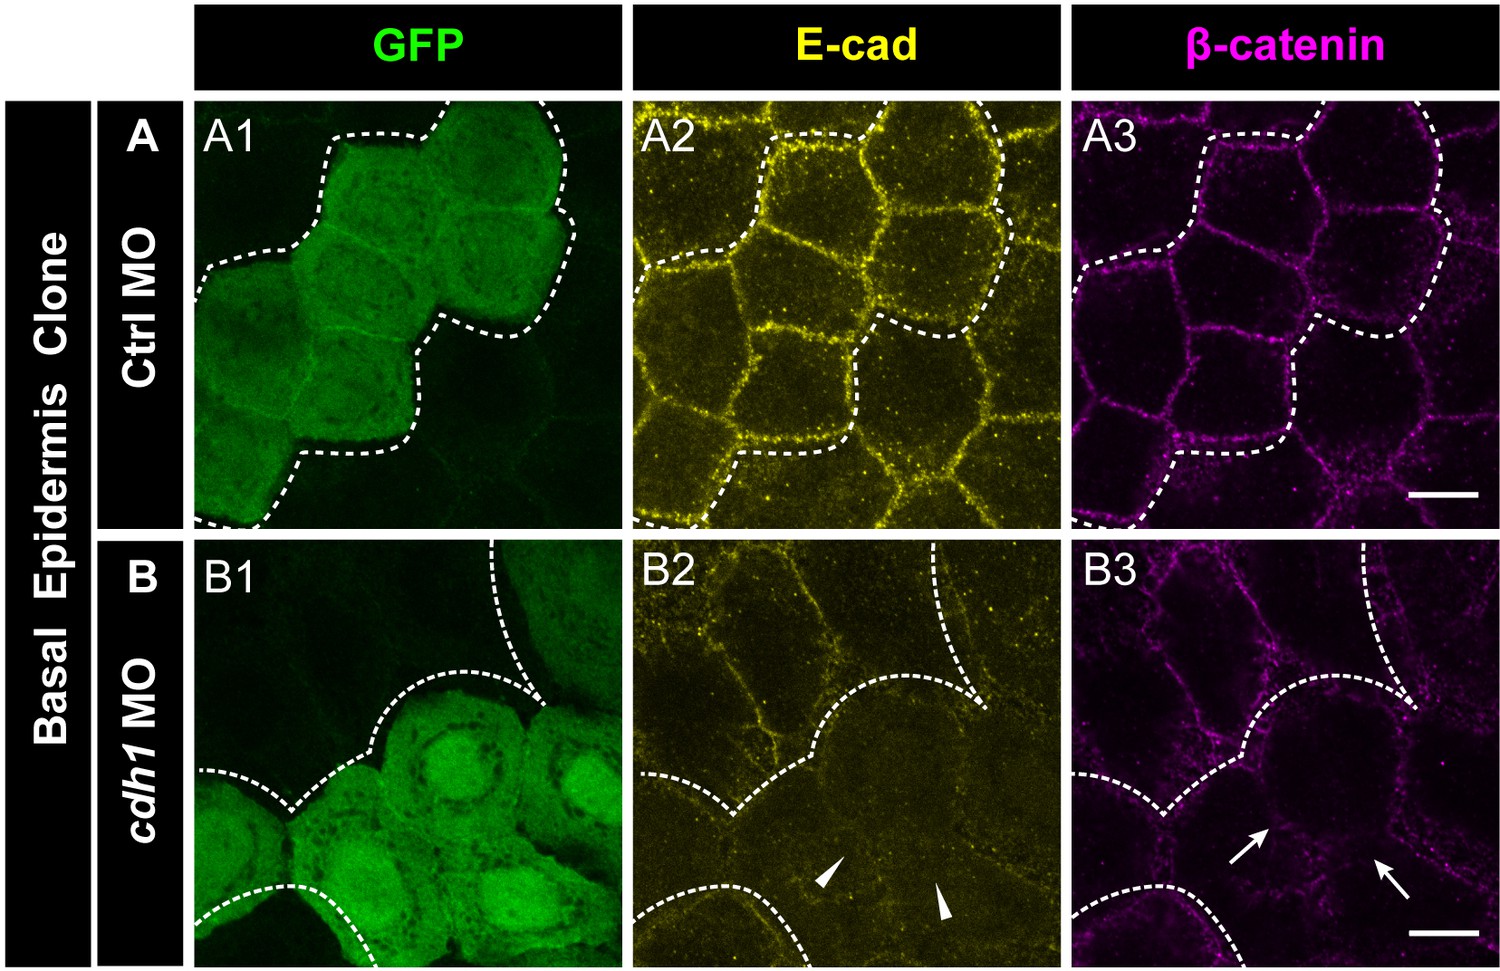
e-cadherin knockdown results in the loss of β-catenin localisation.
Immunostainings of embryos harbouring Ctrl MO (A) or cdh-1 MO (B) clones marked by GFP (A1, B1) showing E-cadherin (A2, B2) and β-catenin (A3, B3) localisation. Arrow heads (B2) and arrows (B3) mark the loss of E-cadherin and concurrent reduction in β-catenin localisation in morphant cells. Dotted lines demarcate the clones. Scale bar represents 10 µm (A3, B3).
Figure 5—figure supplement 2
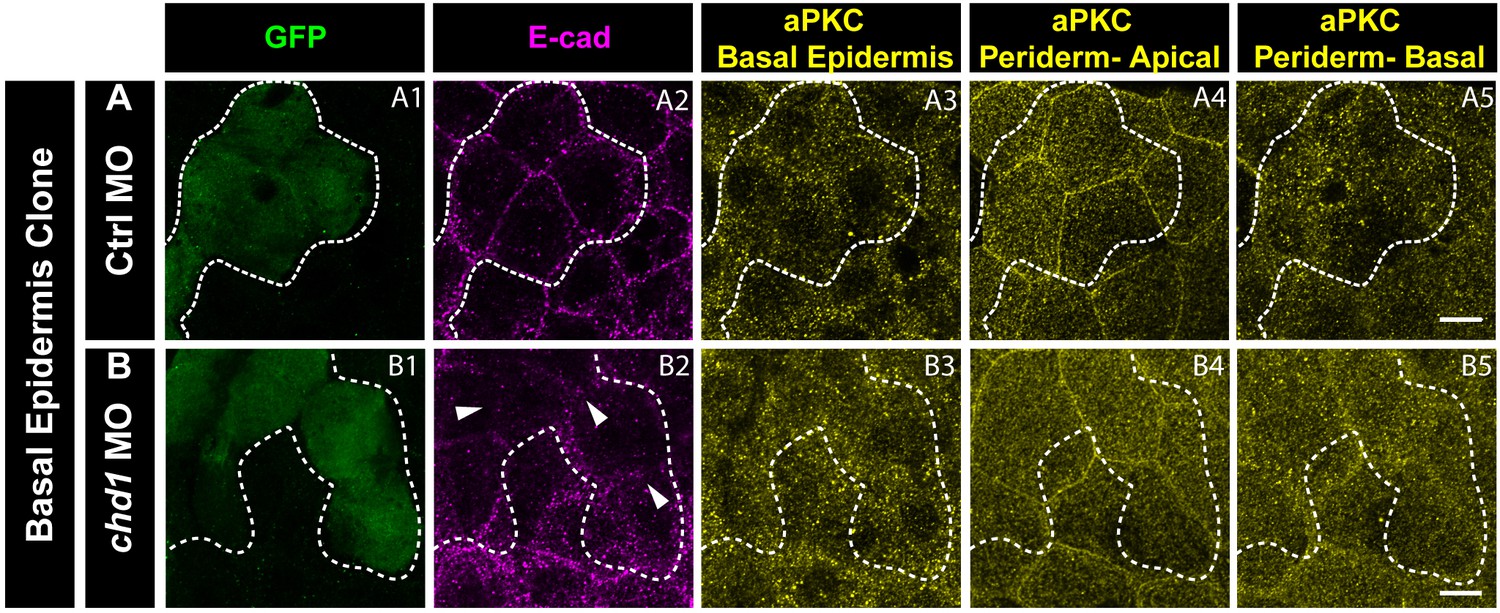
e-cadherin knockdown in the basal epidermis does not have any effect on aPKC localisation in the periderm or basal epidermis.
Immunostaining of embryos having Ctrl MO (A) and cdh1 MO (B) clones marked by GFP (A1, B1) and showing e-cadherin knockdown (A2, B2), aPKC localisation in the basal epidermis (A3, B3) and the apical domain (A4, B4) as well as basal domain of the peridermal cells (A5, B5) lying above the basal epidermal clone. Note that there is no effect on aPKC localisation in the periderm when e-cadherin is knocked down in the basal epidermis. Dotted lines mark the basal epidermal clone and the peridermal region above the clone. Arrowheads (in B2) mark the loss of E-cadherin in the morphant clone. Scale bar equals to 10 µm (A5, B5).
Figure 5—figure supplement 3
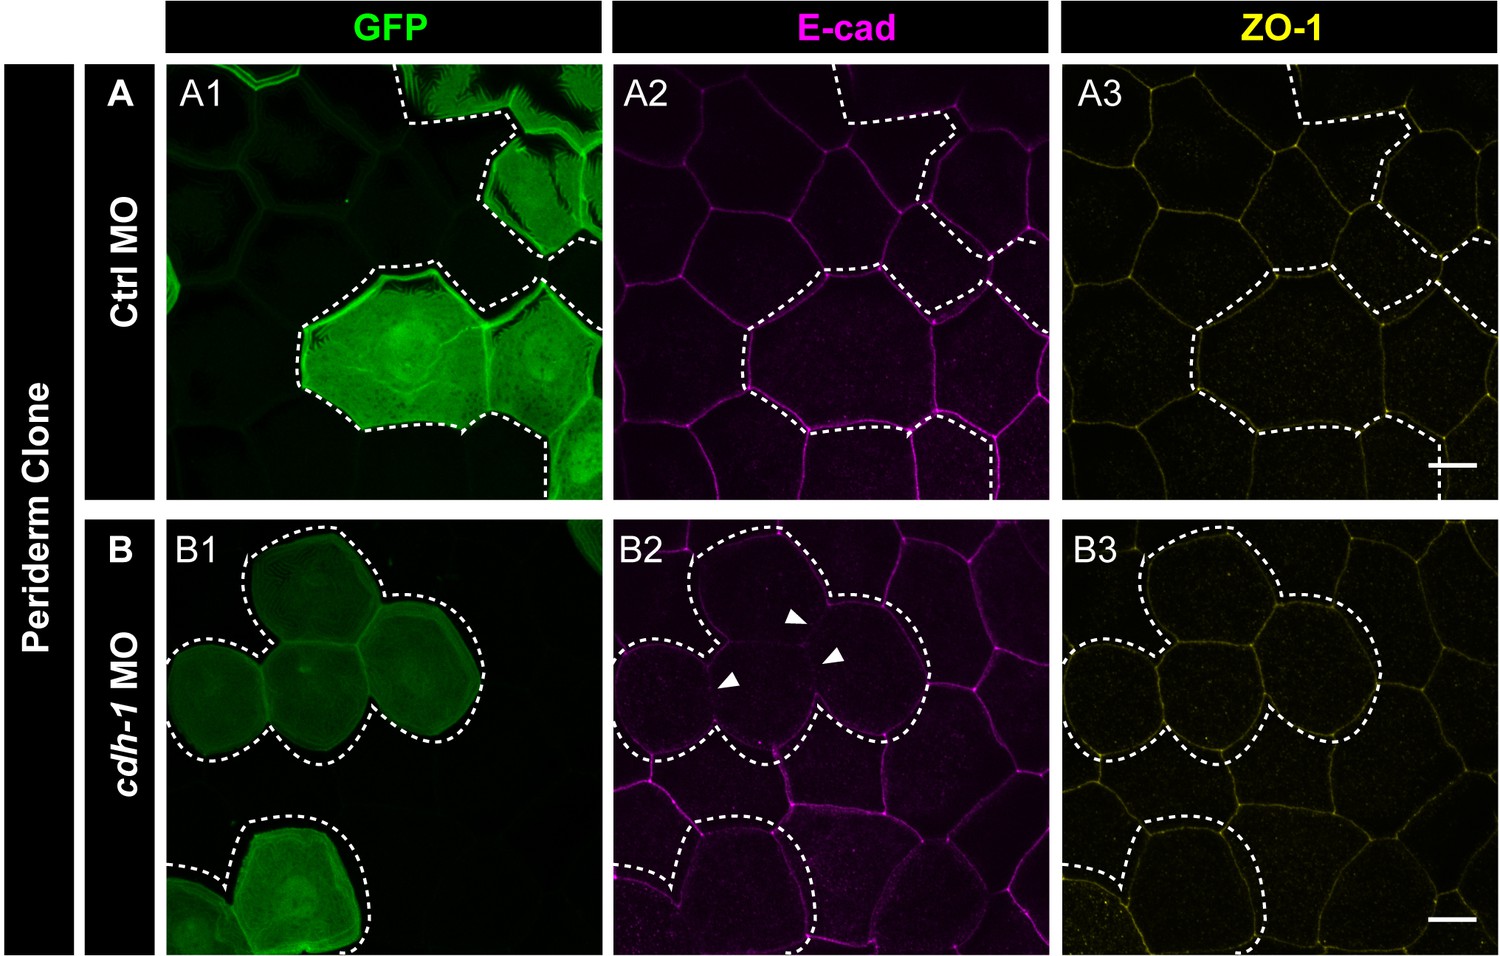
e-cadherin knockdown has no effect on localisation of ZO-1.
Confocal micrographs of embryos with Ctrl MO (A) and cdh1 MO (B) clones labelled with GFP (A1, B1) and showing localisation of E-cadherin (A2, B2) and ZO-1 (A3, B3). Note that there is no effect of loss of e-cadherin function on ZO-1 localisation. Dotted lines represent the position of the peridermal clones. Arrowheads mark the reduction in E-cadherin localisation in morphant cells (B2). Scale bar is equivalent to 10 µm (A3, B3).
Figure 5—figure supplement 4
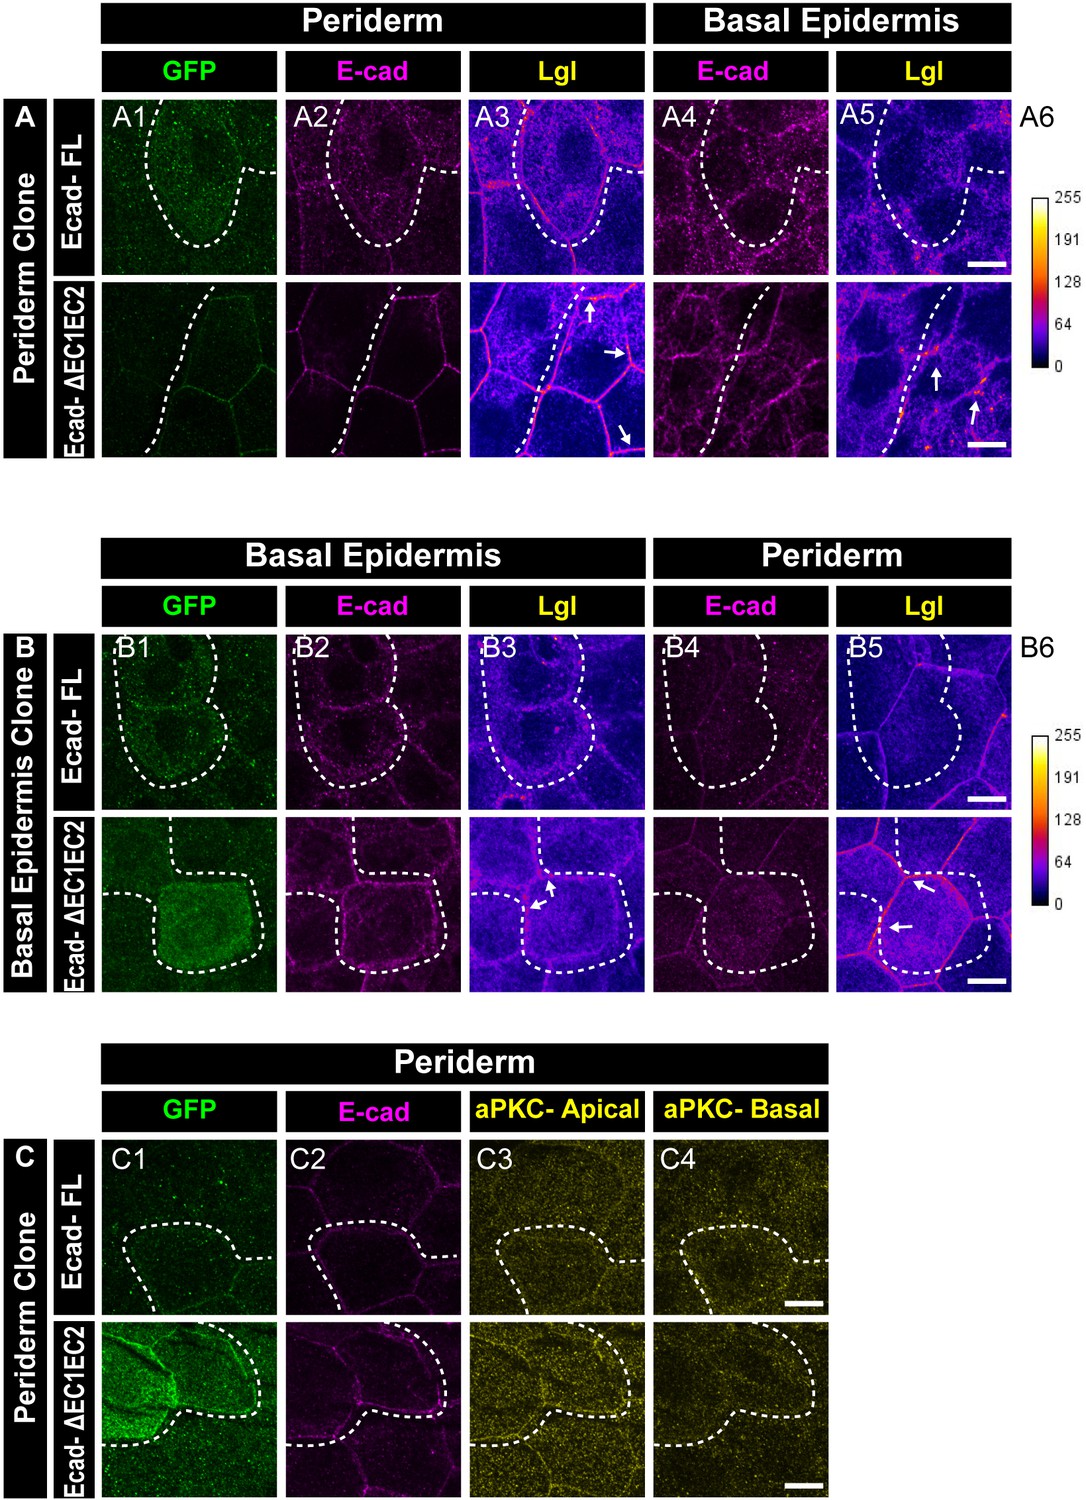
EC1-EC2 domain of E-cadherin is required to maintain Lgl2 levels in the epidermis.
Confocal images showing expression and localisation of GFP tagged E-cadherin-FL and ΔEC1-EC2-Ecad (green) (A1, B1, C1) and localisation of E-cadherin (magenta) (A2, A4, B2, B4, C2), Lgl2 (A3, A5, B3, B5) and aPKC (C3, C4). Lgl staining in the periderm (A3, B5) or basal epidermis (B3, A5) is shown as heatmap with calibration bar provided for reference (A6, B6). Arrow shows high levels of Lgl in the ΔEC1-EC2-Ecad expressing cells or juxtaposed cells (A3, A5, B3, and B5). Dotted lines indicate the position of the clone in the periderm (A1–A3 and C1-C4) or basal epidermis (B1–B3) and corresponding region in basal epidermis (A4–A5) or periderm (B4–B5), respectively. Scale bar represents 10 µm in (A5, B5, C4).
Figure 6

Model proposing stepwise polarisation of the zebrafish embryonic epidermis.
The periderm, polarised at EVL stages, has apically localised aPKC. aPKC controls the polarisation of E-cadherin (E-cad). E-cadherin in one layer controls the localisation of E-cadherin in the other layer and negatively controls the Lgl2 levels at the cortex. Lgl2 further regulates formation of hemidesmosomes- junctions mediating cell-matrix adhesion in the basal epidermis. The polarity is setup in a stepwise manner wherein E-cadherin acts a transducer of polarity between the two layers. The number of cells/boundaries quantified for each figure is compiled as an excel sheet and is available as Figure 6—source data 1.
-
Figure 6—source data 1
Details of the numbers of cells, boundaries or clones analysed for each experiment.
- https://cdn.elifesciences.org/articles/49064/elife-49064-fig6-data1-v1.xlsx
Additional files
-
Supplementary file 1
R scripts consisting of codes used to analyse data for localisation of E-cadherin and Lgl, and for cell morphological parameters from various genetic conditions.
- https://cdn.elifesciences.org/articles/49064/elife-49064-supp1-v1.pdf
-
Transparent reporting form
- https://cdn.elifesciences.org/articles/49064/elife-49064-transrepform-v1.docx
Download links
A two-part list of links to download the article, or parts of the article, in various formats.
Downloads (link to download the article as PDF)
Open citations (links to open the citations from this article in various online reference manager services)
Cite this article (links to download the citations from this article in formats compatible with various reference manager tools)
Stepwise polarisation of developing bilayered epidermis is mediated by aPKC and E-cadherin in zebrafish
eLife 9:e49064.
https://doi.org/10.7554/eLife.49064


