Tonotopic and non-auditory organization of the mouse dorsal inferior colliculus revealed by two-photon imaging
- Erasmus MC, University Medical Center Rotterdam, Netherlands
Figures
Figure 1 with 1 supplement
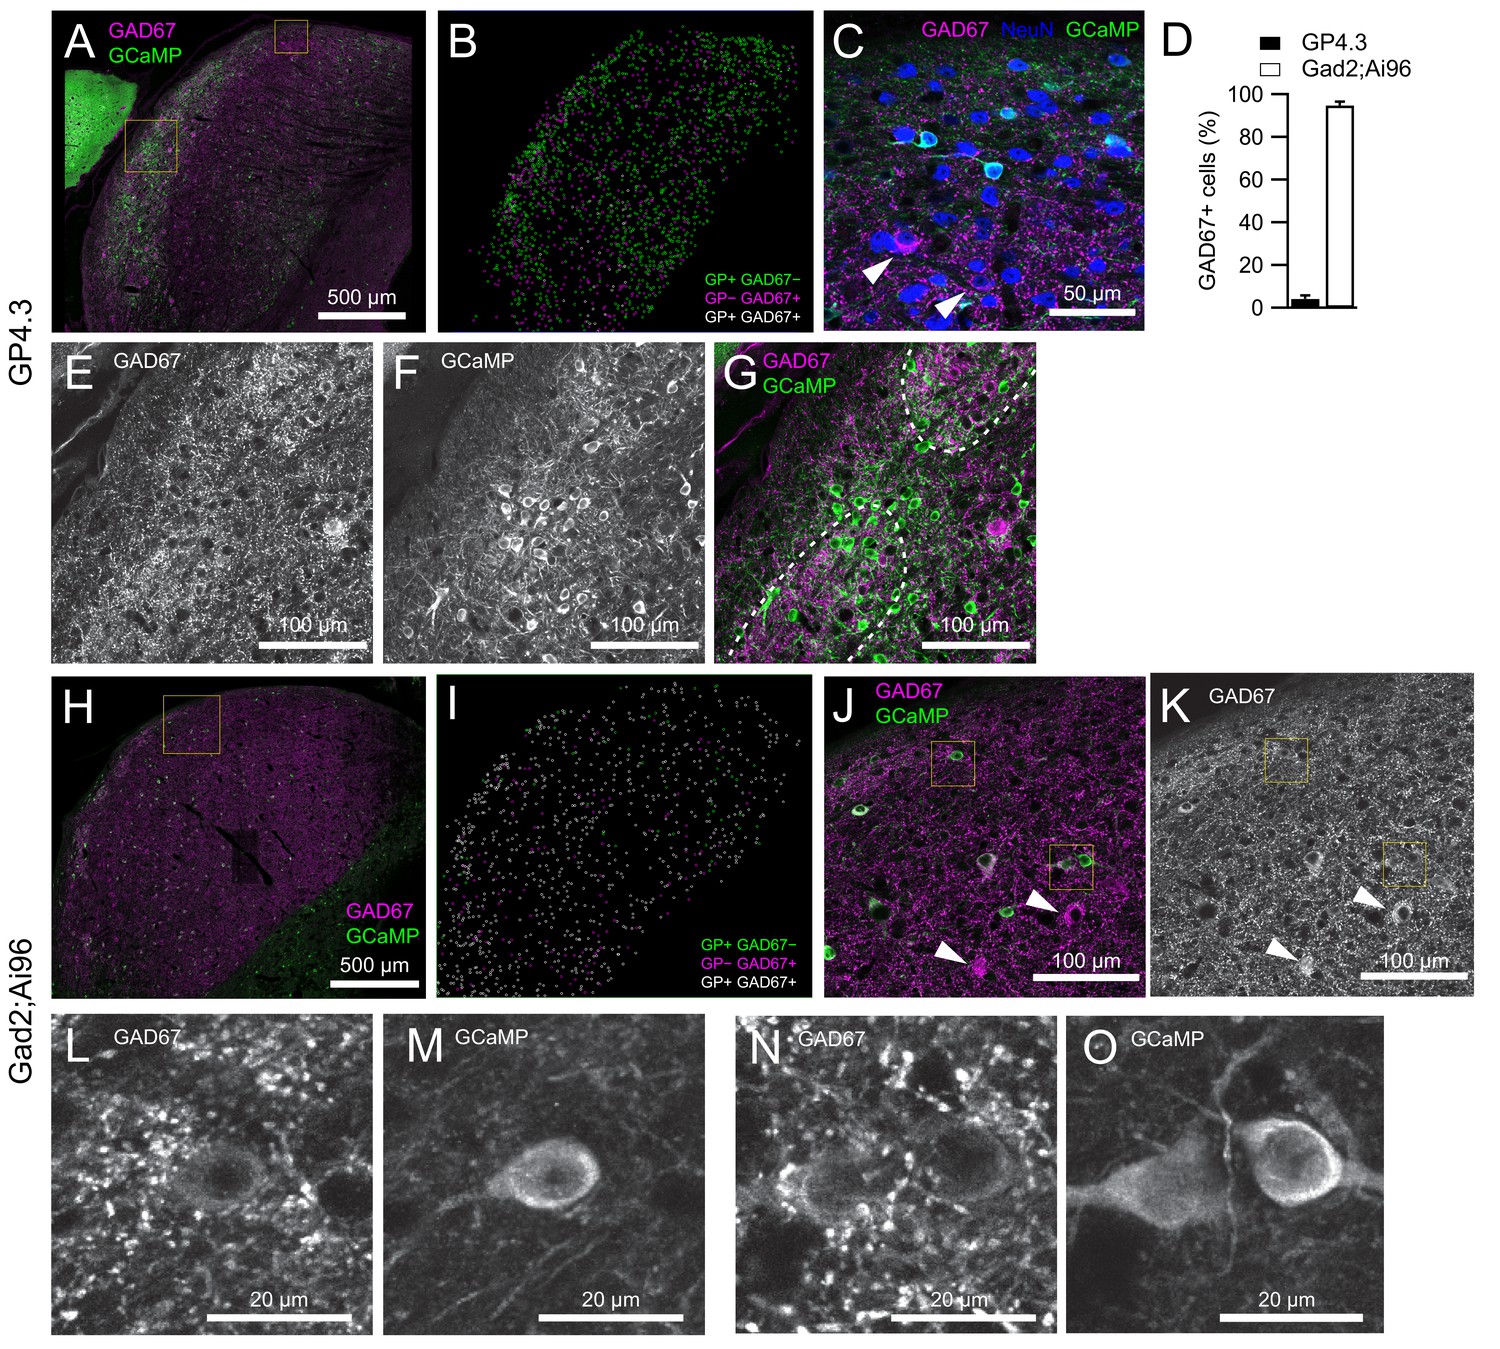
Co-expression between GCaMP6s and GAD67 in the two transgenic mouse lines.
(A) Single optical section of an IC brain slice from a GP4.3 mouse immunolabeled for GAD67 (magenta) and GCaMP6s (green). (B) Distribution of GCaMP+ and GAD67+ cells within the 40 µm brain slice in A, color-coded by their immunoreactivity to GFP and GAD67 antibodies. GP+/−: GCaMP-positive/negative. (C) Enlarged image from A (small square), showing different combinations of immunoreactivity: GCaMP (green), GAD67 (magenta) and NeuN (blue). Arrowheads point at two GP−GAD67+ cells. Due to optical sectioning only a subset of cells marked in B are visible. (D) Percentage of GCaMP+ cells showing immunoreactivity for GAD67 antibodies (error bars: s.e.m.; GP4.3: n = 3 slices from three animals; Gad2;Ai96: n = 4 slices from three animals) (E–G) Enlarged image from large square in A showing two GAD67-dense modules marked by dashed lines. GP+ cells in GP4.3 were concentrated at the border of these modules. (H–I) Same as A and B, but from a Gad2;Ai96 mouse. (J–K) Enlarged region from H (square). Arrowheads point at two GP−GAD67+ cells. (L–O) Examples of GP+GAD67+ cells from G showing images from GAD67 and GCaMP channels separately.
-
Figure 1—source data 1
CellCounter source data XML files generated by Cell counter plug-in in FIJI containing the actual counted datapoints of each cell type, with text files explaning the different cell types being counted.
- https://doi.org/10.7554/eLife.49091.004
Figure 1—figure supplement 1
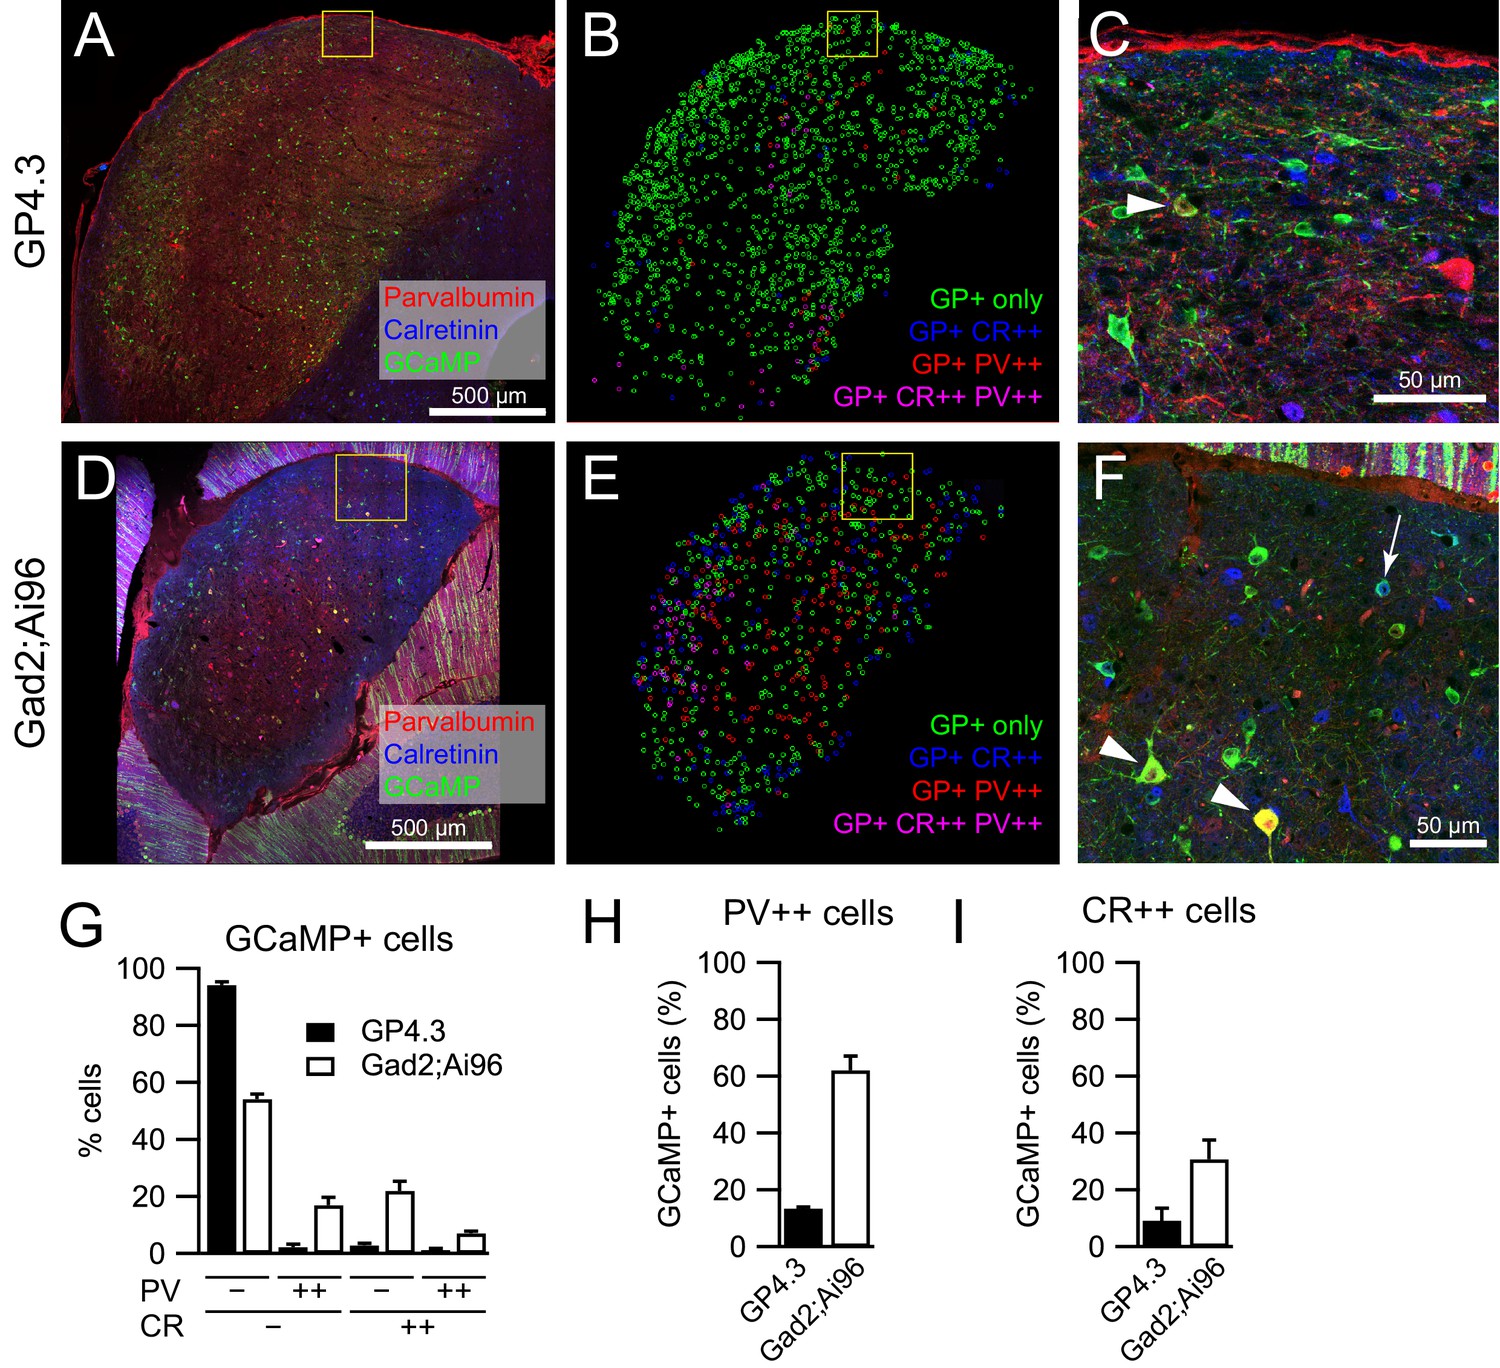
Expression of parvalbumin and calretinin in GCaMP+ neurons in the two transgenic mouse lines.
(A) Single optical section of an IC brain slice from a GP4.3 mouse immunolabeled for GCaMP6s (green), parvalbumin (PV; red) and calretinin (CR; blue). (B) Distribution of GCaMP+ cells within the 40 µm brain slice in A, color-coded by their immunoreactivity to PV and CR antibodies. (C) Enlarged image from A (square), showing different combinations of immunoreactivity. Arrowhead: GCaMP+CR-PV++ cell. Due to optical sectioning not all cells marked in B are visible. (D,E) As A and B, but from a Gad2;Ai96 mouse. (F) Enlarged region from D (square). Arrowheads: GCaMP+CR-PV++ cells; Arrow: GCaMP+CR++PV- cell. (G) Percentage of GCaMP+ cells showing immunoreactivity for PV and/or CR antibodies. (H) Percentage of PV++ cells that are GCaMP-positive. (I) Percentage of CR++ cells that are GCaMP-positive. Error bars: s.e.m.; GP4.3: n = 2 slices from two animals; Gad2;Ai96: n = 3 slices from two animals.
Figure 2 with 1 supplement
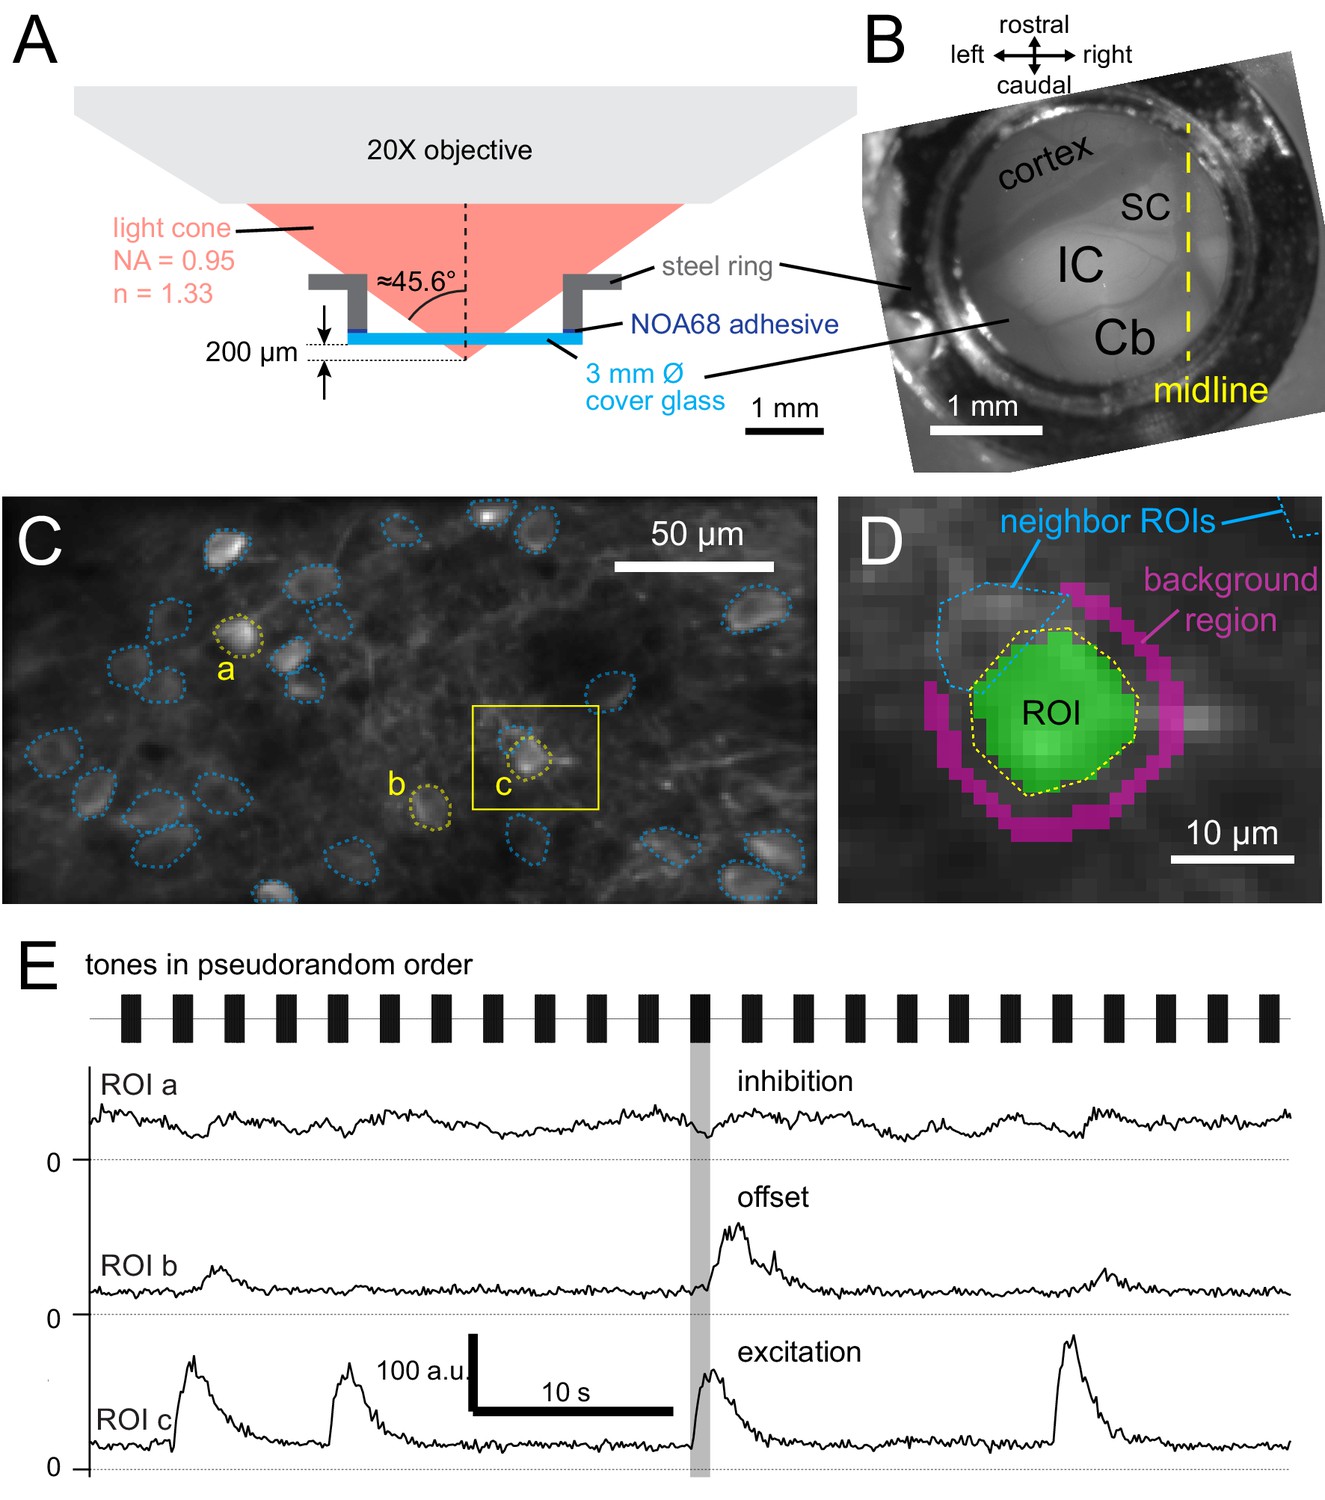
Calcium imaging of dorsal inferior colliculus in awake mice.
(A) Illustration of the cranial window construct imaged with a numerical aperture (NA) 0.95 water-immersion objective. (B) Top-down view of cranial window, showing optically exposed inferior colliculus (IC), superior colliculus (SC), cerebral cortex (cortex) and cerebellum (Cb). (C) Averaged GCaMP6s fluorescence in a 256 × 128 μm area, showing regions-of-interest (ROIs; dotted lines) defined around neuronal somata. (D) Enlarged view from C, showing pixels included in an ROI (green overlay) and a surrounding 2 μm wide background region (magenta overlay). Pixels belonging to other ROIs were excluded from the background region. (E) Background-subtracted fluorescence over time of the ROIs labeled a,b,c in C. Tones of 1 s duration with different frequencies and intensities were played, evoking different responses in IC neurons. The same sound (shaded area) evoked an inhibitory response in ROI a, an offset response in ROI b and a sustained excitatory response in ROI c.
Figure 2—figure supplement 1
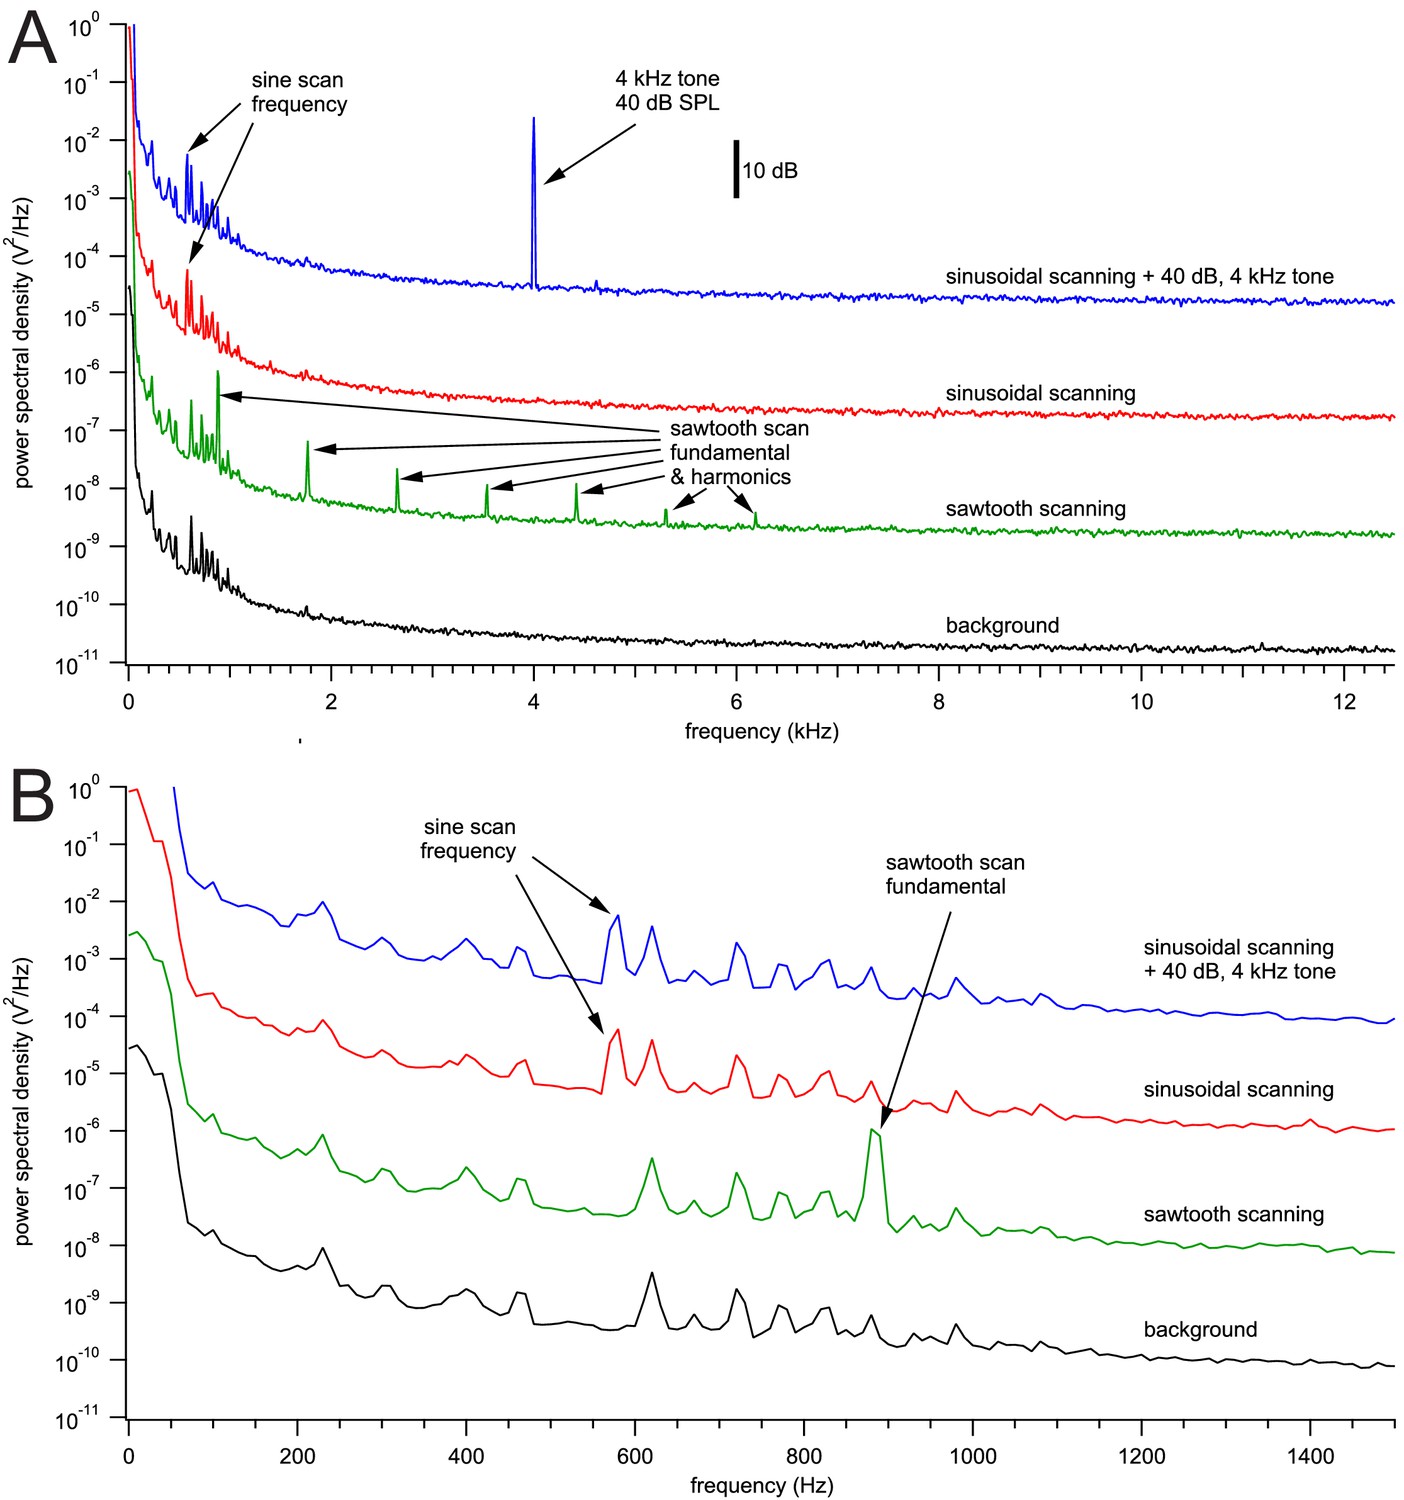
Reduction of scanner noise by sinusoidal galvo scanning.
(A) Sound spectra measured with a calibration microphone (Model 7016, ACO Pacific) with a sensitivity of −49.1 dBV @ 1 Pa and 40 dB signal amplification, positioned where the right pinna of a mouse would be located in an experiment. Each spectrum is an average of 16 spectra calculated with the pwelch function in Matlab from one-second audio recording segments with a frequency resolution of 10 Hz. The spectra represent, from bottom to top, background noise (black), sawtooth scanning (green), sinusoidal scanning (red) and sinusoidal scanning with an additional 4 kHz, 40 dB SPL tone played through the speakers (blue). The spectra are offset by 20 dB (=2 decade in power) for display, and the Y-axis corresponds to values of the background noise spectrum (bottom, black). (B) The power spectra shown near the frequencies produced during sinusoidal scanning at ~580 Hz.
Figure 3 with 2 supplements
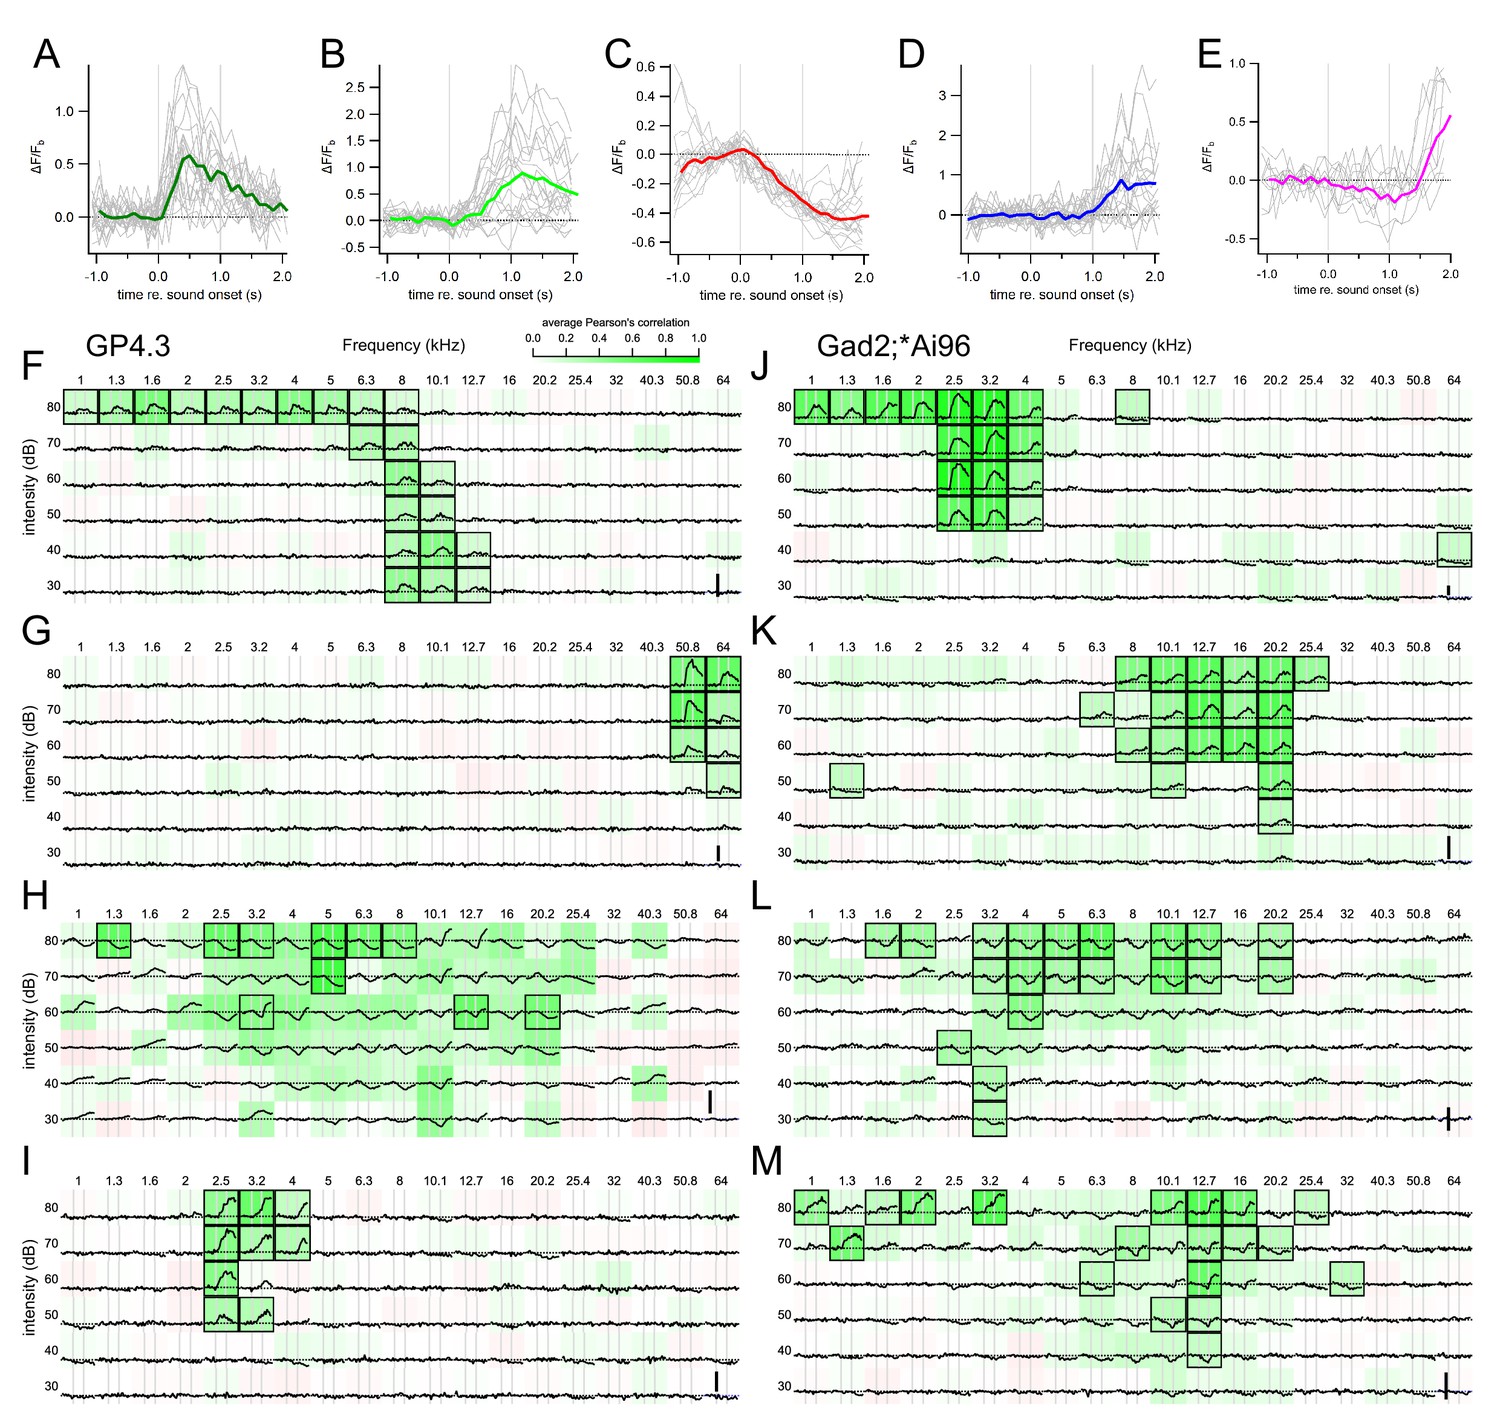
Different sound evoked responses and frequency response areas of representative example cells.
(A) An onset fluorescence response to a 1 s pure tone. Gray vertical lines indicate onset and offset of sound stimulus. Colored and gray traces are average and individual trial fluorescence changes, respectively, normalized to a one-second baseline immediately before the stimulus onset (ΔF/Fb). (B) A sustained fluorescence response. (C) An inhibitory response. (D) An offset response. (E) A mixed inhibitory and offset response. Example FRAs from GP4.3 (F–I) and Gad2;Ai96 (J–M) mice. Each subplot shows the average ΔF/Fb to a stimulus of the specified frequency and intensity. Background color shows average Pearson’s correlation among repetitions, indicating consistency of response (Geis et al., 2011). Black squares mark significant correlation from bootstrap analysis. Cells in (G) and (J) are examples of cells with an onset FRA; cells in (F) and (K) showed a sustained FRA; cells in (H) and (L) were inhibited by sound; cells in (I) and (M) showed a mixture of different response classes. (I) A typical onset-offset cell with frequency-dependent responses: onset fluorescence responses to 2.5 kHz tones and offset fluorescent responses to 3.2 and 4 kHz tones. (M) A cell showing intensity-dependent responses: at 12.7 kHz, low intensity tones evoked a decrease in fluorescence (inhibited) while tones at 80 dB elicited an offset response. Tones at 60–70 dB elicited a mixture of inhibition and offset responses. Vertical scale bars in (F–I) indicates 1 Fb.
-
Figure 3—source data 1
Fluorescence kinetics source data CSV file containing fluorescence kinetics of ROIs, genotype of animal and type of FRA.
- https://doi.org/10.7554/eLife.49091.010
Figure 3—figure supplement 1
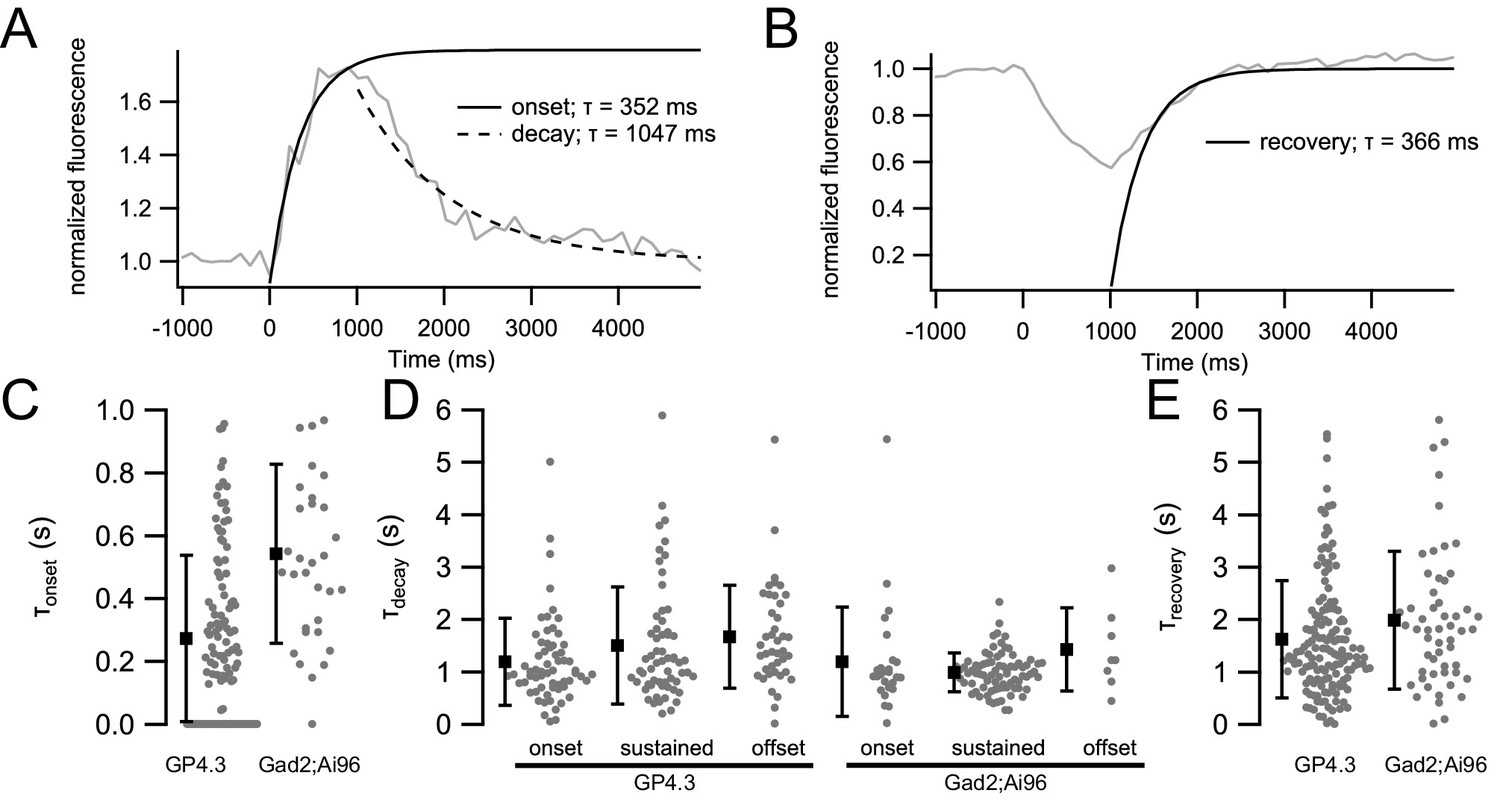
Kinetics of fluorescence responses.
(A) Example of the average fluorescence response of a cell with an onset-type response to sound (gray trace). Single exponential fits were performed on the onset (0–1000 ms; solid black curve) and decay (1.5–5 s; dashed black curve) periods. Due to the short inter-stimulus interval (1.5 s), responses where another effective stimulus followed immediately were excluded for averaging. (B) For inhibitory responses, the recovery from inhibition was used for the fitting (1.5–5 s; solid black curve). (C) Onset time constant for cells showing onset response (τonset) (GP4.3 mean τonset304 ± 240 ms, n = 111 cells; Gad2;Ai96 mean τonset514 ± 280 ms, n = 10 cells) (D) Decay time constant (τdecay) for cells showing onset, sustained or offset responses. Mean τdecay for onset cells (GP4.3: 1190 ± 828 ms, n = 63 cells; Gad2;Ai96: 1200 ± 1040 ms, n = 26 cells), sustained cells (GP4.3: 1500 ± 1120 ms, n = 61 cells; Gad2;Ai96: 987 ± 373 ms, n = 79 cells) and offset cells (GP4.3: 1670 ± 981 ms, n = 41 cells; Gad2;Ai96: 1430 ± 795 ms, n = 8 cells). (E) Recovery time constant (τrecovery) for inhibited cells (GP4.3: mean τrecovery: 1630 ± 1120 ms, n = 148 cells; Gad2;Ai96 mean τrecovery = 1990 ± 1310 ms, n = 54 cells). Error bars in C-E represent s.d.
Figure 3—figure supplement 2
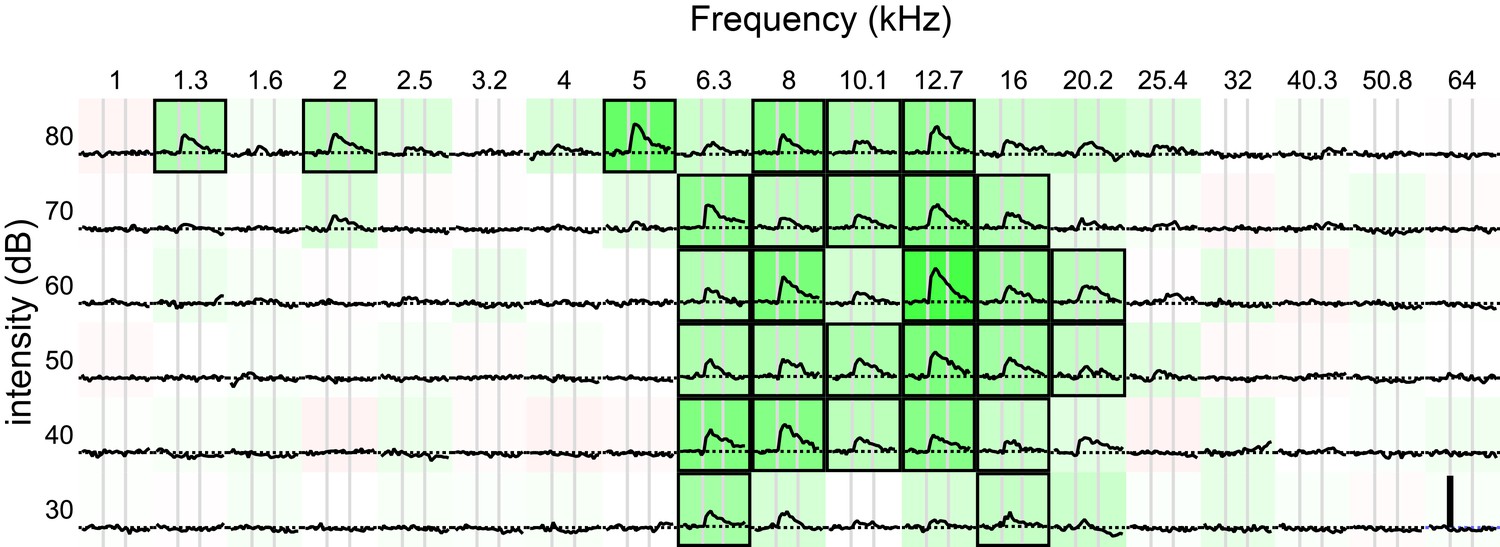
Another example FRA from a GP4.3 mouse, showing onset response and broad tuning.
Vertical scale bar indicates 1 Fb.
Figure 4
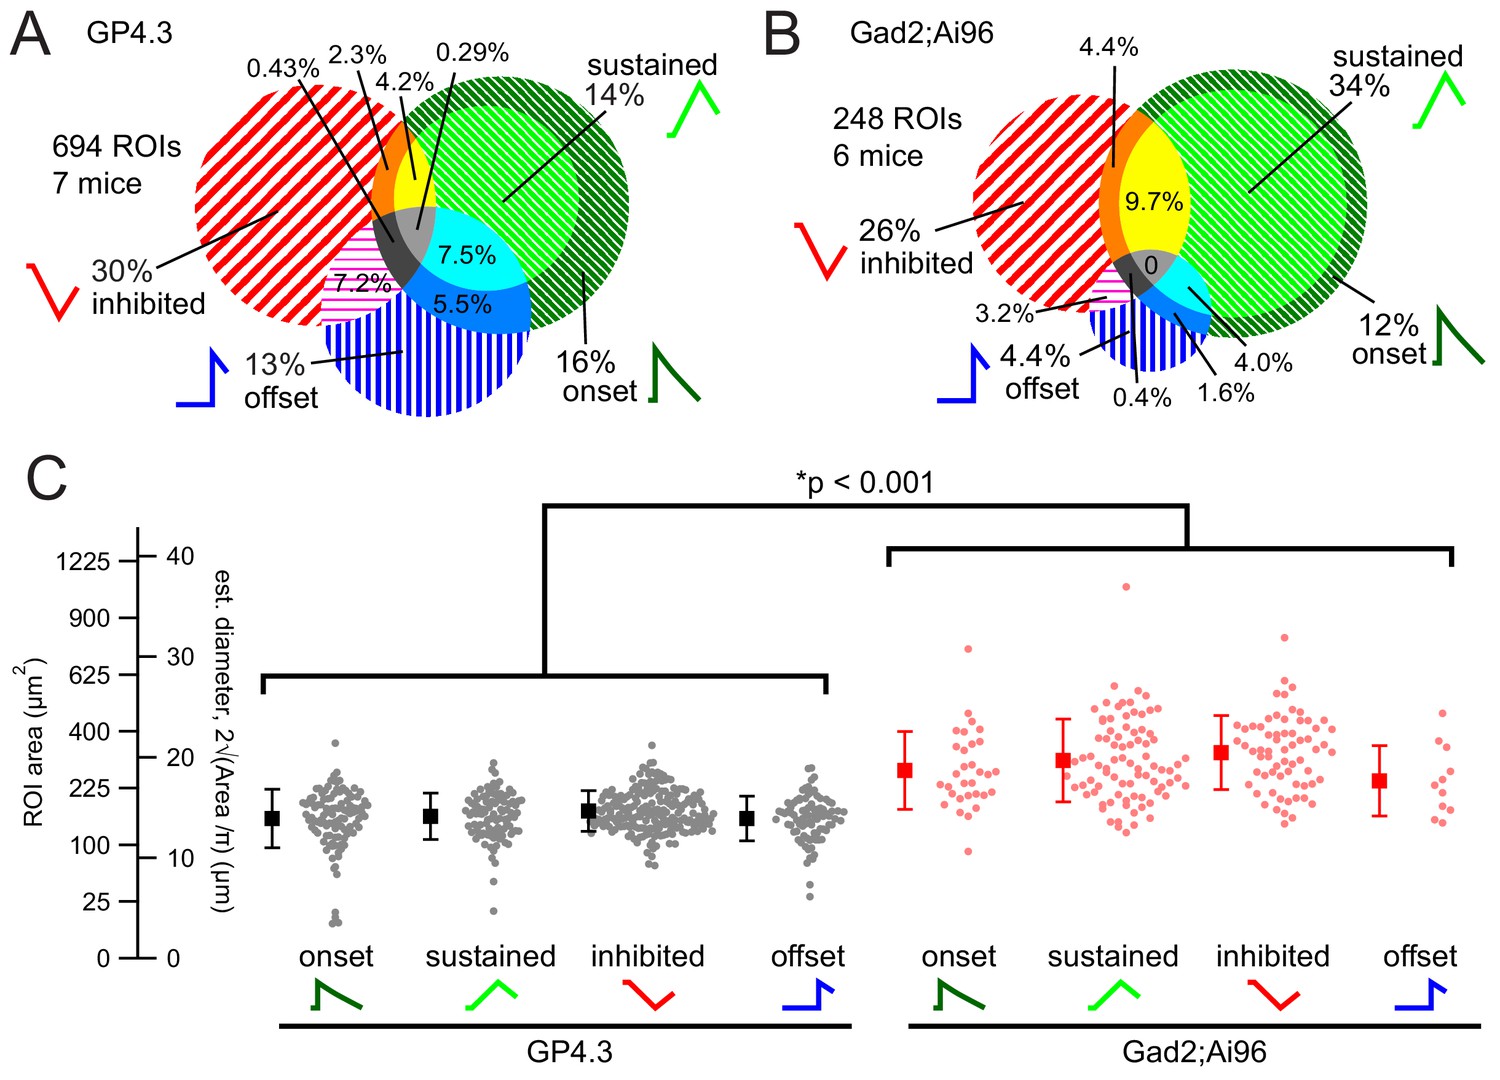
Proportion of response classes and relationship with cell size.
(A–B) Proportions of response classes in GP4.3 (A) and GAD2;Ai96 animals (B). (C) Bee swarm plot and mean ±s.d. for cell size for ROIs of different non-mixed response classes, separated by genotypes, measured as the size of the ROI (Area) in imaging experiments. Estimated diameters (d) were calculated by assuming a circular shape (i.e. ). Cells imaged in Gad2;Ai96 mice were on average larger than those in GP4.3 mice.
-
Figure 4—source data 1
IC ROI Area source data CSV file containing fluorescence area and estimated diameter of ROI, genotype of animal and type of FRA.
- https://doi.org/10.7554/eLife.49091.012
Figure 5 with 3 supplements
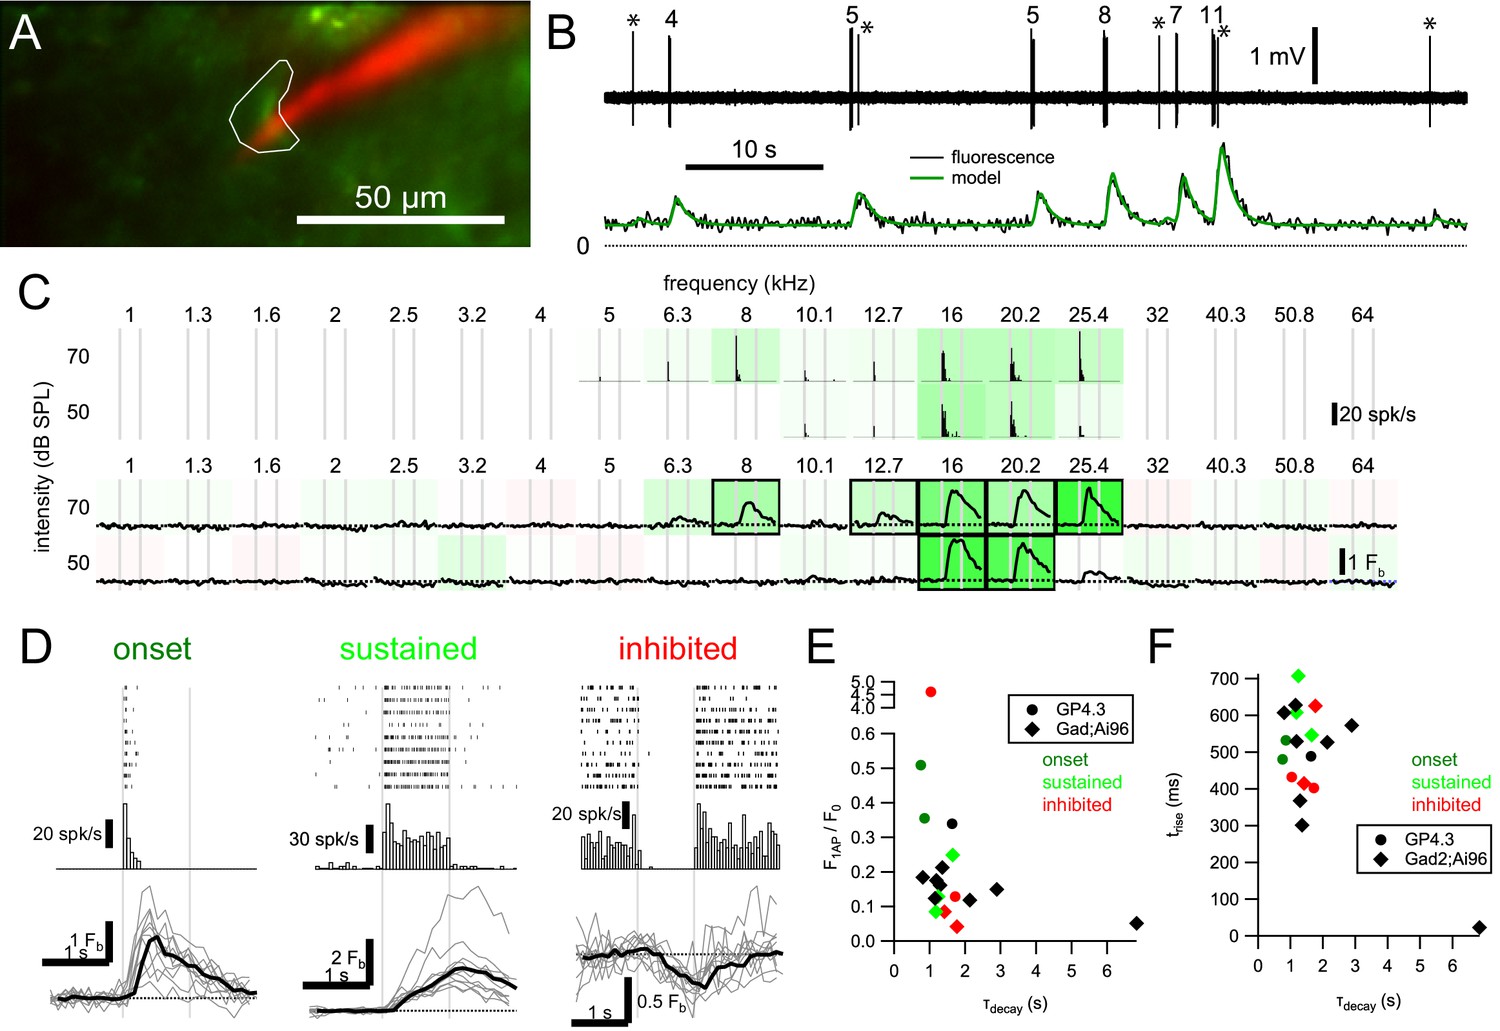
Relationship between GCaMP6s fluorescence and spikes in IC neurons.
(A) Imaging of a GCaMP6s+ cell (green) in an awake GP4.3 animal with simultaneous juxtacellular recording with a pipette filled with Alexa 594 (red). (B) Spiking pattern (upper) and fluorescence (lower) of the example cell can be well related by a linear convolution of spike rate with a linear ramp, exponential decay kernel (model: green). Fit parameters: F0 = 28.8 a.u.; ΔF1AP = 10.2 a.u.; trise = 532 ms; τdecay = 859 ms. Numbers above bursts indicate number of spikes, and asterisks (*) mark single spikes. (C) Frequency tuning of the cell. Peristimulus time histogram (PSTH; upper, 50 ms bins, 10 repetitions) and mean fluorescence change of the cell in response to 1 s tone bursts. (D) Raster plots, PSTHs and fluorescence responses (mean: black; individual: gray) of an onset cell (same example as A-C), a sustained cell and an inhibited cell. Due to their rarity, we have not obtained a simultaneous recording for offset cells. (E) Relation between normalized single action potential amplitude (F1AP/F0) and decay time constant (τdecay). (F) Relation between rise time (zero-to-peak; trise) and τdecay. Color in E and F indicate response class (red: inhibited; dark green: onset; light green: sustained; black: no tone-evoked response) of the cell.
-
Figure 5—source data 1
Ground-truth model fitting source data CSV file containing model parameters from ground-truth data fitting and the variance explained, genotype of animal and type of FRA.
- https://doi.org/10.7554/eLife.49091.017
Figure 5—figure supplement 1
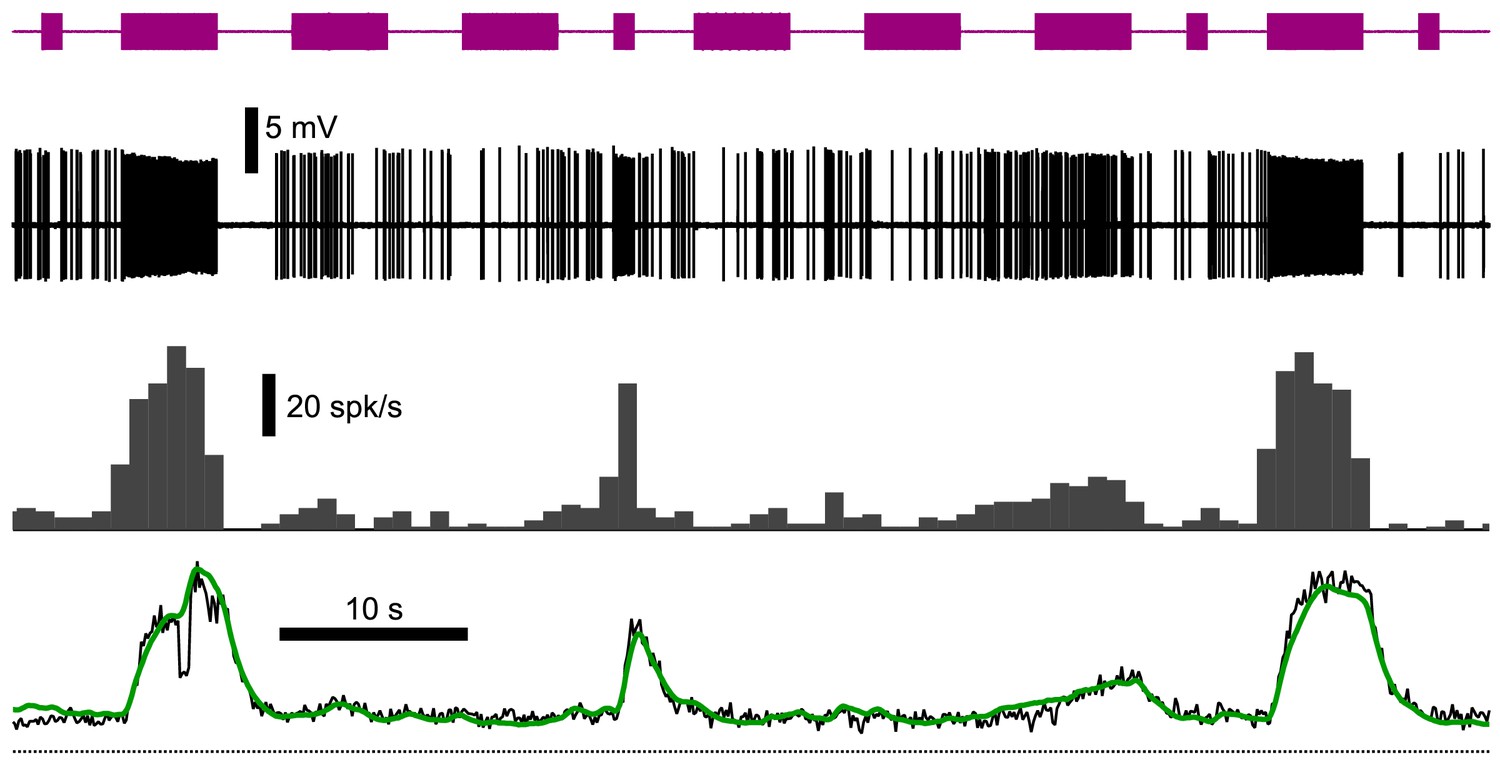
Example model fit to a cell with a sustained FRA.
From top to bottom: sound stimulus (purple trace), spiking pattern (black), spike rate (gray histogram, 1 s bins) and fluorescence (black trace) of a cell from a Gad2;Ai96 animal with a sustained FRA and the model fit (green). Fit parameters: F0 = 14.7 a.u.; ΔF1AP = 1.25 a.u.; trise = 607 ms; τdecay = 1180 ms. Variance explained by model: 90.9%. Cell id: a11958_04_c5.
Figure 5—figure supplement 2
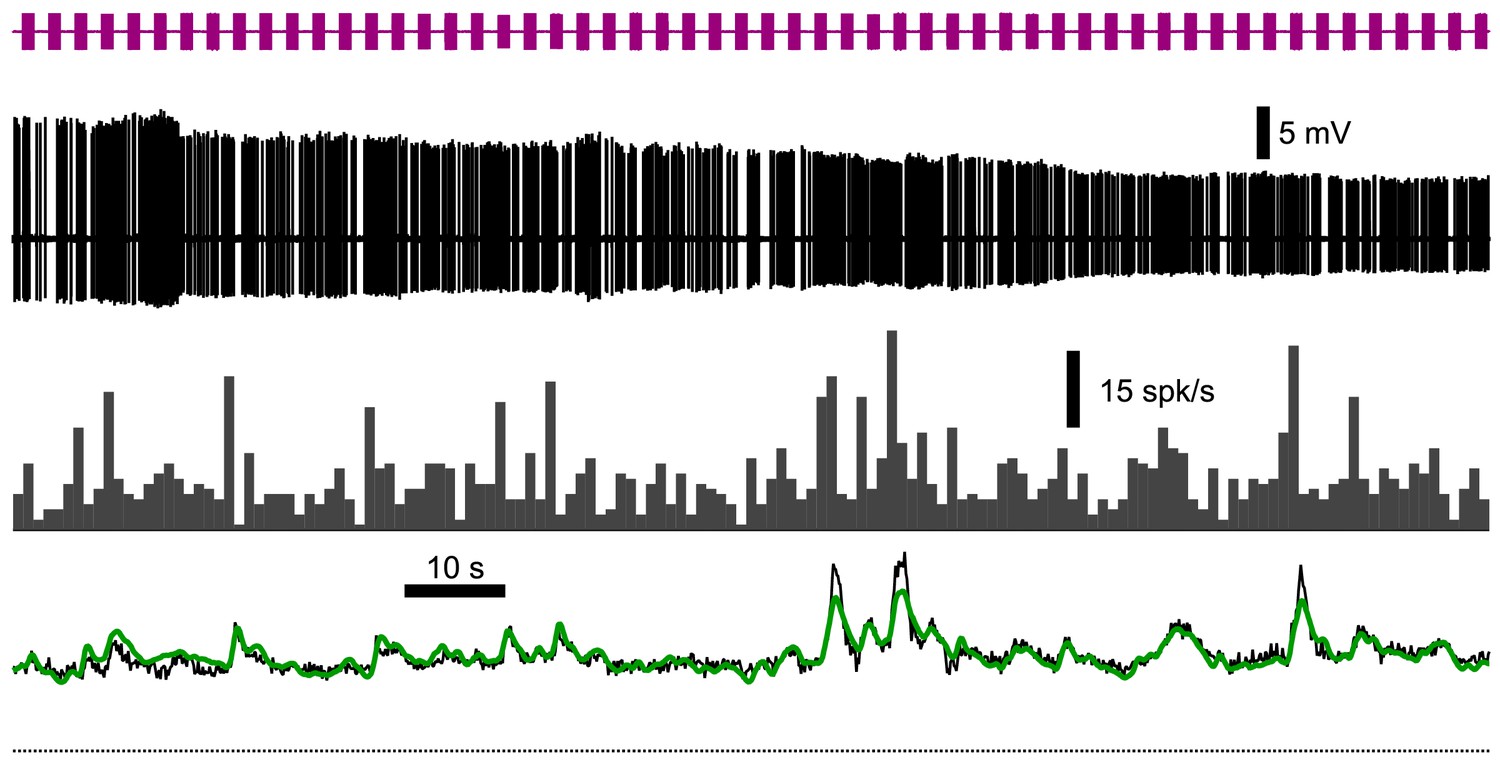
Example model fit to a cell with an inhibited FRA.
From top to bottom: sound stimulus (purple trace), spiking pattern (black), spike rate (gray histogram, 1 s bins) and fluorescence (black trace) of a cell from a Gad2;Ai96 animal with an inhibited FRA and the model fit (green). Fit parameters: F0 = 44.3 a.u.; ΔF1AP = 1.85 a.u.; trise = 626 ms; τdecay = 1770 ms. Variance explained by model: 79.4%. Cell id: a11958_04_c6.
Figure 5—figure supplement 3
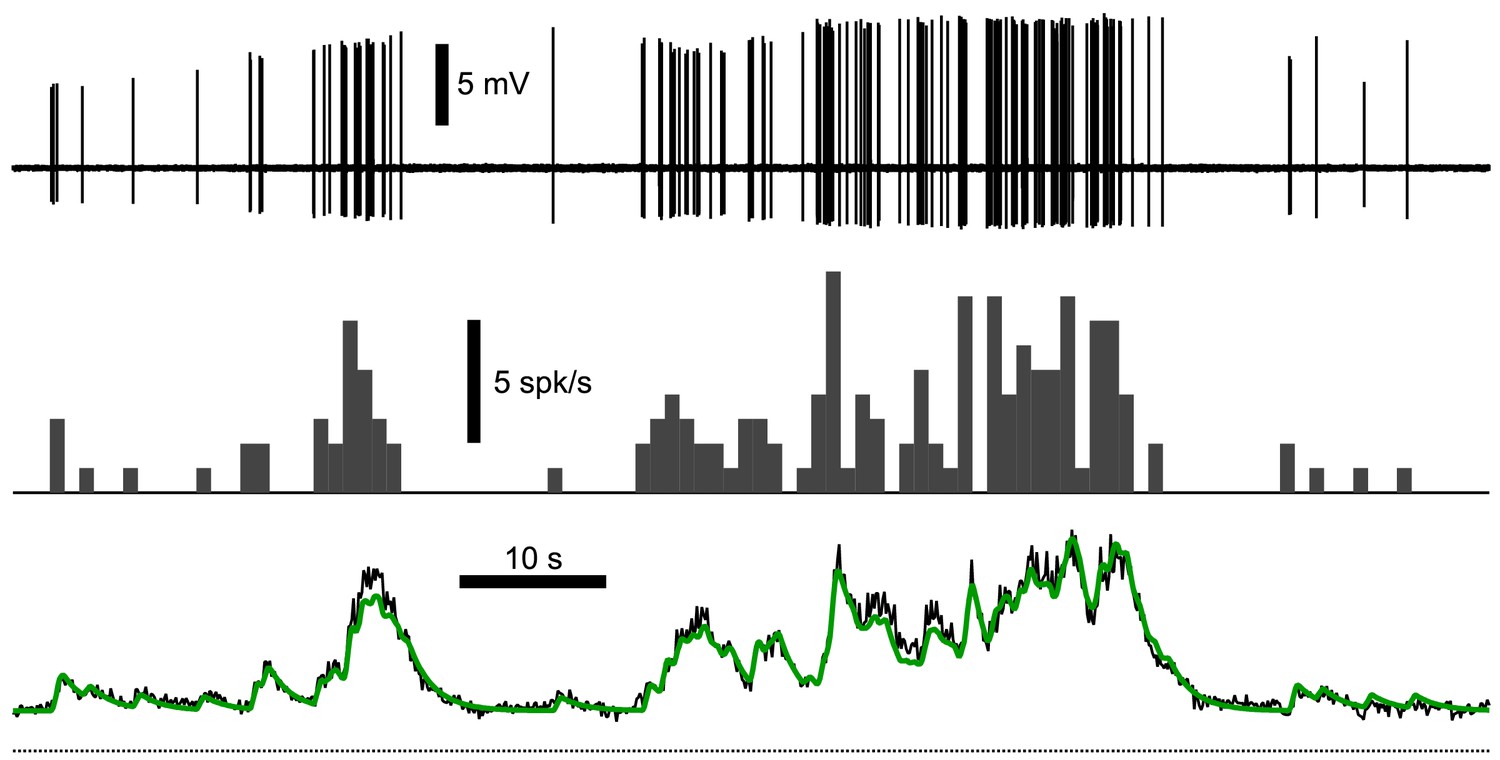
Example model fit to spontaneous activity of a cell.
From top to bottom: spiking pattern (black), spike rate (gray histogram, 1 s bins) and fluorescence (black trace) of a spontaneously active cell from a GP4.3 animal and the model fit (green). Fit parameters: F0 = 66.2 a.u.; ΔF1AP = 22.5 a.u.; trise = 489 ms; τdecay = 1640 ms. Variance explained by model: 93.0%. Cell id: a11814_08_c5.
Figure 6 with 9 supplements
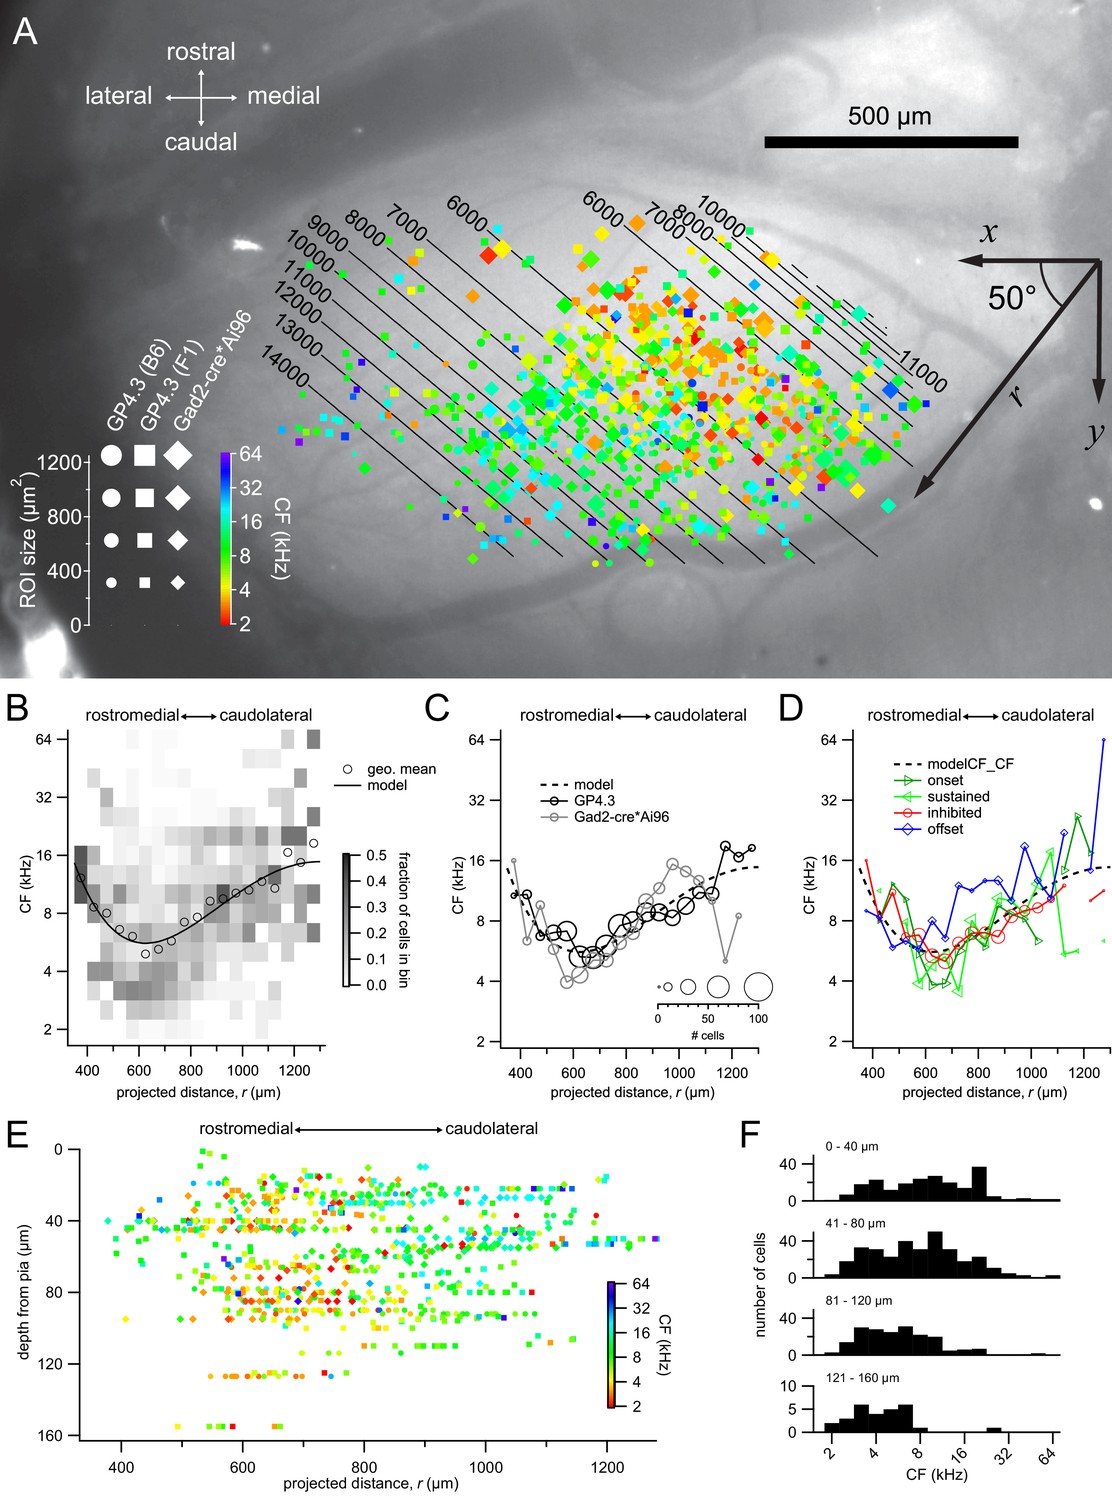
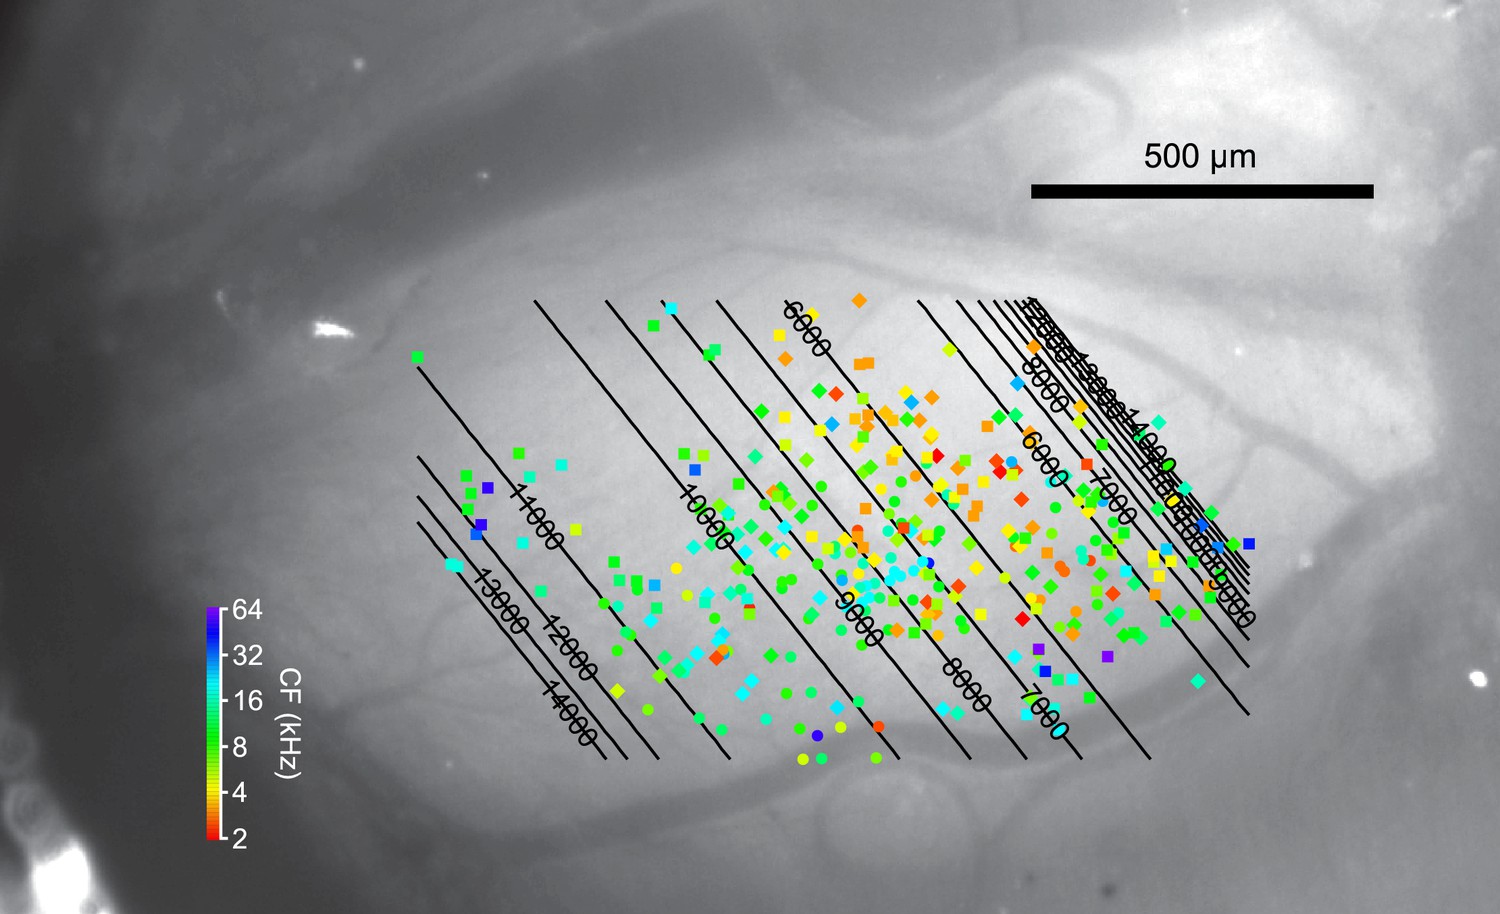
Tonotopic organization.
(A) Combined spatial distribution of characteristic frequencies (CFs) in the two transgenic lines, aligned to the same top-down image of an exposed left IC. Symbol size represents the size of the ROI, while colors indicate different CFs. Cells from Gad2;Ai96 mice were marked by diamonds. For GP4.3, the shape of the symbol represents ROIs from C57BL/6J (circles) or B6CBAF1 (squares) background. To capture a direction of tonotopy, CF was fitted with a 4th-order polynomial r = x cosθ + y sinθ where r is a presumed direction of tonotopy at an angle θ (i.e. r = xcosθ+ysinθ), with the origin being the contact point between superior and inferior colliculi at the midline. The best fit yielded an angle θ of 50° from the medial-lateral axis. Contour lines indicate the predicted CF of the fit. (B) Geometric mean (open circles) and probability distribution (background shading) of CF along the 50° line, in 75 μm bins. Black trace shows the fitted 4th-order polynomial. (C) Geometric mean of CF along the 50° line for the GP4.3 (black) and Gad2-cre*Ai96 (gray) lines. Size of symbol represent number of cells in each 75 μm bin. (D) Geometric mean of CF for cells of onset, sustained, inhibited or offset FRAs. (E) Depth dependence of CFs along the 50° line. (F) Histogram of CF grouped according to depth from pia surface. Note that low CF cells are present at all imaging depths.
-
Figure 6—source data 1
IC CF Distribution source data CSV file containing 3D coordinate of ROIs, projected distance of ROIs, genotype of animal and type of FRA.
Source code for fit function used for fitting the spatial distribution.
- https://doi.org/10.7554/eLife.49091.027
Figure 6—figure supplement 1
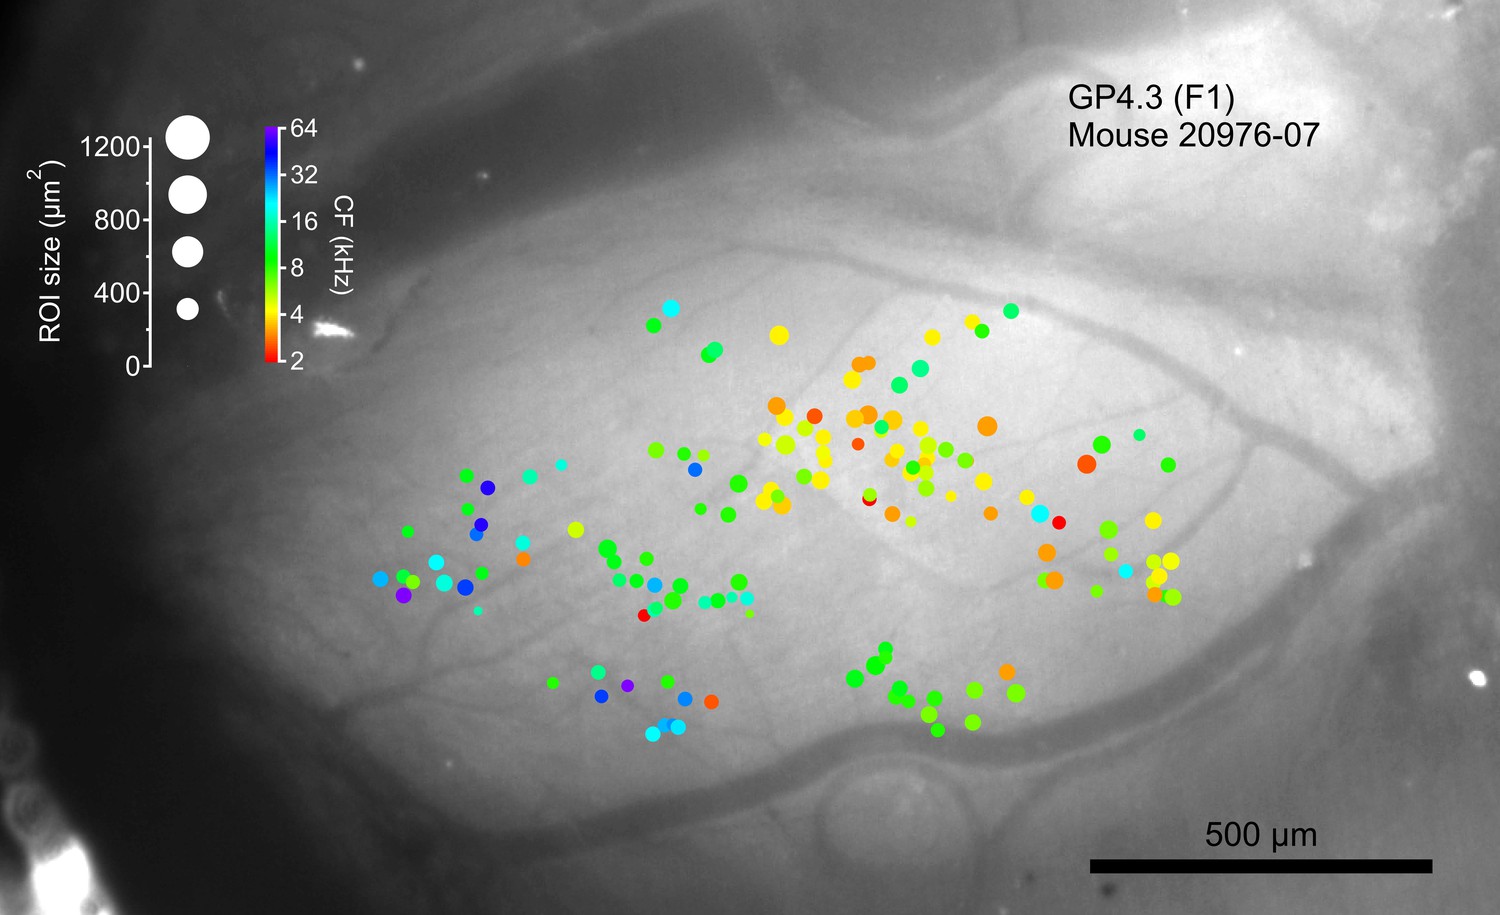
Tonotopic organization of a single GP4.3 animal (Mouse 20976–07; B6CBAF1/J background), registered to widefield image in Figure 6A.
https://doi.org/10.7554/eLife.49091.019
Figure 6—figure supplement 2
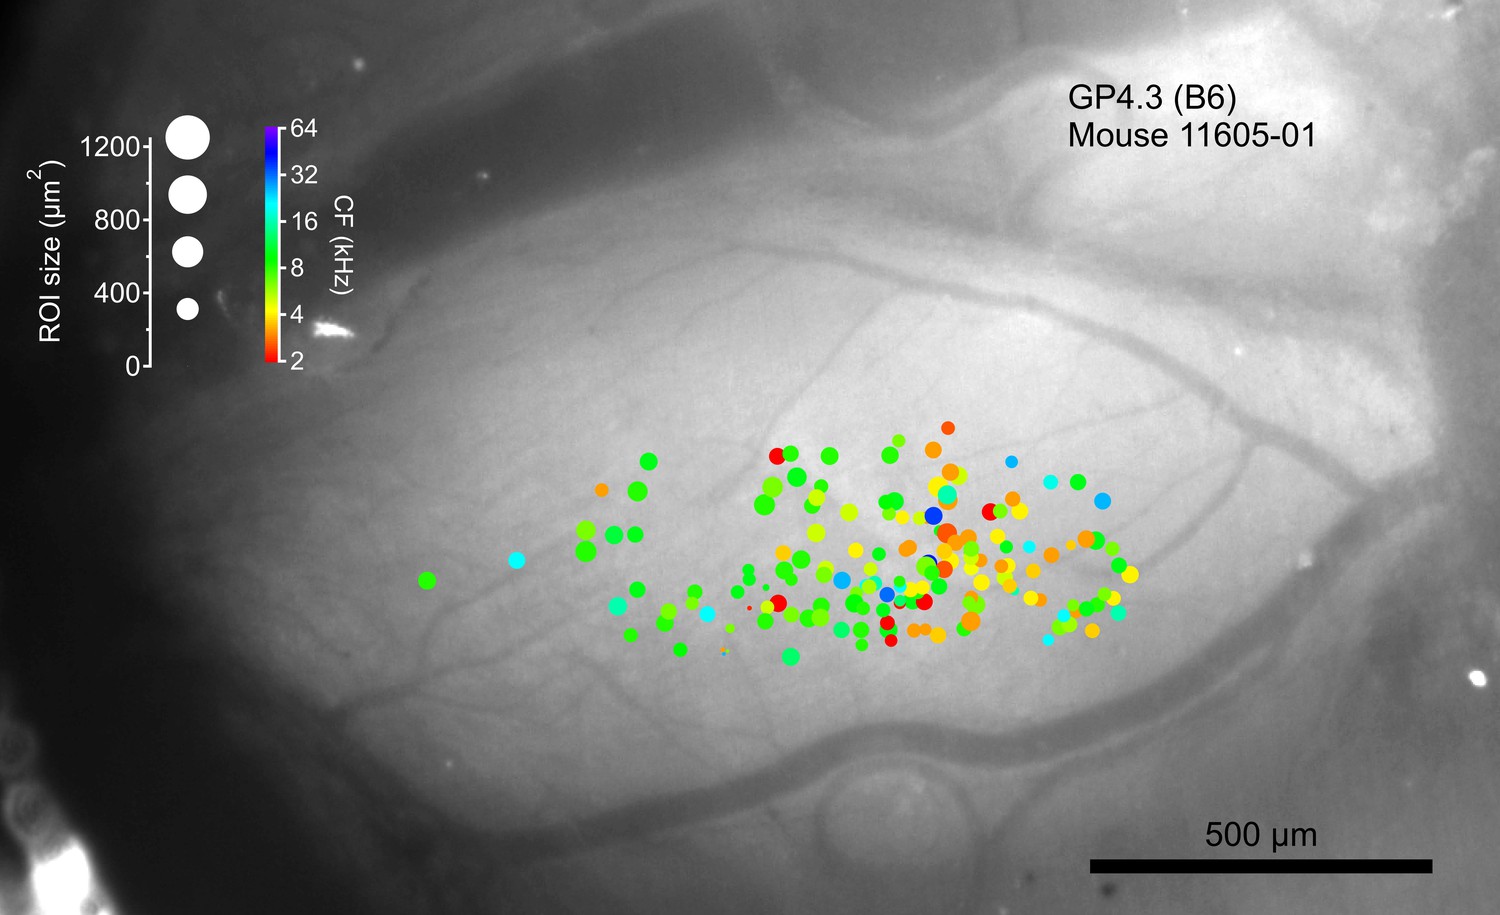
Tonotopic organization of a single GP4.3 animal (Mouse 11605–01; C57BL/6J background), registered to widefield image in Figure 6A.
https://doi.org/10.7554/eLife.49091.020
Figure 6—figure supplement 3
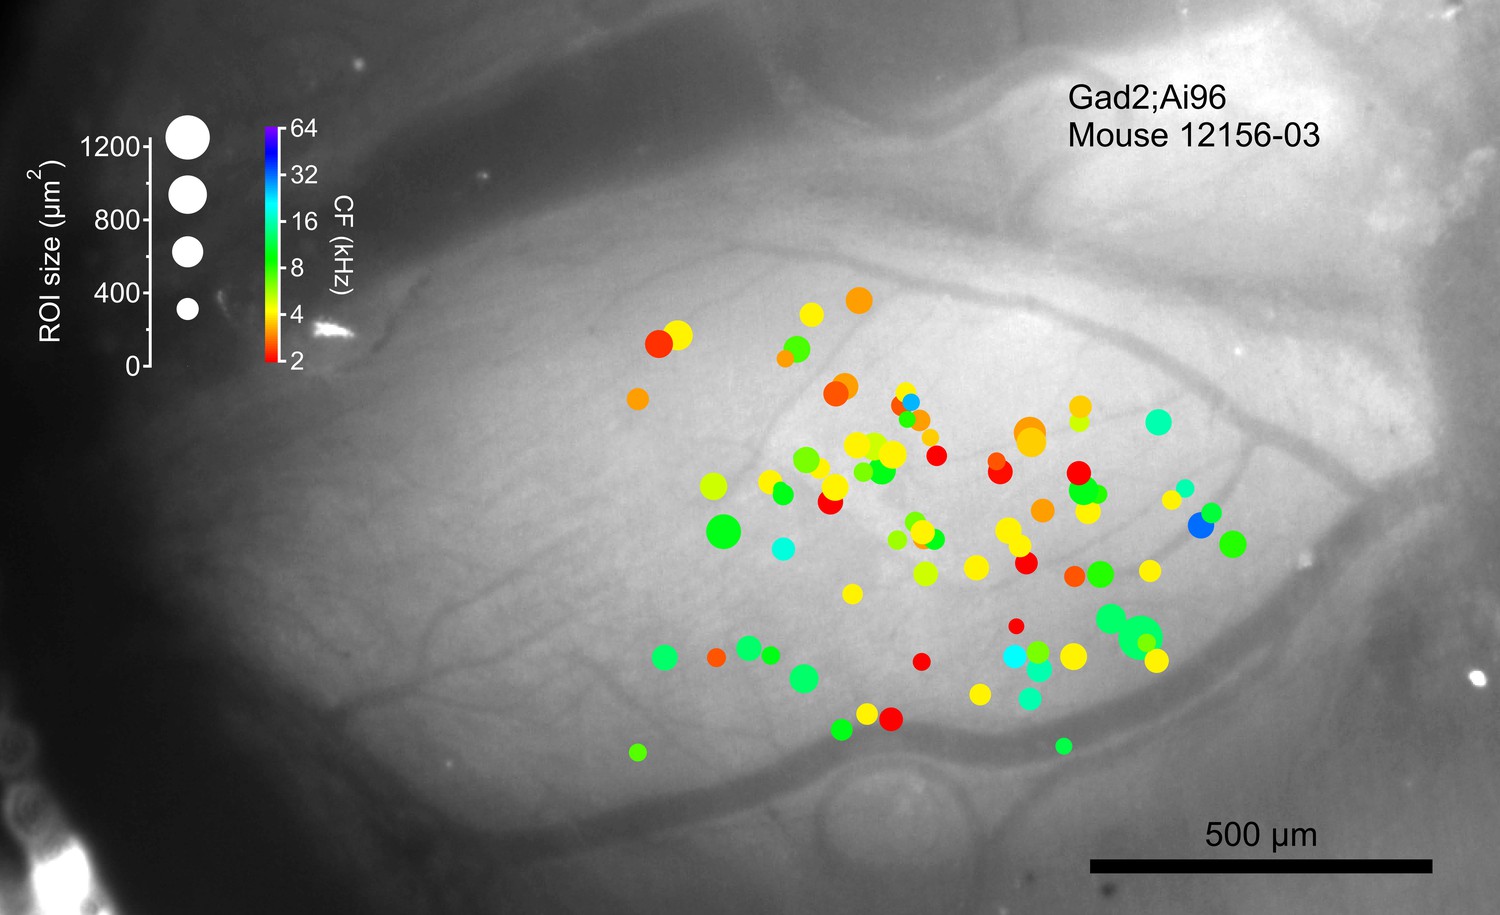
Tonotopic organization of a single Gad2;Ai96 animal (Mouse 12156–03), registered to widefield image in Figure 6A.
https://doi.org/10.7554/eLife.49091.021
Figure 6—figure supplement 4
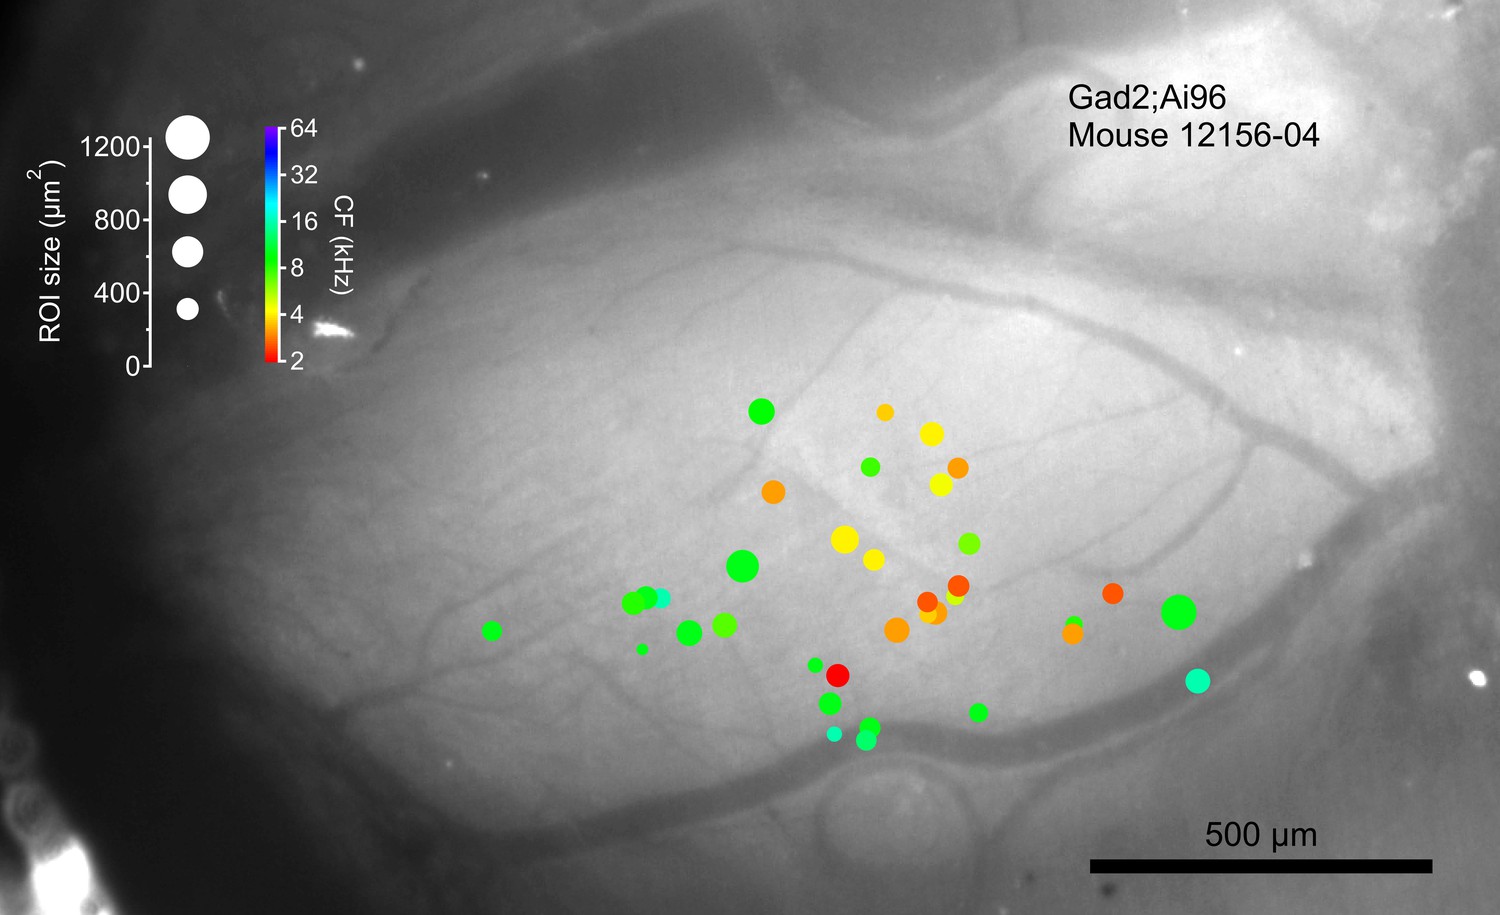
Tonotopic organization of a single Gad2;Ai96 animal (Mouse 12156–04), registered to widefield image in Figure 6A.
Same animal as Figure 9A.
Figure 6—figure supplement 5
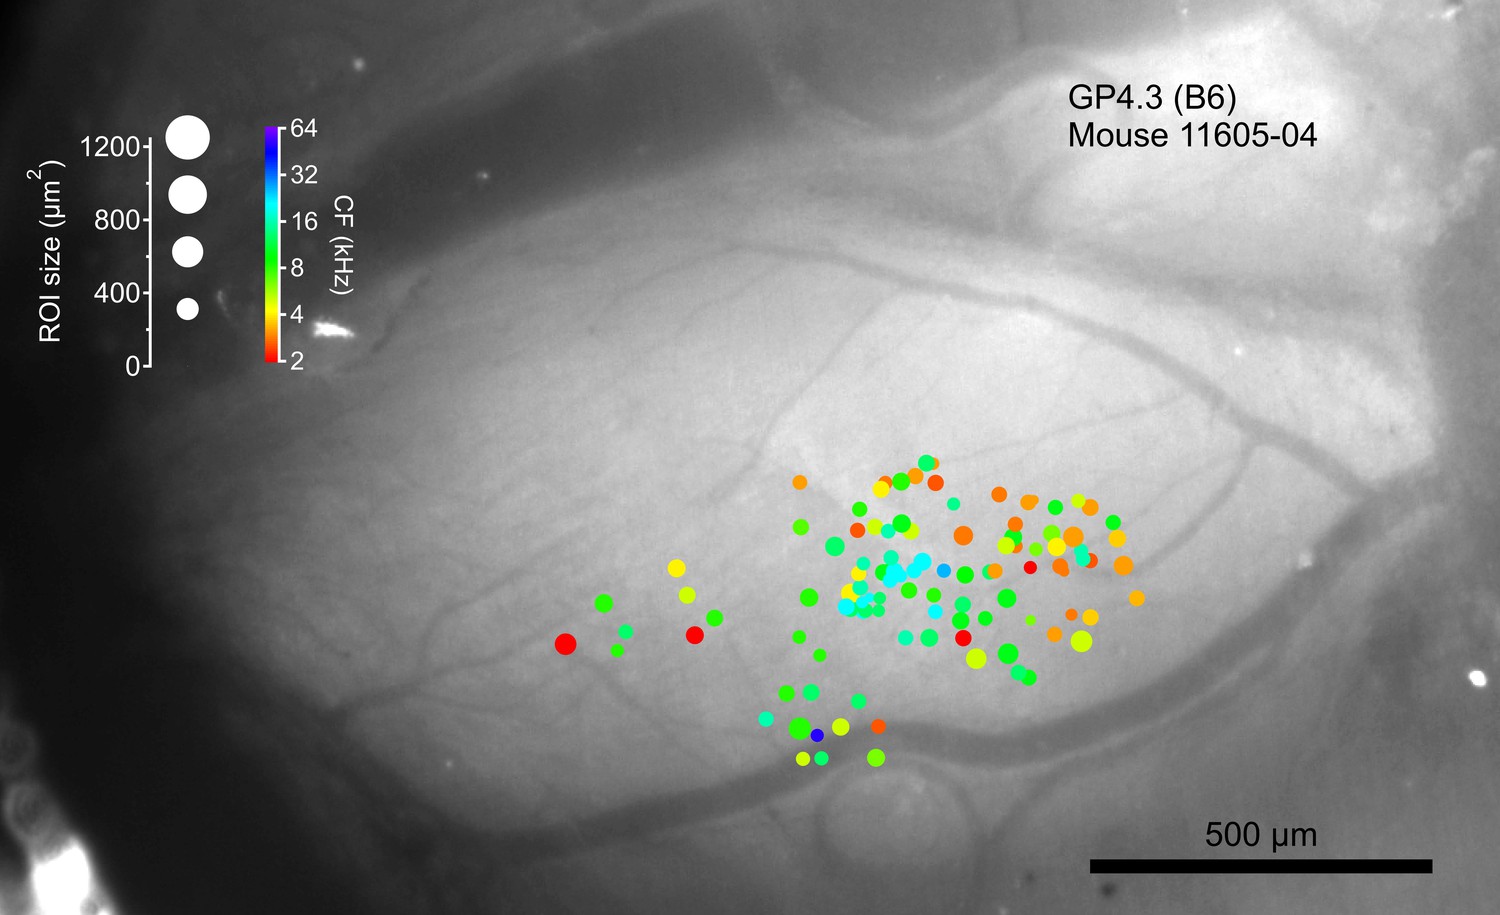
Tonotopic organization of a single GP4.3 animal (Mouse 11605–04; C57BL/6J background), registered to widefield image in Figure 6A.
Same animal as Figure 9E.
Figure 6—figure supplement 6
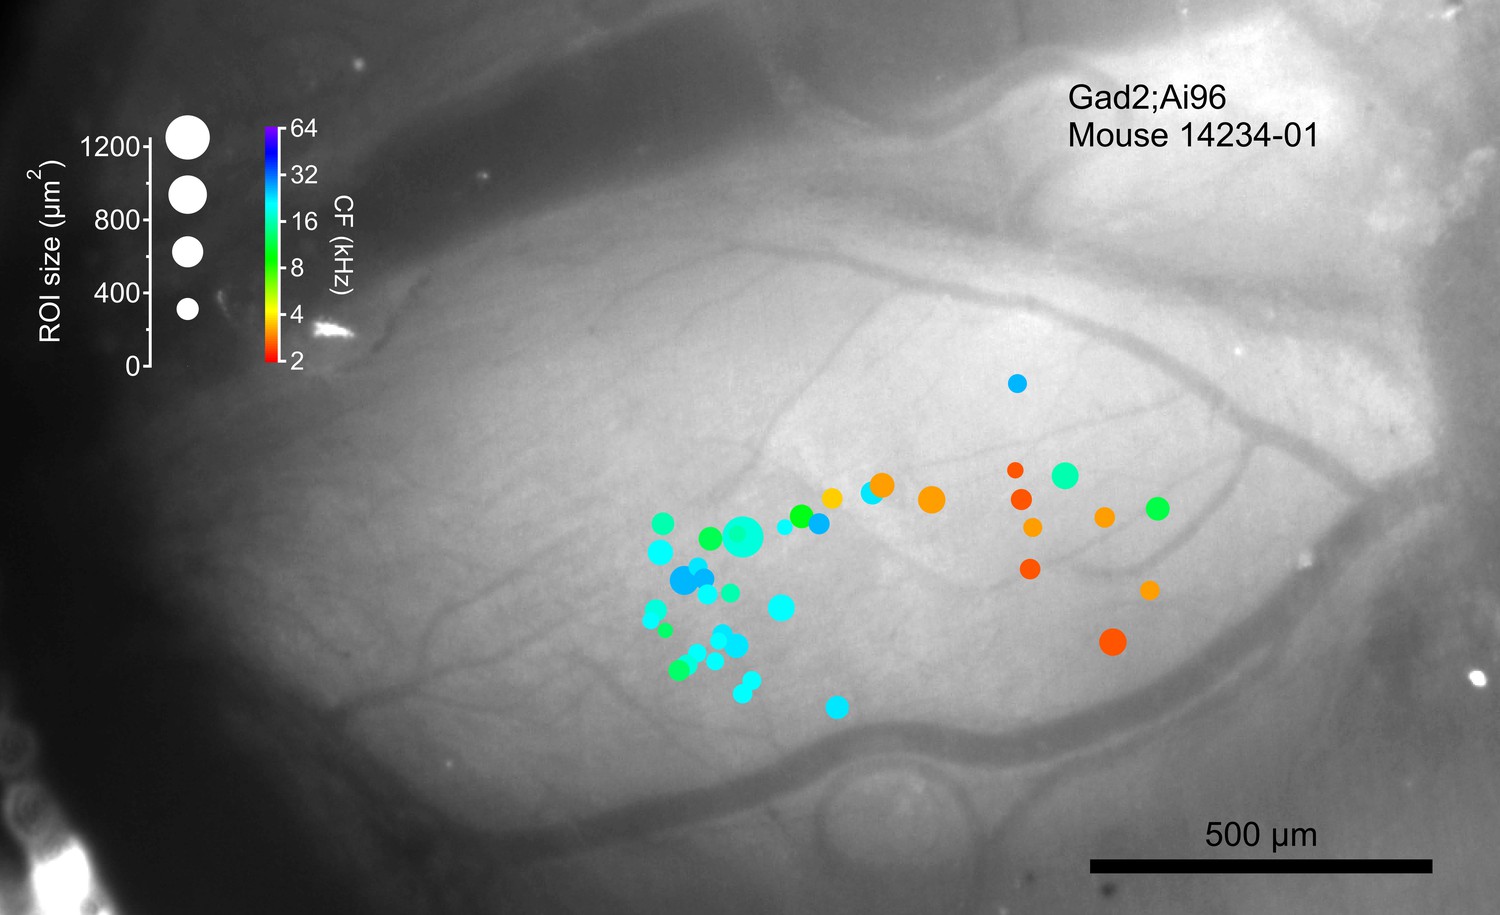
Tonotopic organization of a single Gad2;Ai96 animal (Mouse 14234–01), registered to widefield image in Figure 6A.
https://doi.org/10.7554/eLife.49091.024
Figure 6—figure supplement 7
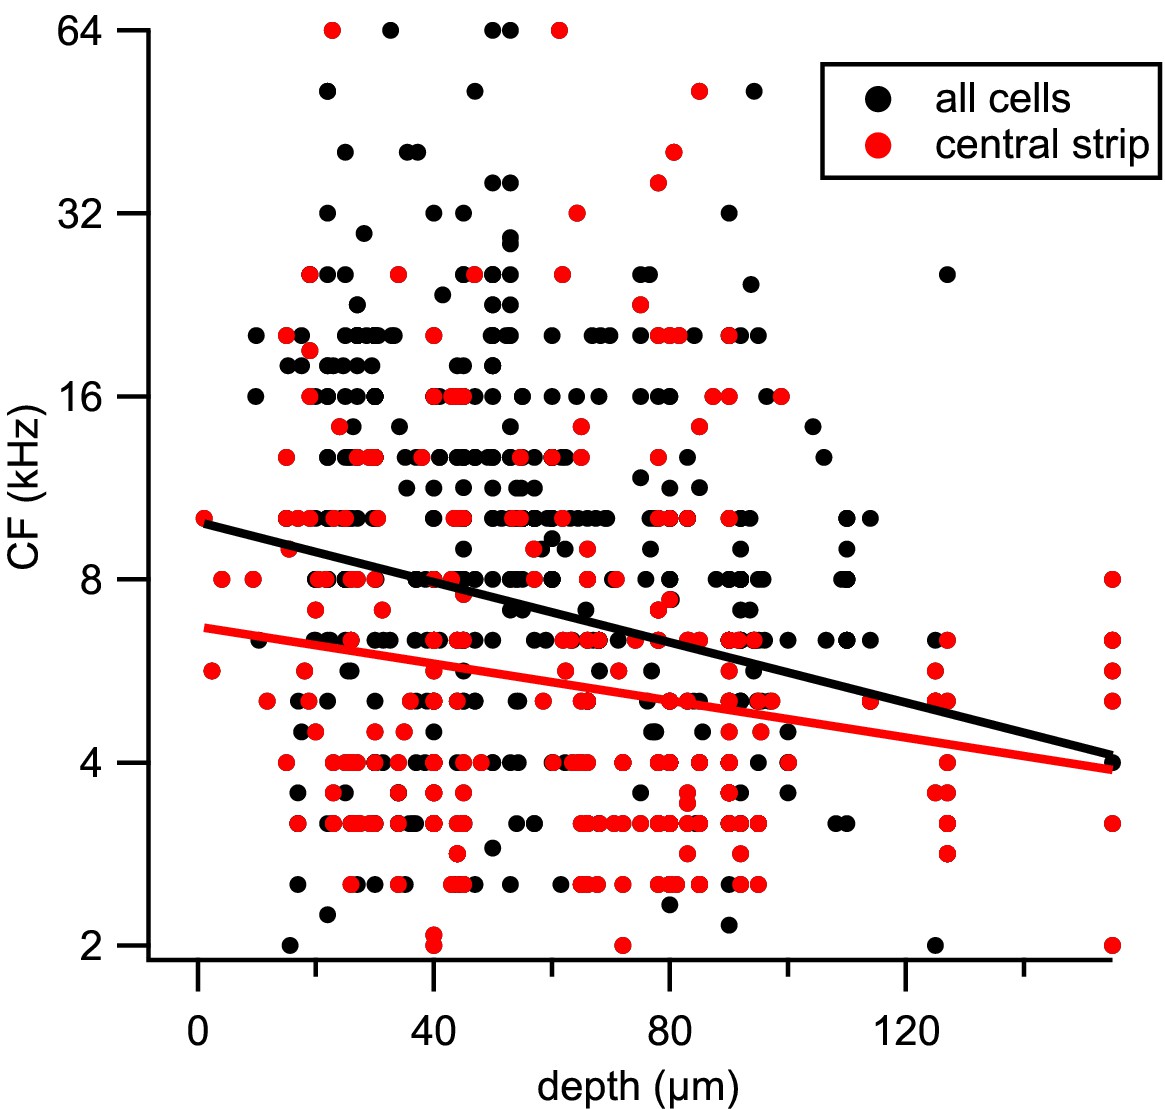
Relationship between CF and depth of cell.
Scatter plot of CF against depth of each ROI from pia surface. Black: all cells; red: cells within the central strip, r = 525–725 μm. Solid lines represent regression lines for the two data sets.
Figure 6—figure supplement 8
Tonotopic organization of the most superficial cells.
Combined spatial distribution of characteristic frequencies (CFs) for cells within 50 μm of the pia surface in the two transgenic lines, aligned to the same top-down image of an exposed left IC. Symbol size represents the size of the ROI, while colors indicate CFs. Cells from Gad2;Ai96 mice were marked by diamonds. For GP4.3, the shape of the symbol represents ROIs from C57BL/6J (circles) or B6CBAF1 (squares) background. A 4th-order polynomial fit of the superficial cells also yielded a double gradient.
Figure 6—video 1
Video of all sound-responsive.
ROIs plotted in a common coordinate system, color coded according to their characteristic frequencies. The Z-dimension indicates the depth from pia surface. Numbers on the axes are in μm. The same data appears in Figure 6A,E.
Figure 7
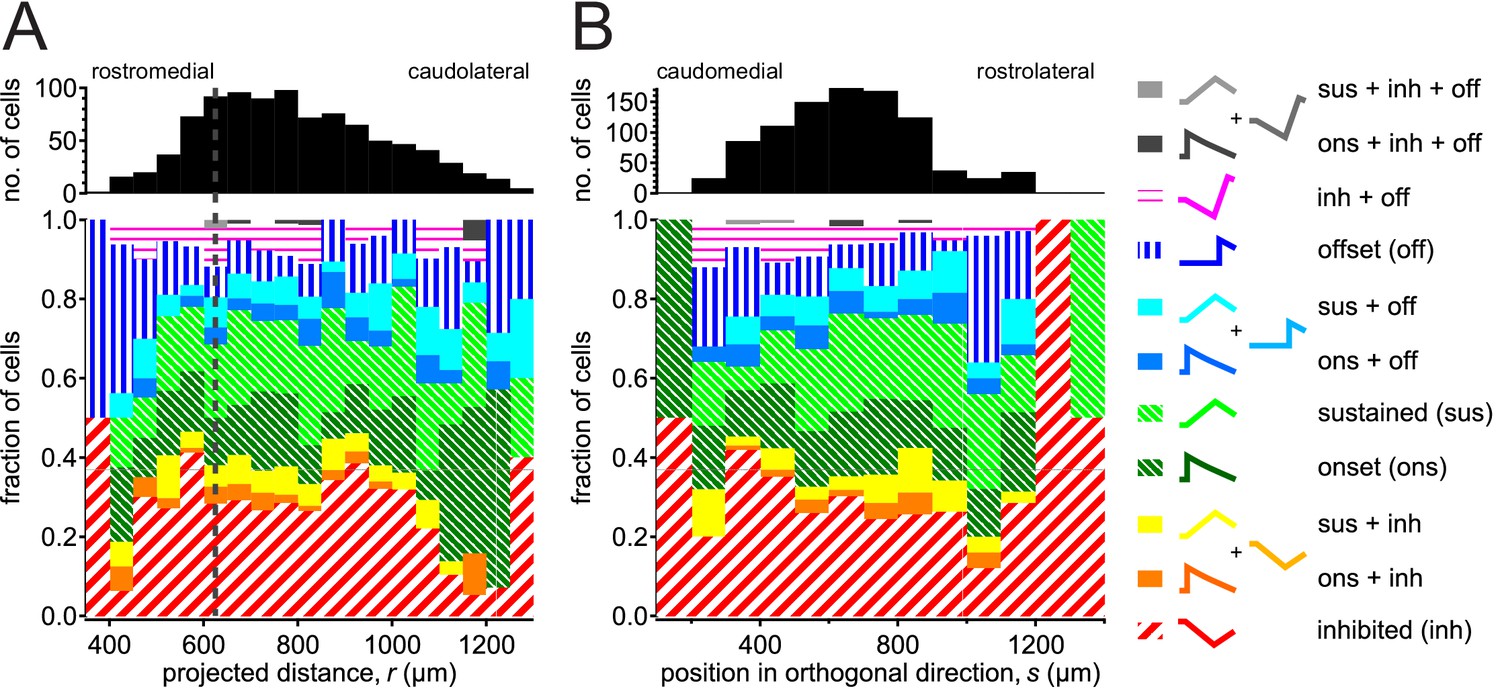
Spatial organization of response classes.
Similar proportions of response classes along (A) the presumed tonotopic axis (bin size 50 μm) and (B) the direction orthogonal to the axis (bin size 100 μm). Zero position was taken as the contact point between superior and inferior colliculi at the midline. Vertical dashed line in (A) denotes the minimal CF position based on our polynomial fit (625 μm).
-
Figure 7—source data 1
IC Response Distribution source data CSV file containing 3D coordinate of ROIs, projected distance of ROIs, genotype of animal and type of FRA.
- https://doi.org/10.7554/eLife.49091.030
Figure 8 with 1 supplement
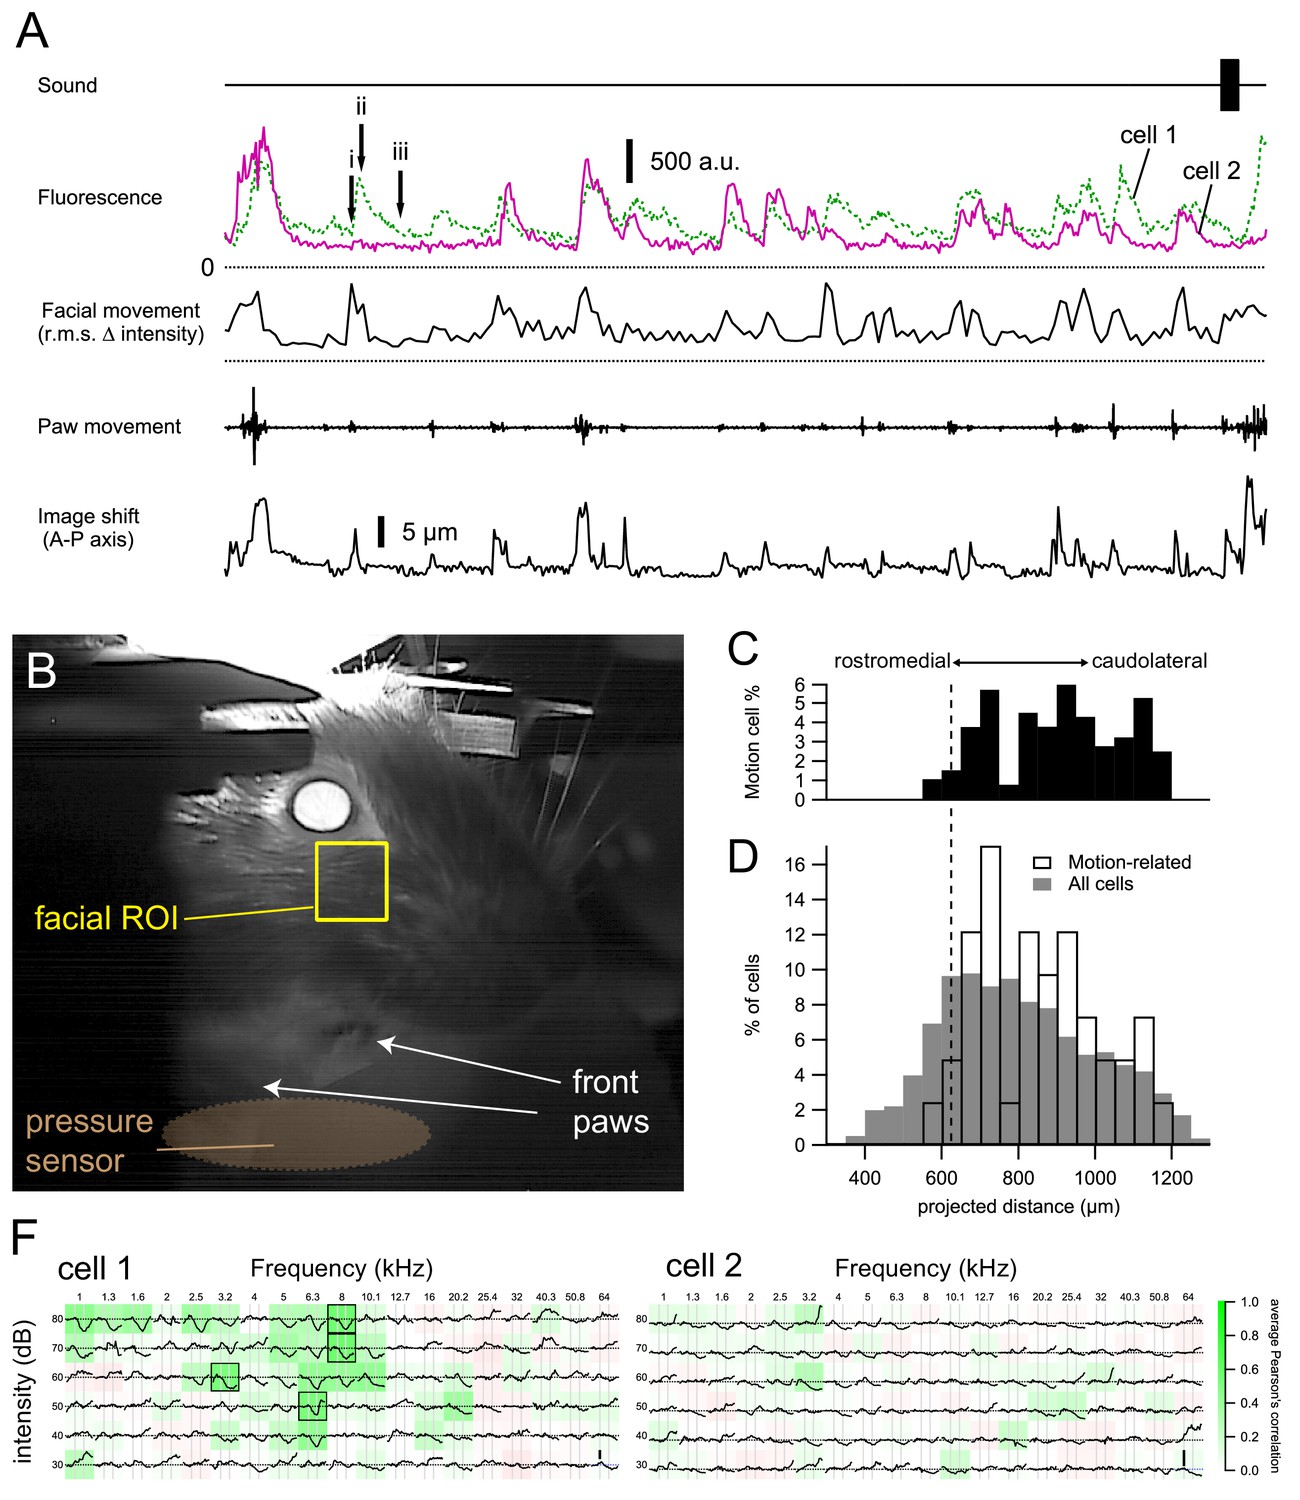
Cells with motion-related responses.
(A) Two example cells that were spontaneously active in the absence of sound presentation. Calcium transients occurred when the animal was moving its paws or showing facial movement (e.g. whisking). These transients decayed much more slowly than motion artefacts (image shifts, bottom trace; see also Figure 8—figure supplement 1). (B) Facial movements were quantified from a simultaneously recorded video of the animal by calculating the root-mean-square of the changes in pixel intensity between consecutive frames of a rectangular area at the whisker pad. (C–D) Cells showing motion-related activity were predominently located in the caudolateral part of the dorsal IC. Broken line indicates the minimum CF position obtained from the polynomial fit. (F) The motion-related calcium transients were unlikely to be caused by sounds, as the two cells showed either an inhibitory FRA (cell 1) or no clear tone-evoked response (cell 2).
-
Figure 8—source data 1
IC Movement cells source data CSV file containing 3D coordinate of ROIs, projected distance of ROIs, genotype of animal, type of FRA and parameters related to movement-related response.
- https://doi.org/10.7554/eLife.49091.033
Figure 8—figure supplement 1
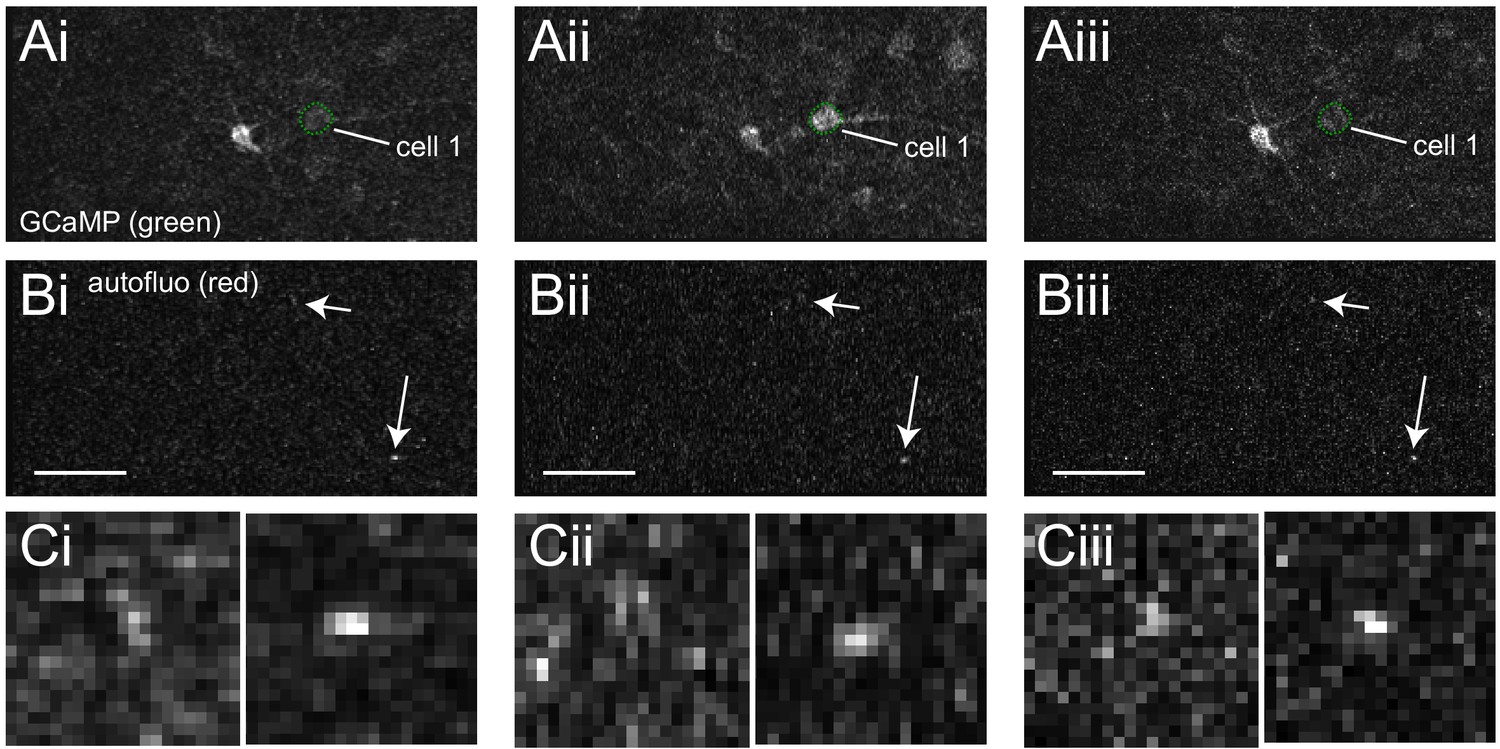
Evidence that the motion-related responses were not due to motion artefacts in imaging.
Vertical or horizontal blurring was due to subpixel image registration. (A) Single image frame for GCaMP fluorescence from experiment in Figure 8, i-iii corresponds to frames marked in Figure 8A. (B) Autofluorescence in red channel for the same frames in A. Arrows point to two autofluorescence spots, both of which remained in focus during this period. (C) Enlarged image of the two autofluorescence spots for the three frames.
Figure 9 with 7 supplements
Comparison of tonotopic organization with histological data and literature.
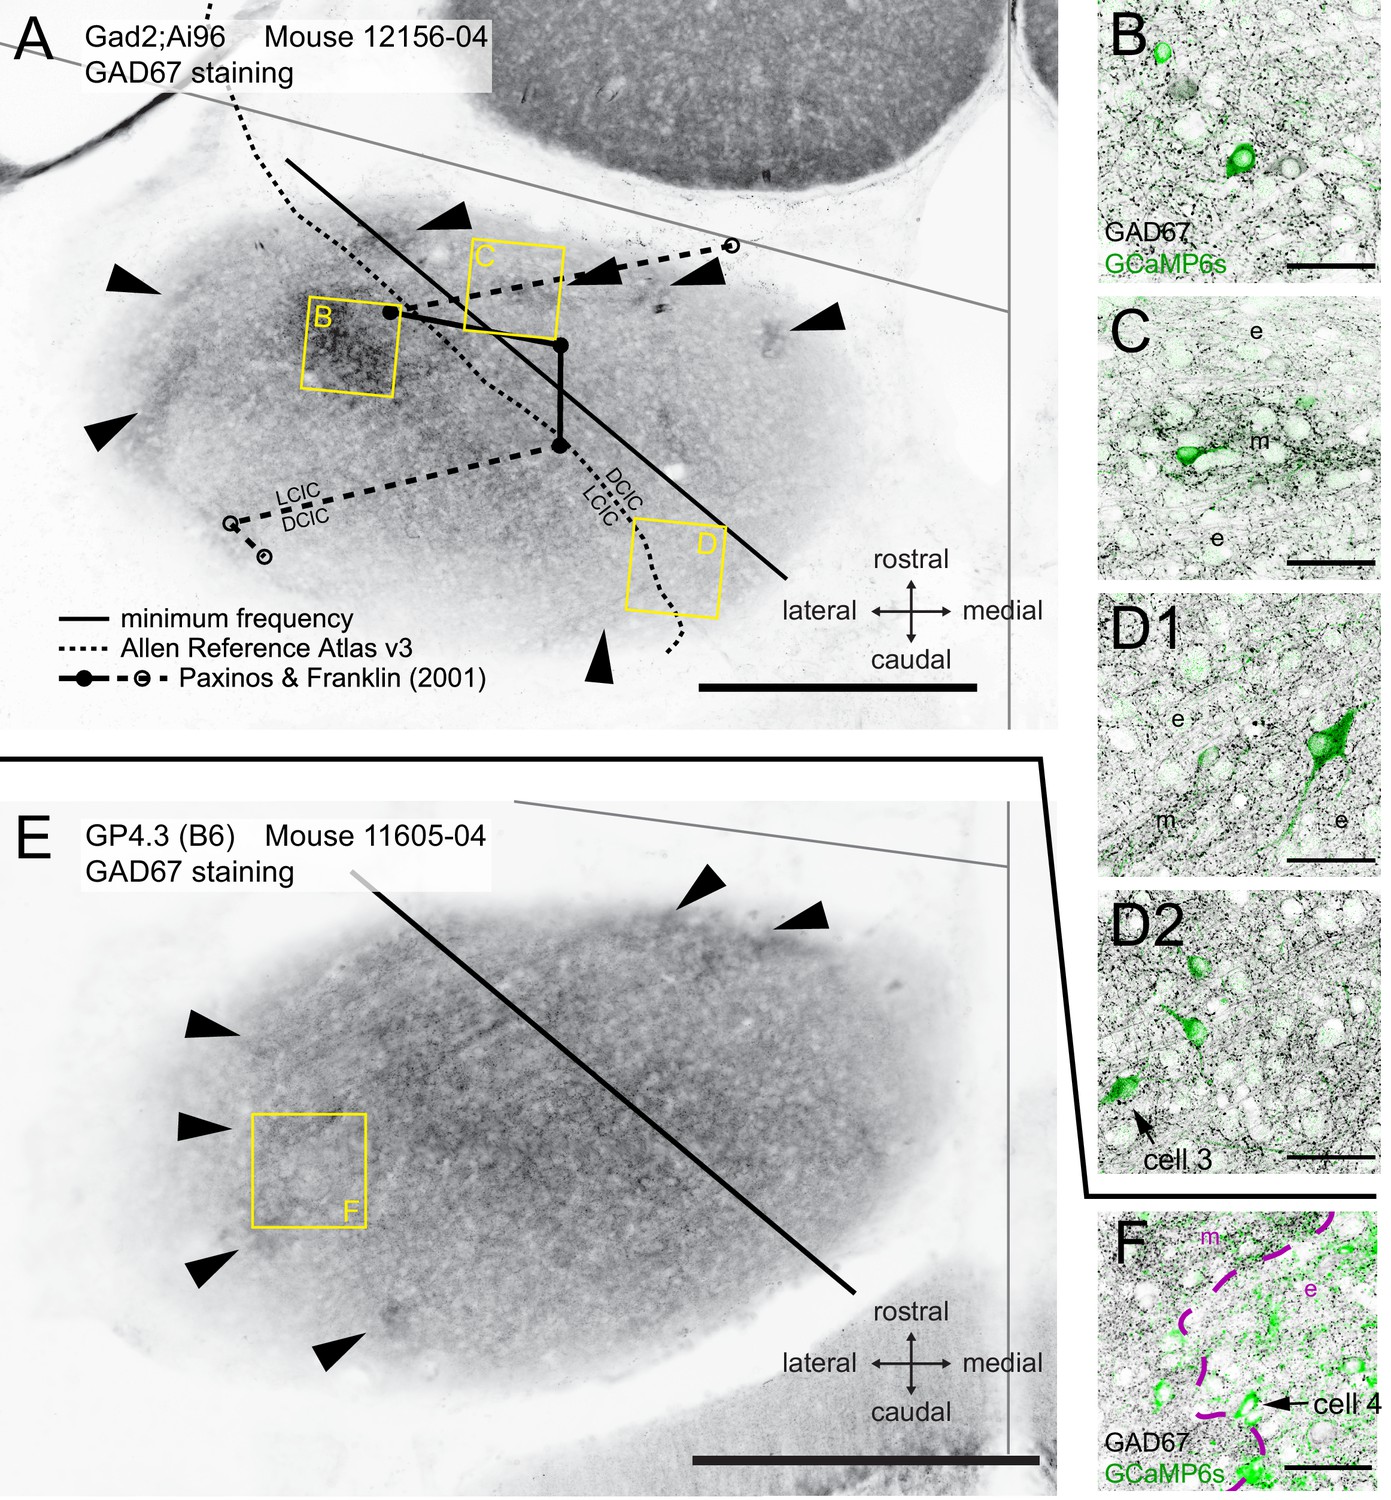
(A) Epifluorescence image of the IC in a horizontal brain section stained for GAD67. This brain slice was from a Gad2;Ai96 mouse after two-photon imaging. Black straight line indicates the minimum frequency location derived from fitting two-photon imaging data. Dashed curve represents the demarcation between the dorsal and the lateral (external) cortices traced from version 3 of the Allen Reference Atlas. Circles connected with solid and broken lines mark the demarcation at the dorsal brain surface traced from the atlas by Paxinos and Franklin (2001). The rostral and caudal end of this demarcation are marked by a dashed line because at the indicated positions on the anterior-posterior axis the whole structure was labeled as LCIC or DCIC, respectively. Modules with dense GAD67 staining, considered to be a hallmark for the LCIC, were observed both medially and laterally from each of the three demarcations (arrowheads). We observed a region in the center of the IC whose GAD67 staining density was at least as strong as in the neurochemical modules (square labeled B). (B–D) Single confocal optical sections of GAD67 (black) and GCaMP6s (green) staining in different areas of the brain slice corresponding to the yellow squares in A. (B) Dense GAD67 area in the central region of the IC (<80 µm from dorsal surface). (C) An area showing a GAD67-dense module (m) in the center, cut transversely and surrounded by extramodular region (e) with sparse GAD67 staining. (D1-2) Optical sections at different focal depths of an area showing another GAD67 module from the same slice (m), cut tangentially. Arrow in D2 indicates a cell showing motion-related responses. (E) Similar to A but from an imaged GP4.3 mouse. (F) Single confocal section for GCaMP6s (green) and GAD67 (black) staining in region marked in E. Arrow marks another cell with motion-related response. Scale bars, A,E: 500 μm; B-D,F: 50 μm.
Figure 9—figure supplement 1
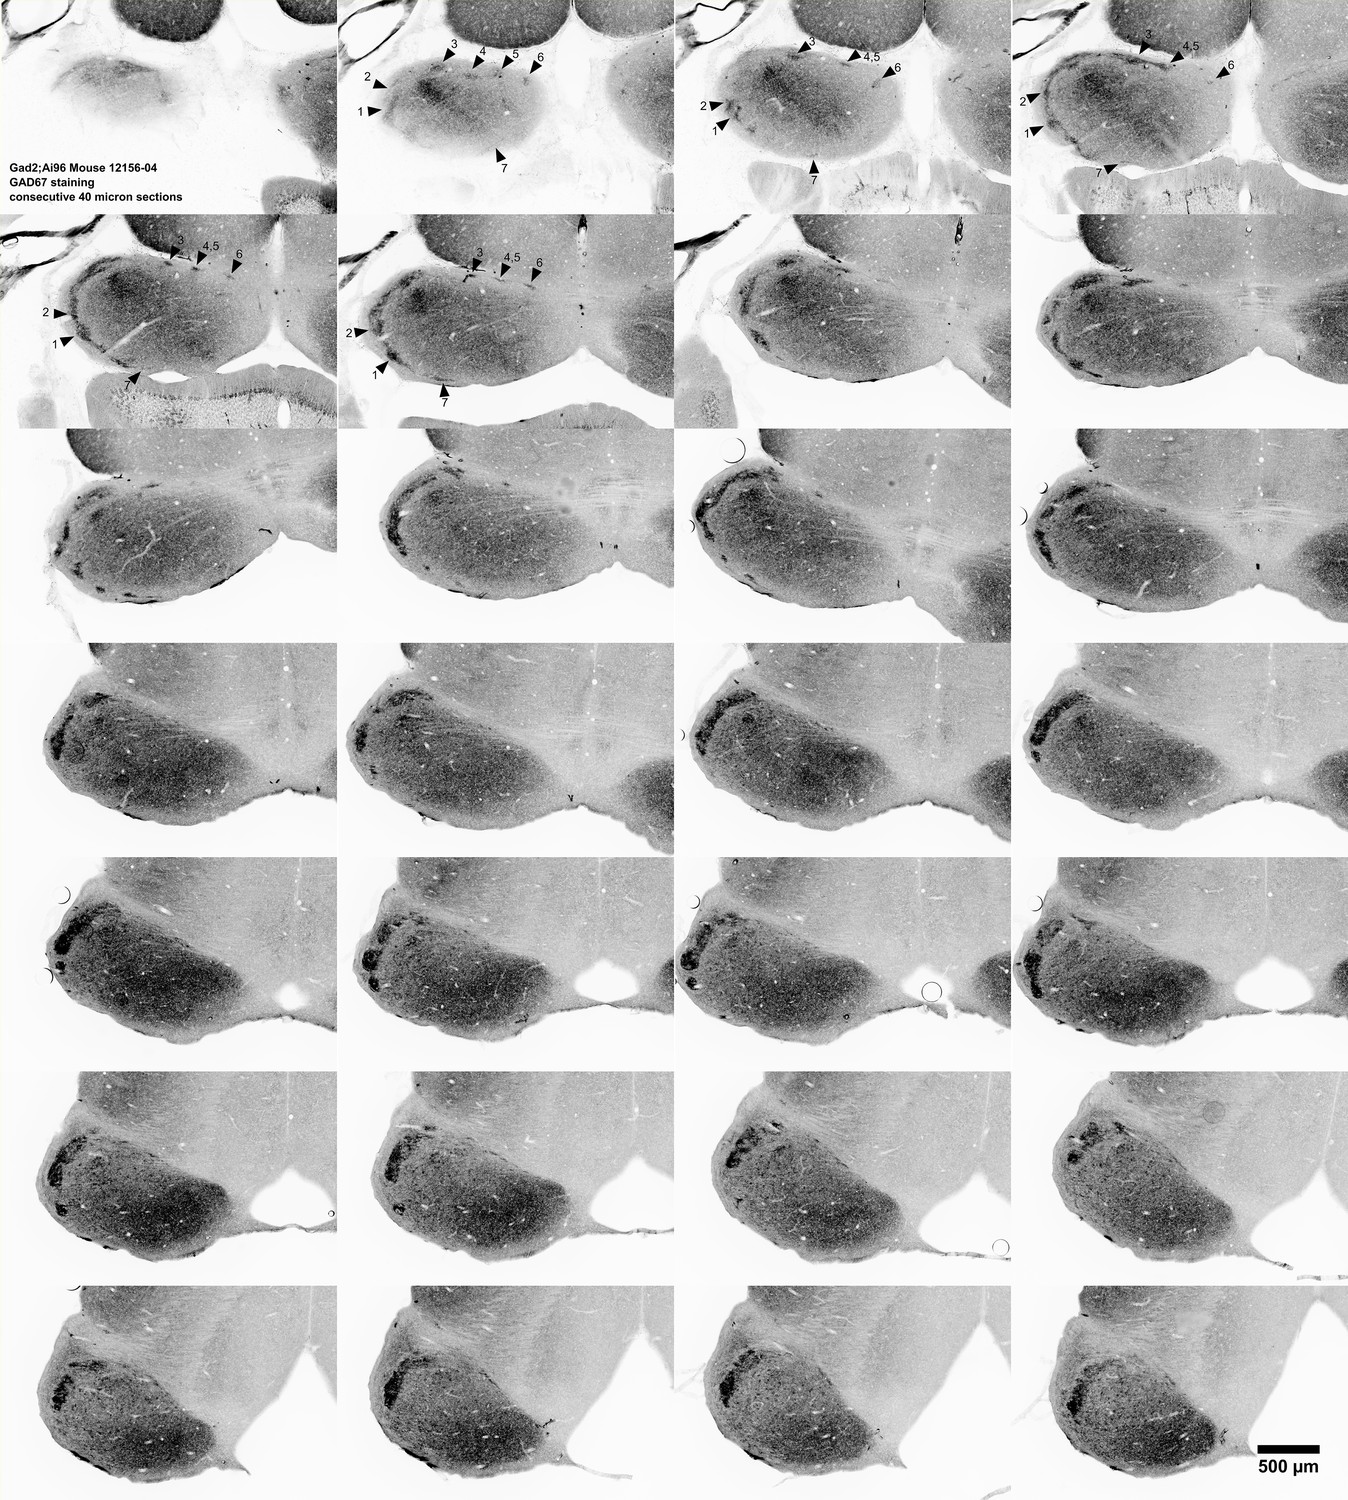
GAD67 staining in the IC of a series of consecutive 40 μm horizontal brain slices from the same Gad2;Ai96 animal as in Figure 9A (animal: 12156–04), displayed from dorsal (top-left) to ventral (right-bottom) showing that the fainter GAD67 staining highlighted in Figure 9A is contiguous with the well-stained neurochemical modules in more ventral slices (arrowheads and numbers).
Same sections as supplements 2 & 3.
Figure 9—figure supplement 2
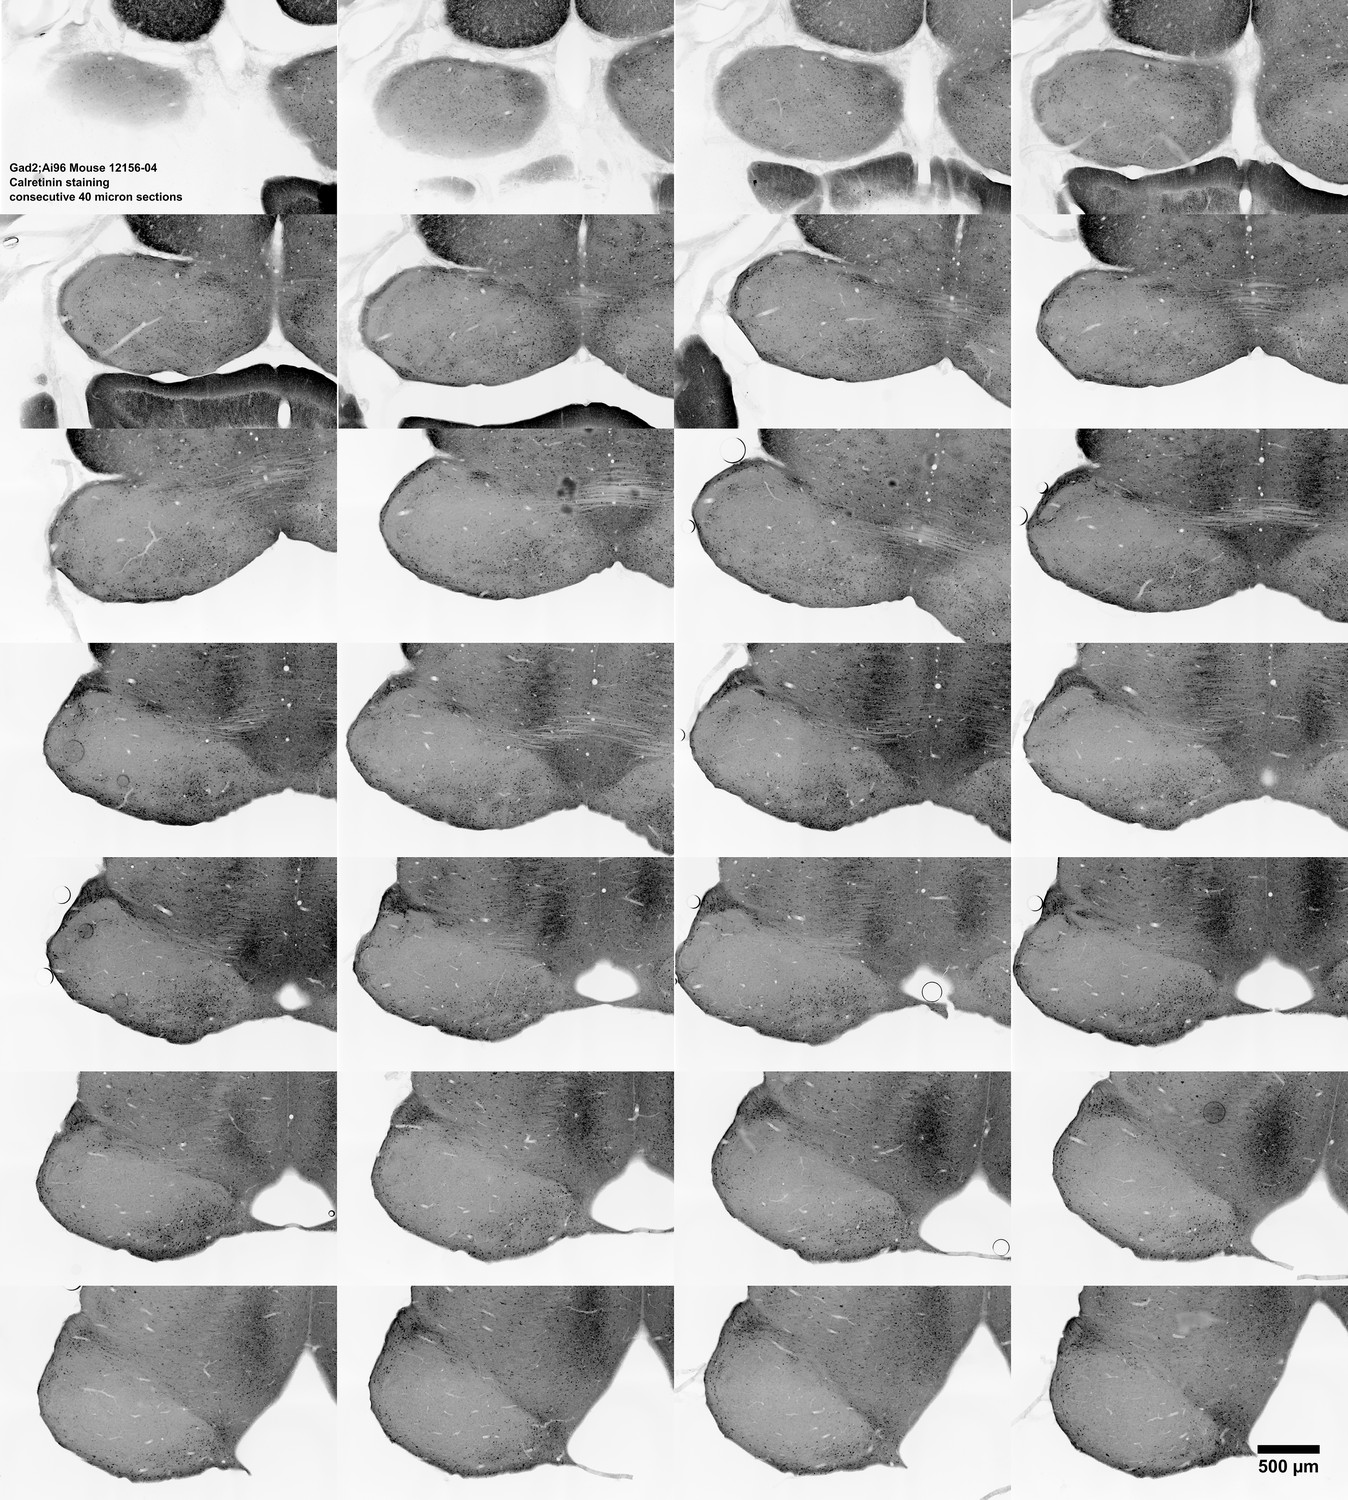
Calretinin staining in the IC of a series of consecutive 40 μm horizontal brain slices from the same Gad2;Ai96 animal as in Figure 9A (animal: 12156–04), displayed from dorsal to ventral (left to right, top to bottom).
Same sections as supplements 1 and 3.
Figure 9—figure supplement 3
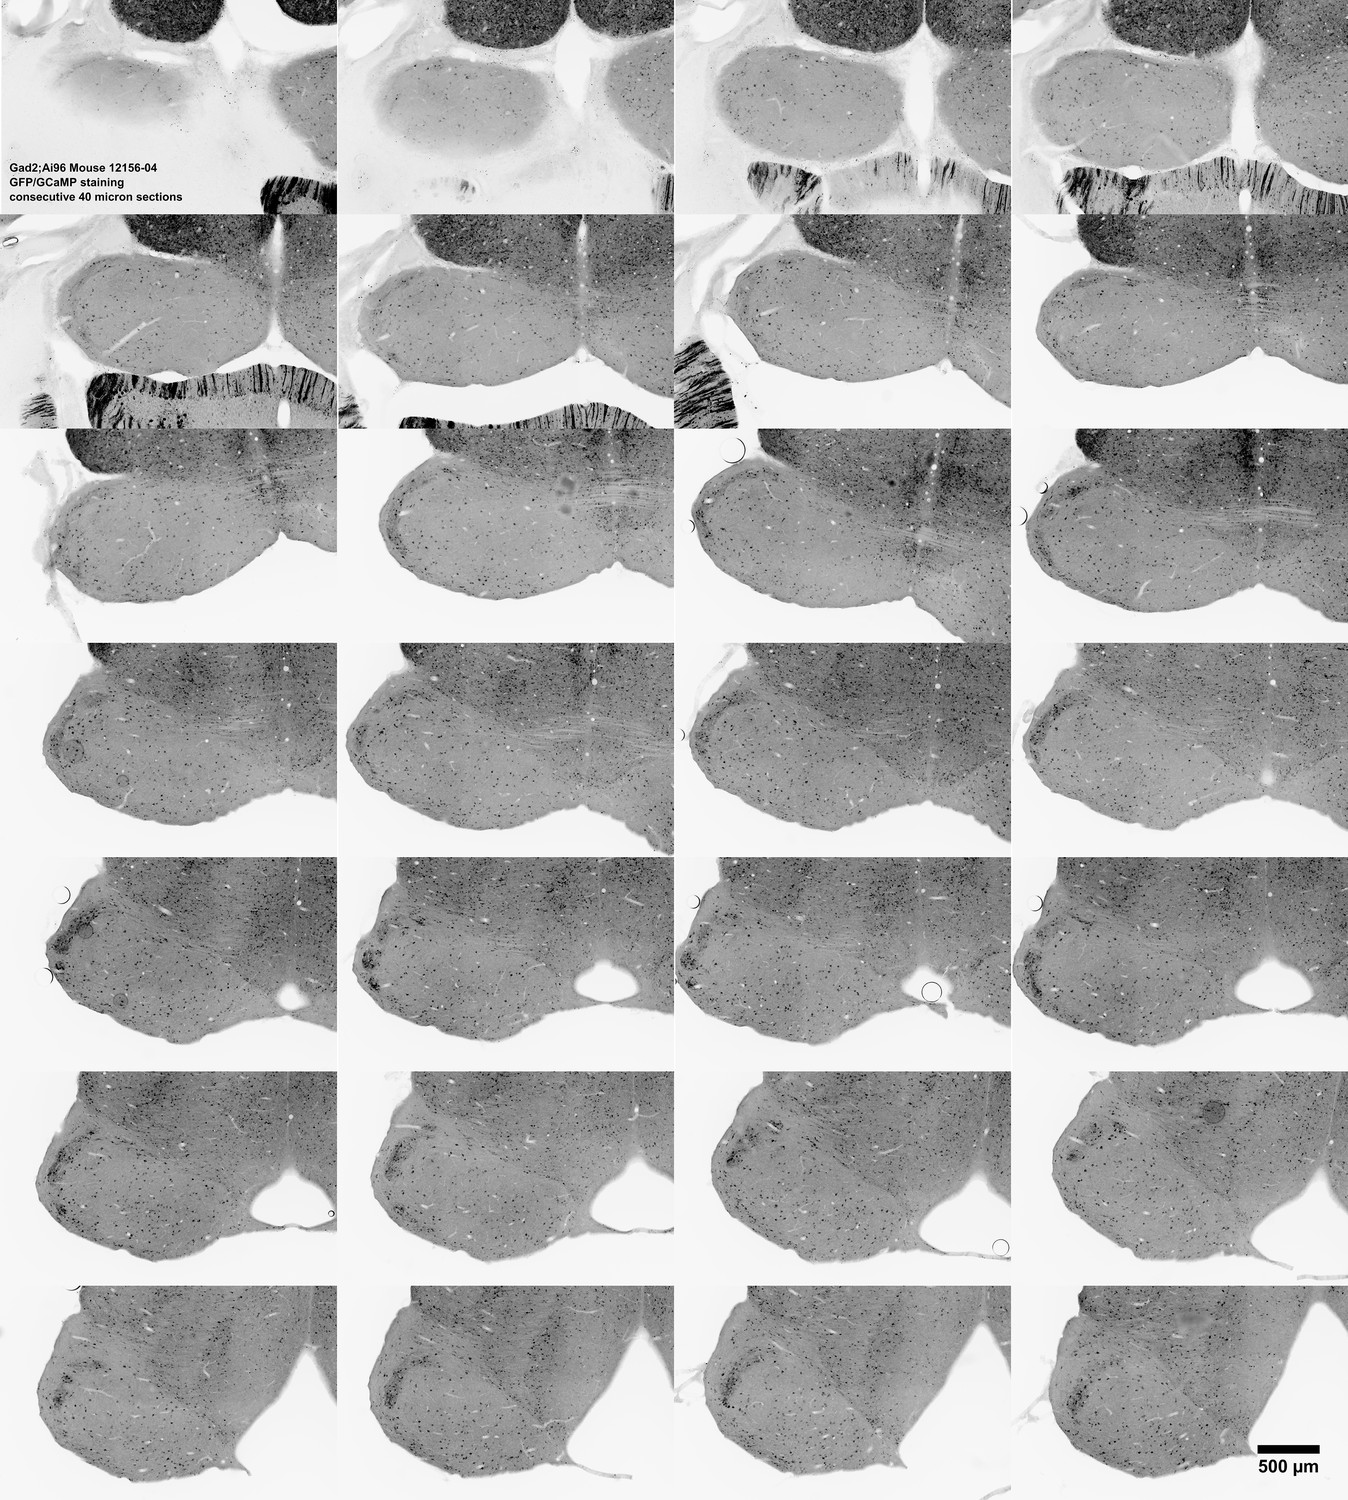
GFP staining of GCaMP6s in the IC for a series of consecutive 40 μm horizontal brain slices from the same Gad2;Ai96 animal as in Figure 9A (animal: 12156–04), displayed from dorsal to ventral (left to right, top to bottom).
Same sections as supplements 1 and 2.
Figure 9—figure supplement 4
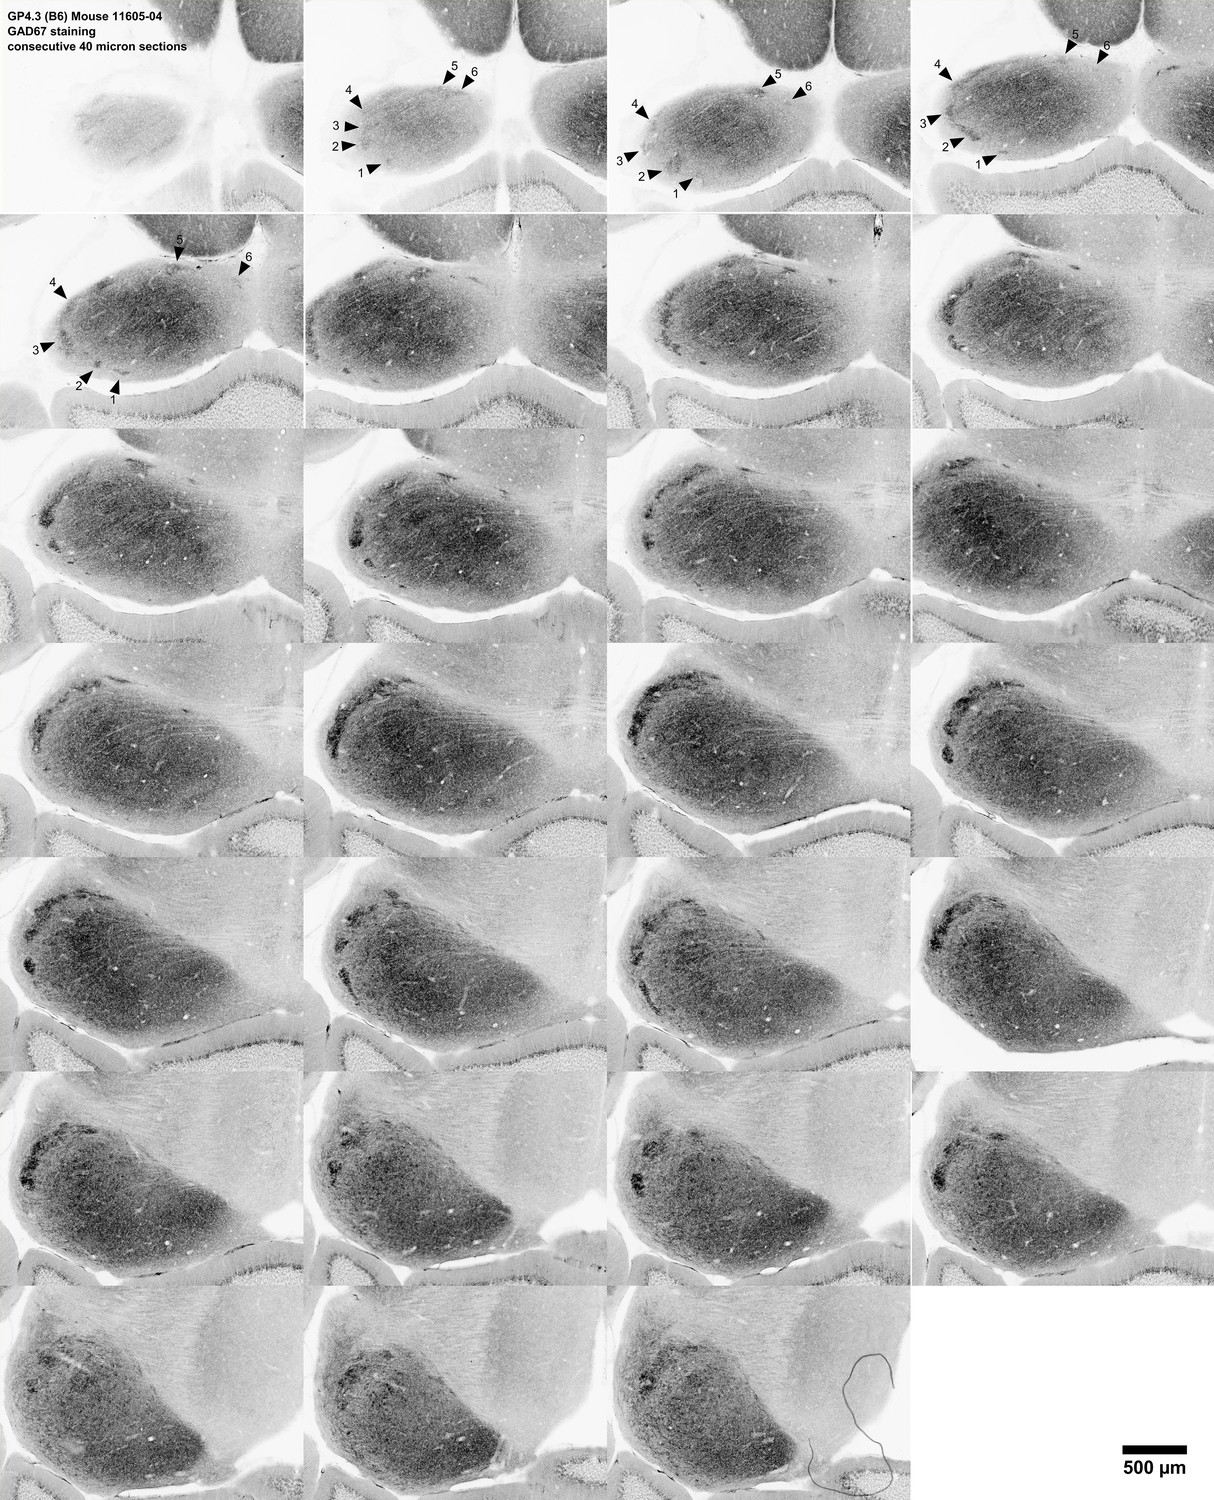
GAD67 staining in the IC of a series of consecutive 40 μm horizontal brain slices from the same GP4.3 animal as in Figure 9E (animal: 11605–04; C57BL/6J background), displayed from dorsal (top-left) to ventral (right-bottom), showing that the fainter GAD67 staining highlighted in Figure 9E is contiguous with the well-stained neurochemical modules in more ventral slices (arrowheads and numbers).
Same sections as supplements 5 and 6. Figure 9—figure supplement 5.
Figure 9—figure supplement 5
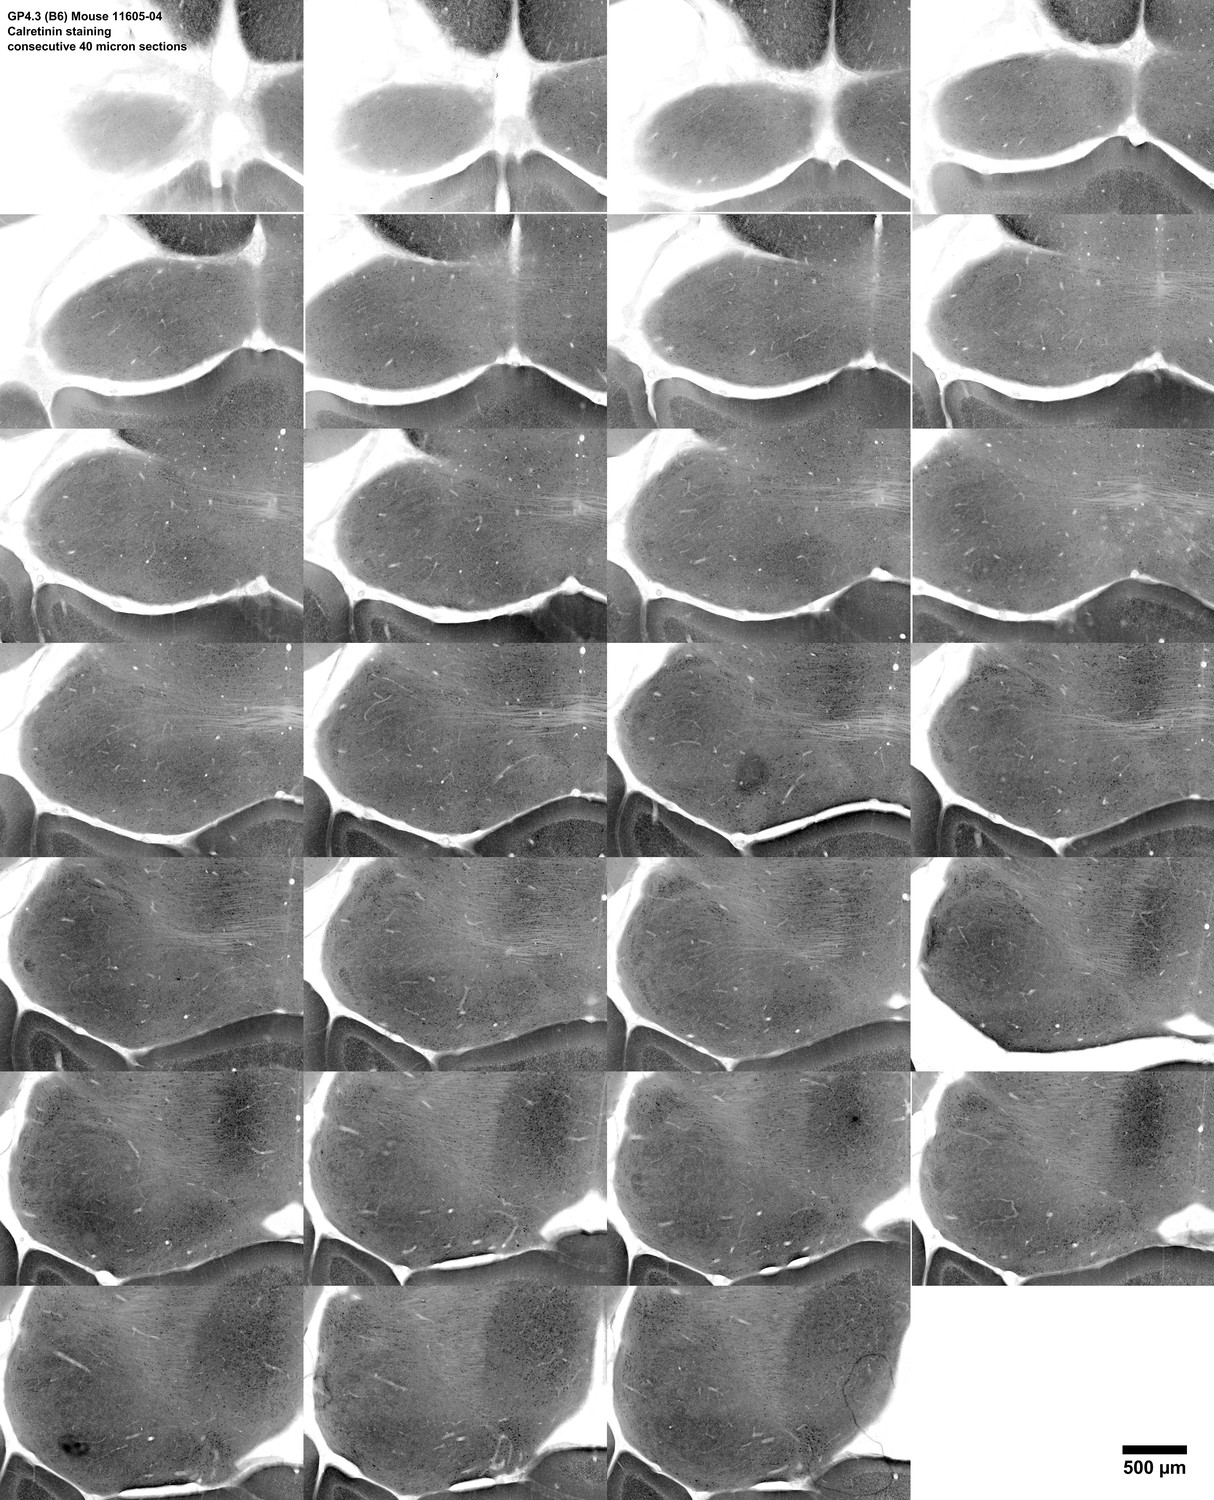
Calretinin staining in the IC of a series of consecutive 40 μm horizontal brain slices from the same GP4.3 animal as in Figure 9E (animal: 11605–04; C57BL/6J background), displayed from dorsal to ventral (left to right, top to bottom).
Same sections as supplements 4 and 6.
Figure 9—figure supplement 6
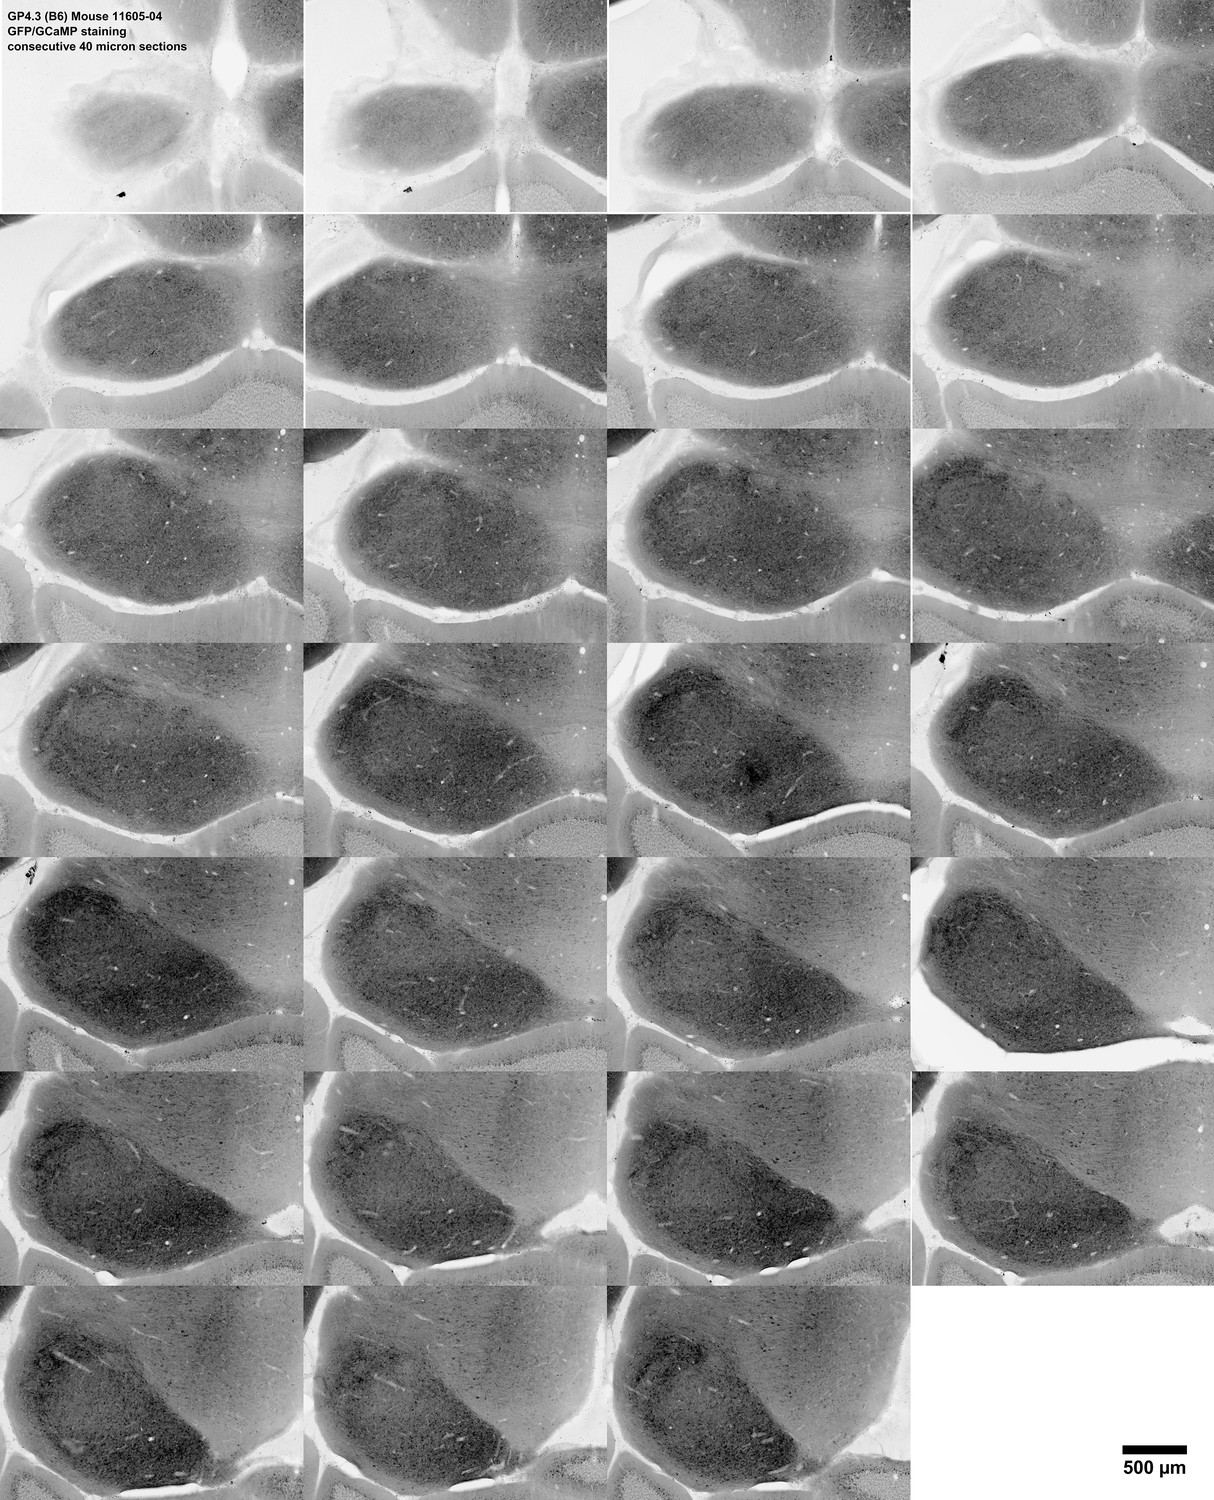
GFP staining of GCaMP6s in the inferior colliculus for the series of consecutive 40 μm horizontal brain slices from the same GP4.3 animal as in Figure 9E (animal: 11605–04; C57BL/6J background), displayed from dorsal to ventral (left to right, top to bottom).
Same sections as supplements 4 and 5.
Figure 9—video 1
Video showing the 3D reconstruction of the most dorsal aspect of the left and right inferior colliculi in animal 12156–04 from 40 μm serial sections.
GAD67-dense modules are marked in both ICs. The same sections used for reconstruction are shown in Figure 9A and Figure 9—figure supplements 1–3.
Figure 10
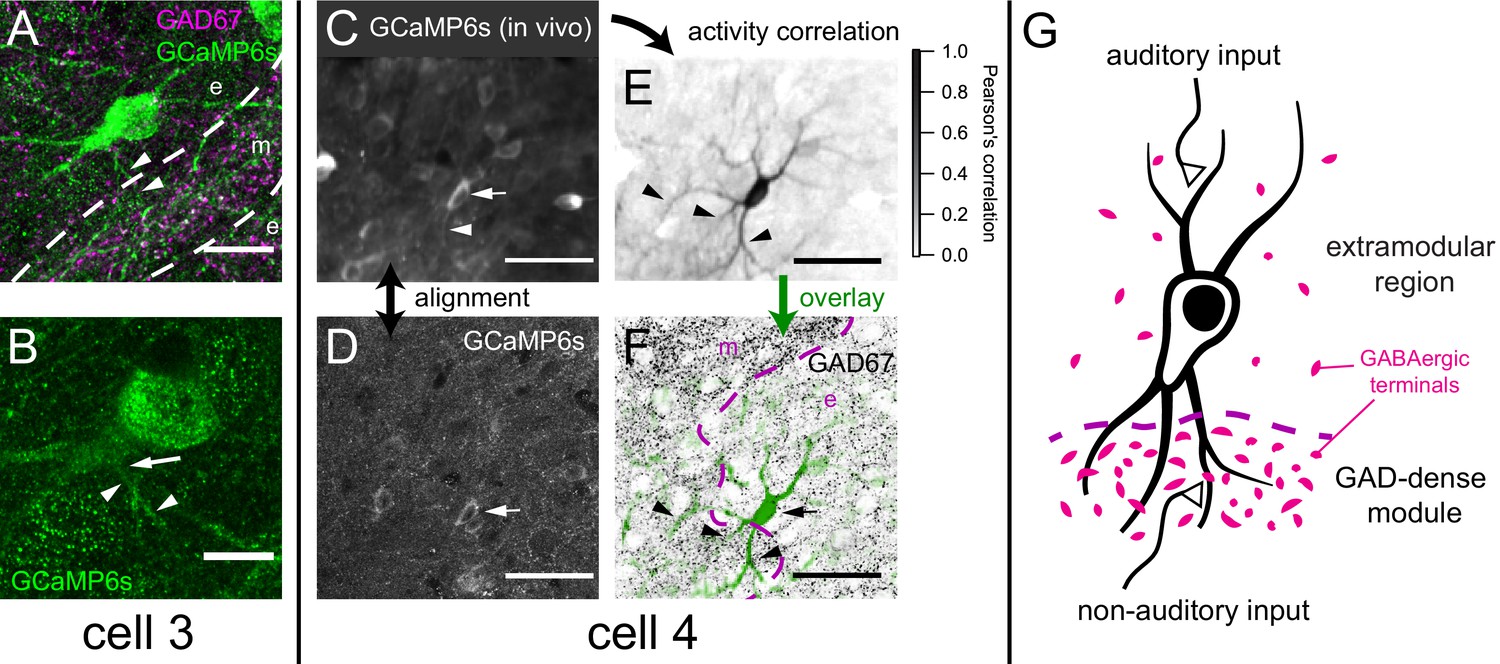
Example motion-sensitive cells with dendritic arbor extending into GAD67-dense modules.
(A) Maximum projection of GCaMP staining showing dendritic arbor of cell three in Figure 9D2, overlaid with a single optical section of GAD67 staining showing a module (m; at same focus as Figure 9D2). While its soma is extramodular (e), at least one branch of its dendrite (arrowheads) appeared to extend into the modular region. (B) A single confocal section of cell three showing the root (arrow) of the dendrite labeled in A (small arrowheads). (C) Averaged GCaMP6s fluorescence for the in vivo session imaging area in Figure 9F, revealing a dendrite of cell four extending into the modular region. (D) Single confocal section of a fixed brain slice stained for GCaMP6s. (E) Dendritic arbor of cell four was revealed using pixel-wise correlation to the average somatic fluorescence (Junek et al., 2009), showing extension into the modular region (arrowheads). (F) Background subtracted pixel correlation from E (green) overlaid onto GAD67 staining (black). (G) Schematic representation of hypothesis that integration of auditory and non-auditory inputs by multisensory neurons in the IC can be based on extension of their dendrites into both modular and extramodular regions. Scale bars: A: 20 μm; B: 10 μm; C-F: 50 μm.
Author response image 1
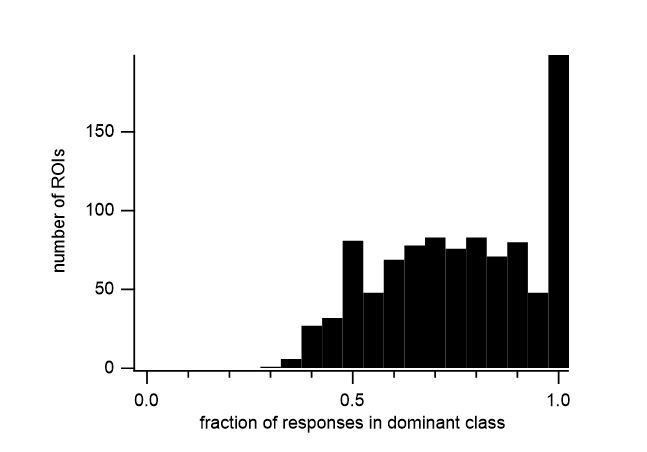
Histogram of the fraction of significant responses showing the largest response class (dominant class) in the FRA of all responsive ROIs.
Author response image 2

Defining medial and lateral subregions for analysis.
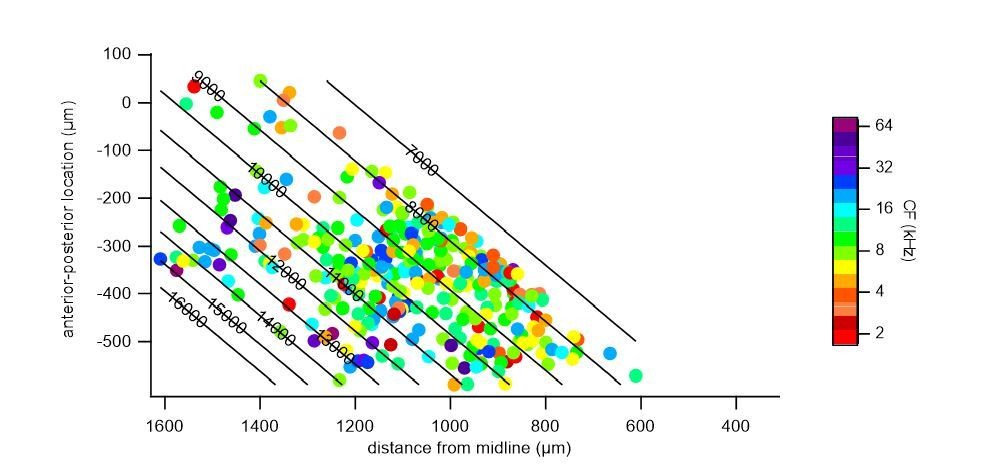
Author response image 3
Polynomial fit to characteristic frequencies of medial cells.
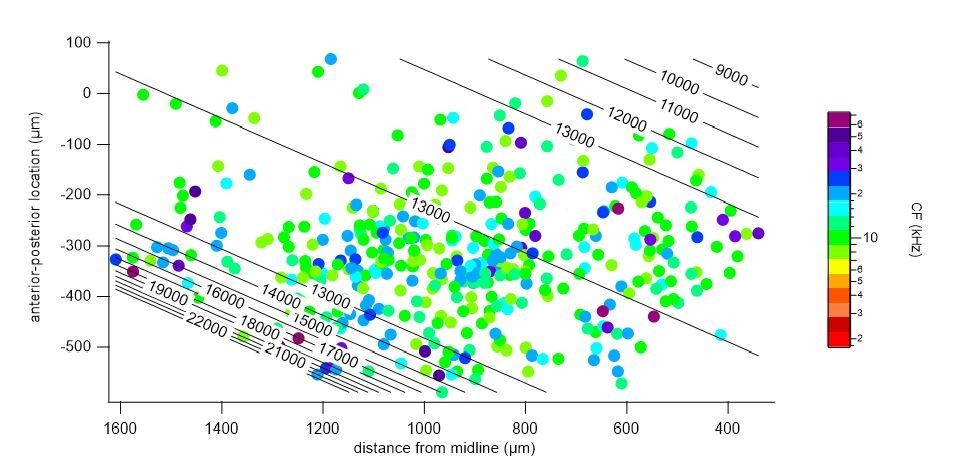
Author response image 4
Polynomial fit to characteristic frequencies of lateral cells.
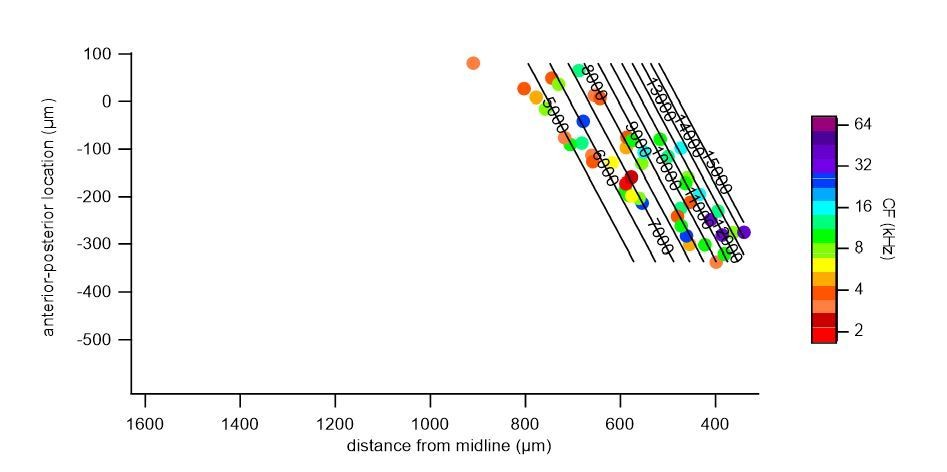
Author response image 5
Polynomial fit to characteristic frequencies (CF) of cells with >= 8 kHz CF.
Author response image 6
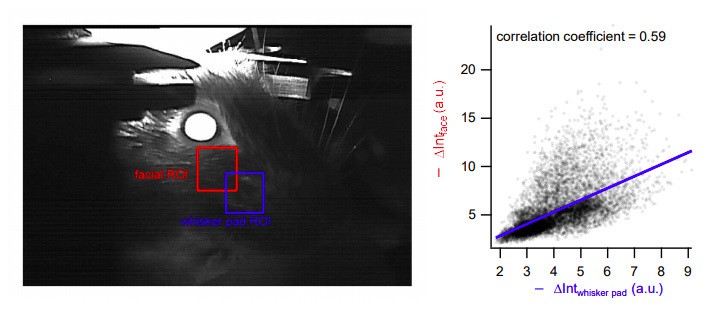
Highly correlated movement in facial and whisker pad areas.
Left, two different analysis regions-of-interest (ROIs). Right: Changes in intensity at the facial ROI (Y-axis, as analyzed in the manuscript) is highly correlated with that in the whisker pad region (X-axis). Blue: regression line.
Tables
Key resources table
| Reagent type (species) or resource | Designation | Source or reference | Identifiers | Additional information |
|---|---|---|---|---|
| Genetic reagent (Mus musculus) | B6;129S6-Gt(ROSA)26Sortm96(CAG-GCaMP6s)Hze/J | The Jackson Laboratory; originally reported in Madisen et al. (2015) | IMSR Cat# JAX:024106, RRID:IMSR_JAX:024106 | Designated as ‘Ai96’ in this manuscript. Maintained in heterozygous state by backcrossing to C57BL/6J. |
| Genetic reagent (Mus musculus) | STOCK Gad2tm2(cre)Zjh/J | The Jackson Laboratory; originally reported in Taniguchi et al. (2011) | IMSR Cat# JAX:010802, RRID:IMSR_JAX:010802 | Designated as ‘Gad2-IRES-Cre’ in this manuscript. Maintained in homozygous state after > 10 generations of backcrossing to C57BL/6J, and re-backcrossed to C57BL/6J every 4–5 generations. |
| Genetic reagent (Mus musculus) | C57BL/6J-Tg(Thy1-GCaMP6s)GP4.3Dkim/J | The Jackson Laboratory; originally reported in Dana et al. (2014) | IMSR Cat# JAX:024275, RRID:IMSR_JAX:024275 | Designated as ‘GP4.3’ in this manuscript. Maintained in heterozygous state by backcrossing to C57BL/6J, or crossed with CBA/JRj to obtain mice with B6CBAF1/J background. |
| Strain, strain background (Mus musculus) | JAX C57BL/6J | Charles Rivers Laboratories | IMSR Cat# JAX:000664, RRID:IMSR_JAX:000664 | |
| Strain, strain background (Mus musculus) | CBA/JRj | Janvier Labs | MGI Cat# 6157506, RRID:MGI:6157506 | |
| antibody | chicken anti-GFP (Chicken polyclonal) | Aves | Aves Labs Cat# GFP-1020, RRID:AB_10000240 | IF(1:1000) |
| Antibody | mouse anti-Gad67 (Mouse monoclonal) | Millipore | Millipore Cat# MAB5406, RRID:AB_2278725 | IF(1:1000) |
| Antibody | rabbit anti-NeuN (Rabbit polyclonal) | Millipore | Millipore Cat# ABN78, RRID:AB_10807945 | IF(1:1000) |
| Antibody | mouse anti-parvalbumin (Mouse monoclonal) | Swant | Swant Cat# 235, RRID:AB_10000343 | IF(1:7000) |
| Antibody | rabbit anti-calretinin (Rabbit polyclonal) | Swant | Swant Cat# 7699/4, RRID:AB_2313763 | IF(1:5000) |
| Antibody | Alexa Fluor 488-conjugated Donkey anti-chicken antibody (Donkey polyclonal) | Jackson ImmunoResearch Labs | Cat# 703-545-155, RRID:AB_2340375 | IF(1:200) |
| Antibody | Alexa Fluor 594-conjugated Donkey anti-mouse antibody (Donkey polyclonal) | Jackson ImmunoResearch Labs | Cat# 715-585-150, RRID:AB_2340854 | IF(1:200) |
| Antibody | Alexa Fluor 647-conjugated Donkey anti-rabbit antibody (Donkey polyclonal) | Jackson ImmunoResearch Labs | Cat# 711-605-152, RRID:AB_2492288 | IF(1:200) |
| Software, algorithm | IGOR Pro | Wavemetrics | RRID:SCR_000325 | Analysis of calcium imaging and electrophysiology data |
| Software, algorithm | pClamp | Molecular Devices | RRID:SCR_011323 | Signal digitization. software, algorithm |
| MATLAB | MathWorks | RRID:SCR_001622 | Stimulus generation and presentation | |
| Software, algorithm | LabView | National Instruments | RRID:SCR_014325 | Control of microscope and other hardware |
| Software, algorithm | Fiji | http://fiji.sc | RRID:SCR_002285 | Processing and analysis of images from immunohistochemistry |
Additional files
-
Transparent reporting form
- https://doi.org/10.7554/eLife.49091.044
Download links
A two-part list of links to download the article, or parts of the article, in various formats.
Downloads (link to download the article as PDF)
Open citations (links to open the citations from this article in various online reference manager services)
Cite this article (links to download the citations from this article in formats compatible with various reference manager tools)
Tonotopic and non-auditory organization of the mouse dorsal inferior colliculus revealed by two-photon imaging
eLife 8:e49091.
https://doi.org/10.7554/eLife.49091


