Computational and cellular studies reveal structural destabilization and degradation of MLH1 variants in Lynch syndrome
- University of Copenhagen, Denmark
- Aalborg University Hospital, Denmark
- Rigshospitalet, Denmark
- Tohoku University Hospital, Tohoku University, Japan
Figures
Figure 1
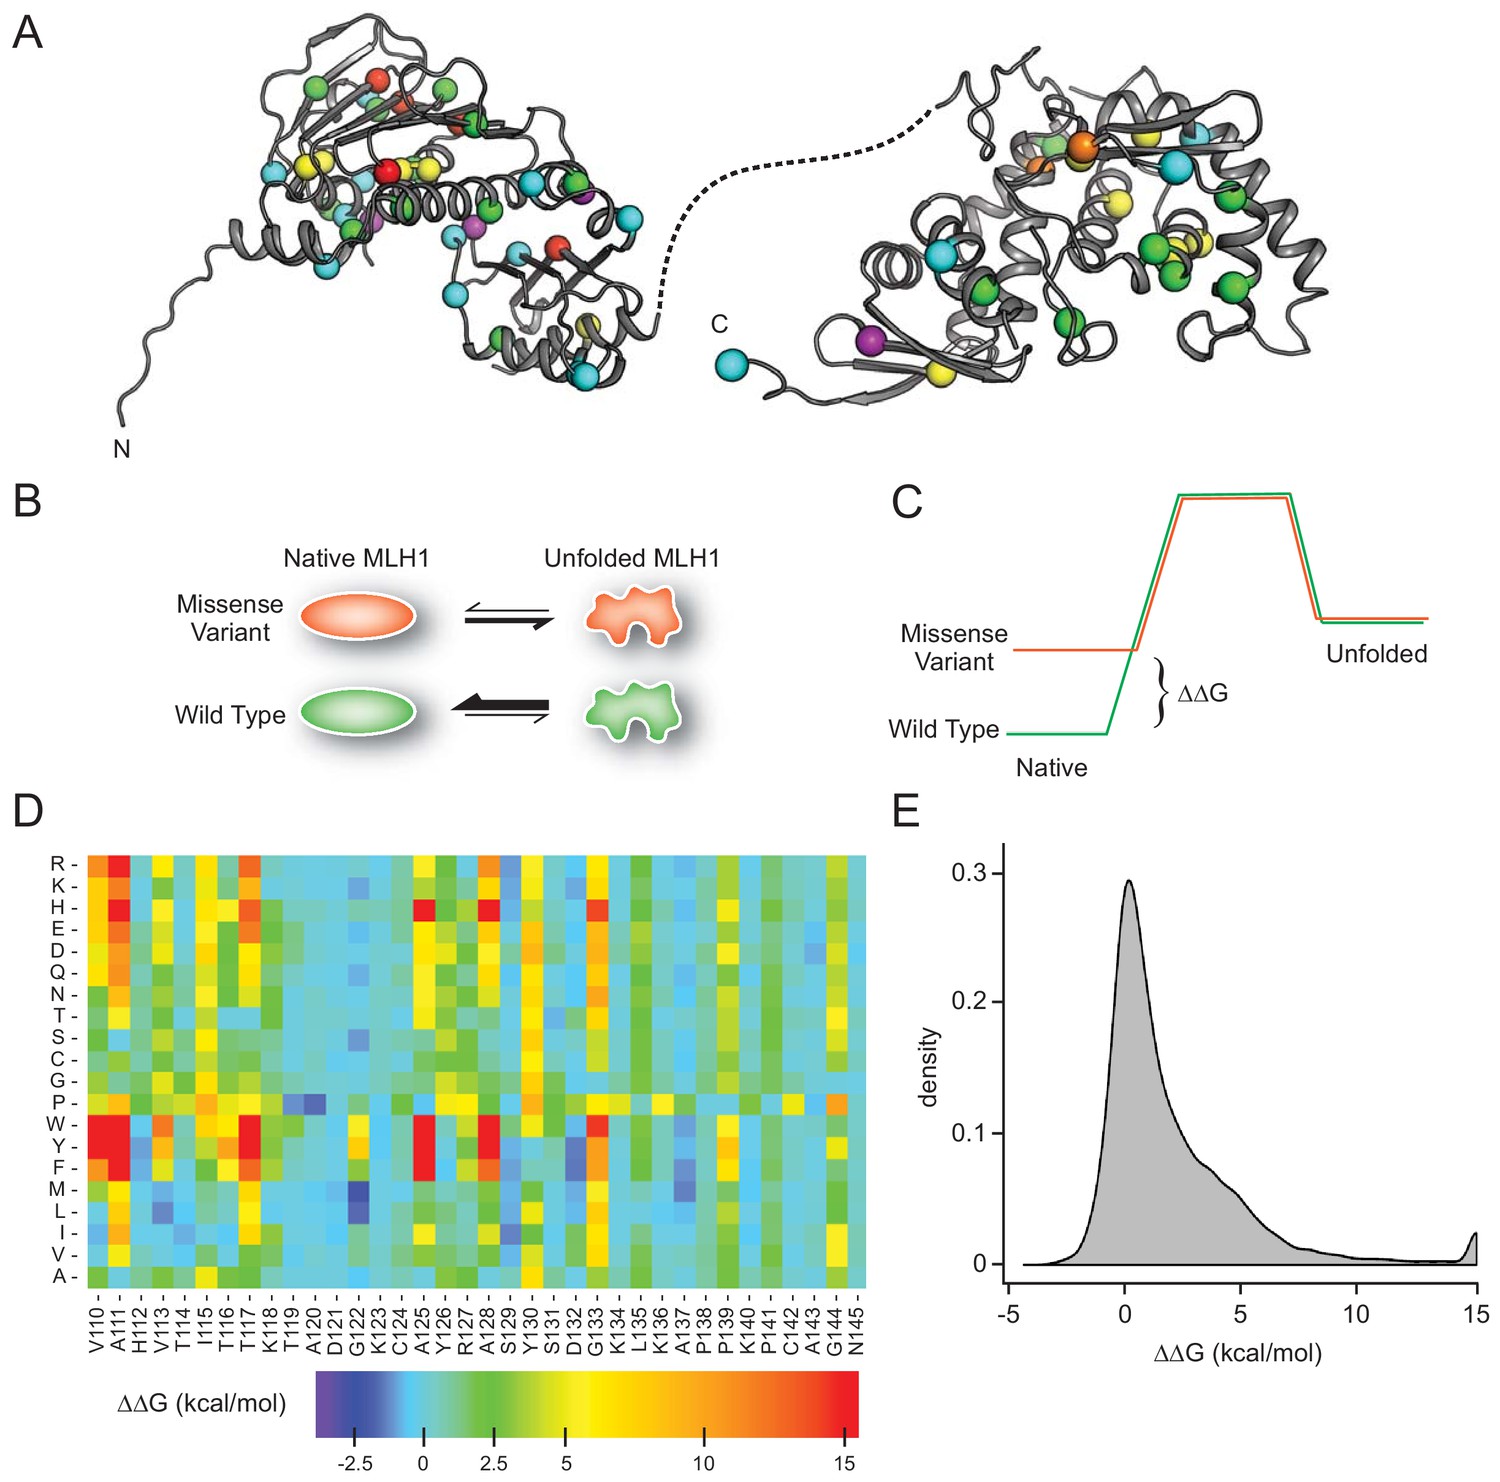
MLH1 structural stability predictions.
(A) Structure of MLH1 (PDB IDs 4P7A and 3RBN). Positions of variants tested in this work are highlighted with colored spheres, indicating the predicted ΔΔG (<0.5 kcal/mol, purple,<1, cyan,<3.5 green,<7, yellow,<12, orange,>12, red). (B) Many disease-linked MLH1 missense variants (red) are structurally destabilized and therefore, compared to wild-type MLH1 (green), more likely to unfold. (C) The free energy of the folded conformation of a destabilized missense variant (red) is closer to that of the fully unfolded state. The employed stability calculations predict the difference of the free energy of unfolding (ΔΔG) between a missense variant (red) and wild-type MLH1 (green). (D) Excerpt of the in silico saturation mutagenesis map (full dataset provided in Supplementary file 1). (E) Distribution of all predicted ΔΔGs from saturation mutagenesis. The peak at 15 kcal/mol contains all variants with ΔΔG values greater than this value.
Figure 2 with 2 supplements

Steady-state levels of MLH1 variants correlate with structural stability predictions.
(A) Example of the immunofluorescence imaging of HCT116 cells using antibodies to MLH1. Hoechst staining was used to mark the nucleus. Note the reduced steady-state levels of the G67R MLH1 variant compared to wild-type MLH1. (B) The total fluorescent intensity for each of the 69 different MLH1 variants was determined after excluding the non-transfected cells and normalizing the intensities to that for wild-type MLH1. The intensities were then plotted vs. the predicted ΔΔG values. Between 200 and 1,000 cells were included for each quantification. The error bars indicate the standard error of the mean (n = 5 experiments). Each variant is color-coded according to the ClinVar disease category. (C) Distribution of steady-state levels by DME category – 0 is loss-of-function in all assays by Takahashi et al. (2007), 3 represents function in all these assays (for details see the Materials and Methods). Raincloud plot visualization as described in Allen et al. (2018). Colored surface, smoothed density estimate. Gray dots represent means within each DME category, with bars for standard error. (D) Distribution of FoldX ΔΔGs across DME categories (as in (C)). (E) FoldX ΔΔGs for all variants tested in this work, indicating their position in the MLH1 sequence. As elsewhere, values above 15 kcal/mol were here set to this value.
Figure 2—figure supplement 1

Solubility of wild-type MLH1 at a range of temperatures.
(A) Transfected cells were lysed by sonication and incubated for 30 min. at the indicated temperatures. Then the lysates were separated into supernatant and pellet fractions by centrifugation. Western blotting using antibodies to MLH1 was employed to determine the amount of MLH1 in the fractions. Ponceau S staining and blotting with antibodies to GAPDH served as controls. (B) Quantification of blots as shown in panel (A) showing the amount of soluble protein (supernatant) normalized to total (supernatant + pellet). The total protein quantification is based on the full lanes of the Ponceau S stainings. The error bars indicate the standard deviation (n = 3).
Figure 2—figure supplement 2

Variants within the central disordered region.
(A) ClinVar benign and likely benign variants (blue) are found throughout the protein, while pathogenic and likely pathogenic variants (red) are enriched in the structured domains. (B) The variants previously tested for function (Takahashi et al., 2007) are distributed throughout the MLH1 protein. Similar to the observations from ClinVar, functional variants (DME score 3) are seen throughout the protein, while loss-of-function in multiple assays (DME scores.
Figure 3 with 1 supplement
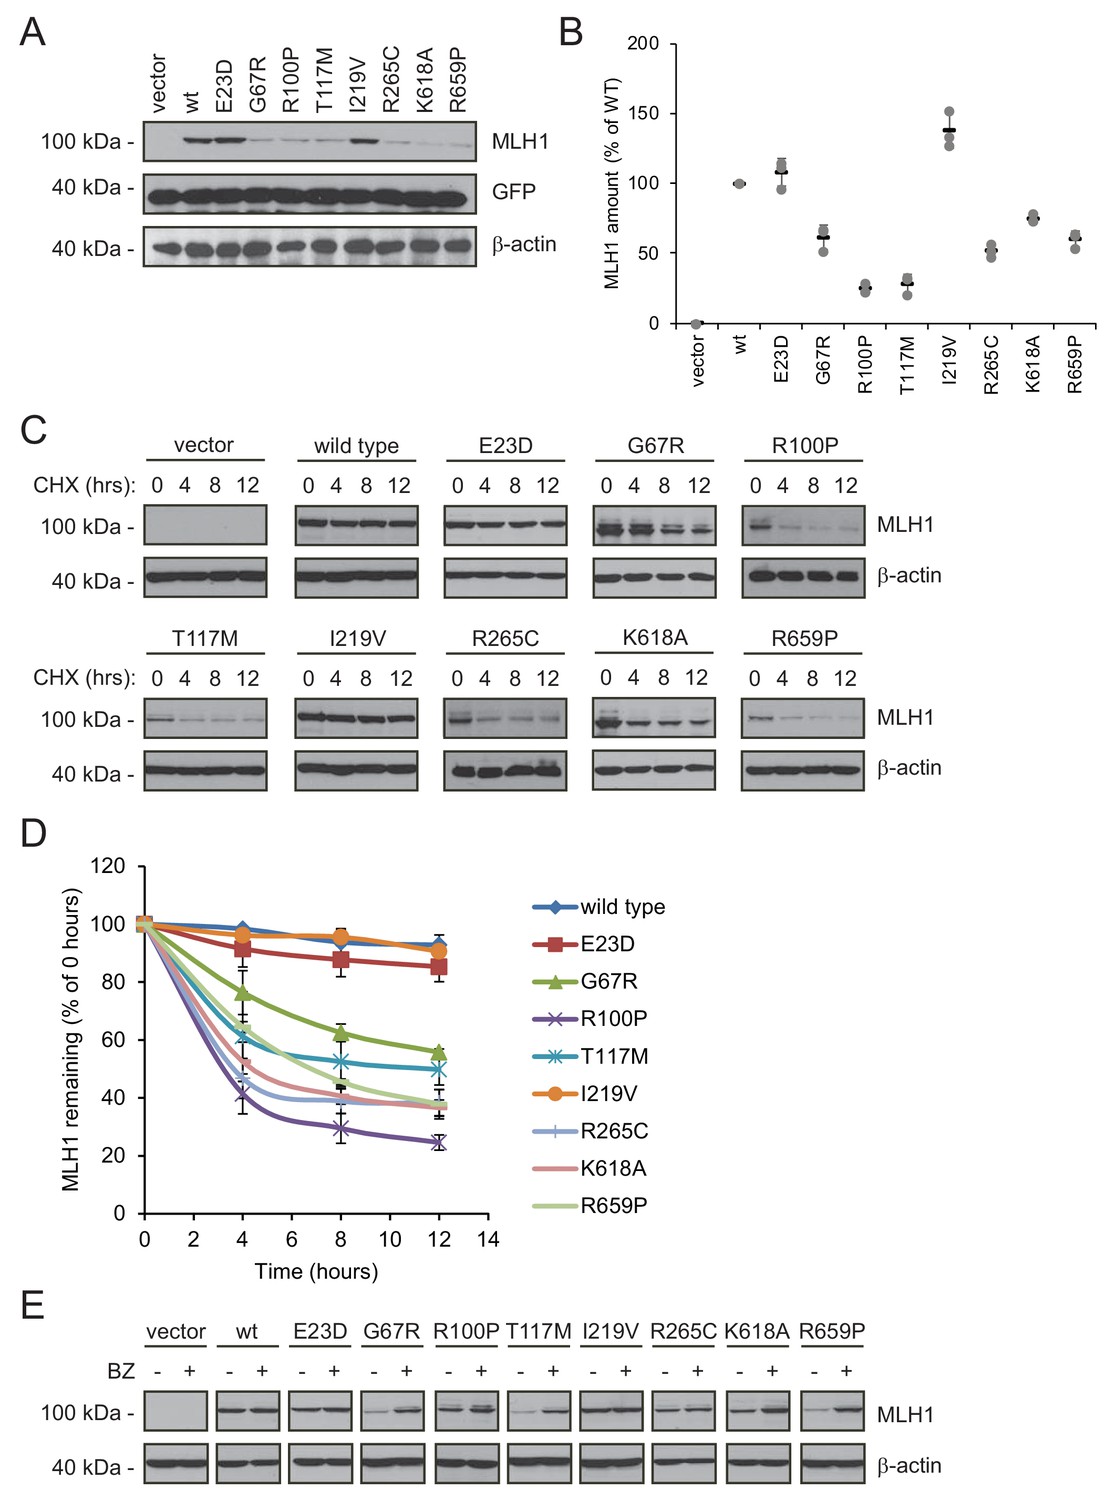
Many MLH1 variants are degraded by the proteasome.
(A) HCT116 cells transfected with the indicated variants were analyzed by blotting with antibodies to MLH1. Co-transfection with a plasmid expressing GFP was included to test the transfection efficiencies between the MLH1 variants. β-actin served as a loading control. (B) Quantification of blots as in (A) normalized to the steady-state level of wild-type (WT) MLH1. The error bars show the standard deviation (n = 3). (C) MLH1-transfected HCT116 cells were treated with 25 µg/mL cycloheximide (CHX) for 0, 4, 8 or 12 hr, and lysates were analyzed by blotting using antibodies to MLH1. β-actin was used as a loading control. (D) Quantification of blots as in panel (C), normalized to the steady-state levels at t = 0 hr. The error bars indicate the standard deviation (n = 3). (E) Western blotting with antibodies to MLH1 of whole cell lysates from transfected cells either untreated or treated for 16 hr with 10 µM bortezomib (BZ). Blotting for β-actin was included as a loading control.
Figure 3—figure supplement 1

Solubility of selected MLH1 variants.
Transfected cells, either untreated (-) or treated for 16 hr with 10 μM bortezomib (+BZ) were lysed by sonication and immediately separated into supernatant (S) and pellet (P) fractions by centrifugation. Western blotting using antibodies to MLH1 was employed to determine the amount of MLH1 in the fractions. Blotting with antibodies to GAPDH and PMCA served as loading controls for the soluble and insoluble fraction, respectively.
Figure 4
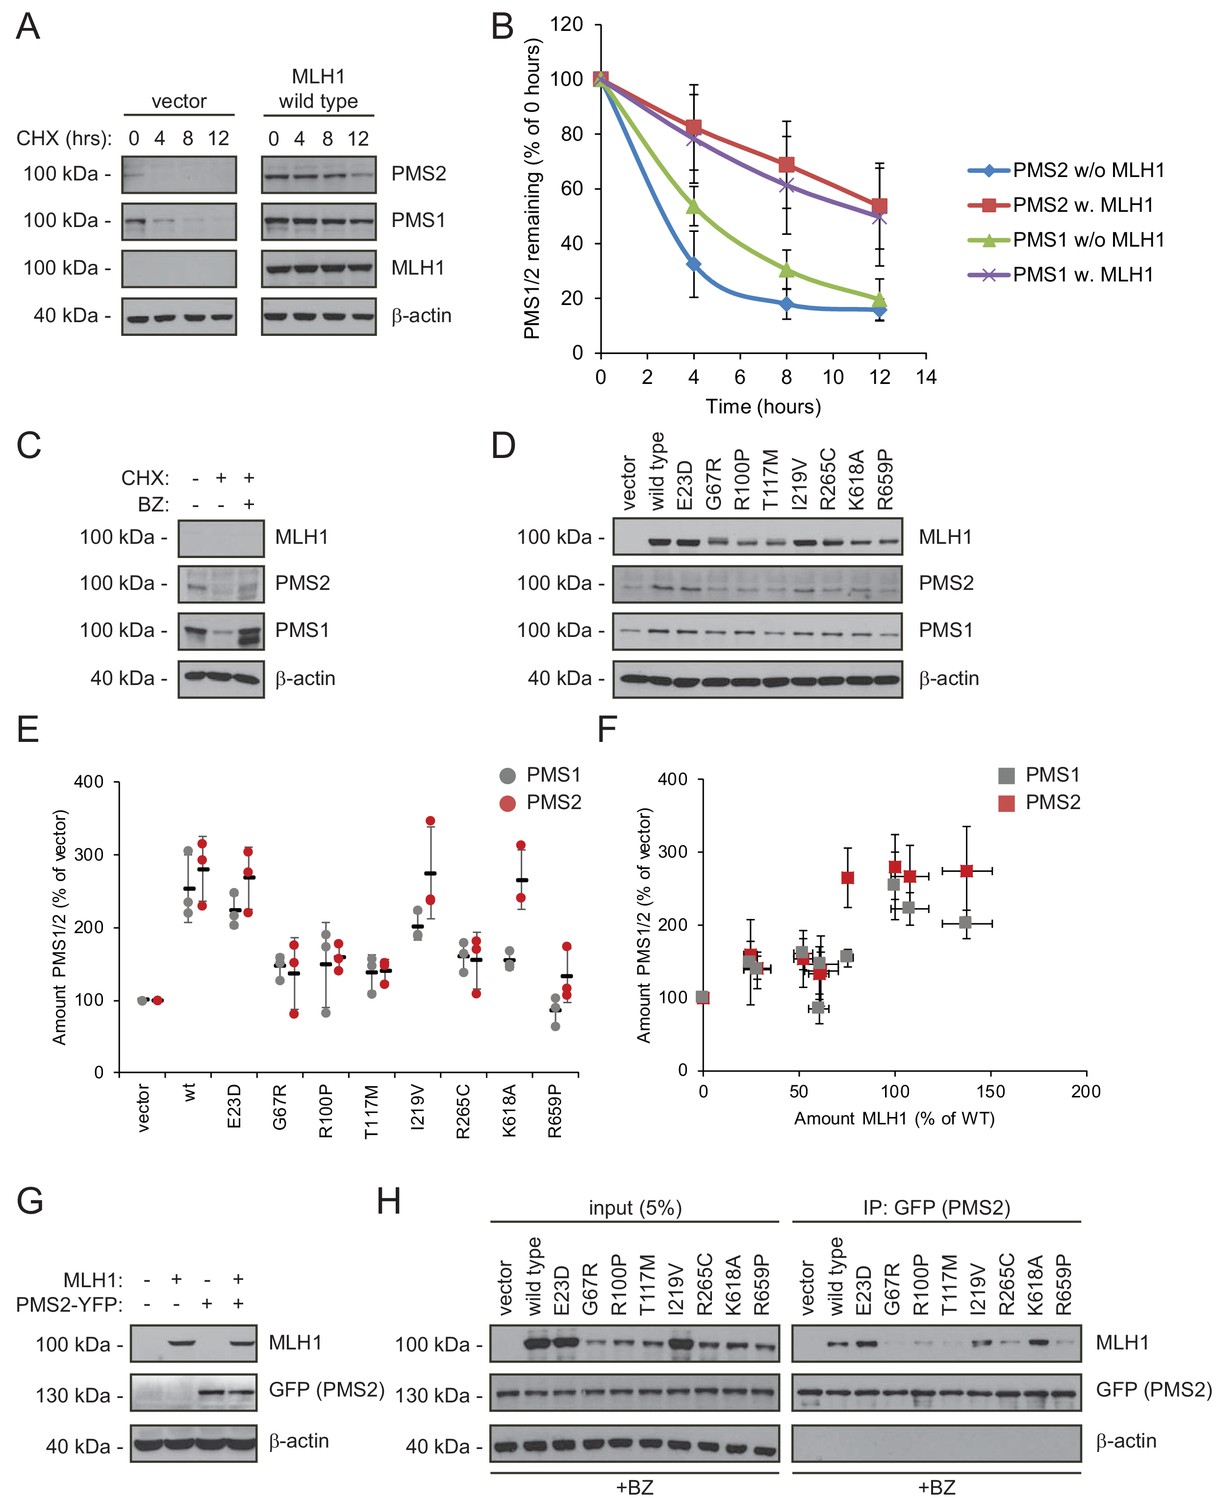
Stable MLH1 variants increase steady-state levels of PMS1 and PMS2.
(A) The levels of endogenous PMS1 and PMS2 were determined by blotting of whole-cell lysates of HCT116 cells transfected with either empty vector or with wild-type MLH1 and treated with 25 µg/mL cycloheximide (CHX) for 0, 4, 8 or 12 hr. The antibodies used were to PMS1 and PMS2, and as a control to MLH1. β-actin served as loading control. (B) Quantification of blots as in panel (A) normalized to protein levels at 0 hr. The error bars indicate the standard deviation (n = 3). (C) The levels of endogenous MLH1, PMS1 and PMS2 were compared by blotting of cell lysates of HCT116 cells either untreated, or treated with cycloheximide (CHX) or with bortezomib (BZ) and CHX. β-actin served as loading control. (D) The levels of endogenous PMS1 and PMS2 and transfected MLH1 were compared by western blotting using antibodies to PMS1, PMS2 and MLH1. β-actin served as loading control. (E) Quantification of blots as in panel (C) normalized to the level of endogenous PMS1 (grey) or PMS2 (red) in untransfected HCT116 cells. The error bars show the standard deviation (n = 3). (F) Plotting the levels of the MLH1 variants vs. the levels of endogenous PMS1 (grey) and PMS2 (red). The error bars show the standard deviation (n = 3). (G) The levels of MLH1 and YFP-tagged PMS2 were analyzed by SDS-PAGE and blotting of whole-cell lysates of HCT116 cells transfected with the indicated expression plasmids. β-actin was included as loading control. (H) Co-transfected PMS2-YFP was immunoprecipitated (IP) using GFP-trap beads, and the precipitated material was analyzed by electrophoresis and blotting. Bortezomib was added to all cultures 16 hr prior to cell lysis to ensure ample amounts of the unstable MLH1 variants.
Figure 5
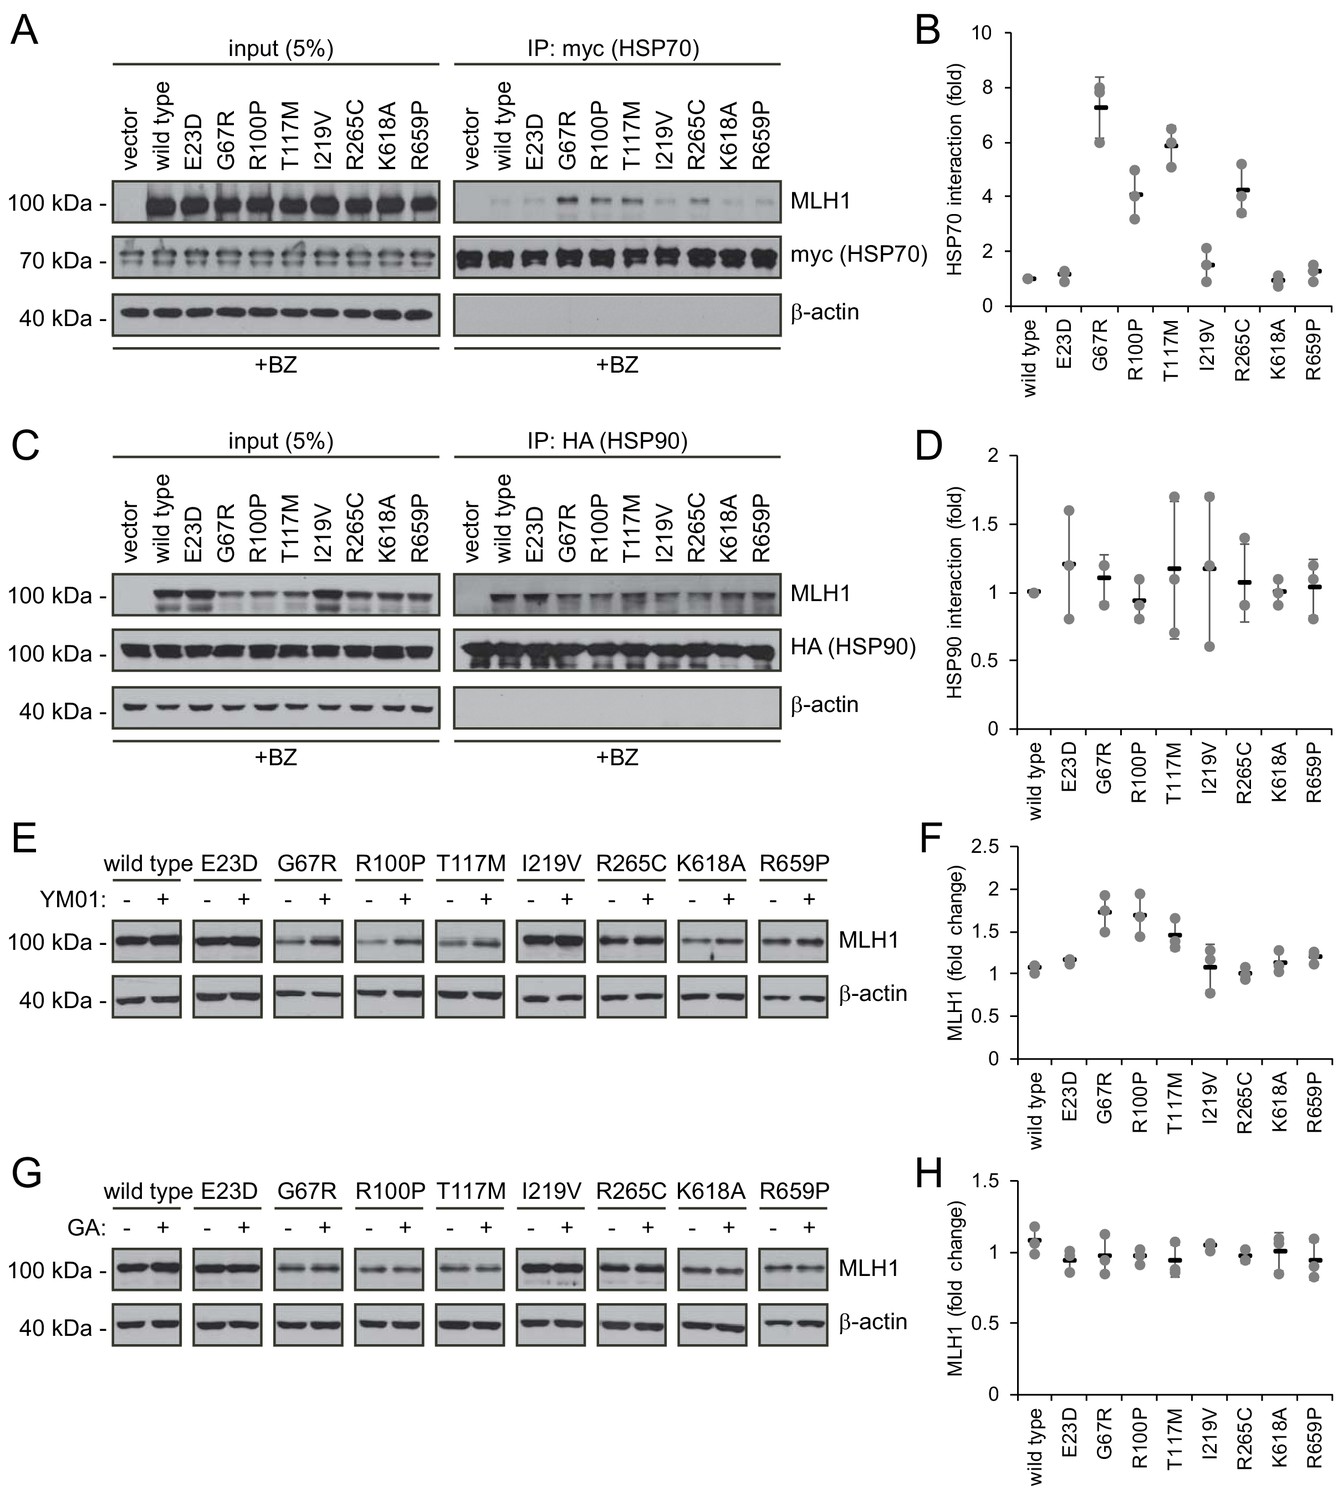
Molecular chaperones play a role in the proteasomal degradation of MLH1.
(A) Co-transfected HSP70-myc was immunoprecipitated (IP) using myc-trap beads and analyzed by blotting with antibodies to the myc-tag (HSP70) and MLH1. Bortezomib was added to all cultures 8 hr prior to cell lysis to ensure ample amounts of the unstable MLH1 variants. (B) Quantification of blots as shown in panel (A) normalized to level of wild-type MLH1. The error bars indicate the standard deviation (n = 3). (C) Co-transfected HSP90-HA was immunoprecipitated (IP) with anti-HA resin, and the precipitated material analyzed by electrophoresis and western blotting using antibodies to the HA-tag (HSP90) and MLH1. As above, bortezomib was added to all cultures prior to cell lysis. (D) Quantification of blots as in panel (C) normalized to amount of precipitated wild-type MLH1. The error bars show the standard deviation (n = 3). (E) Western blotting using antibodies to MLH1 of whole-cell lysates from transfected cells treated with 5 µM YM01 for 24 hr as indicated. (F) Quantification of blots as shown in panel (E) normalized to level of MLH1 without YM01. The error bars indicate the standard deviation (n = 3). (G) Western blotting using antibodies to MLH1 of whole-cell lysates from transfected cells treated 1 µM geldanamycin (GA) for 24 hr. (H) Quantification of blots as shown in panel (G) normalized to level of MLH1 without GA. The error bars indicate the standard deviation (n = 3).
Figure 6 with 3 supplements
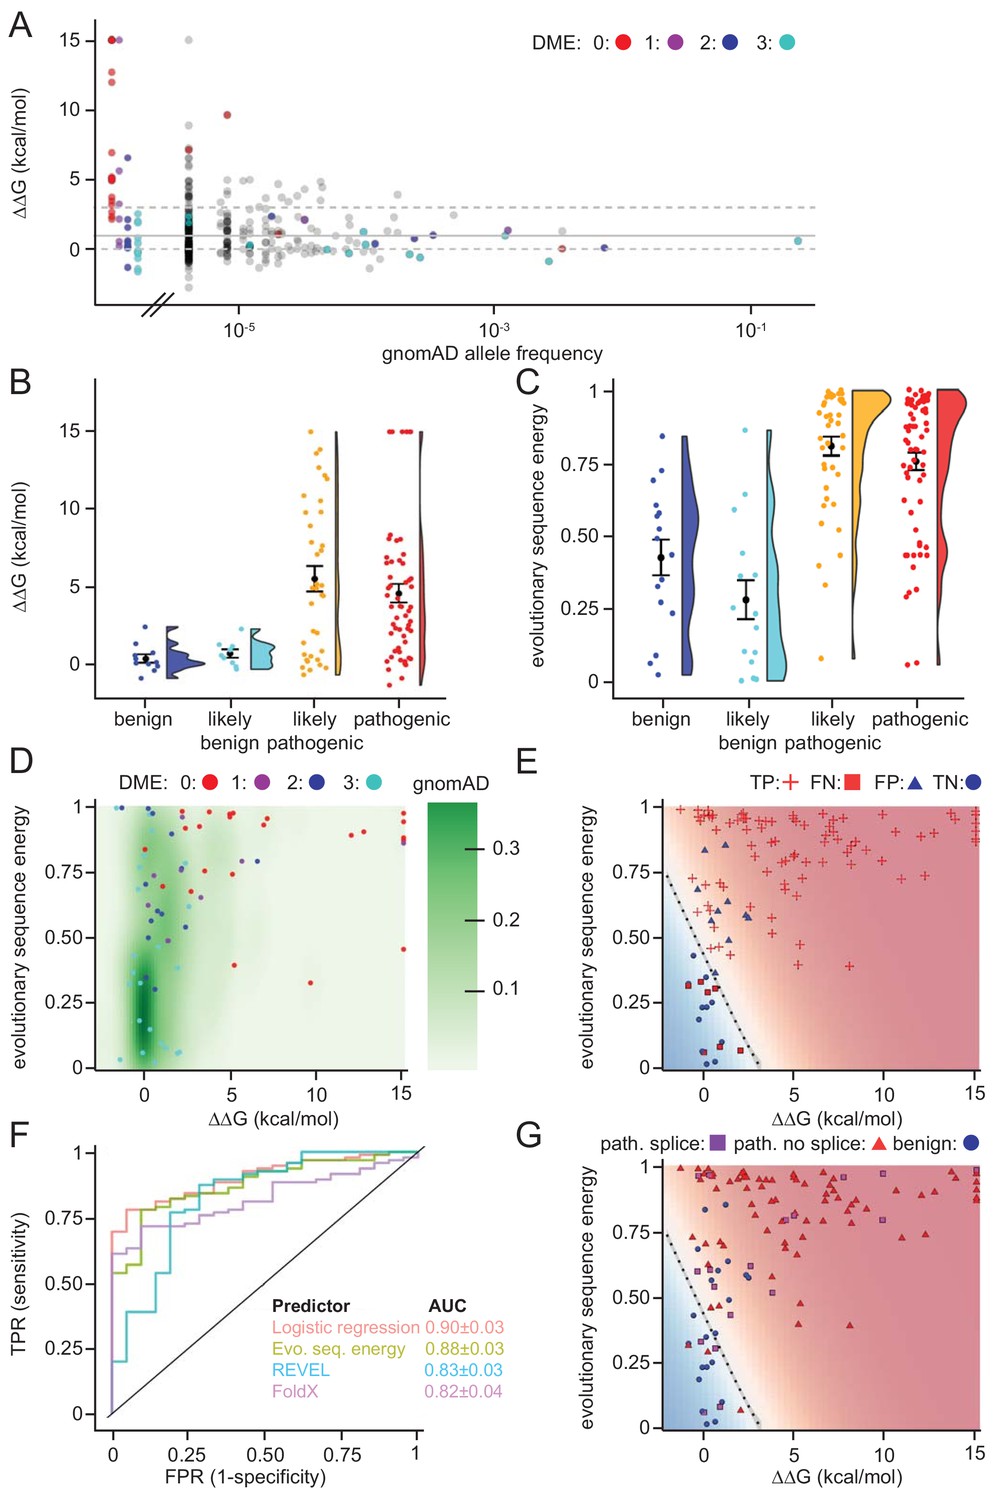
Assessing stability calculations for predicting pathogenicity.
(A) ‘Fishtail plot’ of ΔΔG-values vs. allele frequencies for all variants listed in gnomAD (gray), as well as those analyzed by Takahashi et al. (2007); the latter are color-coded by DME. Note that the leftmost group of colored dots are variants that have been reported in patients, but are not recorded in gnomAD (thus their allele frequency in gnomAD is zero). Variants with common to intermediate frequencies are all predicted to be stable, while some rare variants are predicted to be destabilized. ΔΔGs for gnomAD variants are provided as source data (Figure 6—source data 1), those for variants characterized by Takahashi et al. (2007) in Table 1 and source data (Table 1—source data 1). (B) FoldX ΔΔG for benign (blue), likely benign (cyan), likely pathogenic (orange), and pathogenic (red) variants that are reported in ClinVar with ‘at least one star’ curation. The whiskers represent the mean and standard error of the mean. (C) Evolutionary sequence energies for ClinVar-reported variants, color scheme as in (B). The whiskers represent the mean and standard error of the mean. (D) Landscape of variant tolerance by combination of changes in protein stability (x axis) and evolutionary sequence energies (y axis), such that the upper right corner indicates most likely detrimental variants, while those in the lower left corner are predicted stable and observed in MLH1 homologs. The green background density illustrates the distribution of all variants listed in gnomAD. The combination of metrics captures most non-functional variants (DME scores 0 or 1). Outliers are discussed in the main text. (E) Logistic regression model of FoldX ΔΔGs and evolutionary sequence energies. Pathogenic variants in red, benign in blue. Dot shape indicates whether pathogenicity of the respective variant was correctly predicted by a regression model trained on all but this data point (‘jackknife’, TP, true positives, FN, false negatives, FP, false positives, TN, true negatives). Parameters for a model trained on the full dataset are: FoldX ΔΔG weight 0.52, evolutionary sequence energy weight 3.50, intercept −1.55. (F) ROC curves for logistic regression model, FoldX ΔΔGs, evolutionary sequence energies, and the ensemble-predictor REVEL to assess their performance in separating benign from pathogenic variants. TPR, true positive rate. FPR, false positive rate. Standard deviations in AUC were determined by performing 100 ROC analyses on randomly sampled but balanced subsets, so that there are equal numbers of positive and negative cases. (G) Integrating potential effects these variants may have on splicing in the genomic context. Purple squares indicate pathogenic variants that are predicted to affect splicing (SpliceAI, threshold 0.5). No benign variants are predicted to affect splicing. Mapping to genomic loci (Yates et al., 2015) and SpliceAI Scores for ClinVar entries used in this work are provided as source data (Figure 6—source data 2).
-
Figure 6—source data 1
Data for gnomAD variants.
- https://doi.org/10.7554/eLife.49138.016
-
Figure 6—source data 2
Data for ClinVar variants.
- https://doi.org/10.7554/eLife.49138.017
Figure 6—figure supplement 1
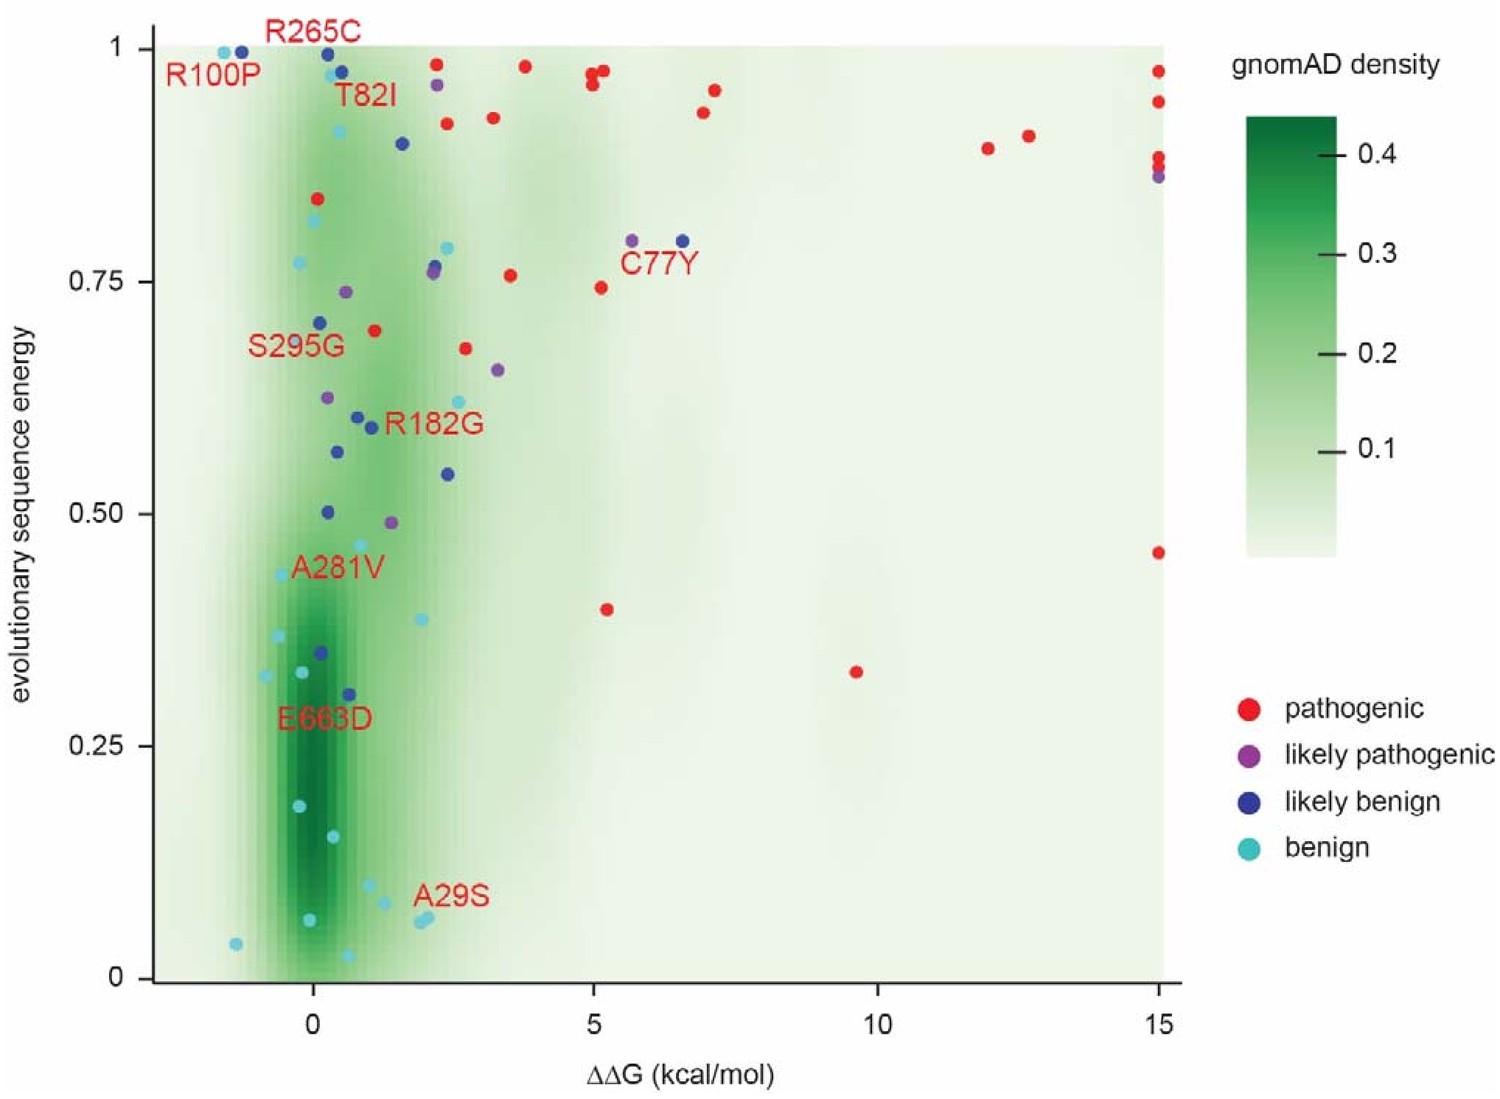
Landscape of ClinVar MLH1 variant tolerance.
Landscape of variant tolerance by combination of changes in protein stability (x axis) and evolutionary sequence energies (y axis), such that the upper right corner indicates most likely detrimental variants, while those in the lower left corner are predicted stable and observed in MLH1 homologs. The green background density illustrates the distribution of all variants listed in gnomAD. Outliers are discussed in the main text.
Figure 6—figure supplement 2
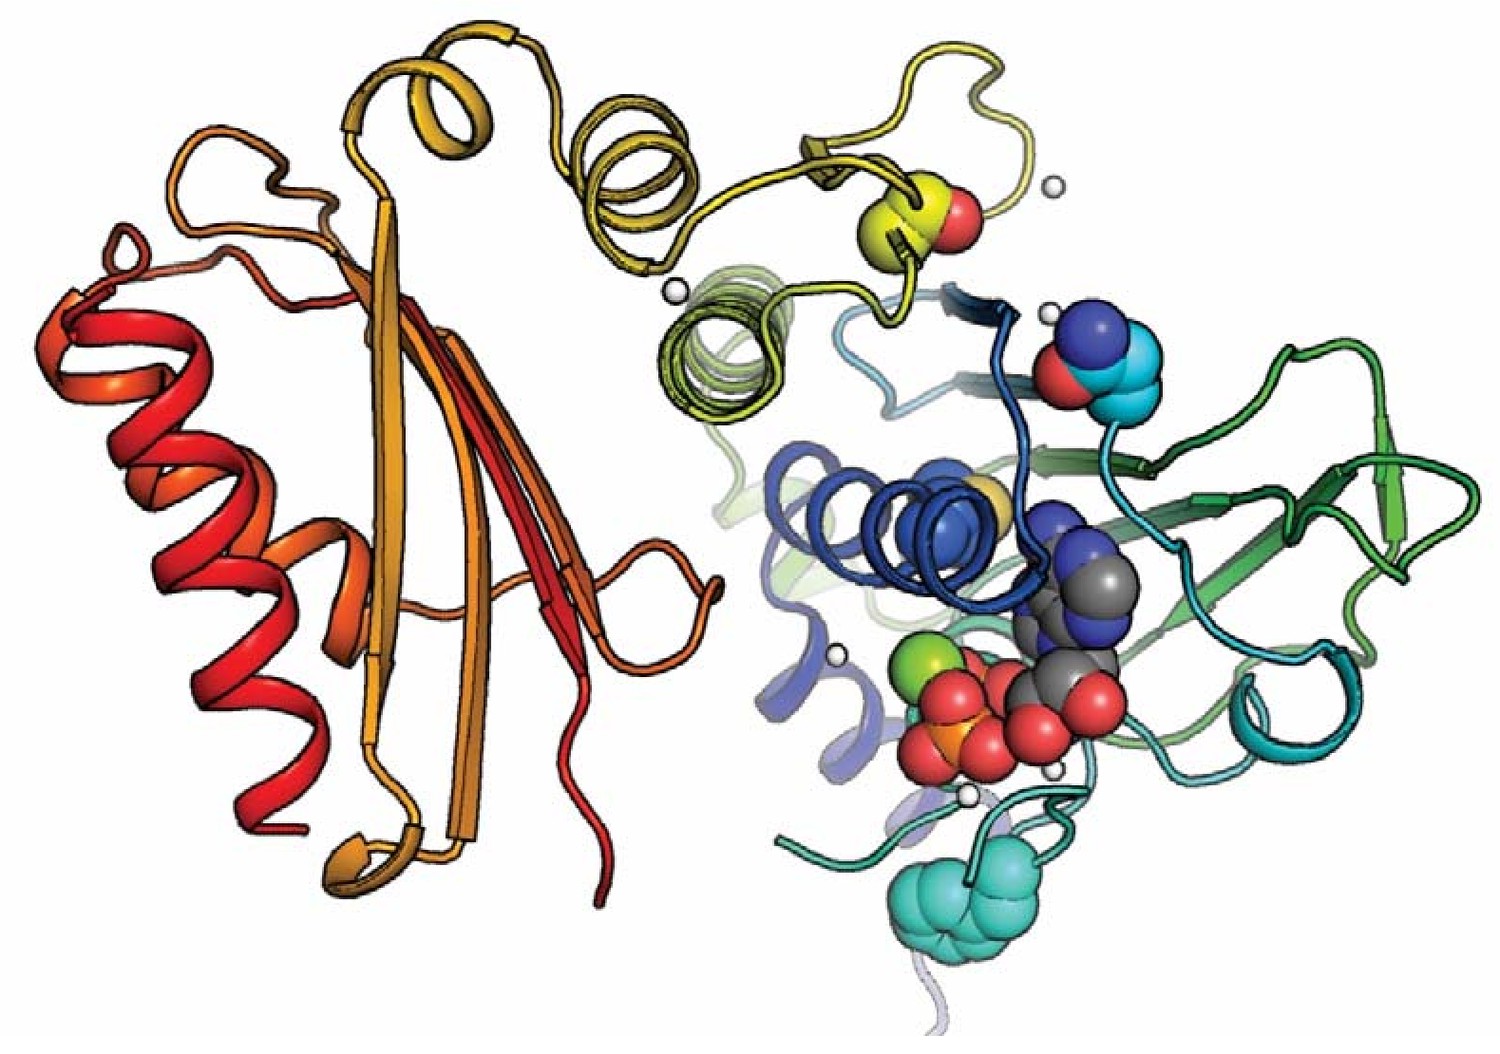
Positioning of selected variants near the active site in the N-terminal domain.
The MLH1 structure (PDB: 4P7A) (Wu et al., 2015) with highlighted stable loss-of-function MLH1 variants (M35R, N64S, F80V, S193P) as spheres, as well as ADP. The domain is colored in a rainbow color scheme, with blue at the N-terminus and red at the C-terminal end of the N-terminal domain (MLH1 sequence position ~300); sidechain and ligand oxygen atoms are red, nitrogens blue, ligand carbons gray. Three of the stable loss-of-function positions (M35R, N64S, F80V) are very close to the ligand. Variation at these sites may thus interfere with ligand binding, which could explain why they lead to loss of function despite wild-type-like cellular protein levels.
Figure 6—figure supplement 3
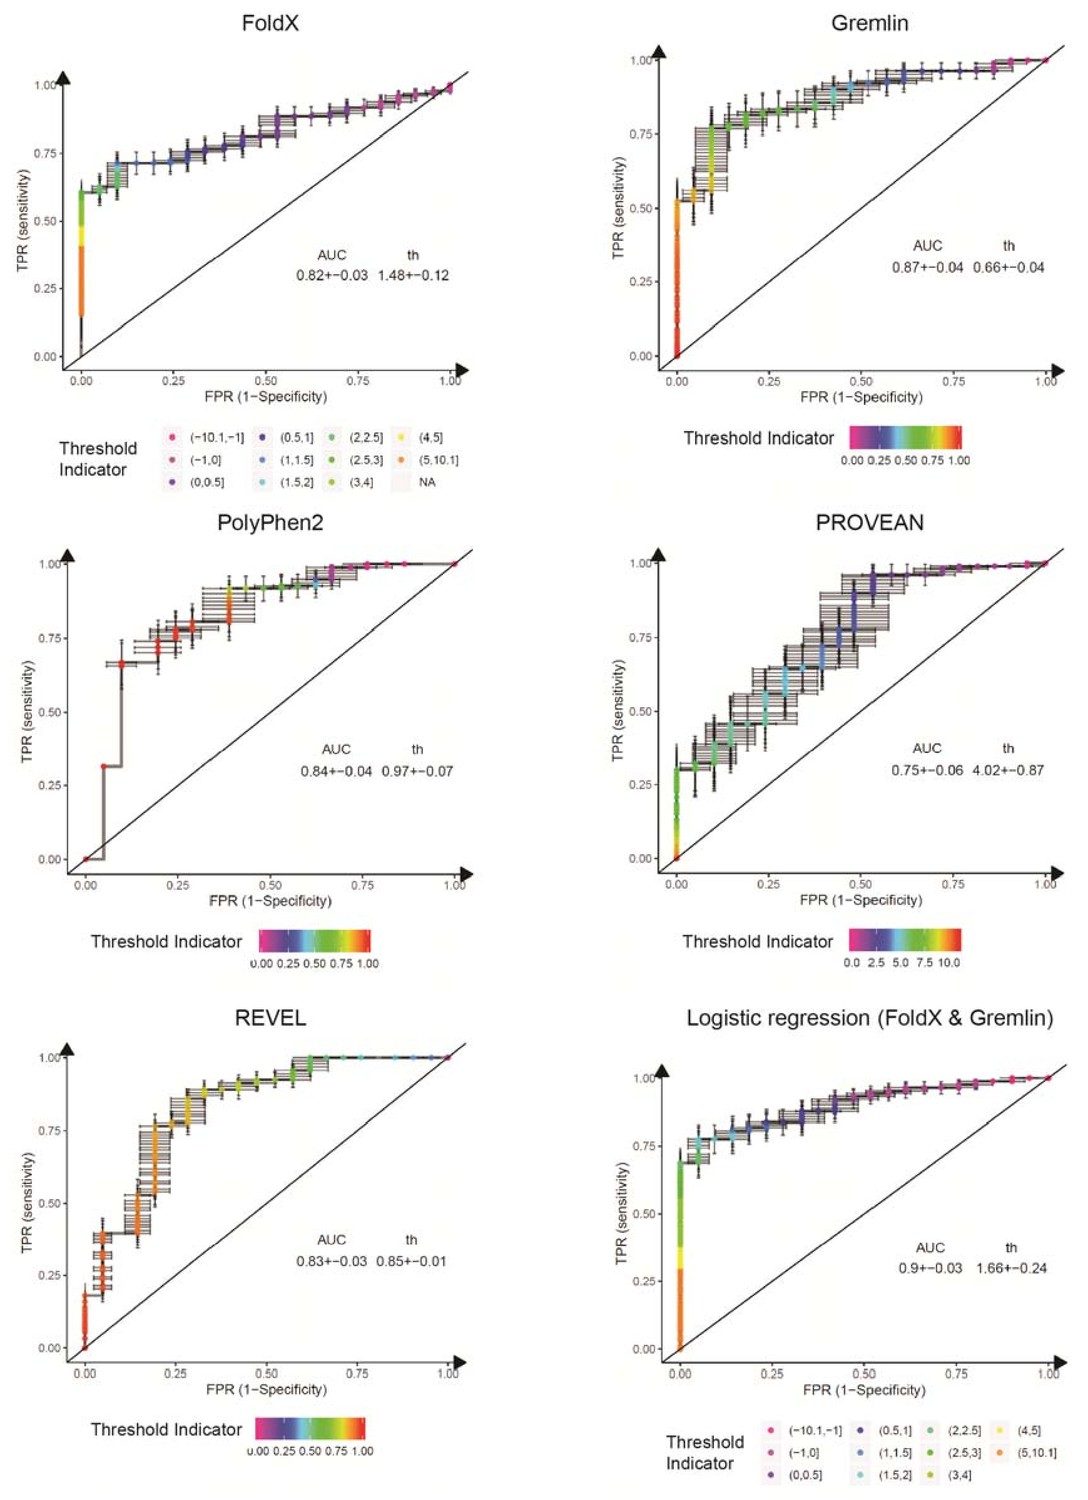
ROC curves for variant consequence predictors tested in this work.
The indicated predictors were used to score all benign, likely benign, likely pathogenic and pathogenic missense variants reported in ClinVar (Aug 2018). We merged benign and likely benign variants into the negative control set and pathogenic and likely pathogenic into the positive set and generated ROC curves for each predictor, assessing their power in separating benign from pathogenic variants. In addition to the individual predictors, we also assessed a logistic regression model combining FoldX ΔΔG and Gremlin evolutionary sequence energy (). AUC, area under the curve. th, threshold (units specific to the respective predictor). Error bars indicate standard deviation from 100 randomly sub-sampled balanced ROC curves. See also Figure 6E in the main manuscript.
Figure 7
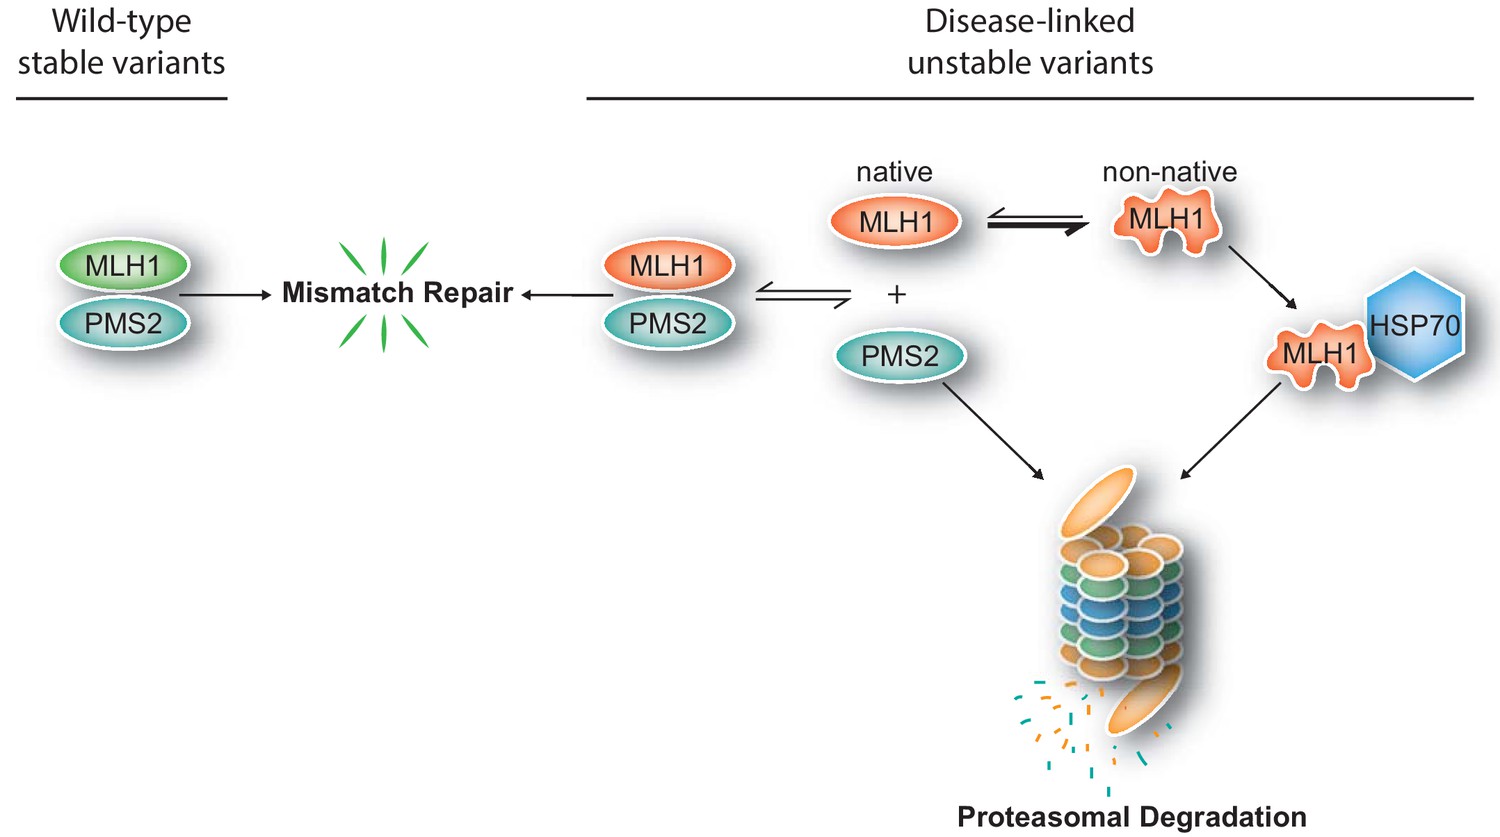
Model for how structural destabilization of MLH1 contributes to disease.
The wild-type (green) MLH1-PMS2 heterodimer promotes DNA mismatch repair. Disease-linked missense MLH1 variants (red) may also promote DNA repair, but are at risk of dissociating from PMS2 due to structural destabilization. The structural destabilization of MLH1 may also cause a partial unfolding of MLH1 which is recognized by the molecular chaperone HSP70 and causes proteasomal degradation of the MLH1 variant. In turn, the degradation of MLH1 leaves PMS2 without a partner protein, resulting in proteasomal degradation of PMS2.
Tables
Table 1
Characteristics of the selected naturally occurring MLH1 variants.
https://doi.org/10.7554/eLife.49138.003| Variant* | Steady-state level (% of WT) | FoldX ΔΔG (kcal/mol) | ClinVar annotation¤ | DME# |
|---|---|---|---|---|
| E23D | 90.0 | 0.49 | VUS | 3 |
| I25T | 51.3 | 2.40 | VUS | 3 |
| A29S | 109.6 | 2.06 | (likely) pathogenic | 3 |
| M35R | 72.1 | 3.52 | (likely) pathogenic | 0 |
| I36S | 63.2 | 4.08 | VUS | NA |
| N38D | 63.5 | 1.61 | VUS | 2 |
| S44F | 9.8 | >15 | (likely) pathogenic | 0 |
| S44A | 103.2 | −1.35 | VUS | 3 |
| G54E | 15.3 | >15 | VUS | 1 |
| N64S | 96.3 | 2.16 | VUS | 1 |
| G67R | 35.0 | >15 | (likely) pathogenic | 0 |
| G67W | 14.5 | >15 | (likely) pathogenic | 0 |
| I68N | 62.5 | 2.22 | (likely) pathogenic | 0 |
| R69K | 104.9 | −0.18 | VUS | 3 |
| C77Y | 61.0 | 6.57 | (likely) pathogenic | 2 |
| F80V | 72.3 | 2.22 | (likely) pathogenic | 1 |
| T82I | 100.0 | 0.54 | (likely) pathogenic | 2 |
| R100P | 46.4 | −1.25 | (likely) pathogenic | 2 |
| E102D | 97.9 | 0.34 | (likely) pathogenic | 3 |
| A111V | 68.8 | 4.96 | (likely) pathogenic | 0 |
| T117M | 32.8 | 7.14 | (likely) pathogenic | 0 |
| T117R | 46.2 | 12.70 | (likely) pathogenic | 0 |
| A128P | 62.8 | 2.40 | (likely) pathogenic | 0 |
| D132H | 110.2 | −0.30 | (likely) benign | 3 |
| A160V | 107.3 | 0.38 | VUS | 3 |
| R182G | 87.9 | 2.60 | (likely) pathogenic | 3 |
| S193P | 100.7 | 2.73 | VUS | 0 |
| V213M | 103.9 | −0.81 | (likely) benign | 3 |
| R217C | 74.1 | 1.06 | VUS | 2 |
| I219V | 112.5 | 0.66 | (likely) benign | 3 |
| I219L | 121.9 | −0.05 | (likely) benign | 3 |
| R226L | 63.3 | 0.27 | (likely) pathogenic | 1 |
| G244V | 32.0 | >15 | VUS | 0 |
| G244D | 38.8 | >15 | (likely) pathogenic | 0 |
| H264R | 117.6 | −0.60 | VUS | 3 |
| R265C | 57.2 | 0.28 | (likely) pathogenic | 2 |
| R265H | 81.4 | 0.04 | VUS | 3 |
| E268G | 81.1 | 0.81 | (likely) benign | 2 |
| L272V | 80.0 | 1.95 | VUS | 3 |
| A281V | 82.5 | 0.87 | (likely) pathogenic | 3 |
| K286Q | 101.8 | 0.28 | VUS | 2 |
| S295G | 88.6 | 0.13 | (likely) pathogenic | 2 |
| H329P | 54.1 | 5.67 | (likely) pathogenic | 1 |
| V506A | 62.1 | 2.18 | VUS | 2 |
| Q542L | 110.2 | −1.56 | VUS | 3 |
| L549P | 63.7 | 5.17 | VUS | 0 |
| I565F | 65.9 | 9.64 | VUS | 0 |
| L574P | 34.4 | 11.97 | (likely) pathogenic | 0 |
| E578G | 103.2 | 0.45 | (likely) benign | 2 |
| L582V | 100.0 | 1.93 | VUS | 3 |
| L588P | 88.6 | 3.30 | VUS | 1 |
| K618A | 80.4 | 0.61 | VUS | 1 |
| K618T | 106.5 | 0.09 | (likely) benign | 0 |
| L622H | 61.1 | 4.97 | (likely) pathogenic | 0 |
| P640T | 61.1 | 3.78 | VUS | 0 |
| L653R | 66.1 | 3.22 | (likely) pathogenic | 0 |
| I655V | 89.1 | 1.03 | (likely) benign | 3 |
| I655T | 71.1 | 1.29 | VUS | 3 |
| R659P | 69.0 | 6.93 | (likely) pathogenic | 0 |
| R659Q | 84.9 | 2.41 | VUS | 2 |
| T662P | 72.7 | 5.23 | (likely) pathogenic | 0 |
| E663G | 72.0 | −0.23 | VUS | 3 |
| E663D | 97.2 | 0.66 | (likely) pathogenic | 2 |
| L676R | 36.8 | 5.12 | VUS | 0 |
| R687W | 115.4 | 1.12 | (likely) pathogenic | 0 |
| Q689R | 71.0 | −0.54 | (likely) benign | 3 |
| V716M | 100.1 | 1.41 | (likely) benign | 1 |
| H718Y | 73.7 | 0.16 | (likely) benign | 2 |
| K751R | 82.1 | −0.23 | (likely) benign | 3 |
-
*:boldfaced variants studied in detail; ¤: VUS: variant of unknown significance; #DME: dominant mutator effect See also source data (Table 1—source data 1).
-
Table 1—source data 1
MLH1 variants tested in this work.
- https://doi.org/10.7554/eLife.49138.004
Key resources table
| Reagent type (species) or resource | Designation | Source or reference | Identifiers | Additional information |
|---|---|---|---|---|
| Gene (Homo sapiens) | MLH1 | - | UniProt identifier: P40692-1 | - |
| Cell line (Homo sapiens) | HCT116 | ATCC | CCL-247EMT; RRID:CVCL_0291 | - |
| Antibody | anti-MLH1 (rabbit polyclonal) | Santa Cruz Biotechnology | sc-11442; RRID:AB_2145332 | Dilution: 1:100 (IF) 1:1000 (WB) |
| Antibody | anti-β-actin (mouse monoclonal) | Sigma-Aldrich | A5441; RRID:AB_476744 | Dilution: 1:20000 |
| Antibody | anti-PMS2 (mouse monoclonal) | BD Biosciences | 556415; RRID:AB_396410 | Dilution: 1:2500 |
| Antibody | anti-PMS1 (rabbit polyclonal) | Invitrogen | PA5-35952; RRID:AB_2553262 | Dilution: 1:2500 |
| Antibody | anti-GFP (rat monoclonal) | ChromoTek | 3H9; RRID:AB_10773374 | Dilution: 1:2000 |
| Antibody | anti-myc (rat monoclonal) | ChromoTek | 9E1; RRID:AB_2631398 | Dilution: 1:1000 |
| Antibody | anti-HA (rat monoclonal) | Roche | 3F10; RRID:AB_2314622 | Dilution: 1:2000 |
| Antibody | anti-GAPDH (rabbit monoclonal) | Cell Signaling Technologies | 14C10; RRID:AB_10693448 | Dilution: 1:2000 |
| Antibody | anti-PMCA (mouse monoclonal) | Invitrogen | MA3-914; RRID:AB_2061566 | Dilution: 1:2000 |
| Recombinant DNA reagent | pCMV6-MYC-DDK-HSP70-1A (HSPA1A) | OriGene | RC200270 | - |
| Recombinant DNA reagent | pcDNA3 -HA-HSP90 | Addgene | 22487; RRID:Addgene_22487 | - |
| Recombinant DNA reagent | pEYFP-C2-PMS2 | Prof. Lene J. Rasmussen | (Andersen et al., 2012) | - |
| Recombinant DNA reagent | pEGFP-C1 | Clontech | Discontinued by supplier | Available from NovoPro Labs (Cat. No. V12024) |
| Recombinant DNA reagent | pcDNA3.1-V5-His | Invitrogen | V81020 | - |
| Recombinant DNA reagent | pCMV-MLH1 and MLH1 variants | Prof. Chikashi Ishioka | (Takahashi et al., 2007) | - |
| Commercial assay or kit | FuGENE HD | Promega | E2311 | - |
| Chemical compound, drug | Bortezomib | LC Laboratories | B-1408 | - |
| Chemical compound, drug | YM01 | StressMarq | SIH-121 | - |
| Chemical compound, drug | Geldanamycin | Sigma-Aldrich | G3381 | - |
| Chemical compound, drug | Cycloheximide | Sigma-Aldrich | C1988 | - |
| Software, algorithm | UnScanIt gel | Silk Scientific | V6.1; RRID:SCR_017291 | - |
| Software, algorithm | FoldX | http://foldxsuite.crg.eu/ | January 2017; RRID:SCR_008522 | Details see Materials and methods |
| Software, algorithm | Gremlin | https://github.com/sokrypton/GREMLIN | V2.01 | Details see Materials and methods |
| Software, algorithm | Custom R script | - | - | - |
| Software, algorithm | SpliceAI | https://github.com/Illumina/SpliceAI | V1.2.1 | - |
Additional files
-
Supplementary file 1
Full matrix for FoldX stability predictions.
- https://doi.org/10.7554/eLife.49138.019
-
Supplementary file 2
Full matrix for evolutionary sequence energies.
- https://doi.org/10.7554/eLife.49138.020
-
Transparent reporting form
- https://doi.org/10.7554/eLife.49138.021
Download links
A two-part list of links to download the article, or parts of the article, in various formats.
Downloads (link to download the article as PDF)
Open citations (links to open the citations from this article in various online reference manager services)
Cite this article (links to download the citations from this article in formats compatible with various reference manager tools)
Computational and cellular studies reveal structural destabilization and degradation of MLH1 variants in Lynch syndrome
eLife 8:e49138.
https://doi.org/10.7554/eLife.49138


