High and asymmetric somato-dendritic coupling of V1 layer 5 neurons independent of visual stimulation and locomotion
- University of Edinburgh, United Kingdom
Figures
Figure 1 with 2 supplements
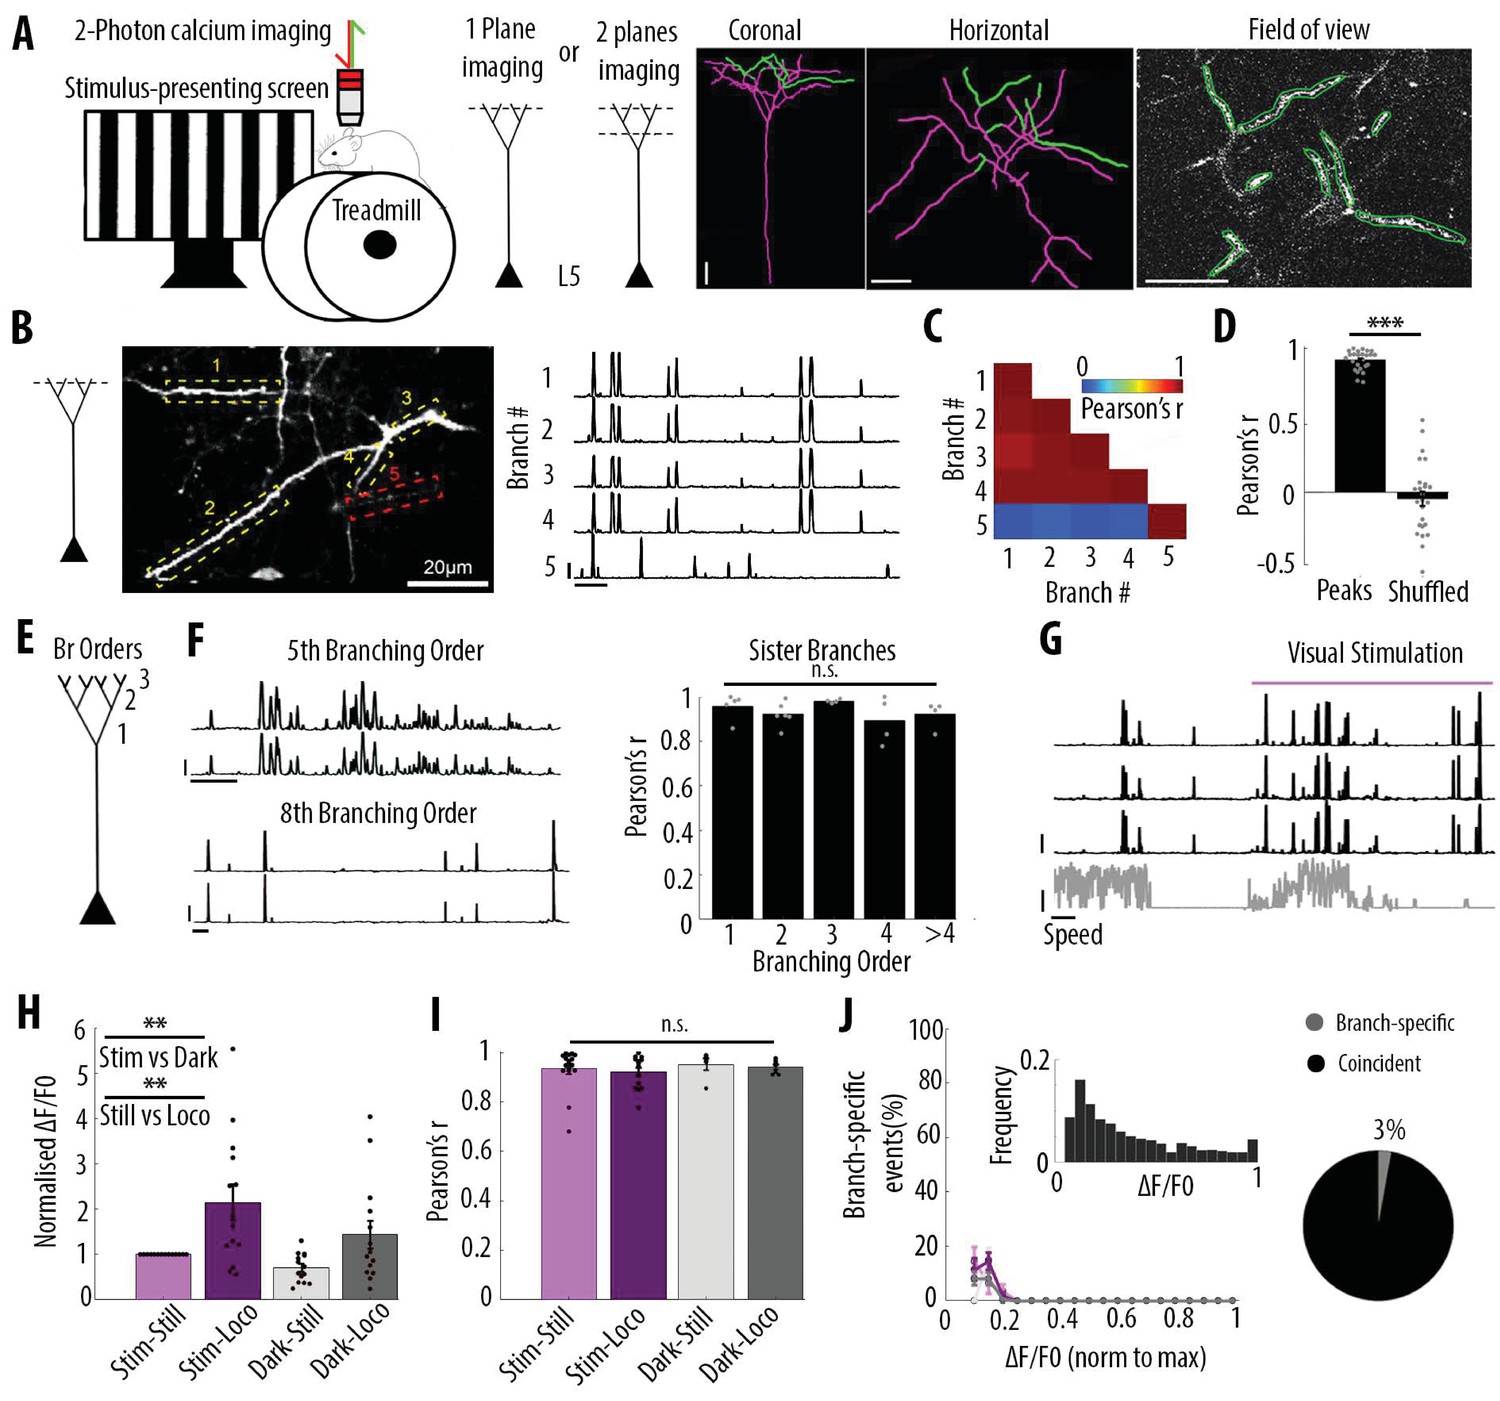
Highly correlated activity in the whole apical tuft of layer 5 pyramidal neurons.
(A) Schematic of the methodological approach. Calcium transients were recorded either in multiple apical tuft dendrites in a single focal plane, or semi-simultaneously in different compartments of individual neurons (Soma, Trunk and Tuft). At the end of each imaging session, a z-stack was recorded for post-hoc reconstruction of each imaged neuron. (B) Single plane imaging of the apical tuft branches of an individual layer 5 neuron. GCaMP6f-calcium transients of the apical tuft branches belonging to one neuron are shown in traces 1 to 4 while calcium transients of a tuft branch belonging to a different neuron is shown in trace 5. Scale bars, 0.3 ΔF/F0 (normalised to max), 20 s. (C) Pearson’s correlation matrix between the calcium transients of the branches shown in B. Branches that belong to the same neuron (branches 1 to 4, neuron 1) have a mean Pearson’s correlation of 0.96, while the branch that belongs to the different neuron (branch 5, neuron 2) has a mean Pearson’s correlation value of 0.13 with neuron 1’s branches. (D) Mean Pearson’s correlation value between tuft dendrites calcium transient peak amplitudes for each imaged field of view and corresponding shuffled data (Paired t-test, p=3.5e−15; mean = 0.92 and −0.04, sem = 0.01 and 0.05 for branches and shuffled data, respectively; n = 25 fields of view; coming from 14 neurons; six animals; 70 branches). (E) Schematic of the definition of branching orders. (F) Two representative traces of sibling branches belonging to the 5th and 8th branching order and a quantification of the Pearson’s correlation for sibling tuft branches of different branching orders (right panel). (For 1st, 2nd, 3rd, 4th and more than 4th branching order, One-way ANOVA, p=0.34; mean = 0.96; 0.92; 0.98; 0.89; 0.92, sem = 0.02; 0.02; 0.01; 0.05; 0.03, n = 5; 6; 4; 4; 4 pairs of branches, respectively). Scale bars, 0.3 ΔF/F0 (normalised to max), 20 s. (G) Representative traces of 3 tuft branches belonging to the same neuron while the animal was either stationary or running (grey signal, speed) during either darkness or the presentation of drifting gratings (purple segment). Scale bars, 12 cm/s, 0.3 ΔF/F0 (normalised to max), 20 s. (H) Mean ΔF/F0 for apical tuft dendrites during darkness (dark) and visual stimulation (stim) while the animal was either stationary (still) or running (loco). Bar graph is normalised to visual stimulation during stationary condition. Both visual stimulation and locomotion significantly increase the mean ΔF/F0 of tuft branches without any interaction effect (Repeated Measures Two-way ANOVA on log-transformed data, p=0.005, 0.003 and 0.99 for stim, loco and interaction effects respectively, mean (normalised to condition stim/still)=1; 2.15; 0.7; 1.4, sem = 0; 0.38; 0.08 and 0.3, n = 14 neurons). (I) Pearson’s correlation coefficients between tuft dendrites calcium transients of individual neurons during stim-still, stim-loco, dark-still and dark-loco conditions. (Two-way ANOVA, p=0.43, 0.62 and 0.97 for stim, loco and interaction effects; mean = 0.93; 0.92; 0.95 and 0.94, sem = 0.02; 0.02; 0.02; 0.01, n = 16; 14; 5 and 7 fields of views respectively, from 14 neurons). (J) Proportion of branch-specific events as a function of GCaMP6f calcium transients’ amplitude for the four different conditions (left panel). Neither visual stimulation nor locomotion nor an interaction effect significantly increased the number of branch-specific events (Three-way ANOVA, p=0.29; 0.8 and 0.94, respectively; p<10−15 for event amplitude; n = 70 branches from 14 neurons; 6 animals). Inset, frequency distribution of the calcium transients’ amplitudes detected in the apical tuft branches. Right panel, pie chart showing that, on average, 3% of all calcium transients were detected as branch-specific (detected in one apical tuft dendritic branch and not detected in the other imaged branches).
Figure 1—figure supplement 1
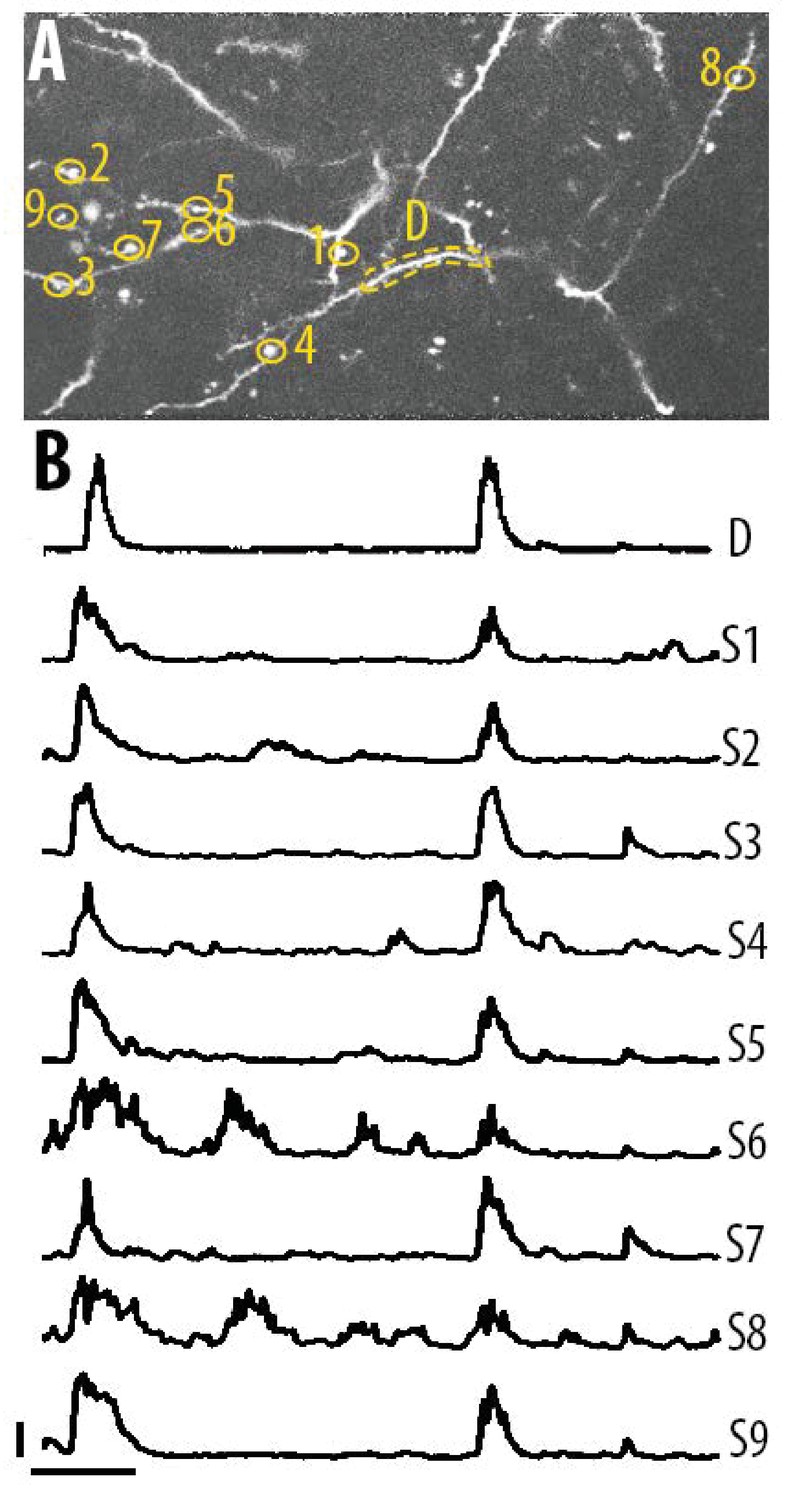
Single spine calcium transients in the apical tuft dendrites of layer 5 neurons.
(A) Two-photon image of an example field of view showing the apical tuft branches of an individual GCaMP6-labelled layer 5 neuron. (B) Example ΔF/F0 traces for the individual spines shown in panel A. Error bars indicate 0.3 ΔF/F0 (normalised to max), 10 s.
Figure 1—figure supplement 2
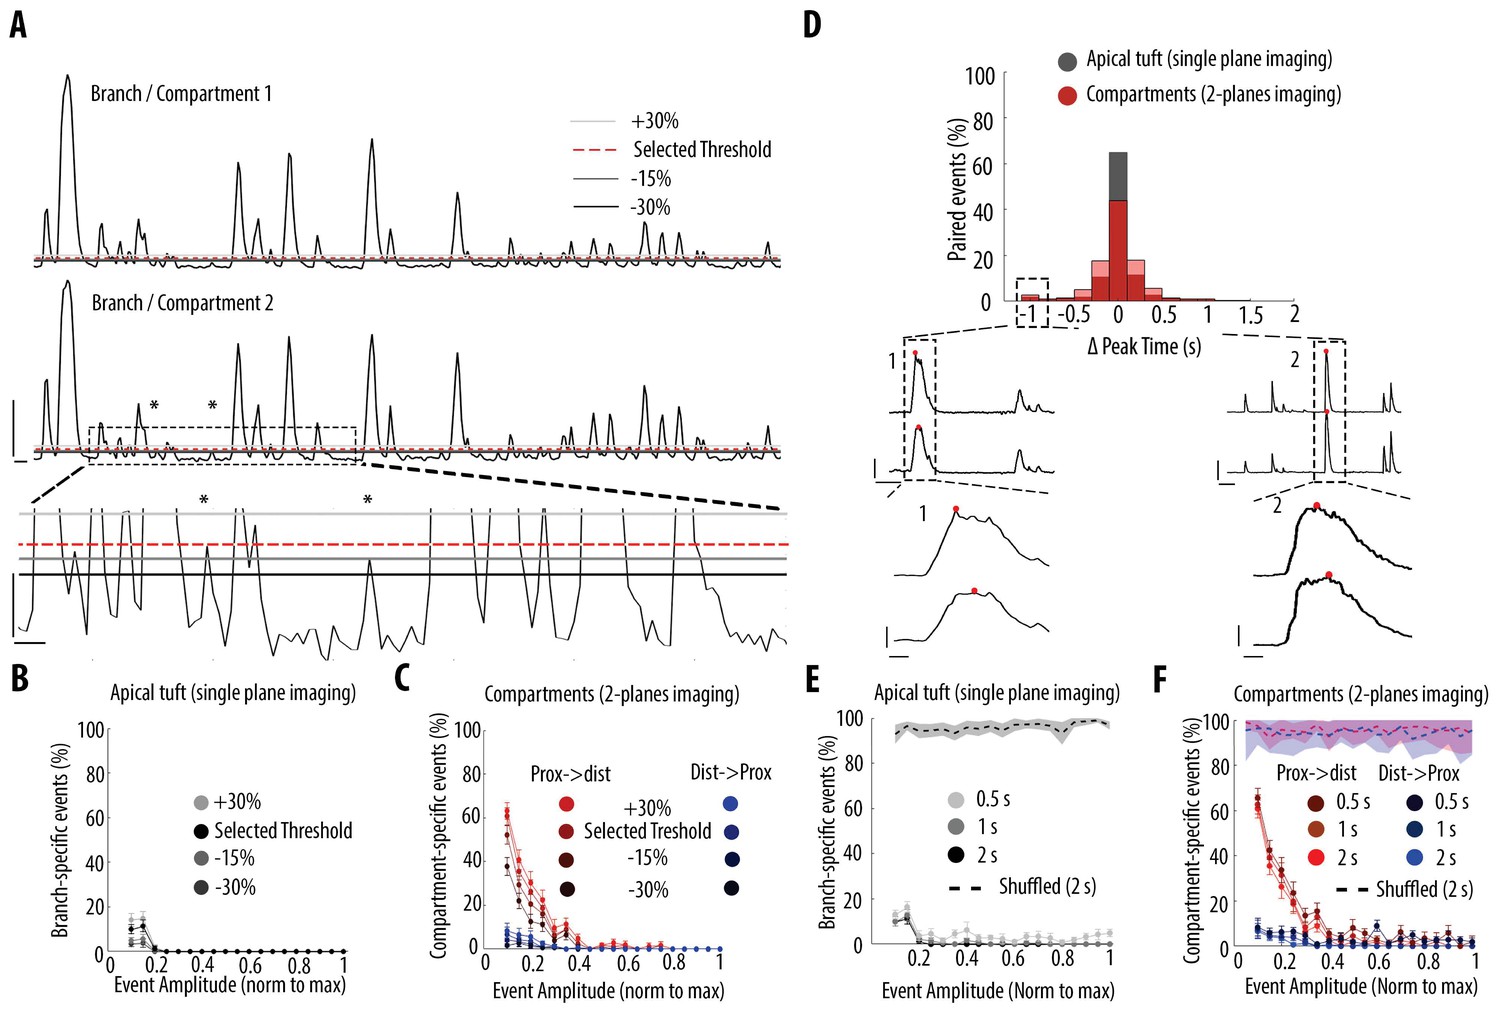
Impact of different thresholds and coincident windows on the quantification of branch-specific and compartment-specific events.
(A) Example ΔF/F0 traces of two sibling branches in the apical tuft branches of an individual layer 5 pyramidal neuron. Asterisks indicate two calcium transients which were not detected using the selected threshold for peak amplitude but were detected lowering the threshold by 30%. Lower panel, zoomed image of the dotted area in the middle panel. To assess the resilience of our results to different thresholds, we assessed the proportion of branch/compartment specific events, keeping the selected threshold constant in one branch/compartment (red-dotted line) and varying the threshold in the second branch/compartment from +30% to −30% (light, medium and dark grey lines, respectively). Scale bars: upper panel, 0.3 ΔF/F0 (normalised to max), 5 s; lower panel: 0.03 ΔF/F0, 1 s. (B) Proportion of apical tuft branch-specific events as a function of calcium transients’ amplitude, detected with different thresholds. C) Proportion of compartment-specific events as a function of calcium transients’ amplitude, detected with different thresholds. Same colour code as in Figure 3. (D) Distribution of time intervals between peaks of calcium transients detected as coincident. Black, distribution for apical tuft events. Red, distribution for pairs of neuronal compartments (2-planes imaging). Lower panel, Two examples of cases with the largest time interval between two coincident events (offset by 1 s) (dashed rectangle in D). Lower traces: zoomed view of the dashed area 1 and 2. The red dot indicates the frame at which a peak was detected for each pair of compartment. Scale bars: 0.3 ΔF/F0 (normalised to max), 10 s (upper panel) and 1 s (lower panel). (E) Proportion of branch-specific events as a function of calcium transients’ amplitude using different time windows (0.5 s, 1 s and 2 s) to define coincidence. The dashed line represents the proportion of branch-specific events obtained from shuffled ΔF/F0 signals, with the selected time window (2 s). F) Same as in E, for compartment-specific events. Same colour code as Figure 3.
Figure 2 with 2 supplements
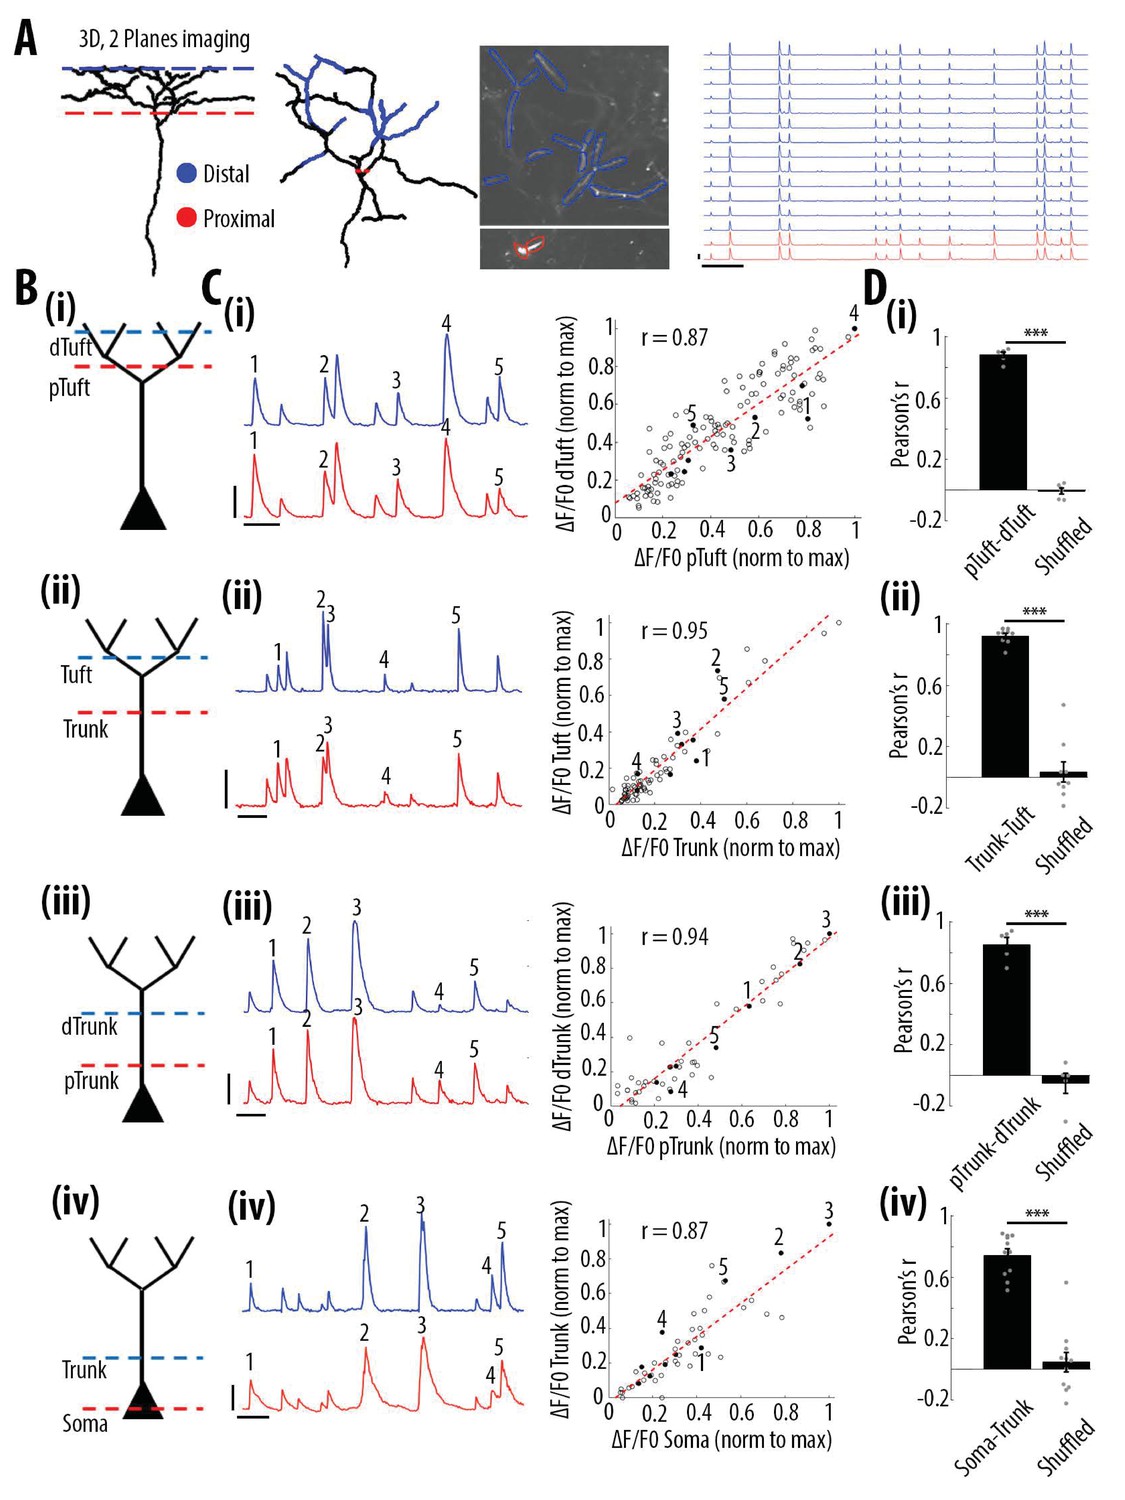
High correlation of calcium transients between neuronal compartments (soma, trunk, apical tuft) of individual layer 5 neurons.
(A) Anatomical reconstruction of an individual GCaMP6s-labeled layer 5 pyramidal neuron imaged at two focal planes semi-simultaneously (red dotted lines, proximal; blue, distal). Left panel, coronal and horizontal views of the same imaged neuron. Right panel, two-photon image of dendritic branches highlighted in red and blue in the horizontal view of the anatomical reconstruction. Example ΔF/F0 traces of highly correlated calcium transients from dendritic branches indicated in red and blue. (B) Schemata of the compartments imaged semi-simultaneously, (i) proximal tuft-distal tuft, (ii) trunk-tuft, (iii), trunk-trunk, (iv) soma-trunk. pTrunk, dTrunk and pTuft, dTuft indicate proximal and distal portions of the trunk and the apical tuft, respectively. (C) Left panel, representative GCaMP6s transients imaged in two neuronal compartments semi-simultaneously as shown in B. Right panel, scatter plot of peak amplitudes of individual calcium transients in proximal and distal compartments imaged semi-simultaneously, in one example individual neuron. Each dot represents a calcium transient. Peak amplitudes were normalized to the maximum amplitude in each compartment. Filled dots correspond to the transients indicated by numbers in the left panel. Red dotted line indicates the best fit (least square). Pearson’s correlation values (r) are indicated for each example pair of neuronal compartments. Scale bars 0.3 ΔF/F0 (normalised to max), 10 s. (D) Pearson’s correlation values for each pair of compartments imaged semi-simultaneously and corresponding shuffled data (Paired t-test, (i)pTuft-dTuft, p=1.6e−6, mean = 0.88; −0.01, sem = 0.02; 0.02, n = 6 pairs; (ii)Trunk-Tuft, p=8e−7, mean = 0.92; 0.04, sem = 0.02; 0.07, n = 9; (iii) pTrunk-dTrunk, p=4.4e−4, mean = 0.85; −0.05, sem = 0.05; 0.07, n = 5; (iv) Soma-Trunk, p=4.4e−6, mean = 0.74; 0.05, sem = 0.04; 0.06, n = 11).
Figure 2—figure supplement 1
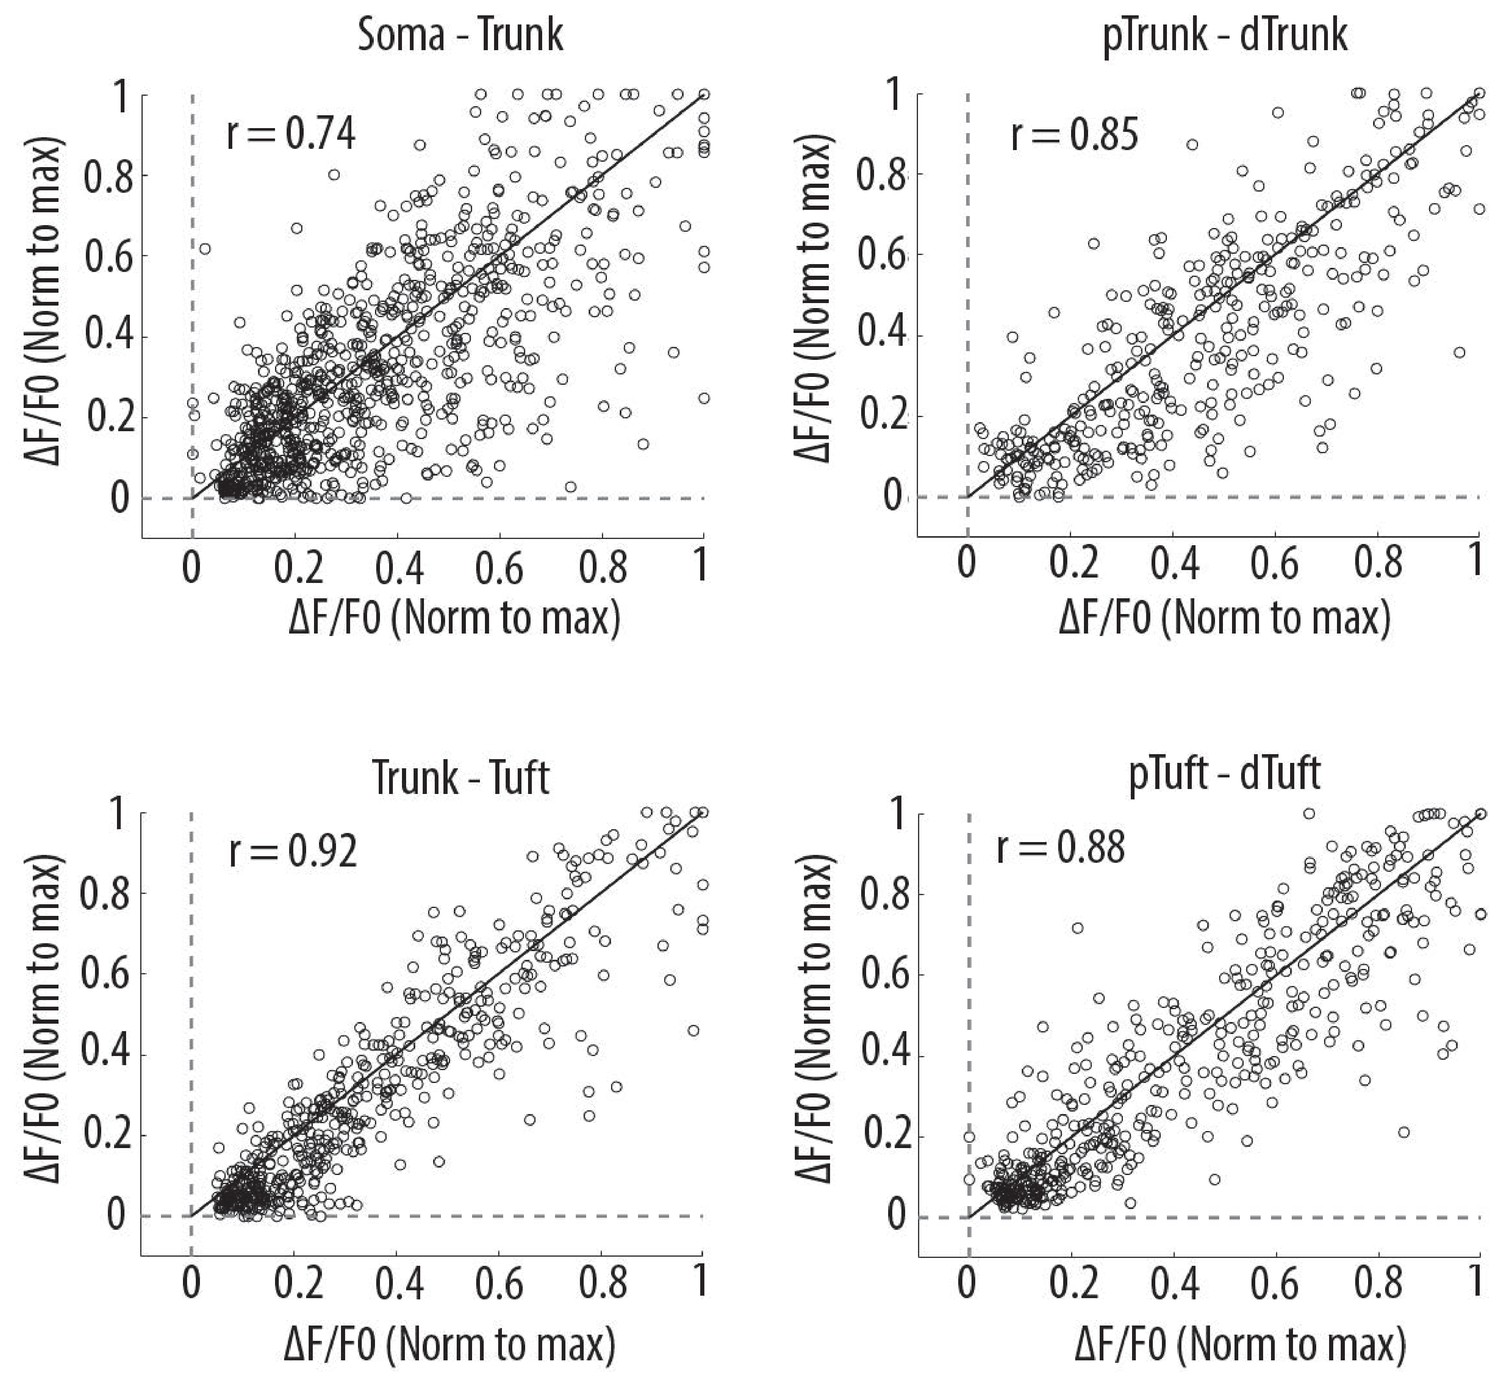
Scatter plots of peak amplitudes of individual calcium transients in all proximal and distal compartments imaged semi-simultaneously.
Each dot represents a calcium transient. Peak amplitudes were normalized to the maximum amplitude in each compartment. x-axis: proximal compartment; y-axis: distal compartment. Black line indicates the identity line. The mean Pearson’s correlation values (r) calculated per neuron, as reported in Figure 2D (i–iv), are indicated for each pair of compartment. Soma-Trunk, n = 858 transients from 11 neurons; pTrunk-dTrunk, n = 360 transients from 5 neurons; Trunk-Tuft, n = 479 transients from 9 neurons; pTuft-dTuft, n = 447 transients from 6 neurons; For visualization purpose, for Trunk-Tuft and pTuft-dTuft, only transients from one pair of imaged compartments per neuron are shown.
Figure 2—figure supplement 2
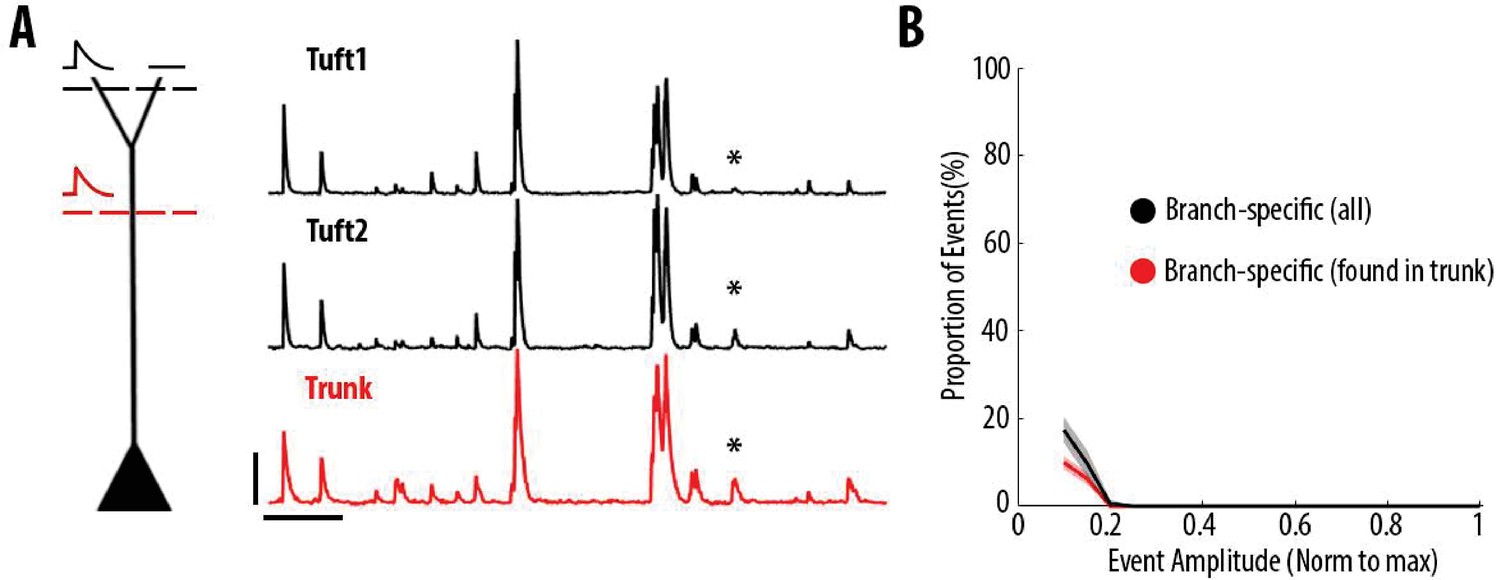
Most dendritic events detected as branch-specific were also detected in the trunk.
(A) Example ΔF/F0 traces of GCaMP6s calcium transients imaged semi-simultaneously in the trunk (red) and in two sibling apical tuft branches (black) of an individual layer 5 neuron. The asterisks indicate a calcium transient that was only detected in one of the two apical tuft branches (tuft 2) and thus classified as a branch-specific event. This transient was also detected in the trunk of the same neuron. Scale bars 0.25 ΔF/F0 (normalised to max), 20 s. (B) Proportion of apical tuft dendritic branch-specific events, as a function of GCaMP6s calcium transient amplitude. Black, all apical tuft dendrites events detected as branch-specific. Red, proportion of branch-specific events which were also simultaneously detected in the corresponding trunk. On average, 60% of branch-specific events were also found in the trunk.
Figure 3 with 1 supplement
Frequency of calcium transients decreases in a distance and amplitude-dependent dependent manner from the soma to the apical tuft.
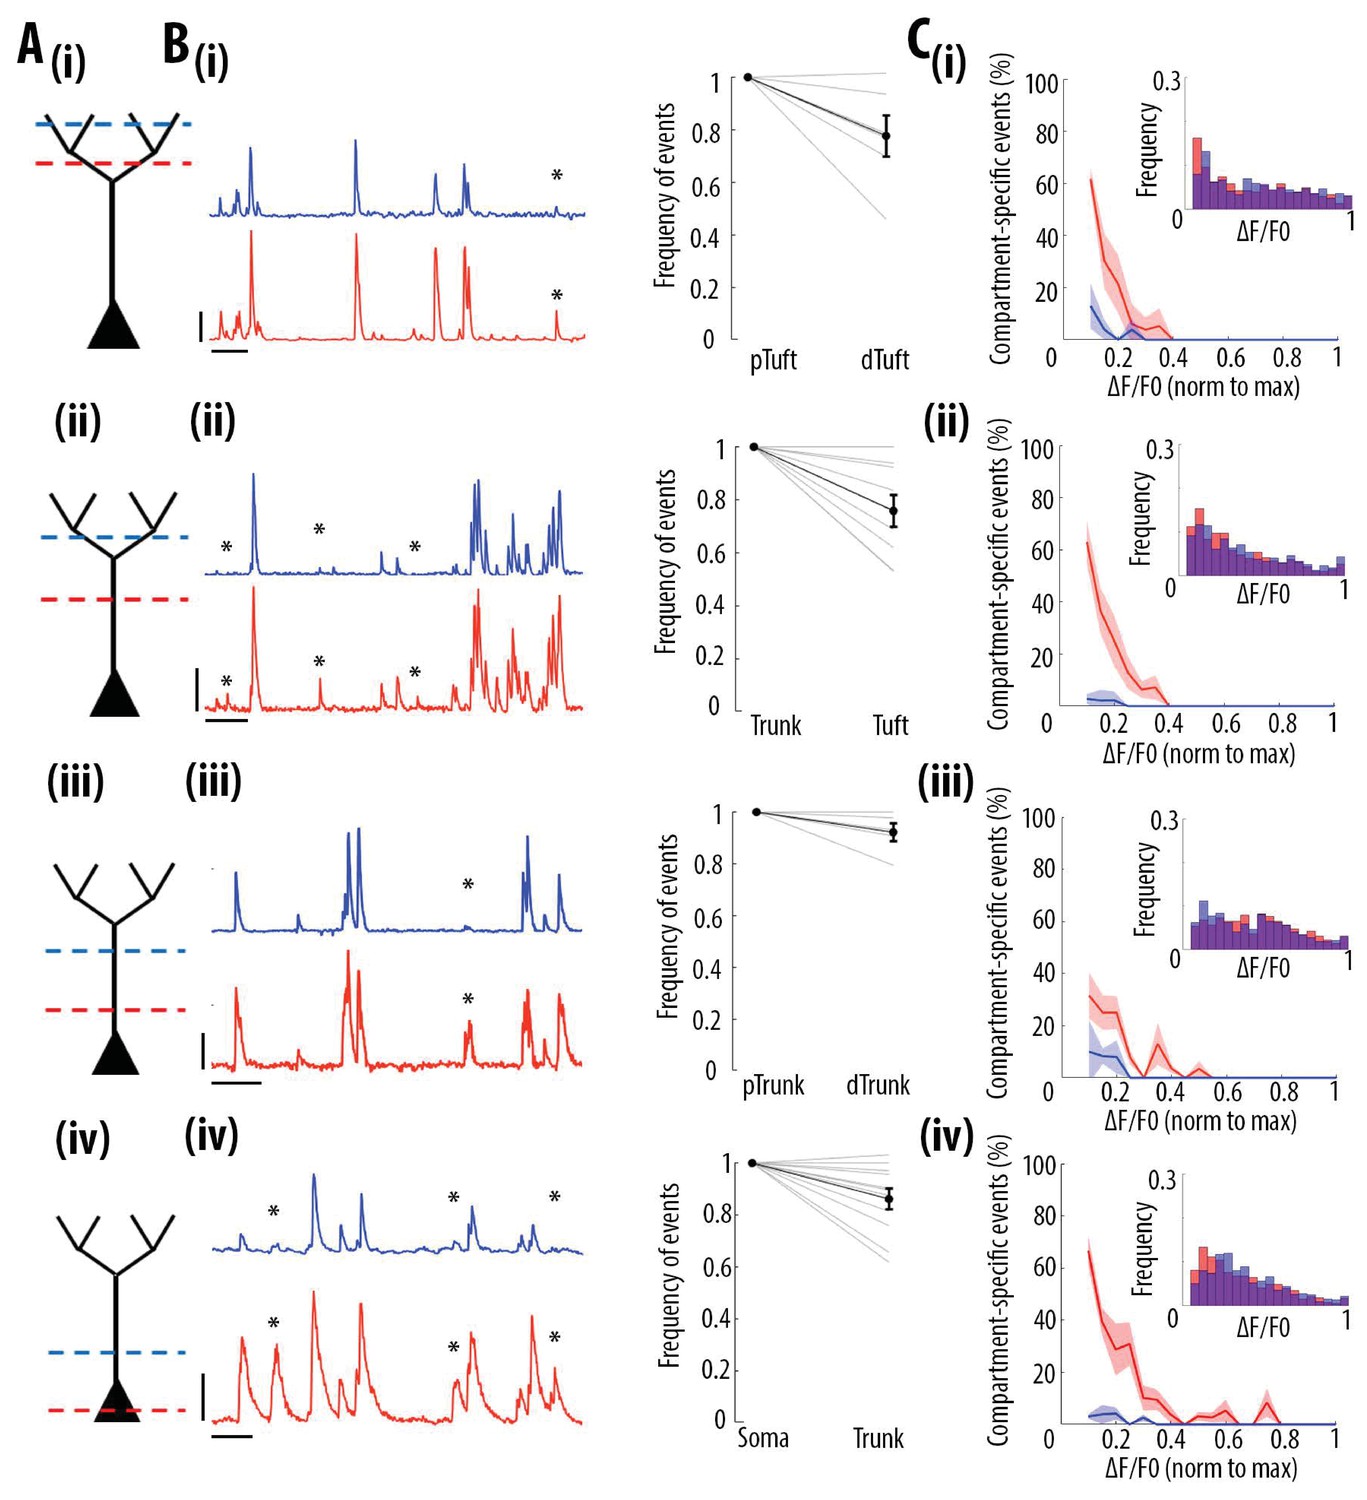
(A) Schemata of the neuronal compartments imaged simultaneously in individual layer 5 neurons. (B) Left panel, representative ΔF/F0 traces of GCaMP6s calcium transients imaged semi-simultaneously in two different compartments as indicated in panel A. Asterisks indicate calcium transients detected in the proximal compartment (red trace) and not detected in the distal one (blue trace). Scale bars 0.25 ΔF/F0 (normalised to max), 20 s. Right panel, frequency of detected calcium transients, normalised to the proximal compartment. Individual lines represent individual neurons. Error bar: SEM. (C) Proportion of compartment-specific events as a function of calcium transients’ amplitude. In red, proportion of events only detected in the proximal compartment. In blue, proportion of events only detected in the distal compartment. Thick line represents the weighted mean proportion. Shaded area represents the weighted sem for each bin (0.05). Upper right panel, frequency histogram of calcium transient peak amplitudes detected in the proximal (red) and distal (blue) compartments. Peak amplitudes were normalized to the maximum amplitude in each compartment. For all compartments, event amplitude, compartment (proximal vs distal) and an interaction between these two factors significantly affected the proportion of compartment-specific events (Two-way ANOVA, (i)pTuft-dTuft, p<10−15, p=7.8×10⁻⁵, p=6.2×10⁻⁸, for event amplitude, proximal versus distal compartment and interaction between amplitude and compartment, respectively, n = 6 pairs; (ii)Trunk-Tuft, p<10−15, p=3.4×10⁻⁹, p<10−15, n = 9; (iii) pTrunk-dTrunk, p=1.3×10⁻¹³, p=2.4×10⁻⁴, p=7×10⁻³, n = 5; (iv) Soma-Trunk, p<10−15, p<10−15 and p<10−15, n = 11).
Figure 3—figure supplement 1
Frequency decrease of calcium transients from soma to apical tuft.
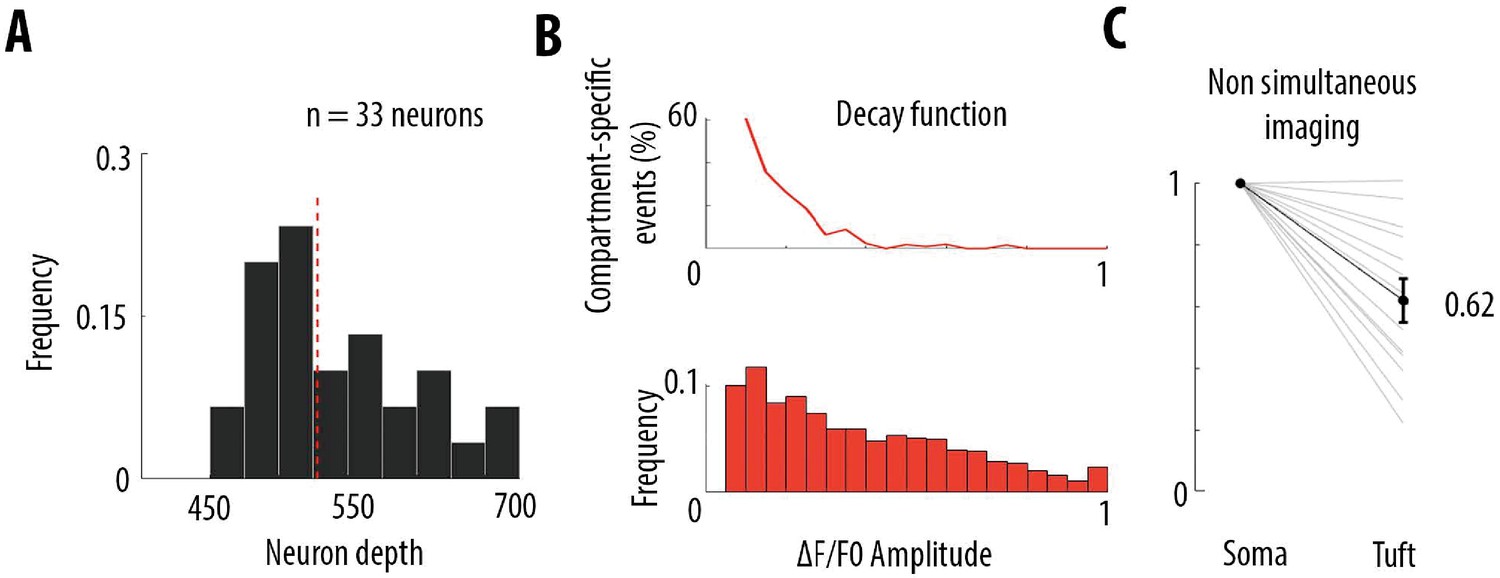
(A) Histogram distribution of the depths at which somata of neurons included in this study have been imaged. The red dotted line indicates the median (528 μm from the dura). (B) Estimation of the proportion of somatic calcium events not detected in the distal part of the apical tuft, for the data set in which pairs of compartments were imaged semi-simultaneously (Figure 3). Pairs of compartments (soma-trunk, trunk-trunk, trunk-tuft, tuft-tuft) were imaged at a distance of 170 μm (see Materials and methods). As a consequence, the average amplitude-dependent decay function of compartment-specific events (top panel, same as Figure 4A) represents the decay function within 170 μm. We projected the decay measured within 170 μm, to the distance between each soma and distal apical tuft, estimated by the depth of the soma from the dura (panel A). We multiplied the amplitude-dependent decay function by the corresponding scaling factor and we applied this scaled function to the frequency distribution of calcium transient amplitudes (lower panel) at each bin (0.05 ΔF/F0). The frequency distribution was derived by averaging all the calcium events in all proximal compartments (see distribution of event amplitudes for each proximal compartment in red in Figure 3C). Using this approach, we calculated that the proportion of somatic events that were not detected in the tuft was 39% (61% of coincident events). (C) Frequency of detected calcium transients in the apical tuft, normalised to the frequency of transients in the corresponding soma, for another data set in which both compartments were imaged non-simultaneously. Individual lines represent individual neurons (n = 13 neurons). Error bar: SEM.
Figure 4 with 1 supplement
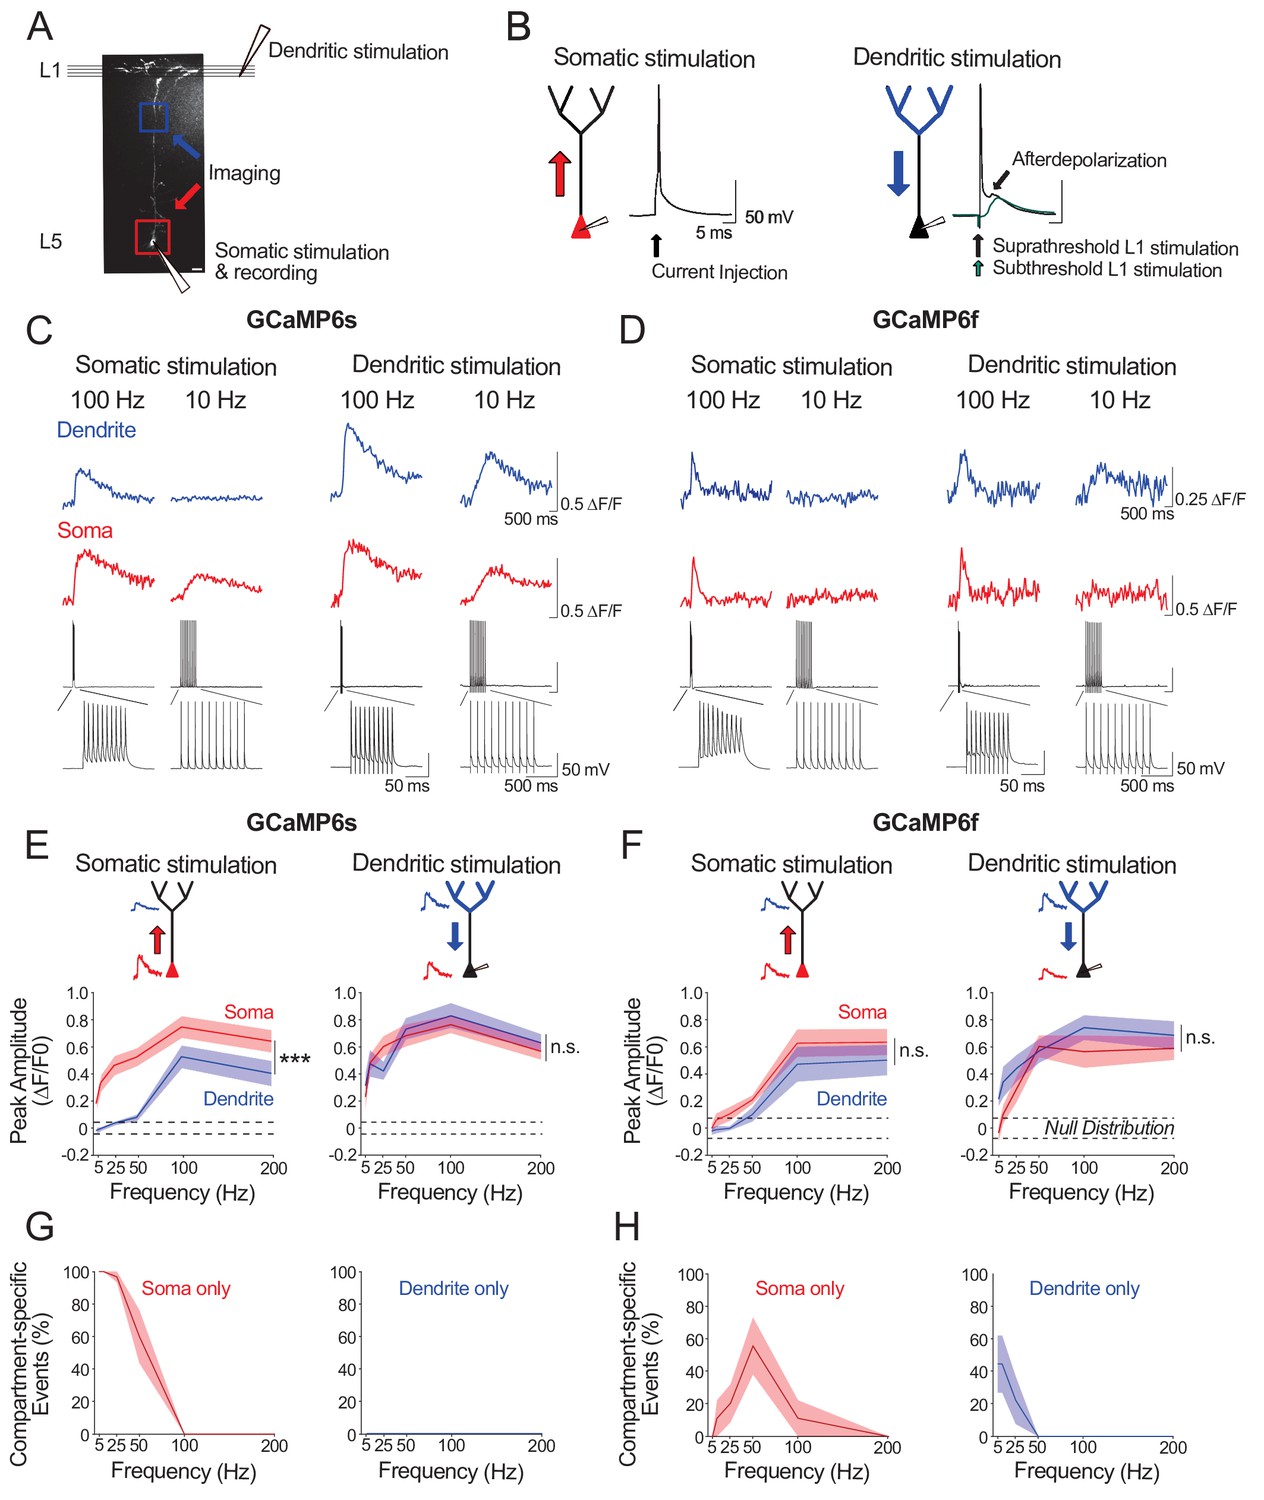
Ex vivo calibration of GCaMP6s and GCaMP6f signals in soma and apical tuft dendrites.
(A) Experimental schemata. Layer 5 pyramidal neurons expressing GCaMP6s or GCaMP6f were recorded using whole-cell patch clamp in acute cortical slices of the primary visual cortex. An example neuron is shown (scale bar = 20 μm). The soma and distal apical dendrite (nexus) were imaged during neuronal spiking, driven either by suprathreshold somatic current injection (somatic stimulation) or layer 1 (L1) stimulation (dendritic stimulation), respectively. Somatic and dendritic stimulation consisted of a train of 10 pulses delivered at 5–200 Hz. (B) Examples of action potentials driven by somatic and dendritic stimulation. Action potentials triggered by dendritic stimulation were additionally accompanied by an enhanced afterdepolarization reminiscent of a dendritic spike, which had a faster rise time than subthreshold EPSPs and were absent from somatically-evoked action potentials. (C, D) Example calcium transients imaged in the soma and apical dendrite during somatic and dendritic stimulation in a L5 neuron expressing GCaMP6s (C) and GCaMP6f (D). Concurrent somatic electrophysiological recordings are shown below each transient. Negative deflections in electrophysiological traces are stimulation artefacts that have been cut for clarity. (E, F) Average peak amplitude of calcium transients recorded in the soma (red) and dendrites (blue) during somatic and dendritic stimulation for GCaMP6s (E) and GCaMP6f (F). Null distribution of peak amplitudes from sham stimulation trials are shown (dashed horizontal lines). (G, H) Proportion of compartment-specific events detected either in the soma or dendrite during somatic or dendritic stimulation for GCaMP6s (G) and GCaMP6f (H). Shaded areas represent S.E.M. Significance was assessed with two way (E, F) and one way (G, H) repeated measures ANOVA with post-hoc Sidak tests. Asterisks (***) in (E,F) denote factor (soma vs dendrite) significance of p<0.0001; n.s. denotes non-significance; significance is not shown for other comparisons but is listed below. For somatic stimulation in (E): soma vs. dendrite: p<0.0001 for all frequencies; soma vs. null: p<0.0001 for all frequencies; dendrite vs null; p<0.0001 for frequencies > 50 Hz, p>0.44 for frequencies < 50 Hz. For dendritic stimulation in (E): soma vs. dendrite: p>0.11 for all frequencies; soma vs null: p<0.0001 for all frequencies; dendrite vs null: p<0.0001 for all frequencies. For somatic stimulation in (F): soma vs. dendrite: p>0.49 for>25 Hz, p=0.074 for 10 Hz, p=0.054 for 5 Hz; soma vs. null: p<0.0001 at>100 Hz, p=0.09 at 50 Hz, p>0.7 at<50 Hz; dendrite vs. null: p<0.0001 at>100 Hz; p>0.52 at<50 Hz. For dendritic stimulation in (F): soma vs. dendrite: p>0.32 for all frequencies; soma vs. null: p<0.0001 at>50 Hz, p<0.01 at 25 Hz, p>0.47 at<10 Hz; dendrite vs. null: p<0.0001 at>25 Hz, p<0.002 at 10 Hz, p=0.11 at 5 Hz. For somatic stimulation in (G): soma vs null: p<0.0001 for<50 Hz, p>0.44 for>100 Hz. For dendritic stimulation in (G): dendrite vs null: p>0.11 for all frequencies. For somatic stimulation in (H): soma vs null: p<0.0001 for 50 Hz; p>0.12 for all other frequencies. For dendritic stimulation in (H): dendrite vs null: p<0.02 for 5 Hz, p=0.10 for 10 Hz, p>0.48 for>25 Hz. GCaMP6s: n = 10 cells from 4 animals except for 5 Hz stimulation, where n = 5 cells from 3 animals; GCaMP6f: n = 9 cells from 3 animals.
Figure 4—figure supplement 1
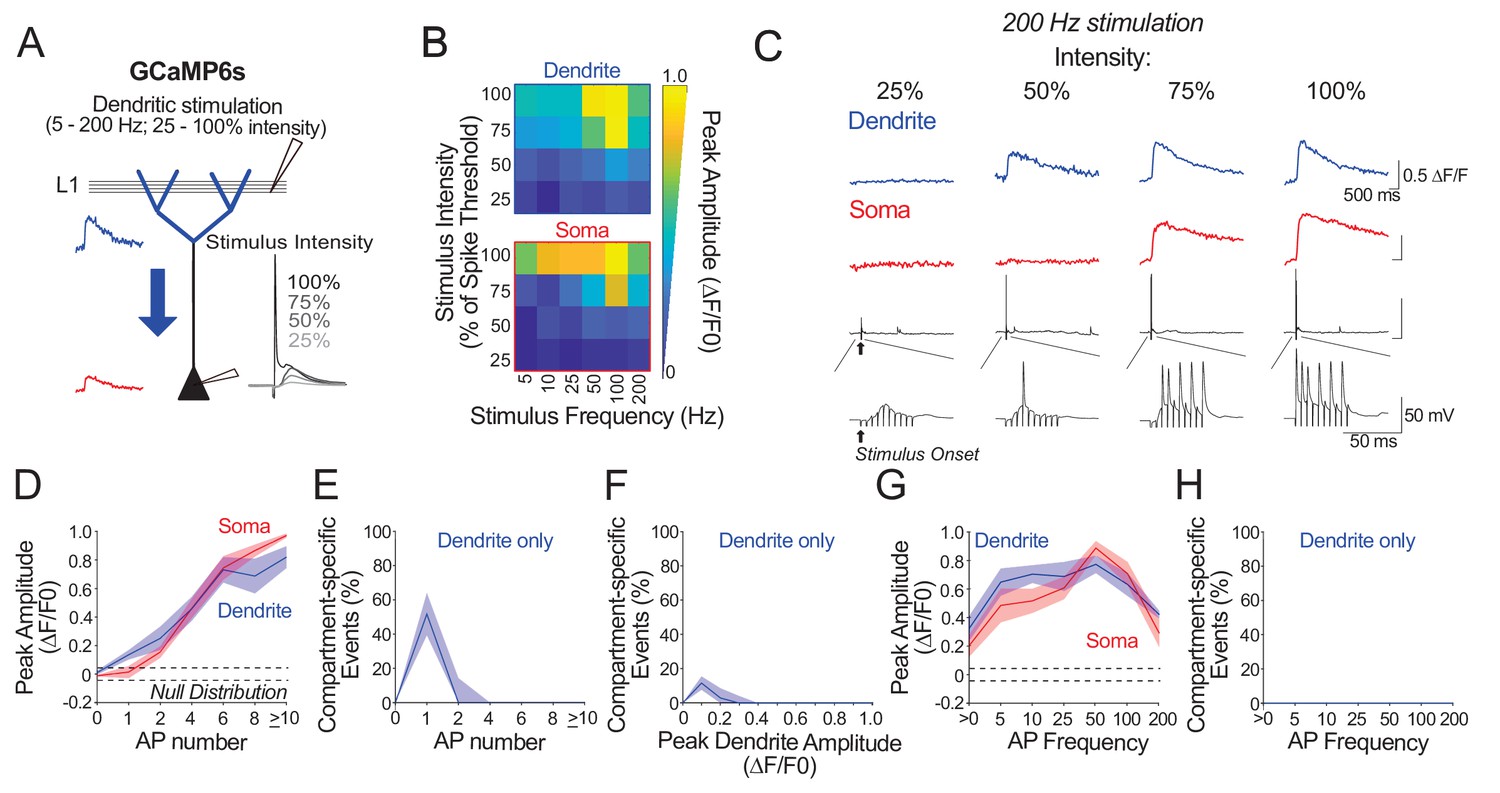
Ex vivo calibration of GCaMP6s in soma and apical tuft dendrites across subthreshold and suprathreshold dendritic stimulation parameters.
(A) Experimental schemata. Layer 5 pyramidal neurons expressing GCaMP6s were recorded using whole-cell patch clamp in acute cortical slices of the primary visual cortex. The soma and distal apical dendrite (nexus) were imaged during layer 1 (L1) stimulation. Stimulation consisted of a train of 10 pulses delivered at 5–200 Hz and at a stimulus intensity 25–100% of somatic spike threshold. Negative deflections in electrophysiological traces are stimulation artefacts that have been cut for clarity. (B) Average somatic and dendritic calcium fluorescence across stimulation parameters. (C) Example calcium transients imaged in the soma and apical dendrite during 200 Hz stimulation at a range of stimulus intensities. Concurrent somatic electrophysiological recordings are shown below each transient. Note that stimulation conditions evoking low somatic output (i.e. single action potential) can trigger detectable calcium events in the dendrite that are not detected in the soma. (D) Average peak amplitude of calcium transients imaged in the soma (red) and dendrites (blue) plotted against evoked action potential number. Trials were binned by the number of action potentials (APs) evoked by stimulation. Dendritic calcium events are larger than somatic events in trials evoking a single action potential. Null distribution of peak amplitudes from sham stimulation trials are shown (dashed horizontal lines). (E) Proportion of compartment-specific events detected only in the dendrite and not in the soma, plotted against action potential number. Somato-dendritic coupling is high except when stimulation evokes a single somatic spike. (F) As in E but trials were binned by the magnitude of evoked dendritic calcium fluorescence instead of evoked action potential number. (G, H) As in D, E but trials were binned by evoked action potential frequency instead of number, for all trials with more than one action potential. Calcium signals in both soma and apical tuft were reliably detected across somatic spiking frequencies. For frequencies higher than 100 Hz, average calcium signal amplitude decreased owing to a decrease in number of action potentials generated by high frequency stimulation (within the relative refractory period). Significance was assessed with two way (D, G) and one way (E, F, H) repeated measures ANOVA with post-hoc Sidak tests. (D): soma vs. dendrite: p<0.001 at 1 AP; p<0.01 at>10 AP; p>0.23 for remaining conditions. (E): soma vs. dendrite: p<0.0001 at 1 AP; p>0.56 for all other conditions. (F) soma vs. dendrite: p<0.01 at 0.1 ΔF/F0; p>0.36 for all other conditions. (G) dendrite vs. soma p=0.63. (H) p=0.87. n = 10 cells from 4 animals except for 5 Hz stimulation, where n = 5 cells from 3 animals. Shaded areas represent S.E.M.
Figure 5 with 2 supplements
Locomotion and visual stimulation do not alter the relationship between somatic and dendritic calcium transients in layer 5 pyramidal neurons.
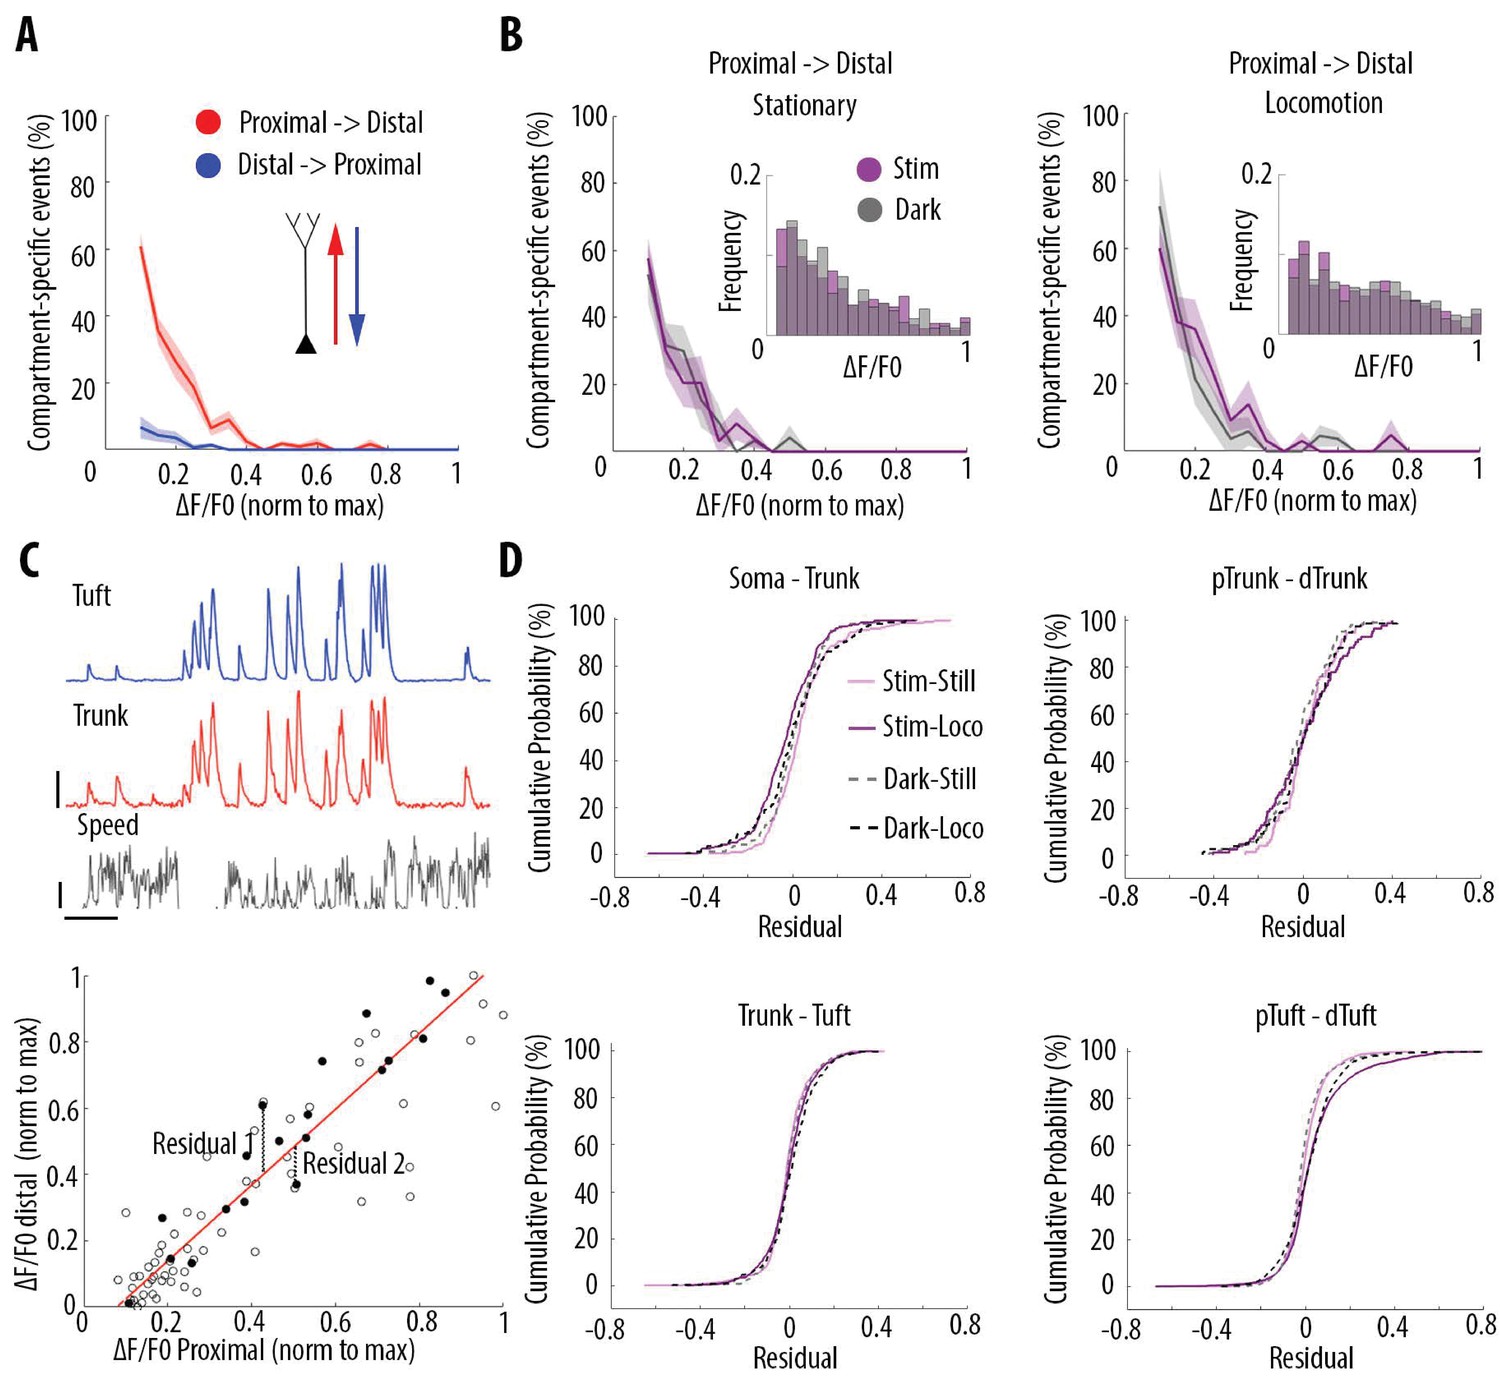
(A) Mean proportion of compartment-specific calcium transients as a function of calcium transient amplitude (average of data points from Figure 3C (i–iv)). In red, proportion of events only detected in the proximal compartment. In blue, proportion of events only detected in the distal compartment. Thick line and shaded area: weighted mean and sem for each bin (0.05), respectively. Event amplitude, compartment (proximal vs distal) and an interaction between these two factors significantly affected the proportion of compartment-specific events (Two-way ANOVA, p<10−15, p<10−15, p<10−15, n = 31 pairs of compartments from 19 neurons). (B) Proportion of compartment-specific events detected in the proximal compartment and not in the distal one, as a function of calcium transient amplitude, during periods of darkness (grey) and visual stimulation with drifting gratings (purple), while the animals were either stationary (left panel) or running (right panel). Upper right panel, frequency histogram of calcium transient peak amplitudes detected in proximal compartments during darkness (grey) and visual stimulation (purple). Peak amplitudes were normalized to the maximum amplitude in each compartment. Neither visual stimulation nor locomotion altered the function relating calcium transients amplitude with the proportion of compartment-specific events (Three-way ANOVA, p=0.69, p=0.21 and p=0.64 for visual stimulation, locomotion, and interaction respectively; p<10−15 for event amplitude. No other interaction was found to be statistically significant). (C) Upper panel, example traces of a proximal (trunk, red) and distal (tuft, blue) compartment imaged semi-simultaneously, during stationary and locomotion periods (black trace, speed). Scale bars, 0.25 ΔF/F0 (normalised to max), 12 cm/s, 20 s. Lower panel, example of scatter plot of calcium transients’ peak amplitudes imaged in a pair of neuronal compartments (trunk-tuft). Each dot represents an individual calcium transient. Filled dots correspond to the transients shown in the upper panel. The red line represents the robust linear regression fit. For each transient, a residual from the robust linear regression was calculated. (D) Cumulative distributions of the residuals calculated for each pair of compartments and for each condition: visual stimulation (pink, stim), darkness (grey, dark), stationary (still) and locomotion (loco) periods. No significant difference was found between any condition: Three-way ANOVA, p=0.96, p=0.23 and p=0.91 for visual stimulation, locomotion and interaction effect, respectively; p=0.86 for different neuronal compartments. No other interaction effect was found to be significant. n = 31 compartments (n = 11 Soma-Trunk; n = 5 pTrunk–dTrunk; n = 9 Trunk–Tuft; n = 6 pTuft-dTuft from 19 neurons).
Figure 5—figure supplement 1
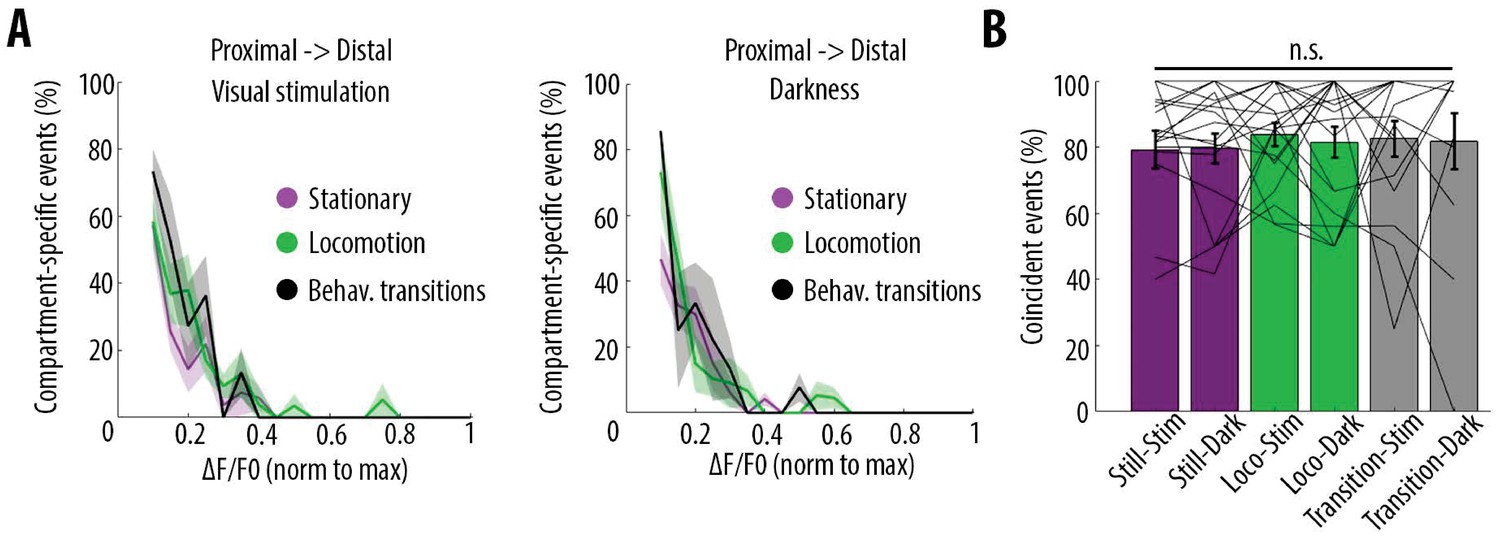
Behavioural-state transitions between stationary and locomotion do not alter the relationship between somatic and dendritic calcium transients.
(A) Proportion of compartment-specific events detected in the proximal compartment and not in the distal one, as a function of calcium transient amplitude, during periods of visual stimulation (left panel) and darkness (right panel), while the animals were either stationary (pink), running (green) or in transition between stationary and running (black). Periods of transition were excluded from stationary and locomotion periods. No significant difference was found between any condition (Three-way ANOVA, p=0.32, p=0.42 and p=0.64 for visual stimulation, behavioural state, and interaction respectively; p<10–15 for event amplitude; no other interaction was found to be statistically significant, n = 31 pairs of compartments from 19 neurons). (B) Proportion of coincident calcium transients in proximal and distal compartments imaged semi-simultaneously during the different behavioural conditions: visual stimulation (stim), darkness (dark), stationary (still), locomotion (loco) and transitions between stationary and locomotion (transition) periods. Each data point corresponds to one neuron. No significant difference was found across conditions (Two-way ANOVA on log-transformed data, p=0.93, p=0.87 and p=0.51 for visual stimulation, behavioural state and interaction effects, respectively).
Figure 5—figure supplement 2
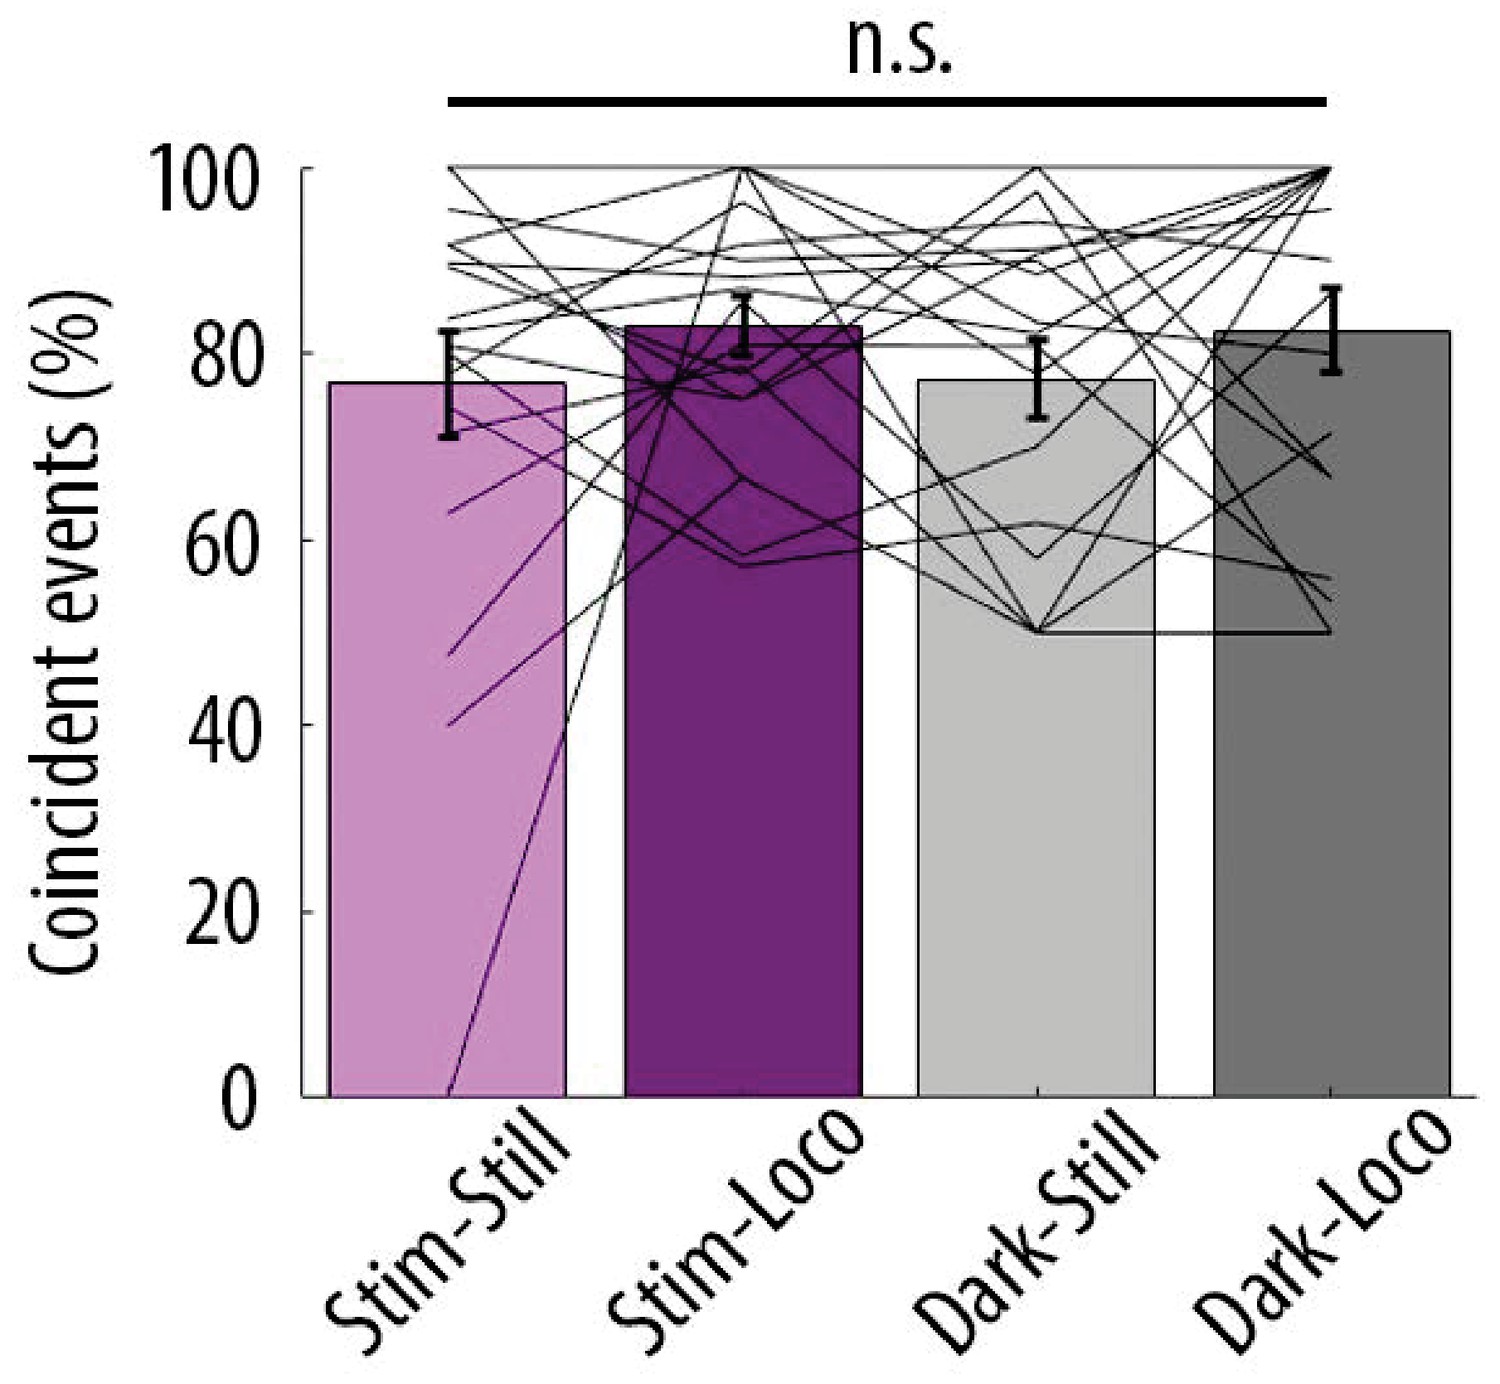
Proportion of coincident calcium transients in proximal and distal compartments imaged semi-simultaneously during the different behavioural conditions: visual stimulation (stim), darkness (dark), stationary (still) and locomotion (loco) periods.
Each data point corresponds to one neuron. No significant difference was found across conditions (Repeated Measures Two-way ANOVA on log-transformed data, p=0.43, p=0.29 and p=0.35 for visual stimulation, locomotion and interaction effects, respectively; n = 19 neurons). In contrast to Figure 4—figure supplement 1, periods of transition were not excluded from stationary and locomotion periods (see Materials and methods).
Figure 6
Orientation selectivity does not alter the relationship between somatic and dendritic calcium transients in layer 5 pyramidal neurons.
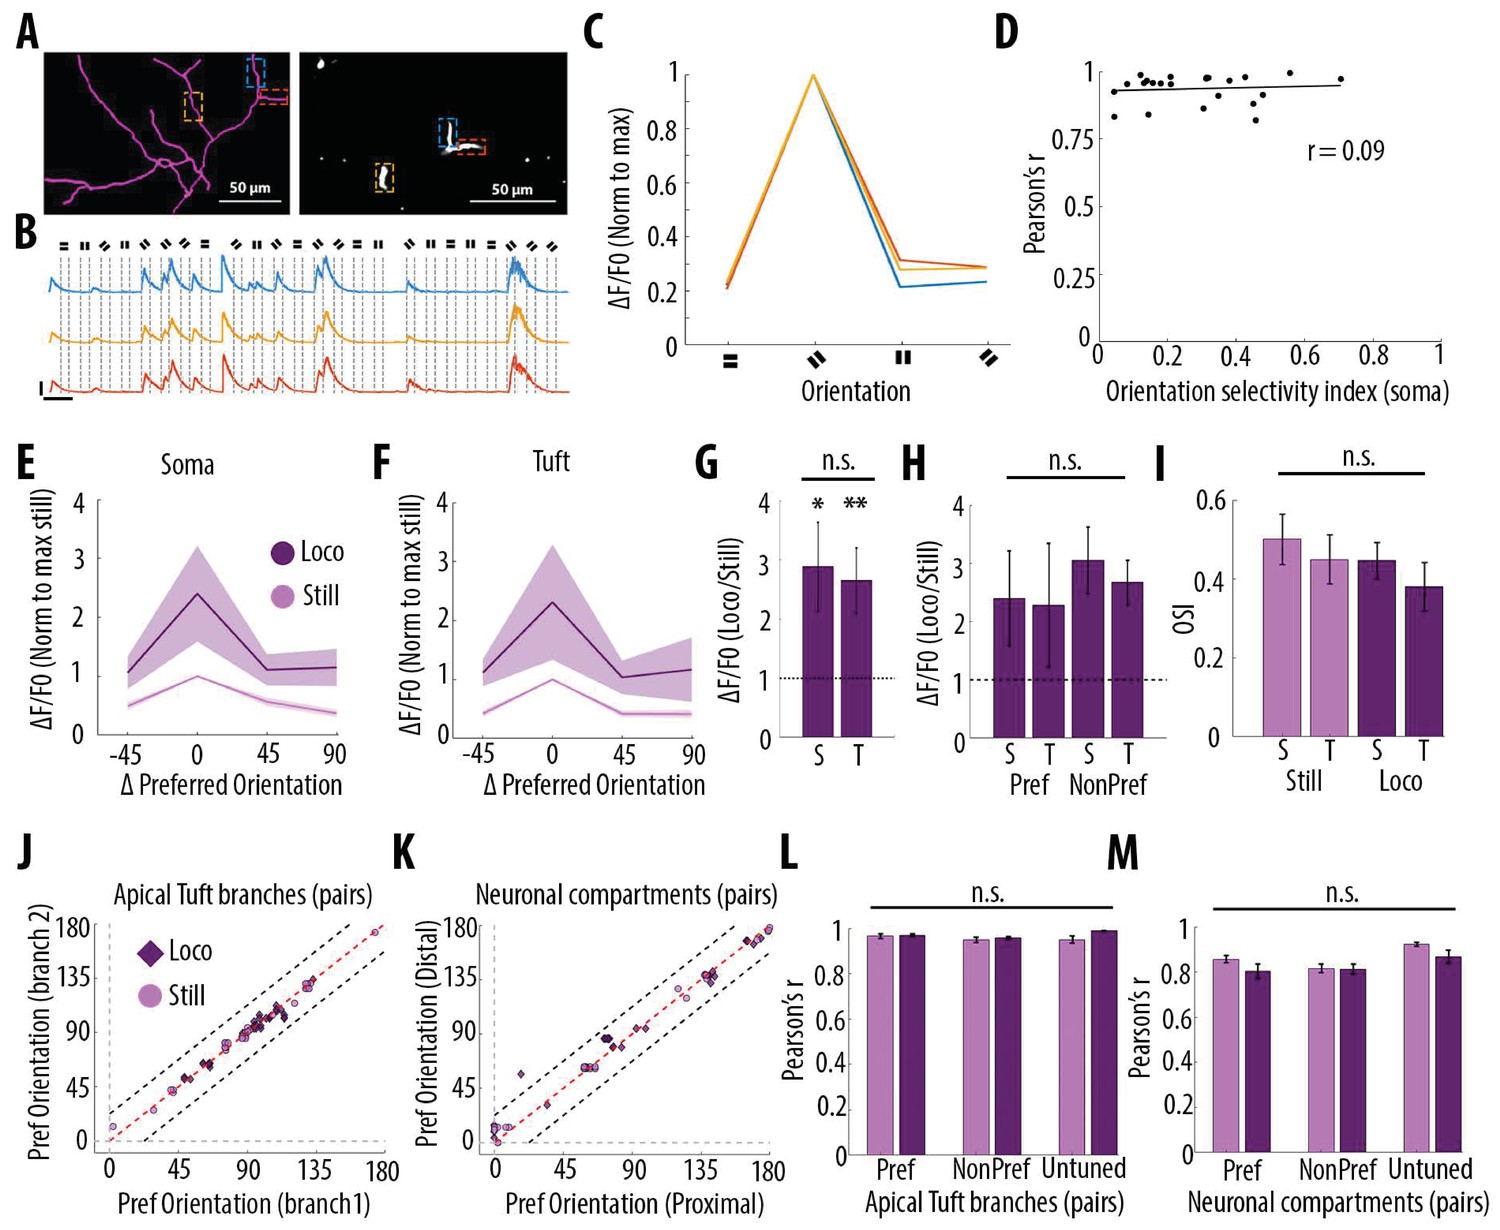
(A) Morphological reconstruction (left) and two-photon image (right) of apical tuft branches of one individual neuron imaged during the presentation of drifting gratings. (B) Example GCaMP6s transients from the dendritic branches indicated by coloured dashed lines in panel A, during the presentation of drifting gratings of four different orientations. Dotted lines indicate the beginning and the end of drifting gratings stimulation. Scale bars 0.3 ΔF/F0 (normalised to max), 10 s. (C) Tuning curve showing calcium transients amplitudes (normalised to max) in response to the four grating orientations (average of 24 presentations of each grating, ), from the three branches indicated by coloured dashed lines in panel A. (D) Mean Pearson’s correlation value of all imaged tuft dendritic branches per neuron, as a function of the orientation selectivity of the corresponding soma (each dot corresponds to one neuron; r2 = 0.09, p=0.67, n = 23 neurons). The straight black line represents the best fit line (least square). (E) Tuning curve of somatic calcium signals from orientation selective neurons (somatic OSI >0.3; n = 15 neurons) during stationary (still, pink) and locomotion (loco, purple) periods. Responses are normalised to the preferred orientation during stationary periods. Thick line and shaded area represent the mean and SEM, respectively. (F) Same as E, for the corresponding apical tuft branches of the same neurons. For each neuron, responses from all imaged apical tuft branches were averaged (n = 68 apical tuft branches from 15 neurons). (G) Relative increase in calcium transient amplitudes during locomotion compared to stationary periods both in soma (S) and in corresponding apical tuft dendrites (T), during drifting grating presentations. Locomotion significantly increase responses to drifting gratings both in soma and corresponding apical tuft dendrites (Repeated Measures Two-way ANOVA on log transformed data, p=0.02 and p=0.008 for the effect of locomotion on soma and tuft responses, respectively, n = 15 neurons) without a significant difference between compartments (Paired t-test, p=0.38; mean (normalised to stationary)=2.89 and 2.65, sem = 0.74 and 0.56; n = 15 soma and 15 apical tufts including 68 branches). (H) Same as G for responses to the preferred (Pref) and non-preferred (NonPref) orientations (Repeated measures Two-way ANOVA on log-transformed data, p=0.07, 0.71 and 0.28 for orientation, compartment and interaction effects respectively; mean = 2.4 and 2.28, sem = 0.81 and 1.06 for soma and apical tuft at the preferred orientation; mean = 3.05 and 2.67, sem = 0.57 and 0.38 for soma and apical tuft at the non-preferred orientation; n = 15 soma and 15 apical tufts). (I) Orientation selectivity index was not significantly different between somatic and corresponding tuft dendrites responses, both during stationary (still) and locomotion (loco) periods (Repeated measures Two-way ANOVA, p=0.49, p=0.42 and p=0.45, for the effects of locomotion, neuronal compartment (soma vs tuft) and interaction, respectively; mean = 0.5; 0.45, sem = 0.06, 0.06 for soma and apical tuft during stationary and mean = 0.45; 0.38, sem = 0.05, 0.06 for soma and apical tuft during locomotion, respectively; n = 15 soma and 15 apical tuft including 68 branches). (J) Scatter plot of the preferred orientation in pairs of apical tuft branches belonging to the same neuron and imaged simultaneously, during stationary (pink circles) and locomotion (purple diamonds) periods (n = 31 pairs). Dashed red line: identity line; Dashed black lines: identity +/- 22.5 degrees. (K) Same as J for pairs of neuronal compartments imaged simultaneously. n = 33 pairs. (L) Pearson’s correlation of calcium transients between pairs of apical tuft branches belonging to the same orientation-selective neuron, during the presentation of the preferred (Pref) and non-preferred (NonPref) grating orientations, both during stationary (pink) and locomotion (purple) periods (n = 31 pairs). Correlation values from branches belonging to non-selective neurons (OSI <0.3, untuned), during the presentation of all oriented gratings, are shown on the right columns (n = 10 pairs). Neither gratings orientation nor locomotion significantly affected the correlation between pairs of branches (Two-way ANOVA, p=0.20, p=0.07 and 0.38 for orientation, locomotion and interaction effect, respectively). (M) Same as L, for different neuronal compartments (Two-way ANOVA, p=0.27, p=0.09 and 0.43 for orientation, locomotion and interaction effect, respectively; n = 33 pairs for Pref, NonPref and 36 pairs for untuned). Error bars: SEM.
Videos
Video 1
Two-photon imaging movie showing calcium signals detected in the soma and not detected in the corresponding trunk of an individual layer 5 pyramidal neuron in V1.
Left panel, two-photon calcium imaging (raw data) for a pair of neuronal compartments (Soma-Trunk) imaged semi-simultaneously. Both the soma (lower quadrant, circled in red) and the corresponding trunk (upper quadrant, circled in blue) of an individual layer 5 pyramidal neuron are shown. Right panel, GCaMP6s signals of the two compartments (red for Soma, blue for Trunk) shown in the video on the left panel. Data were acquired at 4.8 Hz per plane. The two fields of view were 170 µm apart in the coronal plane. Scale bars: 10 s and 0.2 ∆F/F0 (normalised to max).
Video 2
Two-photon imaging movie showing calcium signals detected in the apical trunk and not detected in the corresponding tuft of an individual layer 5 pyramidal neuron in V1.
Left panel, two-photon calcium imaging (raw data) for a pair of neuronal compartments (Trunk-Tuft) imaged semi-simultaneously. Both the apical trunk (lower quadrant, circled in red) and the corresponding tuft (upper quadrant, circled in blue, three branches) of an individual layer 5 pyramidal neuron are shown. Right panel, GCaMP6s signals of the two compartments (red for Trunk, blue for Tuft (upper right branch)) shownin the video on the left panel. Data were acquired at 4.8 Hz per plane. The two fields of view were 170 µm apart in the coronal plane. Scale bars: 5 s and 0.2 ∆F/F0 (normalised to max).
Additional files
Download links
A two-part list of links to download the article, or parts of the article, in various formats.
Downloads (link to download the article as PDF)
Open citations (links to open the citations from this article in various online reference manager services)
Cite this article (links to download the citations from this article in formats compatible with various reference manager tools)
High and asymmetric somato-dendritic coupling of V1 layer 5 neurons independent of visual stimulation and locomotion
eLife 8:e49145.
https://doi.org/10.7554/eLife.49145


