Extracellular Pgk1 enhances neurite outgrowth of motoneurons through Nogo66/NgR-independent targeting of NogoA
- Mackay Medical College, Taiwan
- National Taiwan University, Taiwan
- Buddhist Tzu Chi Medical Foundation, Taiwan
- Buddhist Tzu Chi General Hospital and Tzu Chi University, Taiwan
Figures
Figure 1 with 4 supplements
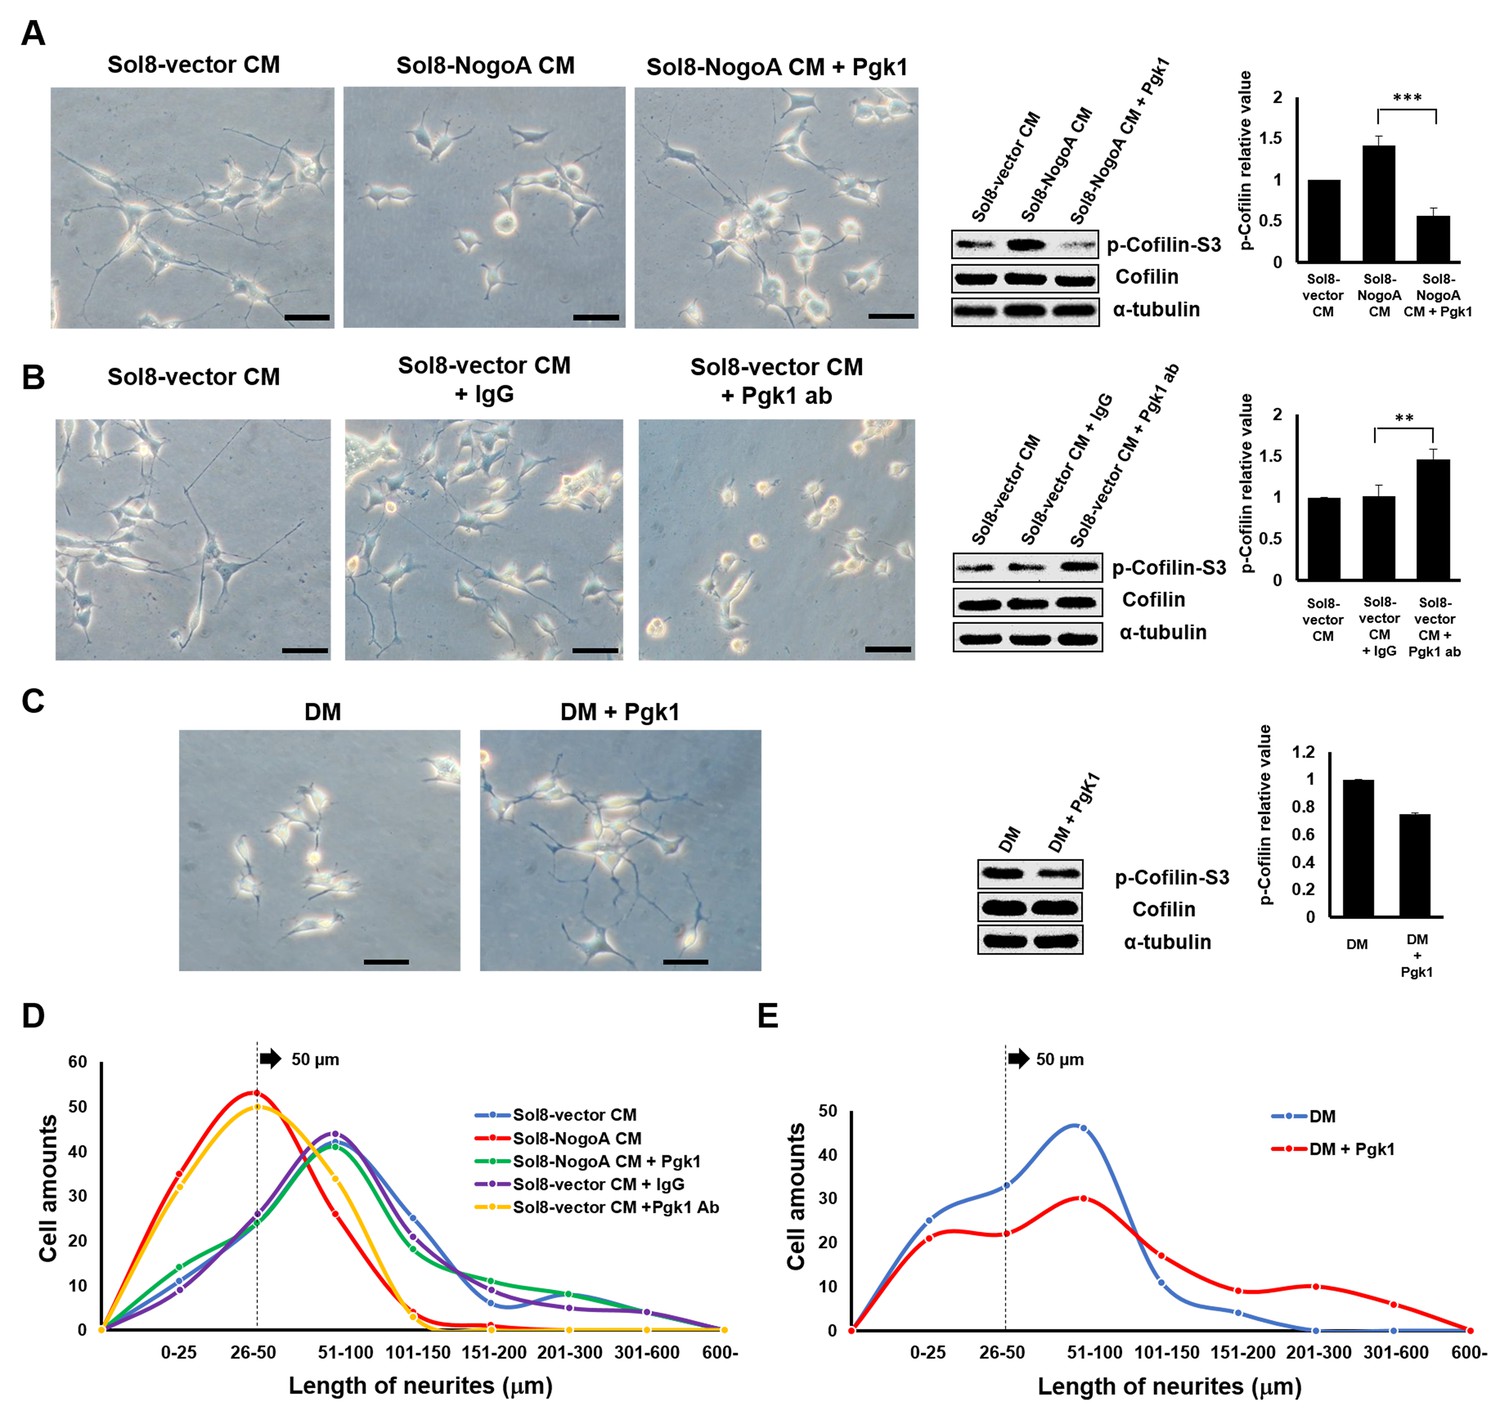
Supplementary addition of Pgk1 in culture medium promotes neurite outgrowth developed from NSC34 cells.
(A) Neurite outgrowth of motoneurons developed from NSC 34 motoneuron cells cultured in either Sol8-vector CM or Sol8-NogoA CM with and without Pgk1 addition. (B) Neurite outgrowth and p-Cofilin-S3 expression in NSC34 cells cultured in Sol8-vector CM without Pgk1. Rabbit IgG (control) and Pgk1 antibody were separately added into Sol8-vector CM. (C) Neurite outgrowth of motoneurons developed from NSC34 cells cultured in differentiation media (DM) with or without Pgk1 addition. (A-C) Right panels: Western blot analysis of total Cofilin and p-Cofilin-S3 contained in NSC34 cells. Statistical analysis used Student’s t-test (***, p<0.001; **, p<0.01). (D–E) The patterns of neurite length distribution. Cell number with various lengths of neurites of NSC 34 cells cultured by (D) CM obtained from Sol8-vector, Sol8-NogoA with or without Pgk1 addition, Sol8-vector with IgG and with Pgk1 antibody addition, as indicated, and by (E) DM with or without containing Pgk1 was determined (120 cells per experimental condition).
Figure 1—figure supplement 1
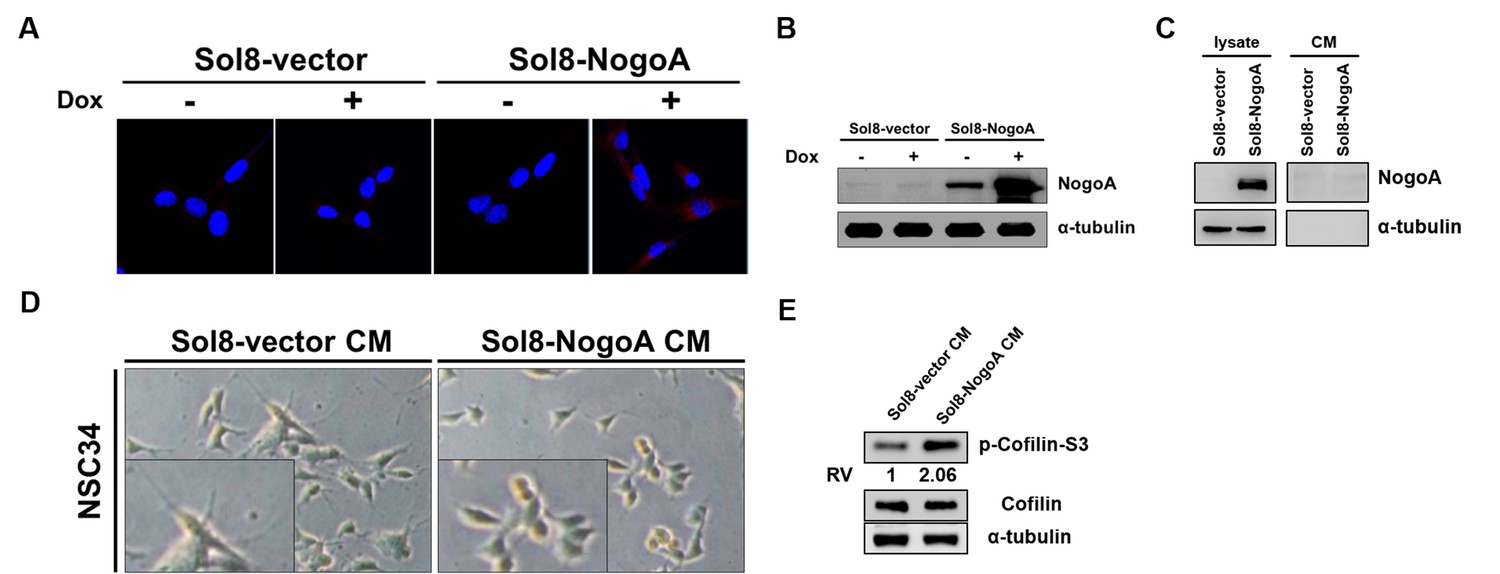
Conditioned media used to culture myoblasts overexpressing NogoA inhibited the neurite outgrowth of motor neurons.
(A) Cell lines harboring Sol8-vector (Sol8-vector) and Sol8-vector with NogoA insert (Sol8-NogoA) were induced with Dox. Antibody against c-Myc, which was used to recognize recombinant Myc-tagged NogoA expressed in cells, resulted in red fluorescence signal when immunostaining was carried out on cells before (-) and after (+) induction. (B) Western blot analysis using antibody against NogoA indicated its overexpression after Dox induction. The α-tubulin served as internal loading control. (C) Western blot analysis using NogoA antibody to detect NogoA in cell lysate and conditioned medium (CM). After Sol8-vector- and Sol8-NogoA-containing muscle cells were induced by Dox after 48 hr, NogoA overexpression was detected in Sol8-NogoA cell lysate, while NogoA was not detected in CM. (D) Morphological observation of motoneuron cells (NSC34) after incubation in CM obtained from myoblasts harboring Sol8-vector and Sol8-NogoA for 48 hr. The length of neurite outgrowth derived from motoneurons was clearly observed in the magnified photos. (E) Western blot analyses using antisera against phosphorylated Cofilin (p-Cofilin-S3), total Cofilin and α–tubulin (loading control).
Figure 1—figure supplement 2
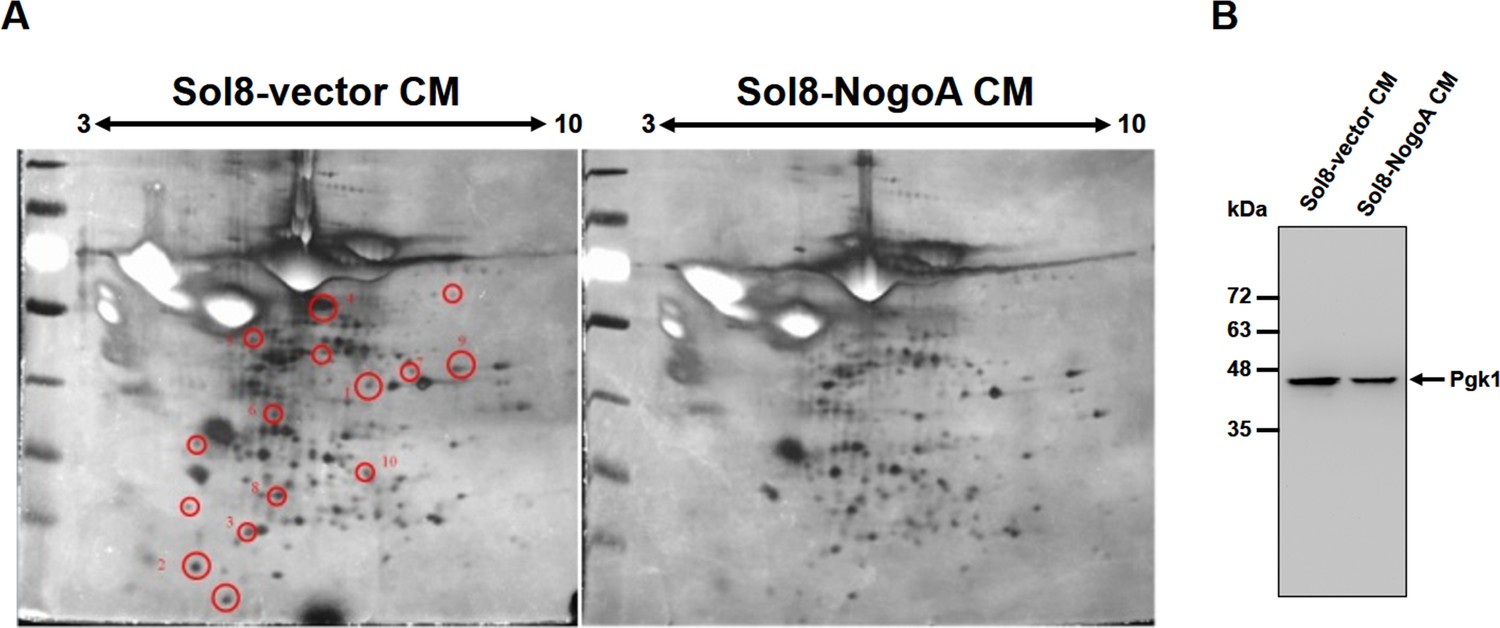
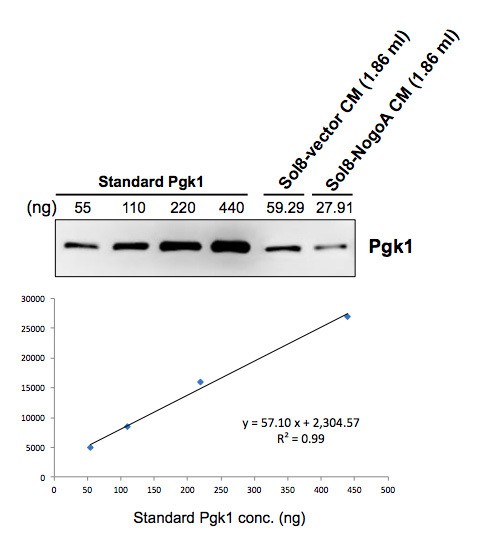
Comparison of protein patterns of conditioned medium from culturing myoblasts with and without overexpressing NogoA.
(A) Two-dimensional SDS polyacrylamide gel electrophoresis (SDS-PAGE) was used to analyze the total secreted proteins contained in the conditioned medium (CM) from culturing myoblasts harboring Sol8-vector and Sol8-vector with a NogoA-insert (Sol8-NogoA). SDS-PAGE was performed on a 13 cm-long gel strip, 10% acrylamide and 320 μg loading proteins. Spots reduced in Sol8-vector CM compared to Sol8-NogoA CM were selected (indicated by circles), isolated and subjected to in-gel digestion and mass spectrometry to identify protein species. (B) Western blot analysis using antibody against Pgk1. The protein levels of Pgk1 in Sol8-vector CM and Sol8-NogoA CM were compared. Total proteins were loaded in the amounts of 20 μg for Sol8-vector CM and Sol8-NogoA CM, respectively.
Figure 1—figure supplement 3
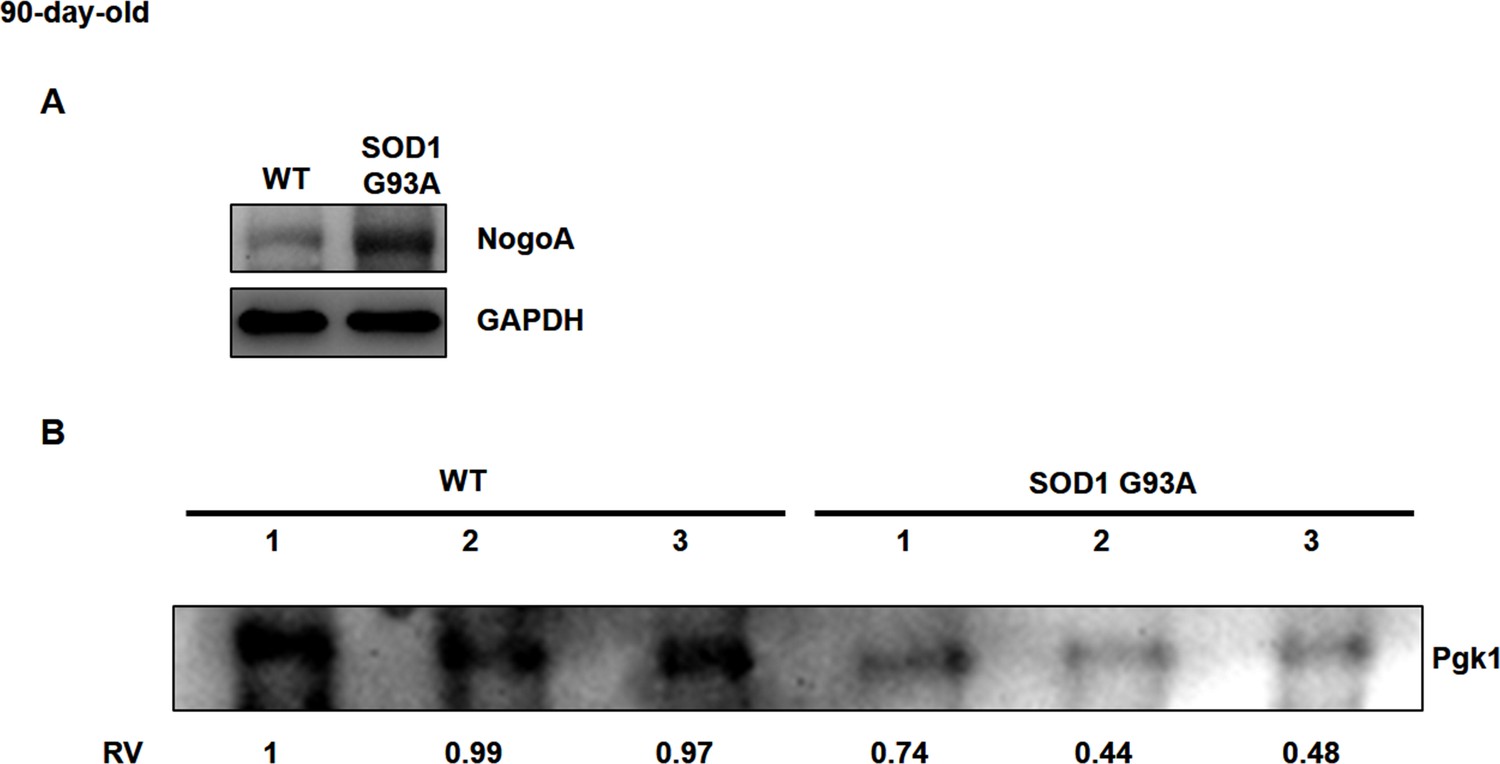
Using Western blot analysis to detect the protein level of Pgk1 in serum of mouse.
(A) The NogoA expression level in Gastrocnemius muscle of WT and SOD1 G93A transgenic mice at 90 days old. The GAPDH served as internal control for Western blot. (B) The sera were extract from three wild-type (WT) and three SOD1 G93A transgenic mice at 90 days old. The total loading amount of proteins was 80 µg. The intensity of Pgk1 shown in #1 of WT was defined as 1, and the Relative Value (RV) of Pgk1 level of each sample was measured. Compared with WT mice, the content of Pgk1 in the sera of three SOD1 G93A mice was significantly lower.
Figure 1—figure supplement 4
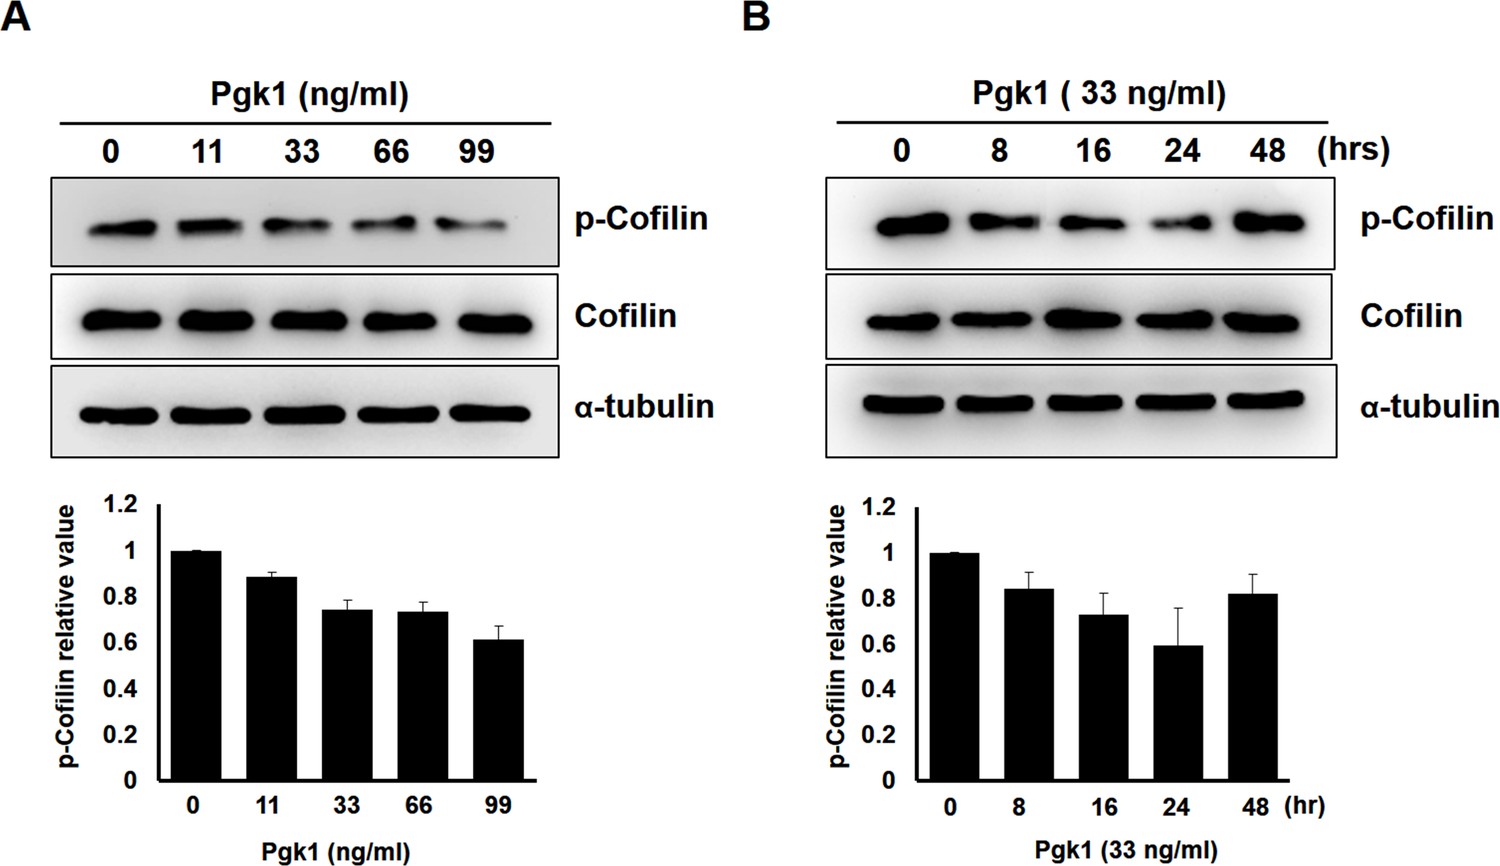
The expression of p-Cofilin-S3 in NSC34 cells treated with different doses of Pgk1 and a time course induction.
Upper panels: using Western blotting to quantify the levels of phosphorylated form of Cofilin (p-Cofilin-S3) and total form of Cofilin (Cofilin) expressed in NSC34 neuronal cells treated with (A) different concentrations of additive Pgk1 in culture medium and (B) different culture time with Pgk1 at a constant concentration as indicated. The α-tubulin served as the internal control. Lower panels: the relative expression levels of p-Cofilin and Cofilin were normalized by α-tubulin expressed in each group, and the expression level of control group was standardized as 1. Data were averaged from three independent trials.
Figure 2

Supplementary addition of Pgk1 enables more NSC34 cells cultured in Sol8-NogoA CM to differentiate into mature motor neurons.
Immunofluorescence staining of NSC34 cells cultured in (A) Sol8-vector CM, (B) Sol8-NogoA CM, and (C) Sol8-NogoA CM plus Pgk1. DAPI was labeled by blue fluorescent signal to mark nucleus, and acetyl-tubulin was labeled by green signal, while Syn1 was labeled by red signal. The growth cone of NSC34 cells was marked with white arrowheads. Scale bar, 20 μm. (D) In total, 110 to 120 cells were randomly selected from each culture group, and the number of Syn1-positive cells with growth cone was counted as a percentage. (E) Western blotting analysis was performed to quantify the expression levels of MAP2, GAP43, Syn1 and ChAT from three treatment groups. α-tubulin served as internal control. The relative value of each examined protein was used for comparison among the three groups when the value obtained from the Sol8-vector CM group was normalized as 1. Data were averaged from three independent experiments. Statistical analysis used Student’s t-test (***, significant difference at p<0.001; **, p<0.01; *, p<0.05).
Figure 3
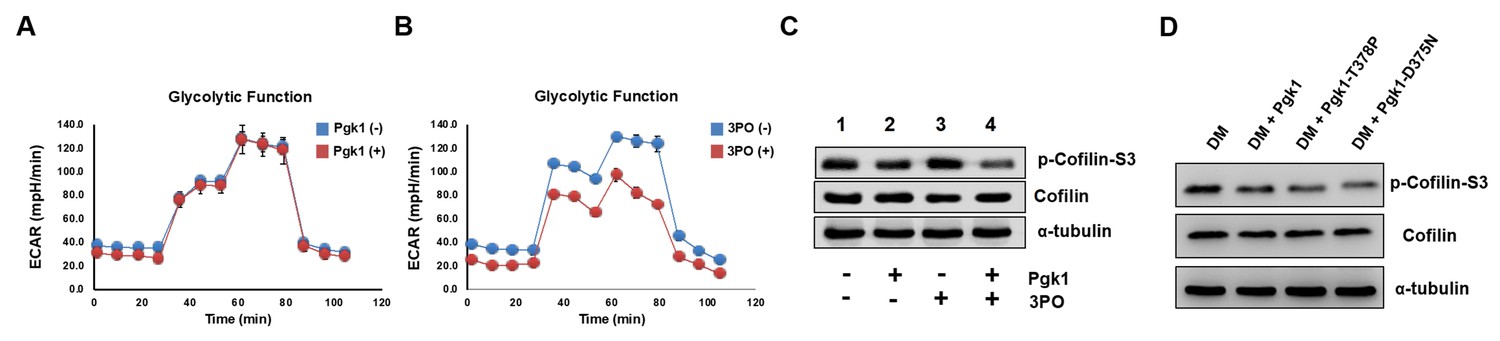
Enhancement of neurite outgrowth, as mediated by supplementary addition of Pgk1, is independent of metabolic glycolysis.
(A) Analysis of glycolytic function in NSC34 cells cultured in DM with or without the addition of Pgk1 or in (B) glycolysis inhibitor 3PO. (C) Western blot analysis of total Cofilin, p-Cofilin-S3, and protein control marker (α-tubulin) of NSC34 cells cultured in conditions, as indicated. (D) Western blot analysis of total Cofilin, phosphorylated Cofilin (p-Cofilin-S3), and protein control marker (α-tubulin) of NSC34 cells cultured in DM containing Pgk1 and its catalytic mutants, Pgk1-T378P and Pgk1-D375N. All of the above data were averaged from three independent experiments.
Figure 4 with 2 supplements
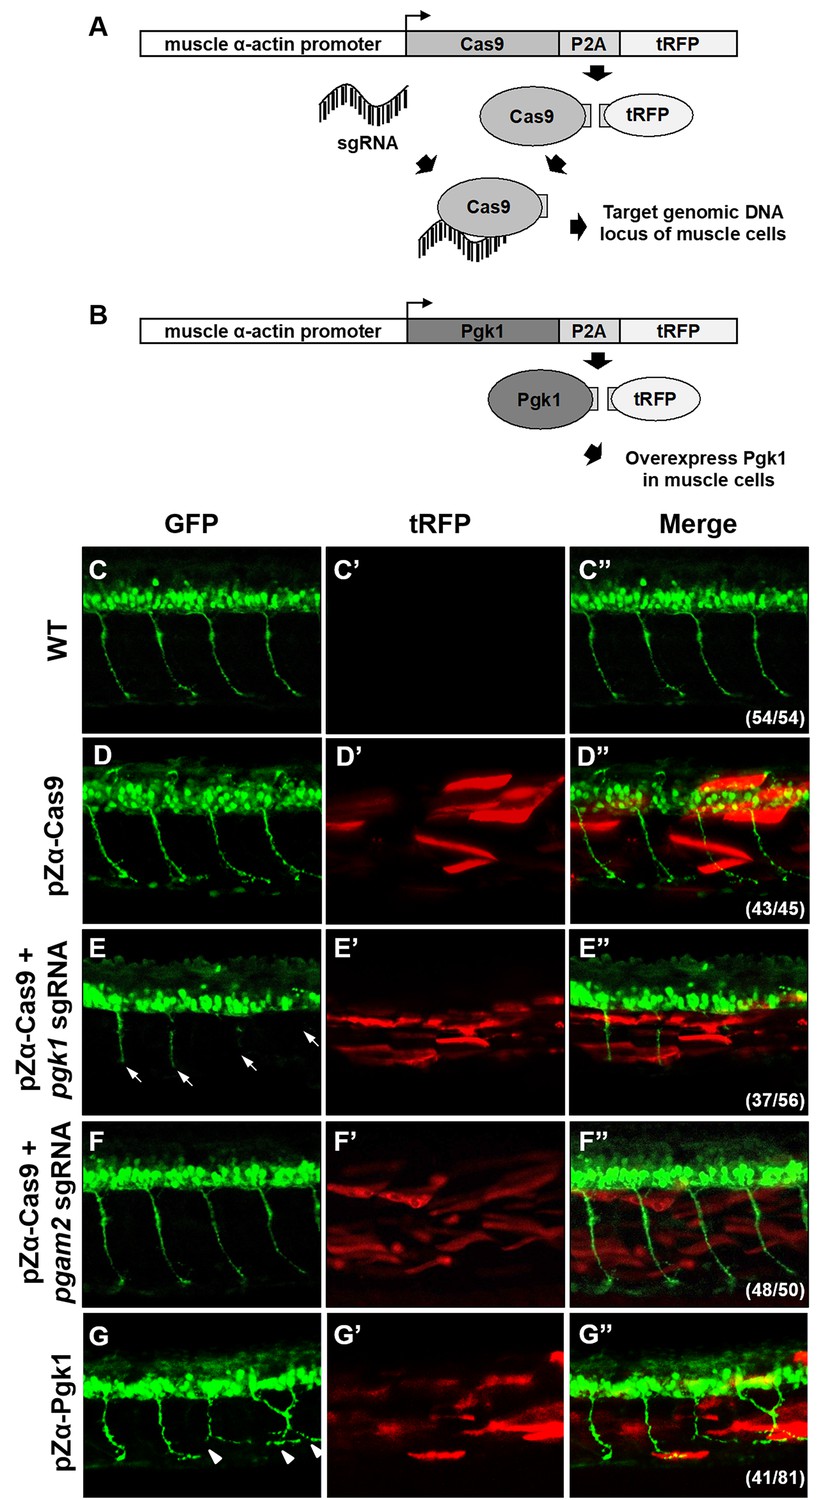
Muscle-specific overexpression of Pgk1 enhances NOM in zebrafish embryos.
(A) Diagram of plasmid pZα-Cas9. The Cas9-P2A-tRFP cassette is driven by zebrafish muscle-specific α-actin promoter. The fusion protein Cas9-P2A-tRFP expressed in muscle cells is digested into Cas9, which is bound by transferred sgRNA, resulting in silencing the target gene in muscle cells. (B) Diagram of plasmid pZα-Pgk1. Pgk1 is specifically overexpressed in muscle cells. (C–G) Injection of different materials, as indicated, into embryos from transgenic line Tg(mnx:GFP) and observation of fluorescent signals expressed in embryos at 30-hpf. GFP-labeled motor neurons observed under confocal microscopy. (C’–G’) Location of RFP-labeled muscle cells in which Cas9 and/or Pgk1 is overexpressed. (C’’–G’’) Two fluorescent signals were merged. Numbers shown in the lower right corner were the number of phenotypes out of total examined embryos. (C–C”) Untreated embryos served as the control group. (D–D”) Injection of pZα-Cas9. NOM was not affected. (E–E”) Injection pZα-Cas9 combined with pgk1 sgRNA. The length of NOM became shorter (white arrows). (F–F”) Injection of pZα-Cas9 combined with pgam2 sgRNA (served as negative control). The NOM was not affected. (G–G”) Injection of pZα-Pgk1. The NOM became increasingly ectopic toward the muscle cells in which Pgk1 was overexpressed (white arrowheads).
Figure 4—figure supplement 1
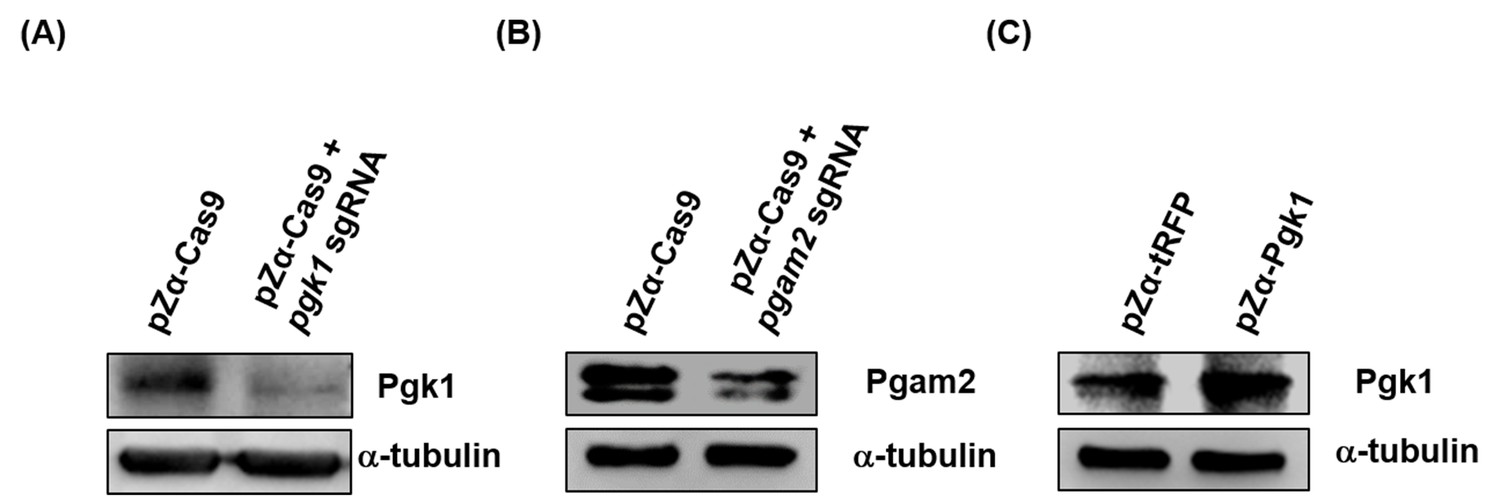
Western blot analysis to detect Pgk1 protein level in the muscle of zebrafish embryos.
When zebrafish embryos injected with different materials, as indicated, developed at 30 hpf, a total of 800,000 red-fluorescent-expressing muscle cells were isolated by FASE sorting, followed by detecting the protein level of intracellular Pgk1. (A) Embryos injected with pZα-Cas9 (Cas9 fused with tRFP) with or without pgk1 sgRNA. Compared to pZα-Cas9-injected embryos (control group), Pgk1 was reduced in the muscle cells of embryos injected with pZα-Cas9 plus pgk1 sgRNA. (B) Embryos injected with pZα-Cas9 with or without pgam2 sgRNA. Compared to pZα-Cas9-injected embryos (control group), Pgam2 expression was reduced in the muscle cells of embryos injected with pZα-Cas9 plus pgam2 sgRNA. (C) Embryos injected with either pZα-tRFP or pZα-Pgk1 (Pgk1 fused with P2A peptide and tRFP). Compared to pZα-tRFP-injected embryos (control group), Pgk1 level was increased in the muscle cells of the pZα-Pgk1 group. The α-tubulin served as internal control for Western blot.
Figure 4—figure supplement 2
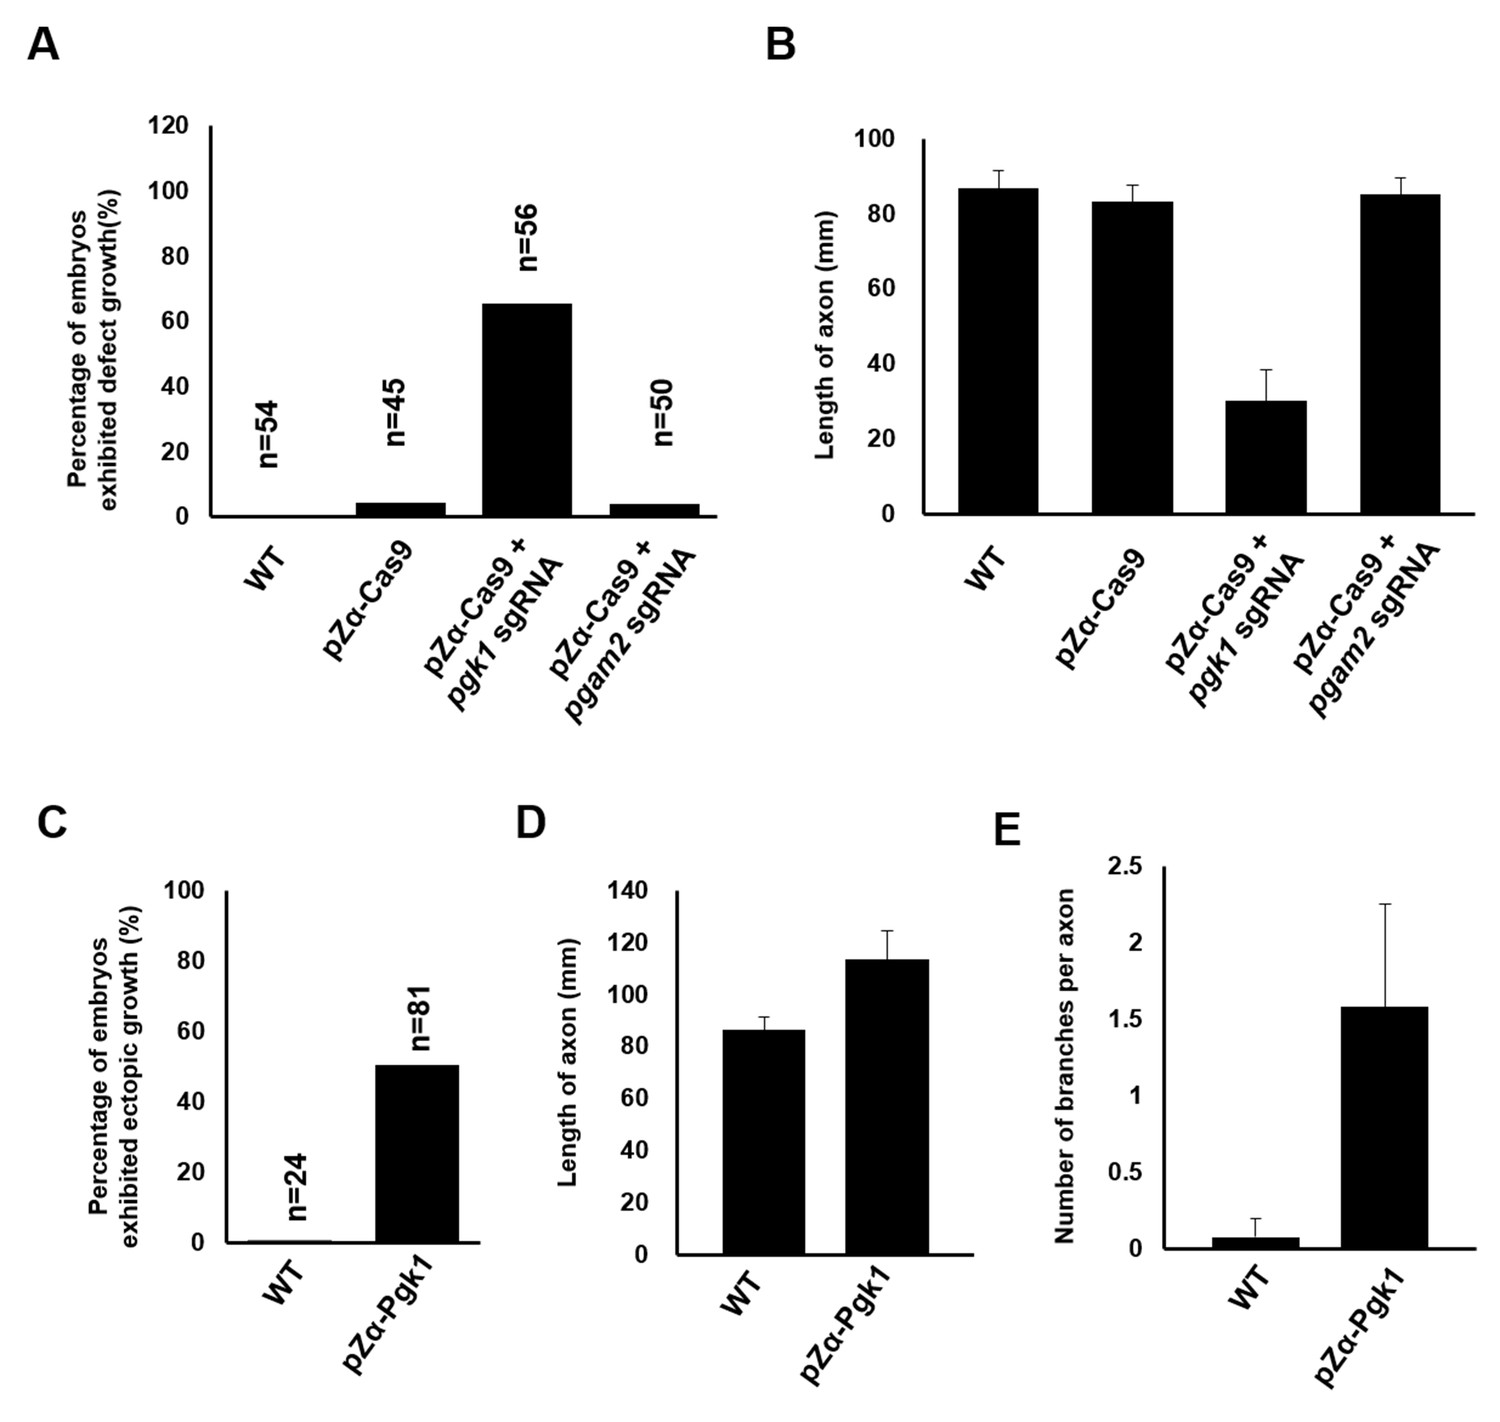
Quantitative analysis demonstrating the effect of Pgk1 expressed in zebrafish muscle on the growth of axonal motor neurons.
Zebrafish wild-type (WT) embryos and embryos injected with pZα-Cas9, pZα-Cas9 plus pgk1 sgRNA (reduction of Pgk1 in muscle cells) and pZα-Cas9 plus pgam2 sgRNA (reduction of Pgam2 in muscle cells) were used to count (A) the percentage of embryos which motor axons having retarded growth among the examined number of embryos (n) and (B) the average length of axons. In a parallel experiment, zebrafish WT embryos and embryos injected with pZα-Pgk1 (overexpression of Pgk1 in muscle cells) were used to calculate (C) the percentage of embryos which motor axons having ectopic growth among the examined number of embryos (n), measure (D) the ectopic growth length of axons, and count (E) the number of branches from a single axon. Data were averaged from all examined embryos/axons and presented as mean ±S.D. Student’s t-test was used for statistical analysis(***, significant difference at p<0.001).
Figure 5 with 3 supplements
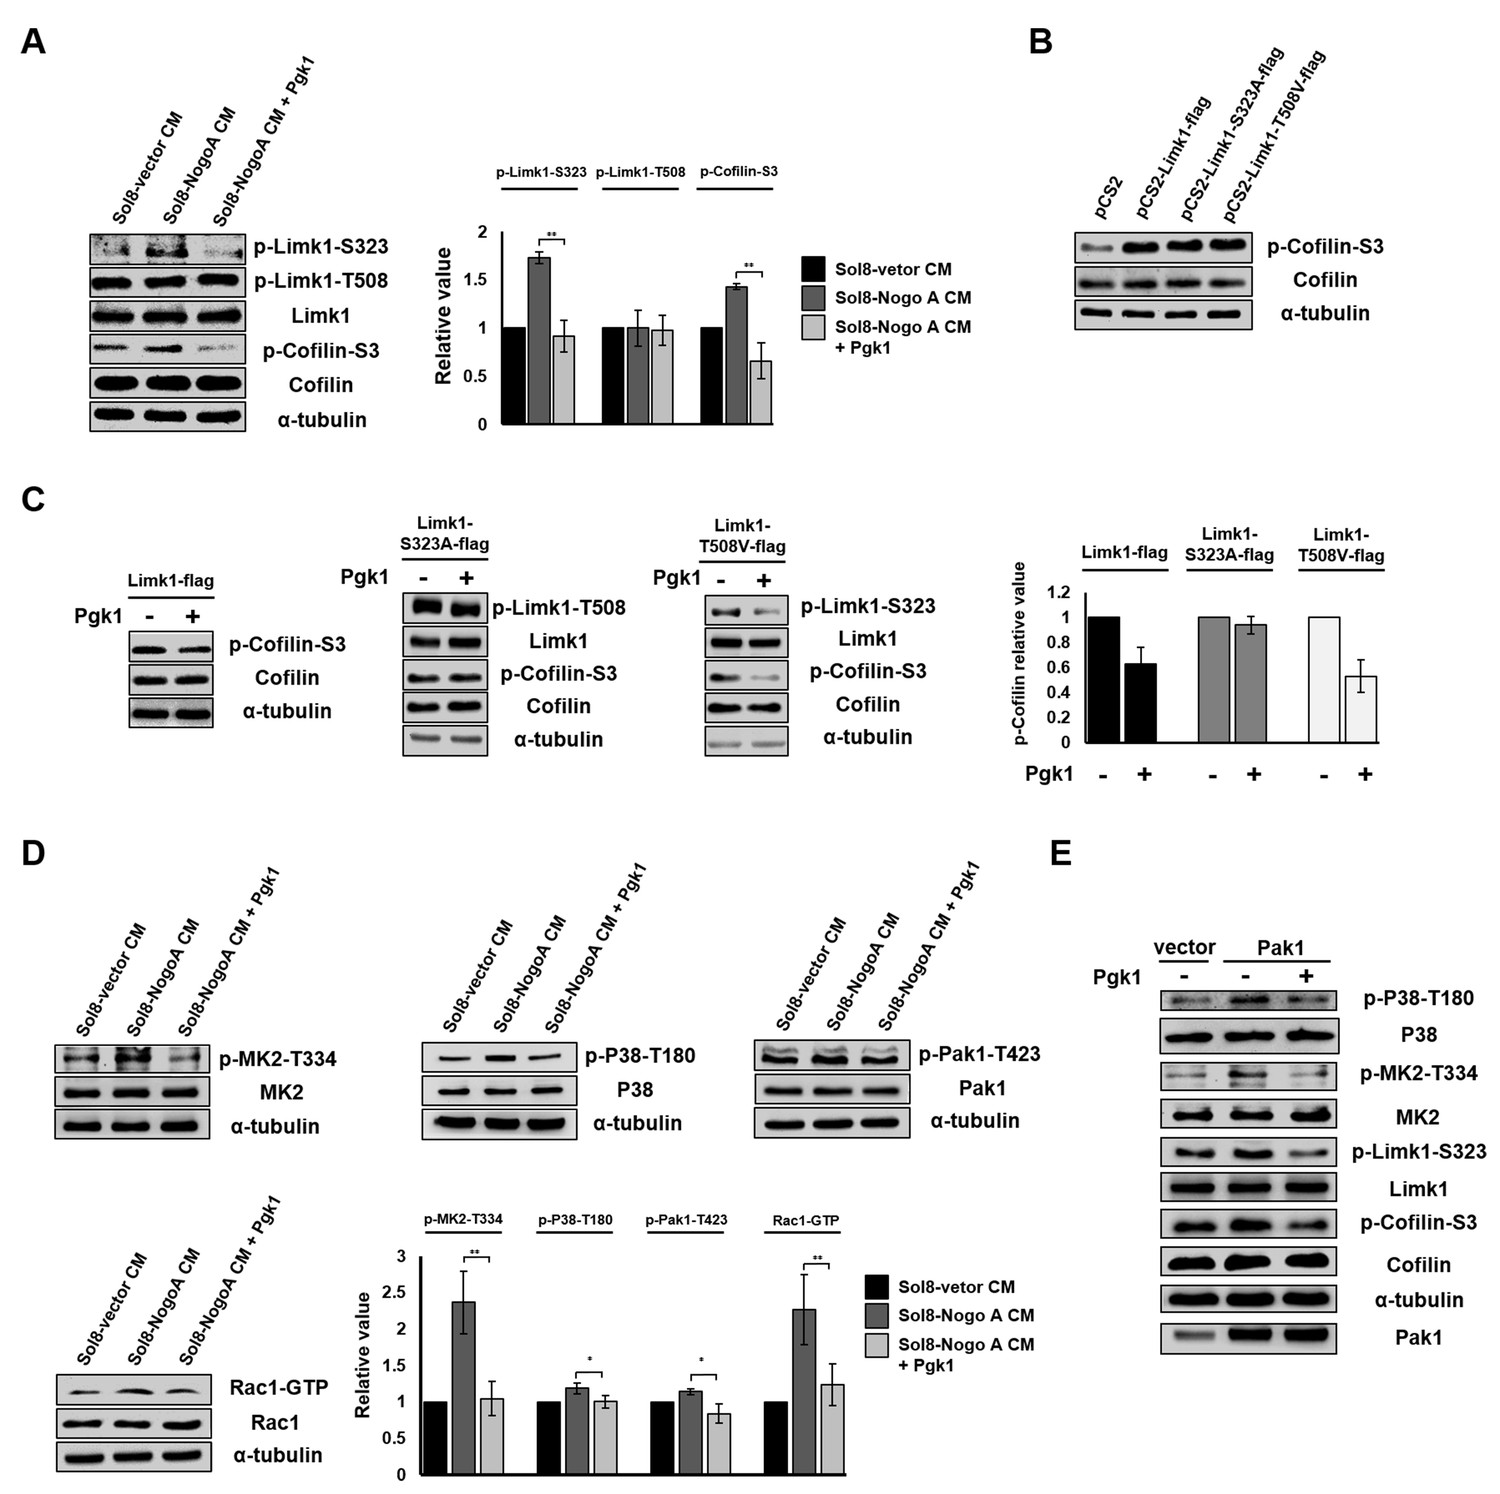
Pgk1 reduces the protein level of p-Cofilin-S3 through the decrease of phosphorylated Limk1 at S323 in NSC34 cells.
(A) The expression levels of p-Limk1-S323, -T508, Limk1, p-Cofilin-S3 and total Cofilin in NSC34 cells treated with condition, as indicated. (B) Phosphorylated (p-Cofilin-S3) and total Cofilin contained in cells were examined by Western blot analysis. NCS34 cells cultured in DM were introduced separately with a plasmid of pCS2+, pCS2-Limk1-flag (expressing normal Limk1), pCS2-Limk1-S323A-flag (expressing S323A-mutated Limk1), and pCS2-Limk1-T508V-flag (expressing T508V-mutated Limk1). (C) Plasmids encoding overexpression of Limk1-, Limk1-S323A- and Limk1-T508V-flag fusion proteins were separately introduced into NSC34 cells cultured in DM with or without Pgk1. (D) Expression of P38/MK2 and Rac1/Pak1 markers of NSC34 cells cultured in condition, as indicated. (E) Detection of P38/MK2 and Limk-S323/Cofilin signaling pathway markers of NSC34 cells introduced with Pak1-overexpressing plasmid and cultured in DM with or without Pgk1. α-tubulin served as an internal control. Relative value represents the ratio of phosphorylated form value over total protein values. All data were averaged from three independent experiments with statistical analysis by Student’s t-test (***, significant difference at p<0.001; **, p<0.01; *, p<0.05).
Figure 5—figure supplement 1
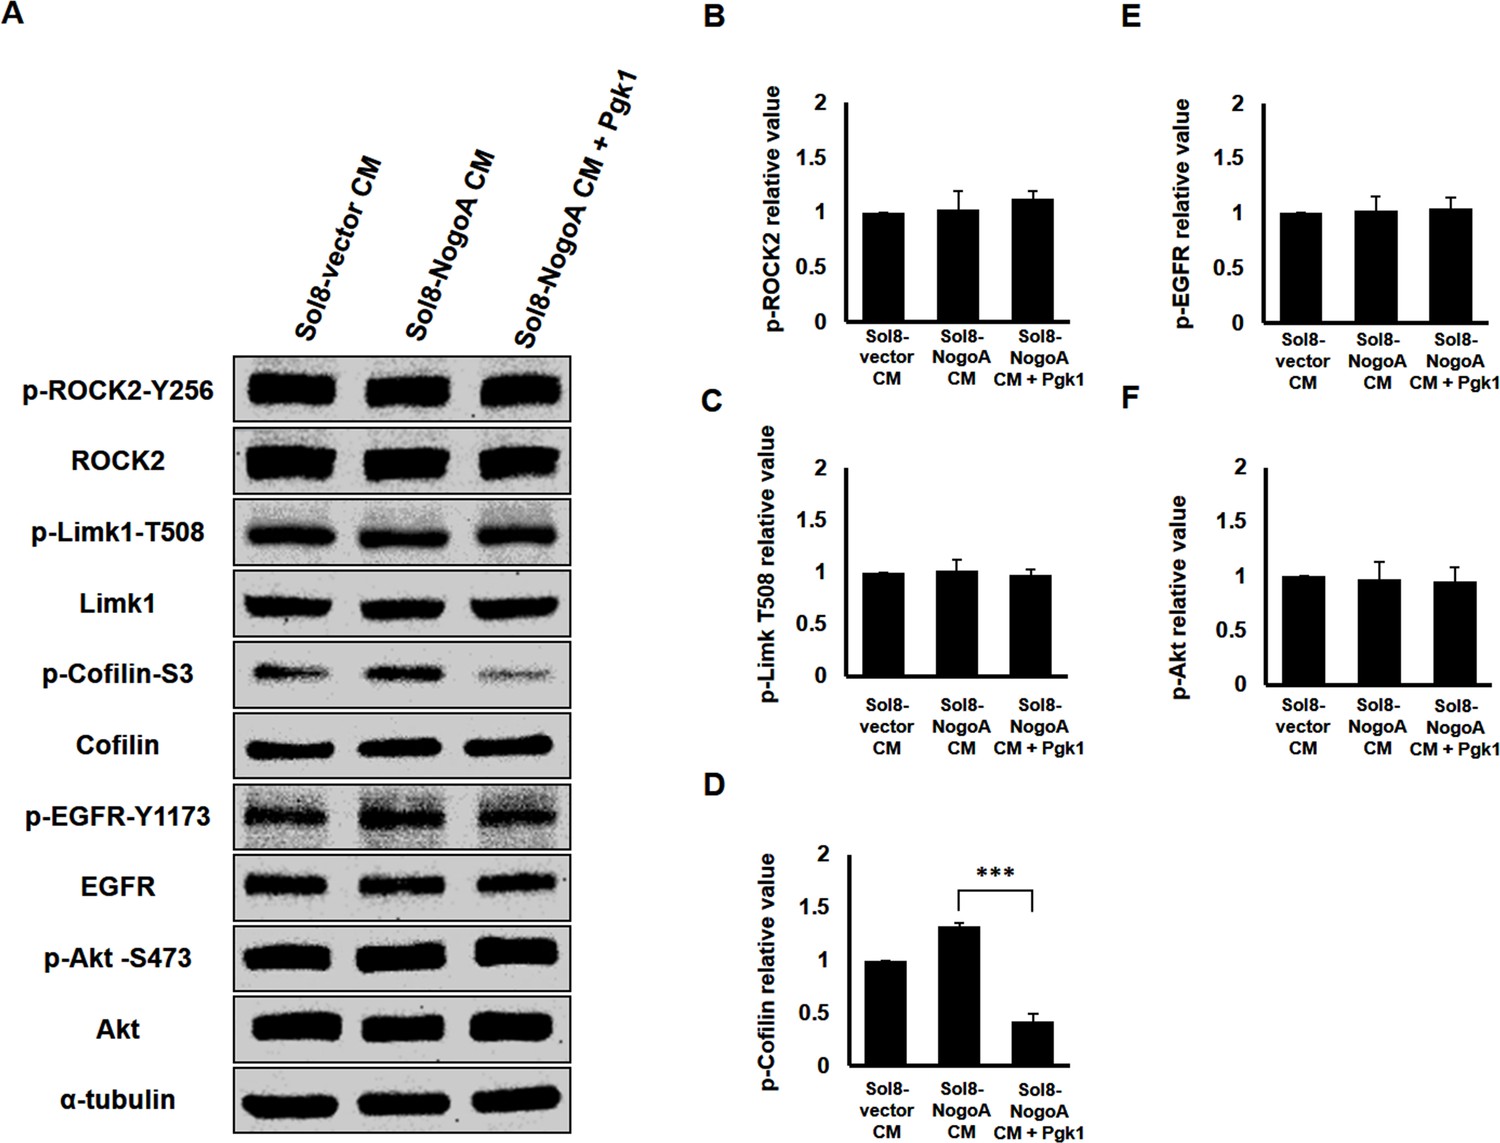
The molecular pathway mediated by extracellular addition of Pgk1 to enhance neurite outgrowth is independent from the neuronal Nogo66/NgR Pathway.
(A) Western blot analysis. Protein levels of phosphorylated ROCK2 at Y256 (p-ROCK2-Y256), ROCK2, phosphorylated Limk1 at T508 (p-Limk1-T508), Limk1, phosphorylated Cofilin at S3 (p-Cofilin-S3), total Cofilin, phosphorylated EGFR at Y1173 (p-EGFR-Y1173), EGFR, phosphorylated Akt at S473 (p-Akt-S473) and Akt in neurons cultured with Sol8-vector CM, Sol8-NogoA CM and Sol8-NogoA CM plus Pgk1 addition were all examined, as indicated. The α–tubulin served as internal loading control. (B–F) Quantification of the expression level of proteins. The band intensities shown on Western blotting were quantified by ImageJ software. The relative value of each examined protein was used for comparison among the three groups when the value obtained from the Sol8-vector CM group was set as 1. All of the above data were averaged from three independent experiments. Statistical analysis used Student’s t-test (***, significant difference at p<0.001; **, p<0.01; *, p<0.05).
Figure 5—figure supplement 2
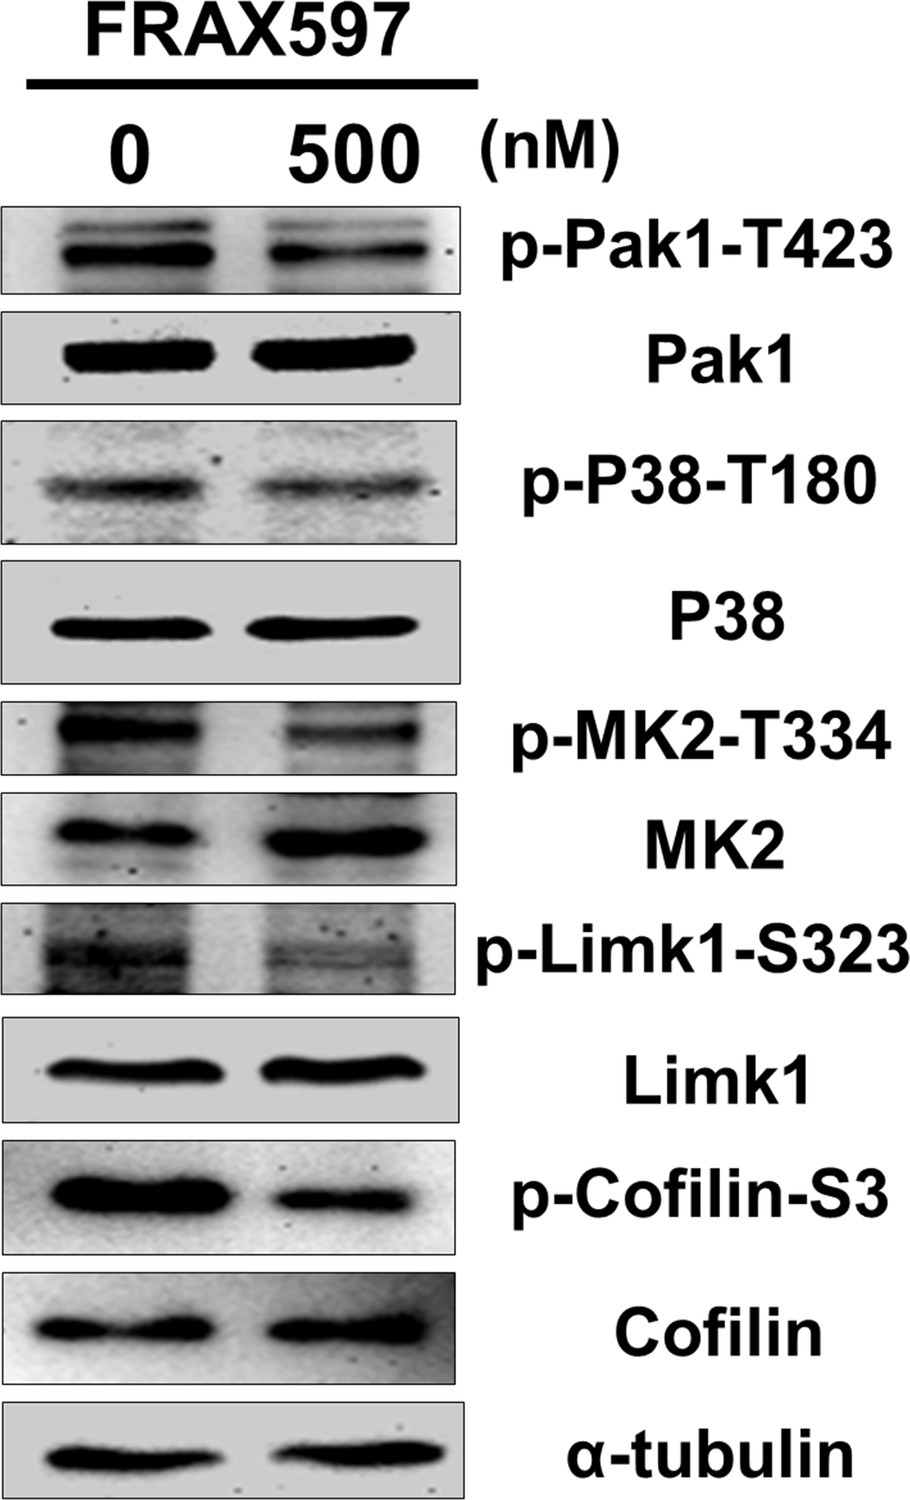
Treatment of Pak1 inhibitor can reduce the phosphorylation levels of Pak1/P38/MK2/Limk1/Cofilin axis within NSC34 cells.
NSC34 cells were cultured in DM and treated with FRAX-1036, an inhibitor of Pak1, at the concentration of 0 and 500 nM for 48 hr. Cellular proteins were extracted and analyzed by Western blot analysis. The level of α-tubulin served as an internal control.
Figure 5—figure supplement 3

The reduction of p-Cofilin mediated by ePgk1 does not occur through Nogo66/NgR interaction in neuronal cells.
(A–B) Western blot analysis to examine whether the signal pathway driven by activated Nogo66/NgR1 was affected by the addition of Pgk1. Total proteins were extracted from cultured NSC34 cells with the addition of GST (100 ng/ml), GST-Nogo66 (100 ng/ml) and GST-Nogo66 (100 ng/ml) plus Pgk1 (33 ng/ml) in DM. The α-tubulin served as internal loading control. (A) Western blot analysis of the expression levels of p-ROCK2-Y256, p-EGFR-Y1173 and p-Akt-S473, as indicated. The relative value of each examined protein was used for comparison among three groups when the value from the GST group was set as 1. All data were averaged from three independent experiments. Compared to the GST control group, the expressions of p-ROCK2-Y256 and p-EGFR-Y1173 were increased, while the expression of p-Akt-S473 was decreased in the GST-Nogo66 group. Compared to the GST-Nogo66 group, the expressions of p-ROCK2-Y256, p-EGFR-Y1173 and p-Akt-S473 remained unchanged in the GST-Nogo66 plus Pgk1 group. (B) Western blot analysis of the expression levels of p-Limk1-T508, p-Limk1-S323, Limk1, p-Cofilin and Cofilin, as indicated. The relative value of each examined protein was used for comparison among two groups when the value from the GST-Nogo66 group was set as 1. All of the above data were averaged from three independent experiments. Addition of Pgk1 could reduce the expressions of p-Limk1-S323 and p-Cofilin in the presence of activated Nogo66 signaling. (C–D) Western blot analysis to examine whether the signal pathway driven by ePgk1 was affected after blockage of the NgR receptor. Total proteins were extracted from cultured NSC34 cells with the addition of Nogo66 receptor antagonist peptide (NAP2; 10 uM) and NAP2 (10 uM) plus Pgk1 (33 ng/ml). The α-tubulin served as internal loading control. (C) Western blot analysis of ROCK2 protein expression. The untreated NSC34 cells in DM served as positive control. Addition of NAP2 reduced the level of ROCK2 protein. (D) Western blot analysis of protein levels of p-Pak1-T423, Pak1, p-P38-T180, P38, p-MK2-T334, MK2, p-Limk1-T508, p-Limk1-S323, Limk1, p-Cofilin-S3 and Cofilin. The α–tubulin served as internal loading control. The relative value of each examined protein was used for comparison among the two groups when the value from the NAP2 group was set as 1. All of the above data were averaged from three independent experiments. The expressions of p-Pak1-T423, p-P38-T180, p-MK2-T334, p-Limk1-S323 and p-Cofiln-S3 were all reduced when Pgk1 was added, but NgR was blocked.
Figure 6 with 11 supplements
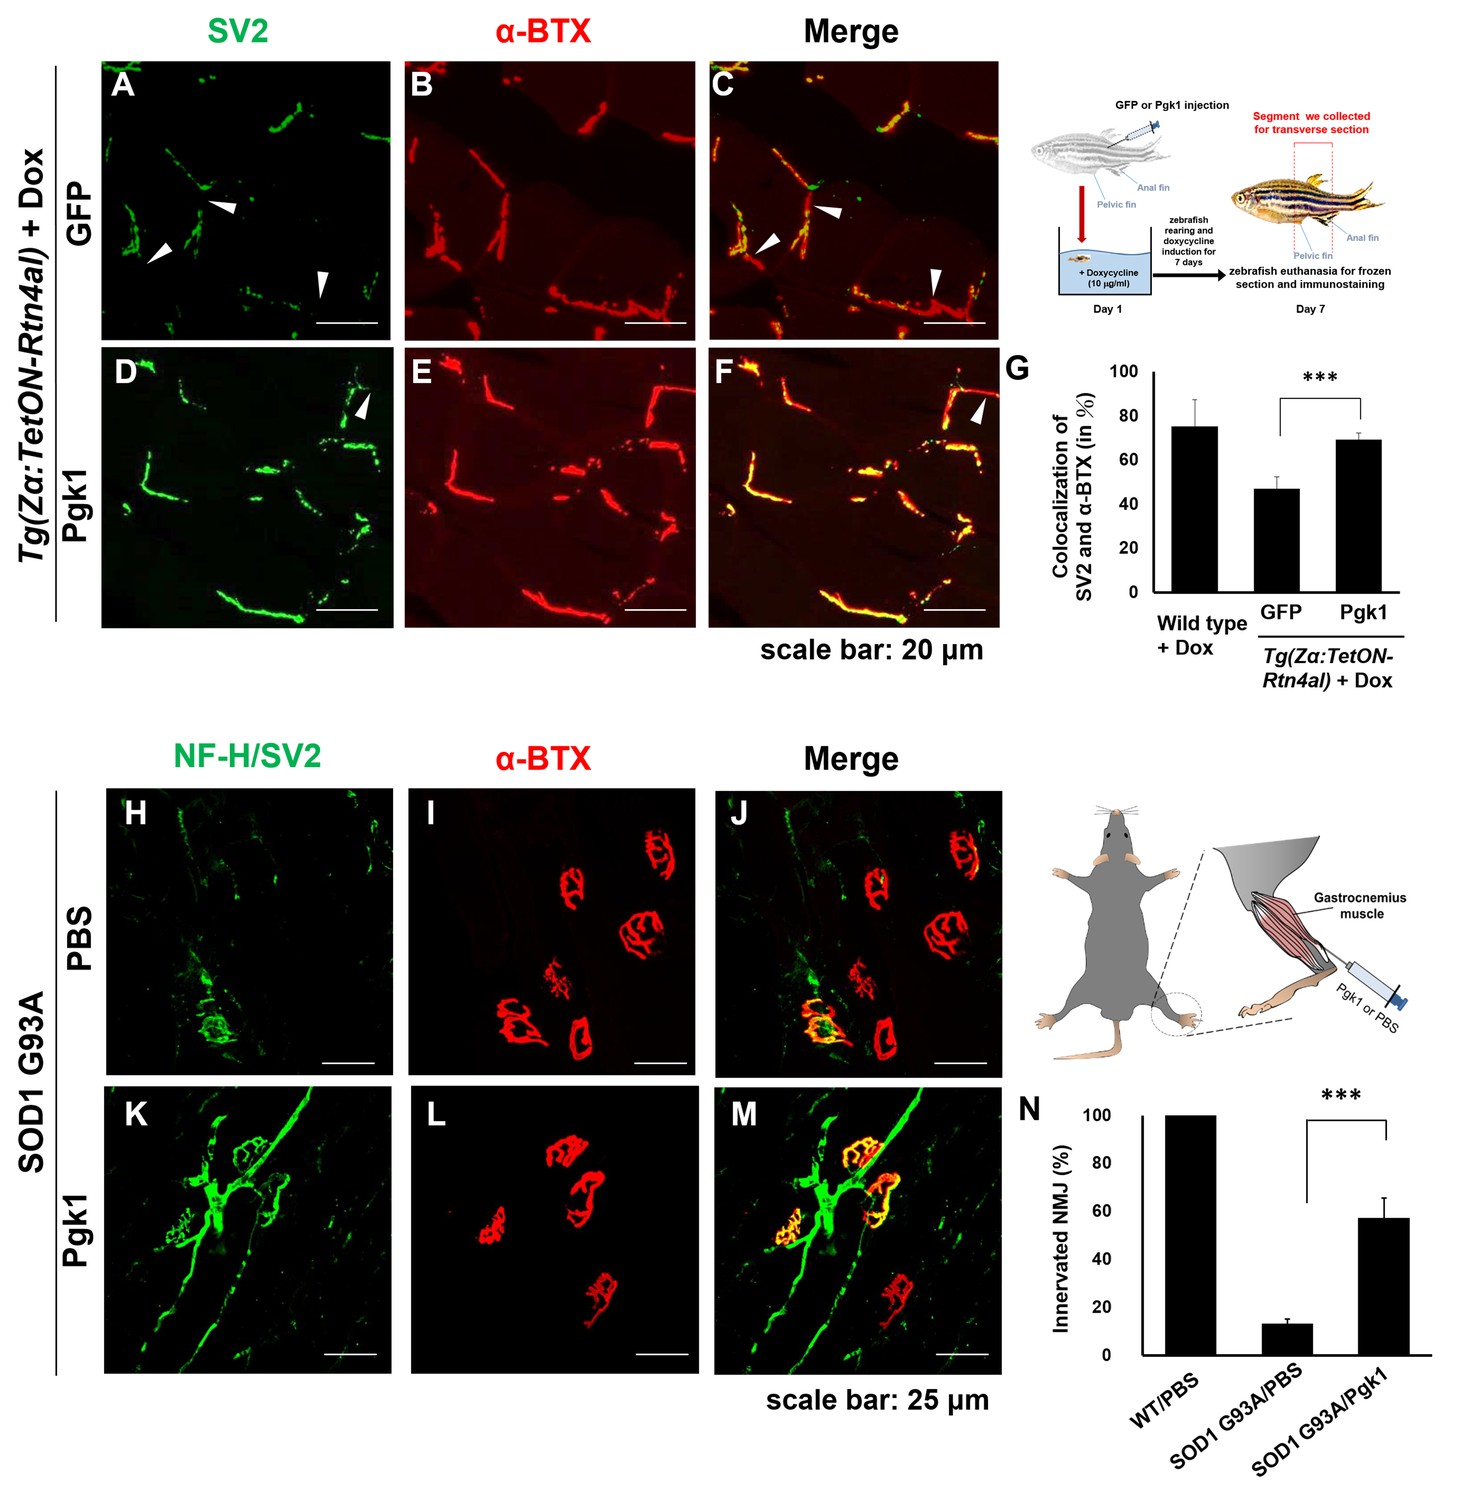
Supplementary addition of Pgk1 rescues denervation caused by NogoA-overexpression in the muscle cells of zebrafish, as well as ALS mouse model.
NMJ phenotype of transgenic zebrafish Tg(Zα:TetON-Rtn4al) harboring Rtn4al (NogoA homolog) cDNA driven by a Dox-inducible muscle-specific α-actin promoter after intramuscular injection of (A–C) GFP protein control and (D–F) Pgk1. Axons were labeled by synaptic vesicle glycoprotein 2A (SV2) in green, while postsynaptic receptors were labeled by α-Bungarotoxin (α-BTX) in red. (G) Statistical analysis of the number of colocalized axons and postsynaptic receptors in muscle of NogoA-overexpression zebrafish ALS-like model using Student’s t-test (***, p<0.001). NMJ phenotype of ALS mouse model harboring human SOD1 G93A after intramuscular injection of (H–J) PBS and (K–M) Pgk1 in the gastrocnemius muscle of the right hind leg. Neurofilament-H (NF-H) and SV2 labeled by green fluorescent signal were used to detect the axon terminal of motoneurons, while α-BTX labeled by red fluorescence signal was used to detect the acetylcholine receptor on motor endplates. (N) Statistical analysis of the number of innervated NMJ among PBS-injected WT mouse, PBS-injected SOD1 G93A mouse and Pgk1-injected SOD1 G93A mouse. Statistical analysis used Student’s t-test (***, significant difference at p<0.001).
Figure 6—figure supplement 1
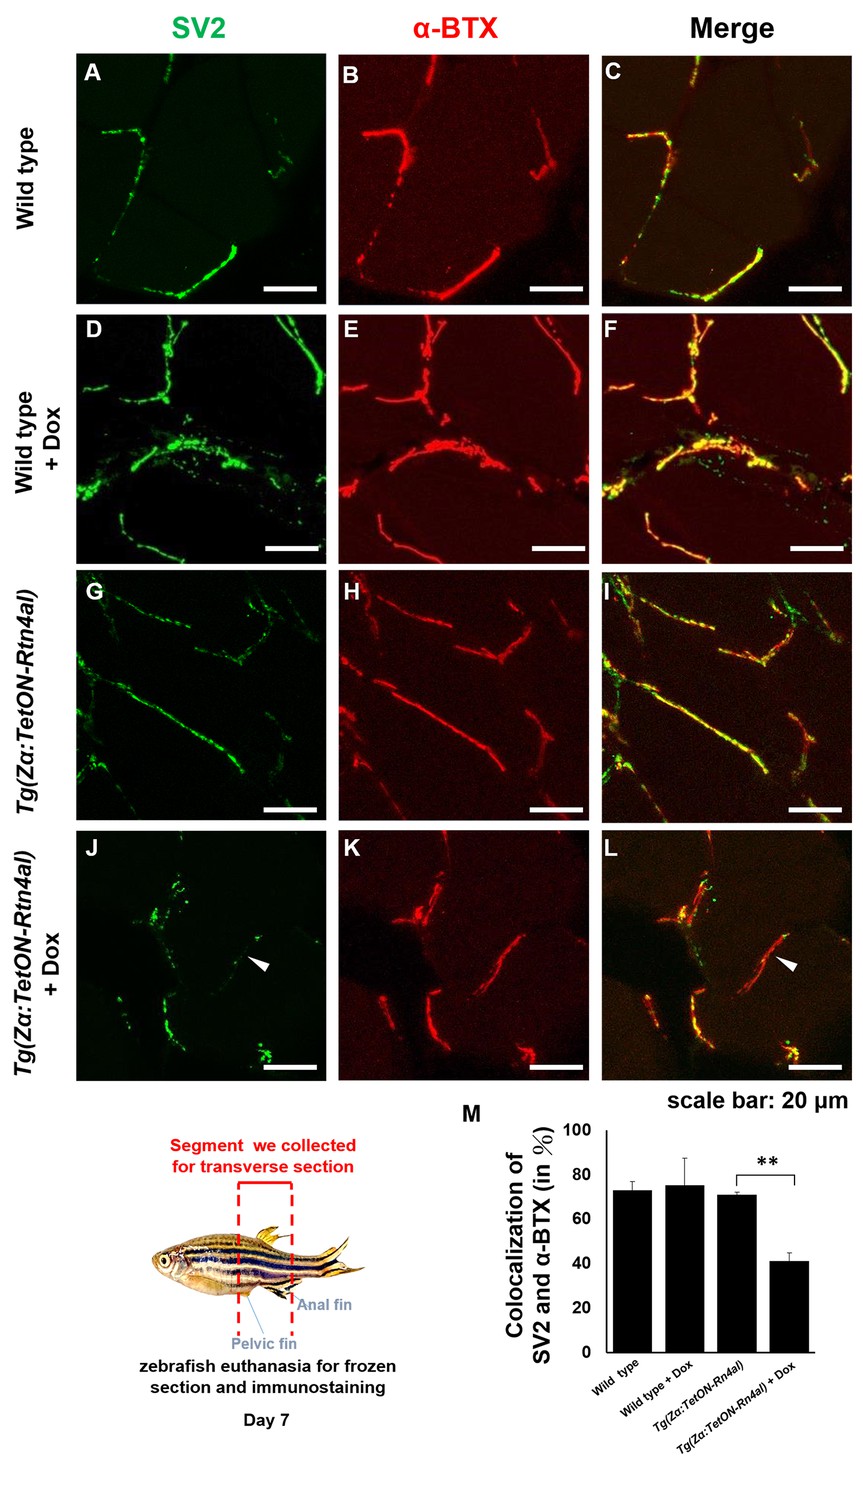
Overexpression of Rtn4al in adult zebrafish muscle causes NMJ denervation.
(A–C) Water-immersed WT, (D–F) Dox-immersed WT, (G–I) water-immersed Tg(Zα:TetON-Rtn4al), and (J–L) Dox-immersed Tg(Zα:TetON-Rtn4al). Adult fish of all groups were treated for one week before histopathological examination. (A–L) Transverse section. (A, D, G, J) Green fluorescent signal detection of synaptic vesicle glycoprotein 2A (SV2) labeled in the peripheral motor neuron. (B, E, H, K) Red fluorescence signal using α-Bungarotoxin (α-BTX)-labeled acetylcholine receptor on motor endplate. (C, F, I, L) comprised the merge picture. Arrowhead indicates the location of NMJ denervation. Scale bar, 20 μm. (M) Four experimental groups of SV2 and α-BTX signal colocalization percentage quantitative data. Data from three adult fish from each experimental group; three images each magnified at 600X, using Metamorph software to quantify SV2 and α-BTX signal colocalization area (400 × 400 pixels), followed by conversion to percentage after Student’s t-test and used for statistical analysis (**, significant difference at p<0.01).
Figure 6—figure supplement 2
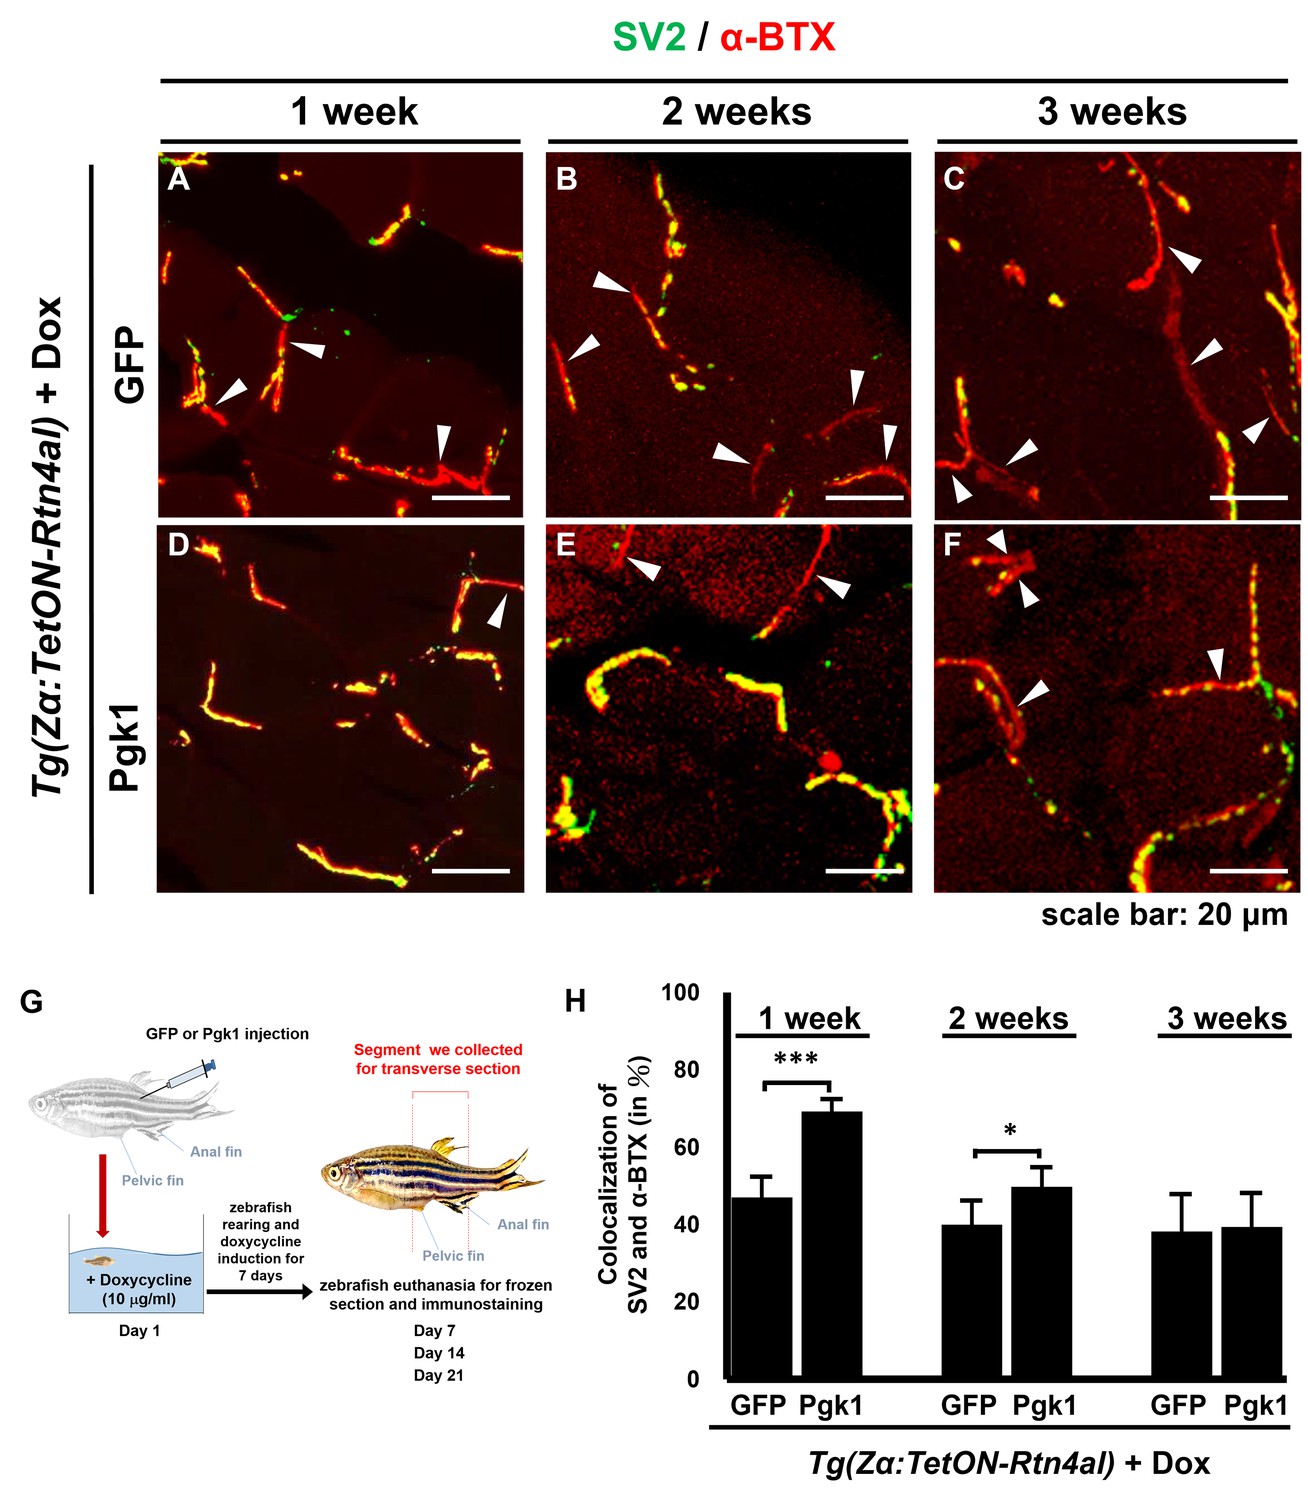
Administration of Pgk1 could delay NMJ denervation caused by overexpression of Rtn4al in adult zebrafish muscle.
NMJ phenotype of transgenic zebrafish Tg(Zα:TetON-Rtn4al) harboring Rtn4al/NogoA cDNA driven by a Dox-inducible muscle-specific alpha-actin promoter was observed after intramuscular injection of (A–C) GFP protein (served as a control) and (D–F) Pgk1 protein. Histopathological examination of the muscle tissue around the injection site of adult fish was performed after fish were treated for one, two and three weeks as indicated. (A–F) Transverse section. Green fluorescent signal was used to detect synaptic vesicle glycoprotein 2A (SV2)-labeled peripheral motor neuron, while red fluorescence signal was used to detect α-Bungarotoxin (α-BTX)-labeled acetylcholine receptor on motor endplate. Arrowheads indicate the location of NMJ denervation. Scale bar, 20 μm. (G) Diagram depicts places where GFP and Pgk1 were injected and where the muscle samples were taken after soaking with Dox in adult transgenic zebrafish Tg (Zα:TetON-Rtn4al). (H) Quantitative analysis of the colocalization of SV2 and α-BTX signals. Data were averaged from three adult fish. Each fish datum was averaged from three images, whereas each image was counted by using Metamorph software to quantify SV2 and α-BTX signal colocalization area (400 × 400 pixels) from 600X magnification, followed by conversion to percentage. Student’s t-test was used for statistical analysis (***, significant difference at p<0.001; *, p<0.05).
Figure 6—figure supplement 3
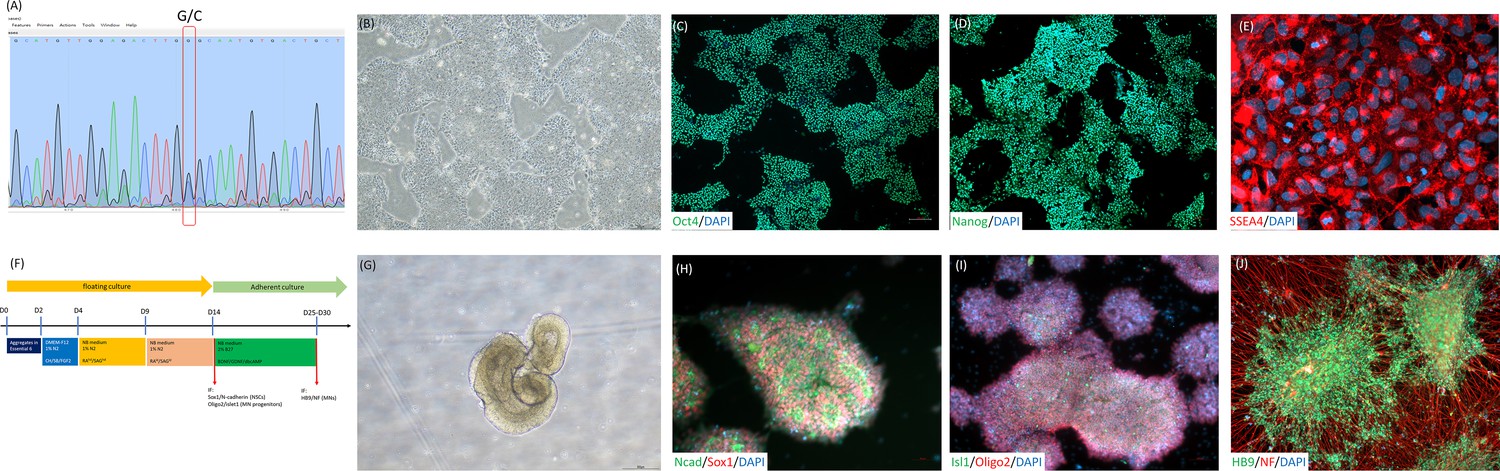
The establishment and motor neuron differentiation of iPSC derived from an ALS patient with SOD1 mutated at G85R.
(A) iPSCs harboring a G256C point mutation (G85R on peptide sequence) on human SOD1 gene in an ALS patient. (B) The morphology of iPSC-SOD1 G85R cells under feeder-free culture condition. After reprogramming, iPSCs presented classical human pluripotent stem cell morphology. (C–E) The iPSC-SOD1 G85R embryoid body cells expressed the pluripotency-specific markers Oct4, Nanog and SSEA4, followed by the initiation of motor neuron differentiation. (F) Diagram depicts the motor neuron cell differentiation process and media used to culture iPSC-SOD1 G85R cells. (G) The embryoid body spheres presented neuroepithelial structures after 14 days of motor neuron induction. (H) At day 15 of motor neuron differentiation, more than 90% of induced cells expressed the neural stem cell-specific markers sox1 and N-cadherin, (I) as well as the motor neuron precursor-specific markers Oligo2 and Islet1. (J) At day 27 of motor neuron differentiation, more than 90% of induced cells expressed the motor neuron-specific protein HB9 and nerve fiber protein neurofilament (NF). CH: CHIR99021, SB: SB431542; RAhd: high dosage of retinoic acid; SAGhd: high dosage of Smoothened Agonist; RAld: low dosage of retinoic acid; and SAGld: low dosage of Smoothened Agonist.
Figure 6—figure supplement 4
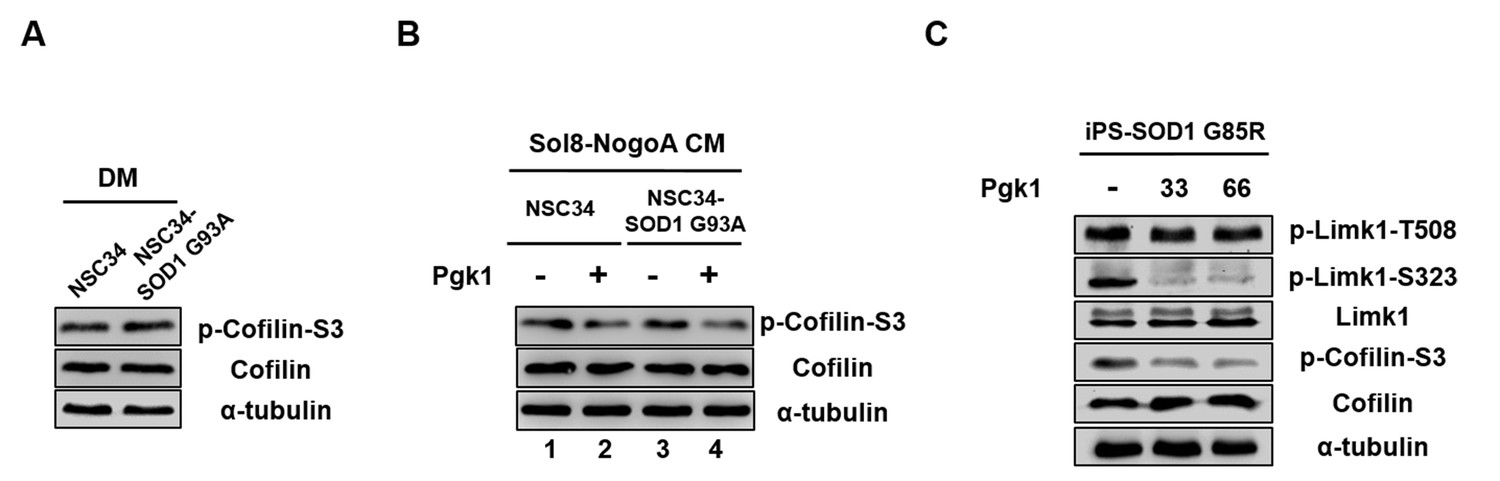
Pgk1 reduces the protein level of p-Cofilin-S3 in NSC34-SOD1 G93A and human iPS-SOD1 G85R cells.
(A) NSC34 and NSC34-SOD1 G93A cells cultured in DM. (B) NSC34 cells cultured in Sol8-NogoA CM (lane 1) and Sol8-NogoA CM plus Pgk1 (lane 2); and NSC34-SOD1 G93A cells cultured in Sol8-NogoA CM (lane 3) and Sol8-NogoA CM plus Pgk1 (lane 4). When Pgk1 was added in Sol8-NogoA CM to culture NSC34-SOD1 G93A cells, the amount of p-Cofilin-S3 was reduced. (C) Protein levels of p-Limk1-508, -S323, Limk1, p-Cofilin-S3 and Cofilin of Human iPS-SOD1 G85R cells cultured in medium containing Pgk1 at concentration of 33- and 66-ng/ml. When Pgk1 was added in culture medium containing human diseased motor neuron cells iPS-SOD1 G85R, the amount of p-Limk-S323 and p-Cofilin-S3 were also reduced. Protein level of α-tubulin served as internal control.
Figure 6—figure supplement 5
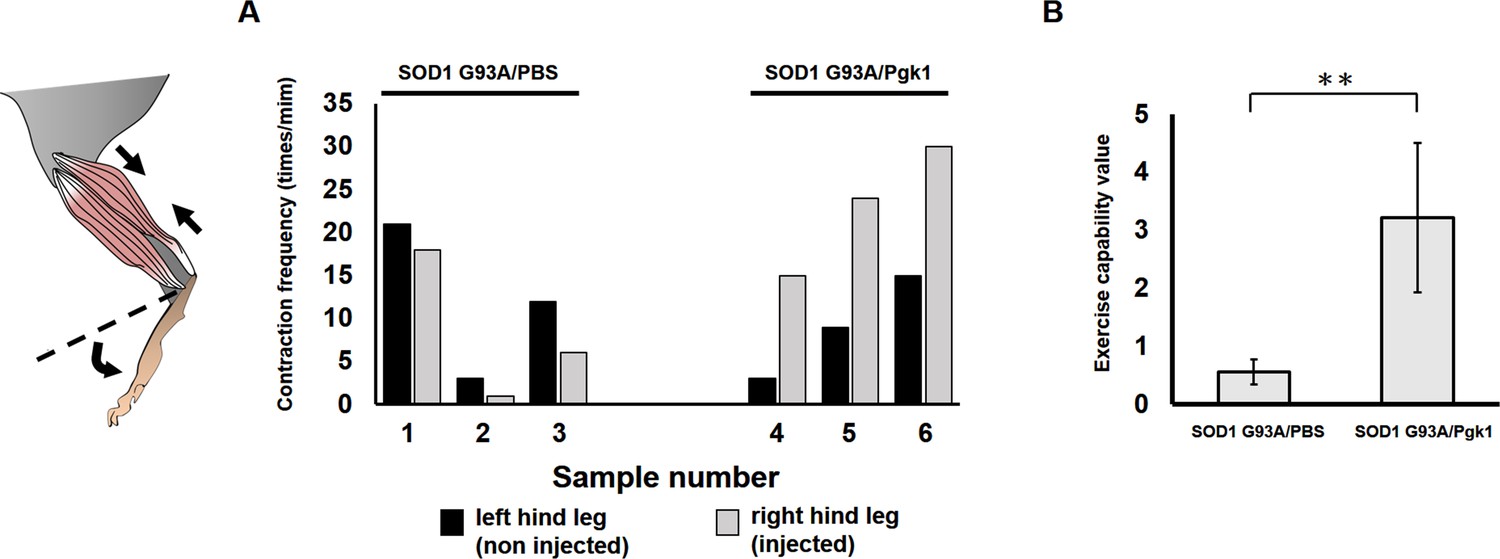
Effect of Pgk1 injection on the exercise capability of hind leg of ALS mice.
Injection of PBS (SOD1 G93/PBS) and Pgk1 (SOD1 G93A/Pgk1) into the gastrocnemius muscle of the right hind leg of 60-d-old transgenic SOD1 G93A mice. Continuous injection was carried out every 15 days until mice were 120 days old. When they were 130 days old, (A) the frequency of muscle contraction of both hind legs was counted individually. (B) The exercise capability value of each mouse was calculated from the increased fold(s) in the number of contractions of injected (right) leg versus that of uninjected (left) leg. Data of each group were averaged from three mice and presented as mean ±S.D. Student’s t-test was used for statistical analysis (**, significant difference at p<0.01).
Figure 6—video 1
Sample number 1: The SOD1 G93A mouse right hind leg gastrocnemius injection PBS.
https://doi.org/10.7554/eLife.49175.022
Figure 6—video 2
Sample number 2: The SOD1 G93A mouse right hind leg gastrocnemius injection PBS.
https://doi.org/10.7554/eLife.49175.023
Figure 6—video 3
Sample number 3: The SOD1 G93A mouse right hind leg gastrocnemius injection PBS.
https://doi.org/10.7554/eLife.49175.024
Figure 6—video 4
Sample number 4: The SOD1 G93A mouse right hind leg gastrocnemius injection Pgk1.
https://doi.org/10.7554/eLife.49175.025
Figure 6—video 5
Sample number 5: The SOD1 G93A mouse right hind leg gastrocnemius injection Pgk1.
https://doi.org/10.7554/eLife.49175.026
Figure 6—video 6
Sample number 6: The SOD1 G93A mouse right hind leg gastrocnemius injection Pgk1.
https://doi.org/10.7554/eLife.49175.027
Figure 7

Diagrams used to illustrate the extracellular Pgk1-mediated signal pathway proposed by this study to demonstrate how Pgk1 secreted from NogoA-overexpressed muscle cells affects the neurite outgrowth of motor neurons.
Left panel illustrates the small amount of NogoA presenting in muscle cells slightly reduces the amount of Pgk1 secreted from these muscle cells, resulting in strong inhibition of the Rac1-GTP/p-Pak1-T423/p-P38-T180/p-MK2-T334/p-Limk1-S323 axis within motor neurons, which, in turn, decreases the degree of p-Cofilin-S3. Consequently, the neurite outgrowth of motor neurons is developed. Right panel illustrates that overexpression of NogoA in muscle cells greatly reduces the amount of Pgk1 secreted from these muscle cells, resulting in weak inhibition of the Rac1-GTP/p-Pak1-T423/p-P38-T180/p-MK2-T334/p-Limk1-S323 axis within motor neurons, which, in turn, increases the degree of p-Cofilin-S3. Consequently, the neurite outgrowth of motor neurons is inhibited.
Author response image 1
Download links
A two-part list of links to download the article, or parts of the article, in various formats.
Downloads (link to download the article as PDF)
Open citations (links to open the citations from this article in various online reference manager services)
Cite this article (links to download the citations from this article in formats compatible with various reference manager tools)
Extracellular Pgk1 enhances neurite outgrowth of motoneurons through Nogo66/NgR-independent targeting of NogoA
eLife 8:e49175.
https://doi.org/10.7554/eLife.49175


