A mechanism in agrin signaling revealed by a prevalent Rapsyn mutation in congenital myasthenic syndrome
- Case Western Reserve University, United States
- Augusta University, United States
- Louis Stokes Cleveland Veterans Affairs Medical Center, United States
Figures
Figure 1 with 1 supplement
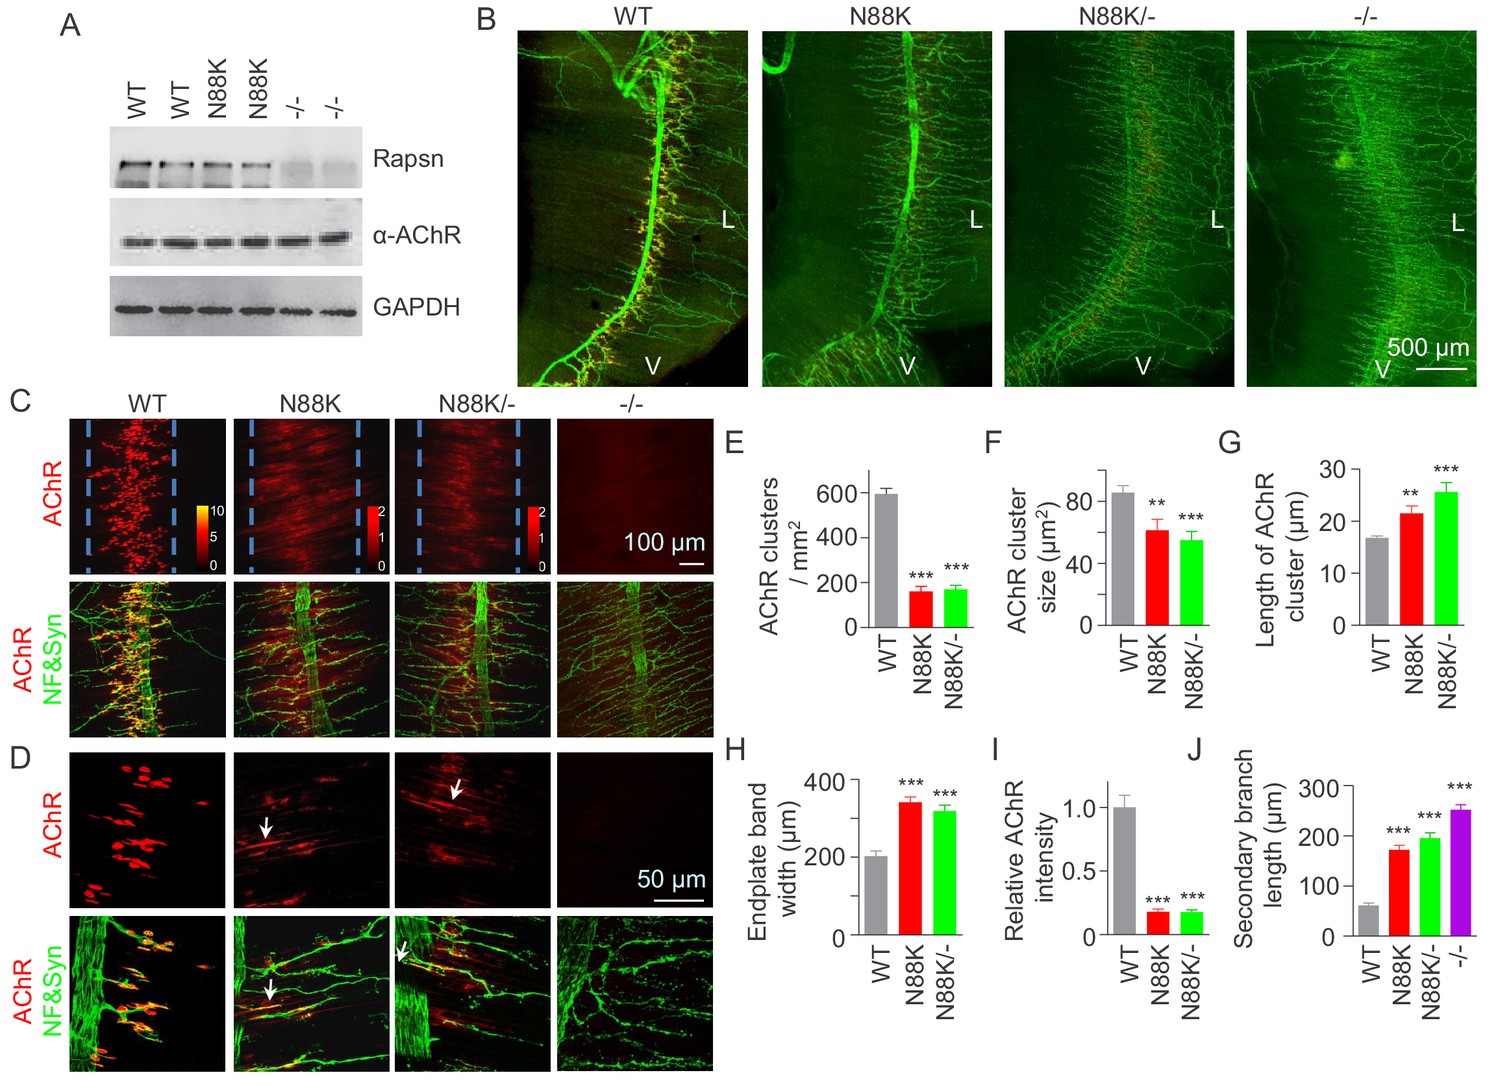
Few AChR clusters and extensive nerve terminal arborization in N88K mt mice.
(A) Comparable Rapsn protein level between WT and N88K mt mice. Tissue lysates from WT, N88K mt, -/- (Rapsn null mt) diaphragms were subjected to western blotting with anti-Rapsn, and anti-α-AChR antibodies, using GAPDH as loading control. Note that α-AChR protein level was not altered in N88K and -/-, compared with WT controls. (B) Reduced AChR clusters and extensive axonal arborization in N88K mt mice. P0 diaphragms from WT, N88K, N88K/-, -/- mice were stained whole-mount with Flour 594-α-BTX (red) to label AChR clusters and with anti-NF/Syn antibodies (green) to label motor nerve terminals. V, ventral. L, left. (C, D) Higher magnification views of AChR clusters and motor axon branches. The boundary of AChR clusters was indicated by dashed blue lines. Heatmap, AChR intensity; arrows, elongated AChR clusters along axons. (E–J) Quantitative analysis of AChR cluster number (E), AChR cluster size (F), AChR cluster length (G), endplate band width (H), AChR fluorescence intensity (I), secondary branch length (J). Data were shown as mean ± SEM; **, p<0.01; ***, p<0.001, One-way ANOVA, n = 6 mice. Also see Figure 1—figure supplement 1.
-
Figure 1—source data 1
Sample size (n), mean, SEM, p value, statistical methods and results are presented in Figure 1E–J.
- https://doi.org/10.7554/eLife.49180.005
Figure 1—figure supplement 1
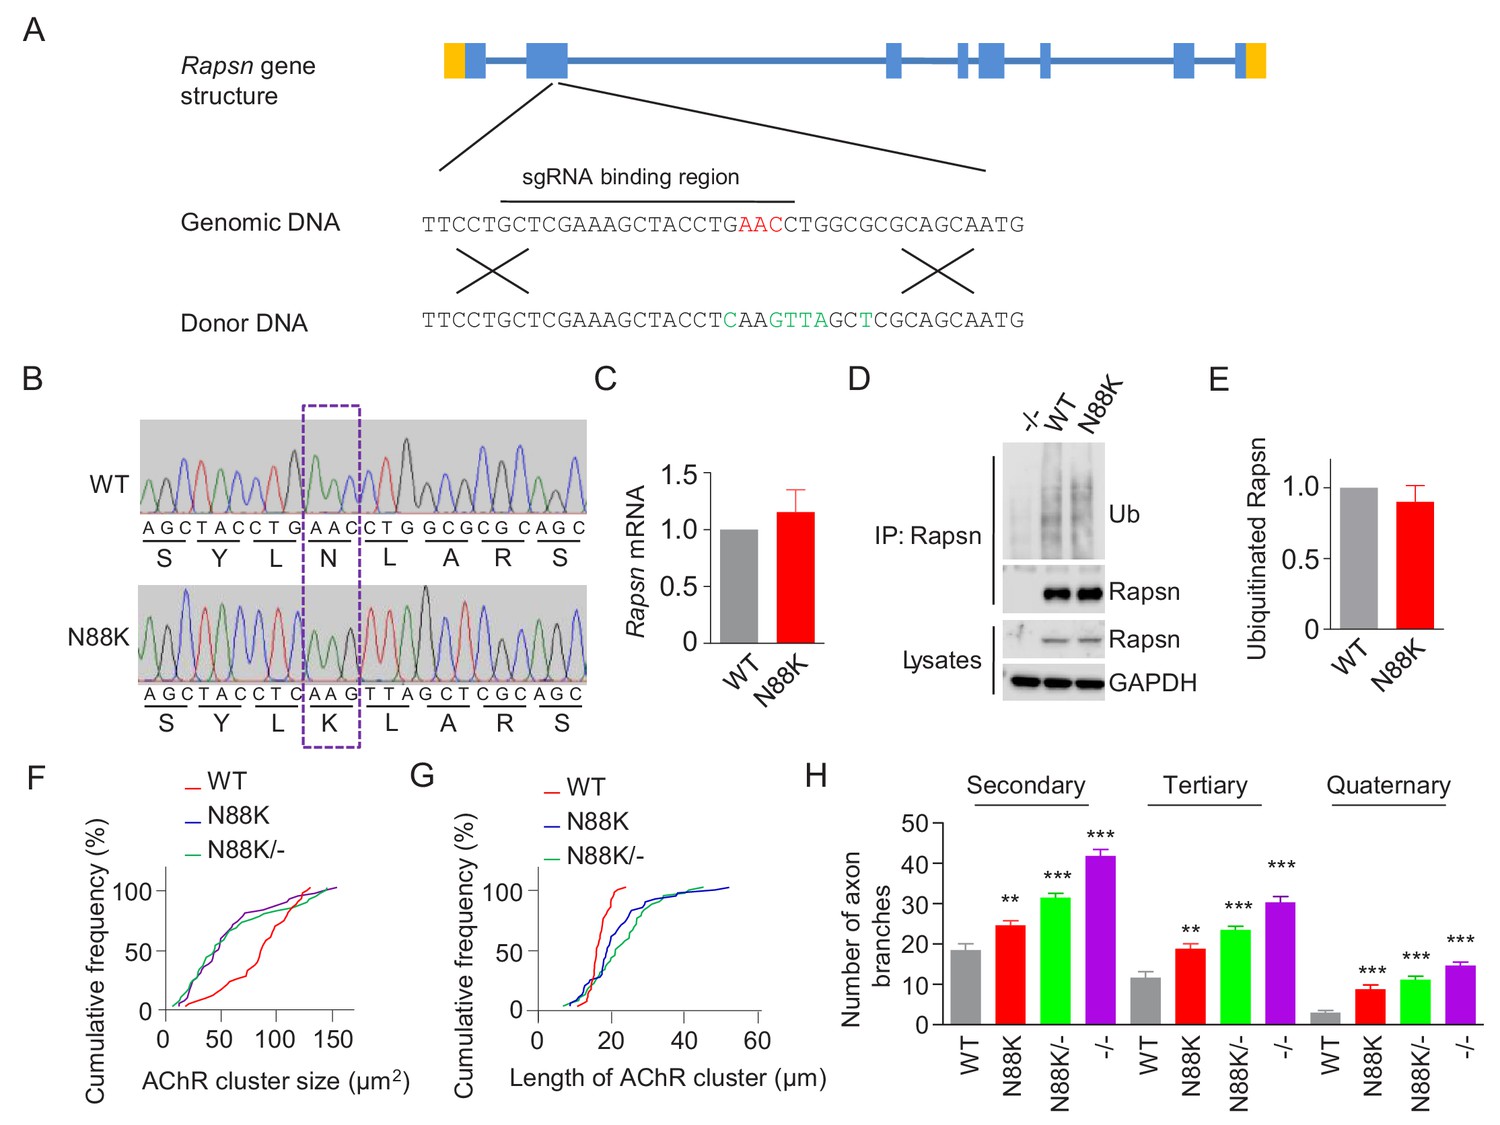
Reduced AChR cluster size, increased AChR cluster length and extensive nerve terminal arborization in N88K mt mice.
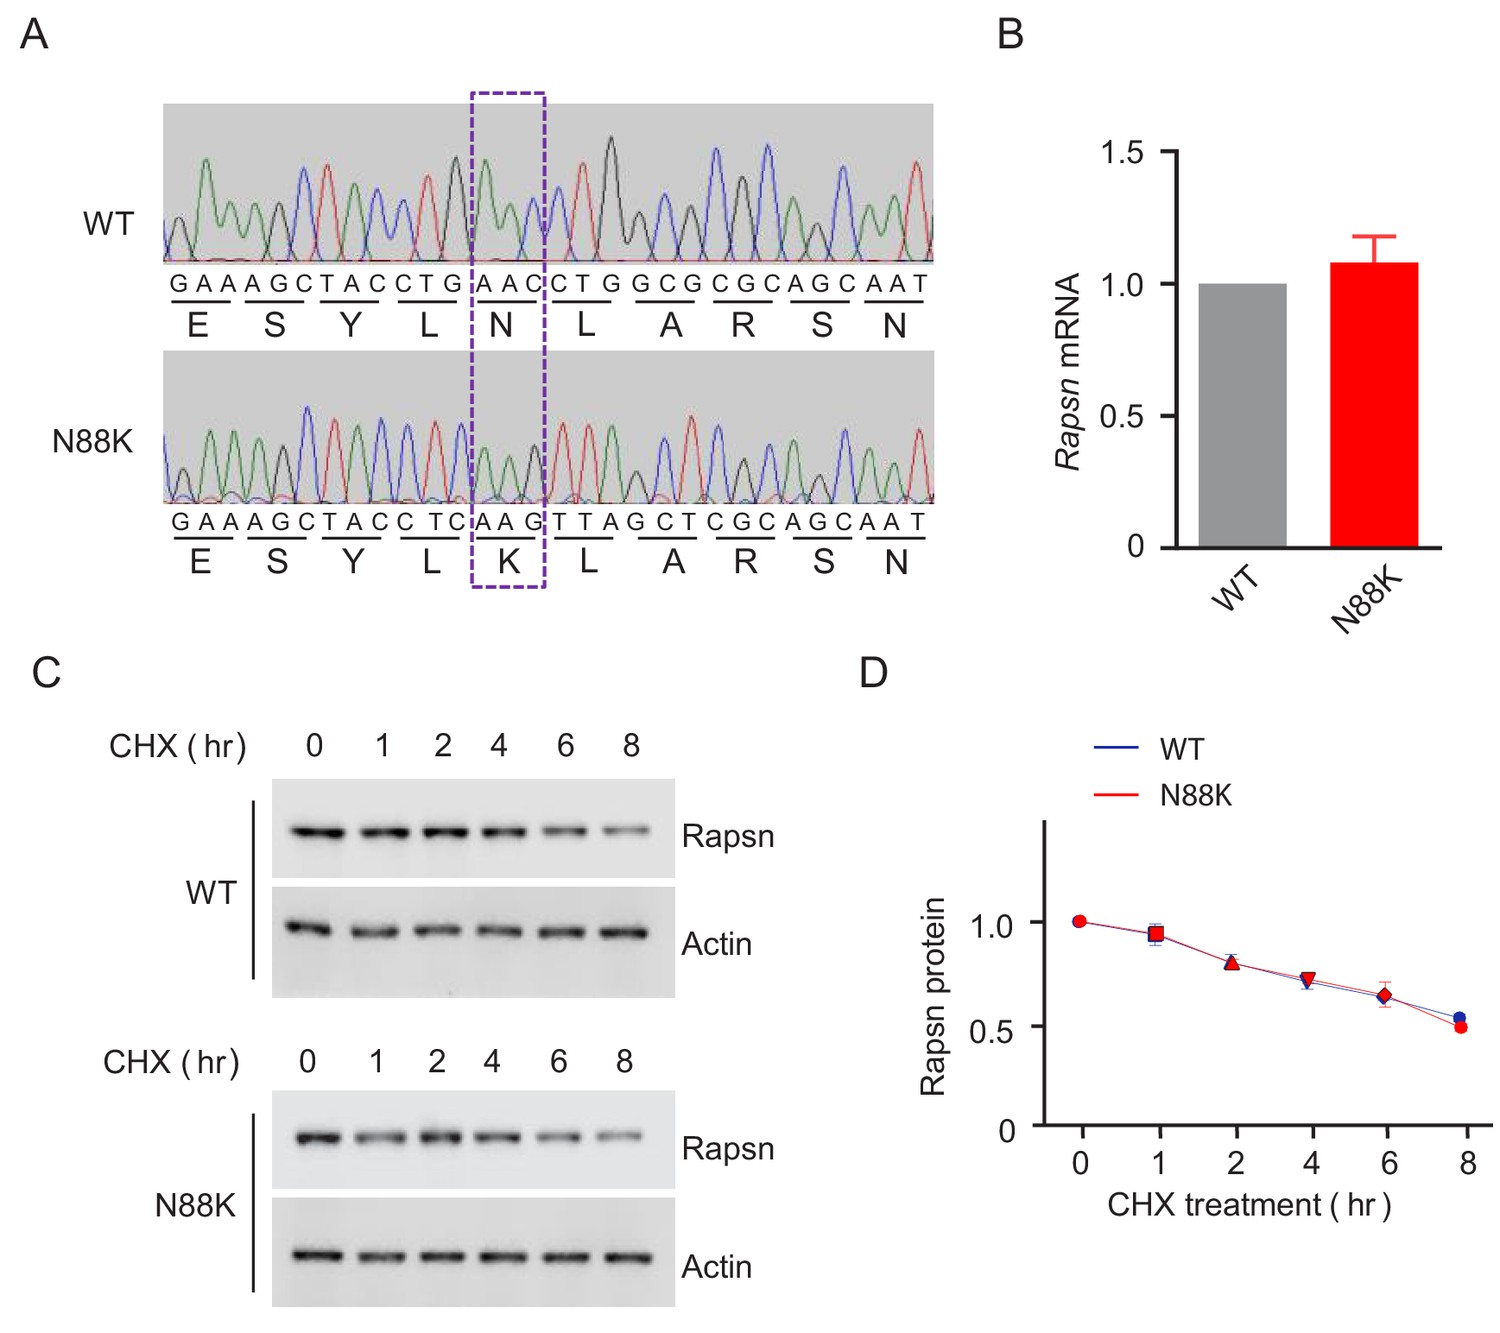
(A) Generation of N88K mt mice by CRISPR-Cas9. Top, the Rapsn gene structure. Genomic sequence flanking the Asn 88 was shown below. Guidance RNA sequence, GCT CGA AAG CTA CCT GAA CC, was labeled by a line. Asparagine (N) 88 was indicated in red. Bottom, DNA sequence of the donor, with the mutated base pairs in green. (B) Verification of N88K mutation by sequencing. Genomic DNA from WT and N88K mt mice was sequenced. Dashed rectangle to indicate N88K mutation. (C) Similar Rapsn mRNA level between WT and N88K mt mice. Data were shown as mean ± SEM, unpaired t-test, n = 3. (D) Similar Rapsn ubiquitinated level between WT and N88K mt mice. Rapsn protein was purified from P0 muscles of WT, N88K and - /- mice. The precipitated Rapsn was probed for ubiquitin. (E) Quantitative data in (D) (mean ± SEM), unpaired t-test, n = 3. (F–H) Cumulative frequency of AChR cluster size (F), cumulative frequency of length of AChR cluster (G) in Figure 1A, and quantitative analysis of secondary, tertiary, and quaternary axon branches (H) in Figure 1A. Data were shown as mean ± SEM; **, p<0.01; ***, p<0.001, One-way ANOVA, n = 6.
-
Figure 1—figure supplement 1—source data 1
Raw data, sample size (n), mean, SEM, p value, statistical methods and results are presented in Figure 1—figure supplement 1C, E and H.
- https://doi.org/10.7554/eLife.49180.004
Figure 2

Small junctional folds, reduced vesicle density and diminished aneural AChR clusters in N88K mt mice.
(A, B) Low magnification NMJ EM images of WT and N88K mt, including synaptic vesicles (SVs), synaptic cleft, synaptic basal lamina (SBL), and postsynaptic junctional folds (JF). M, muscle; N, nerve; (C, D) High magnification images of SVs, SBL, and JF. Note that junctional folds were smaller in N88K mt, and vesicle density was reduced in N88K mt, compared with WT controls. Asterisks indicate active zone. (E–H) Quantitative data of junctional fold length (E), synaptic vesicle density (F), vesicle diameter (G), synaptic cleft width (H) of WT and N88K mt. Data were shown as mean ± SEM; ***, p<0.001, unpaired t-test, n = 3 mice. (I–L) Few aneural AChR clusters in N88K mt mice at E14. E14 diaphragms from WT, N88K mt mice were stained whole-mount with Flour 594-α-BTX (red) to label AChR clusters and with anti-NF/Syn (green) antibodies to label motor nerve terminals. (I, J) Low magnification view. (K, L) High magnification view. (M, N) Quantitative data of endplate band width and AChR cluster number. Data were shown as mean ± SEM, ***, p<0.001, unpaired t-test, n = 3 mice.
-
Figure 2—source data 1
Sample size (n), mean, SEM, p value, statistical methods and results are presented in Figure 2E, F, G, H, M and N.
- https://doi.org/10.7554/eLife.49180.007
Figure 3
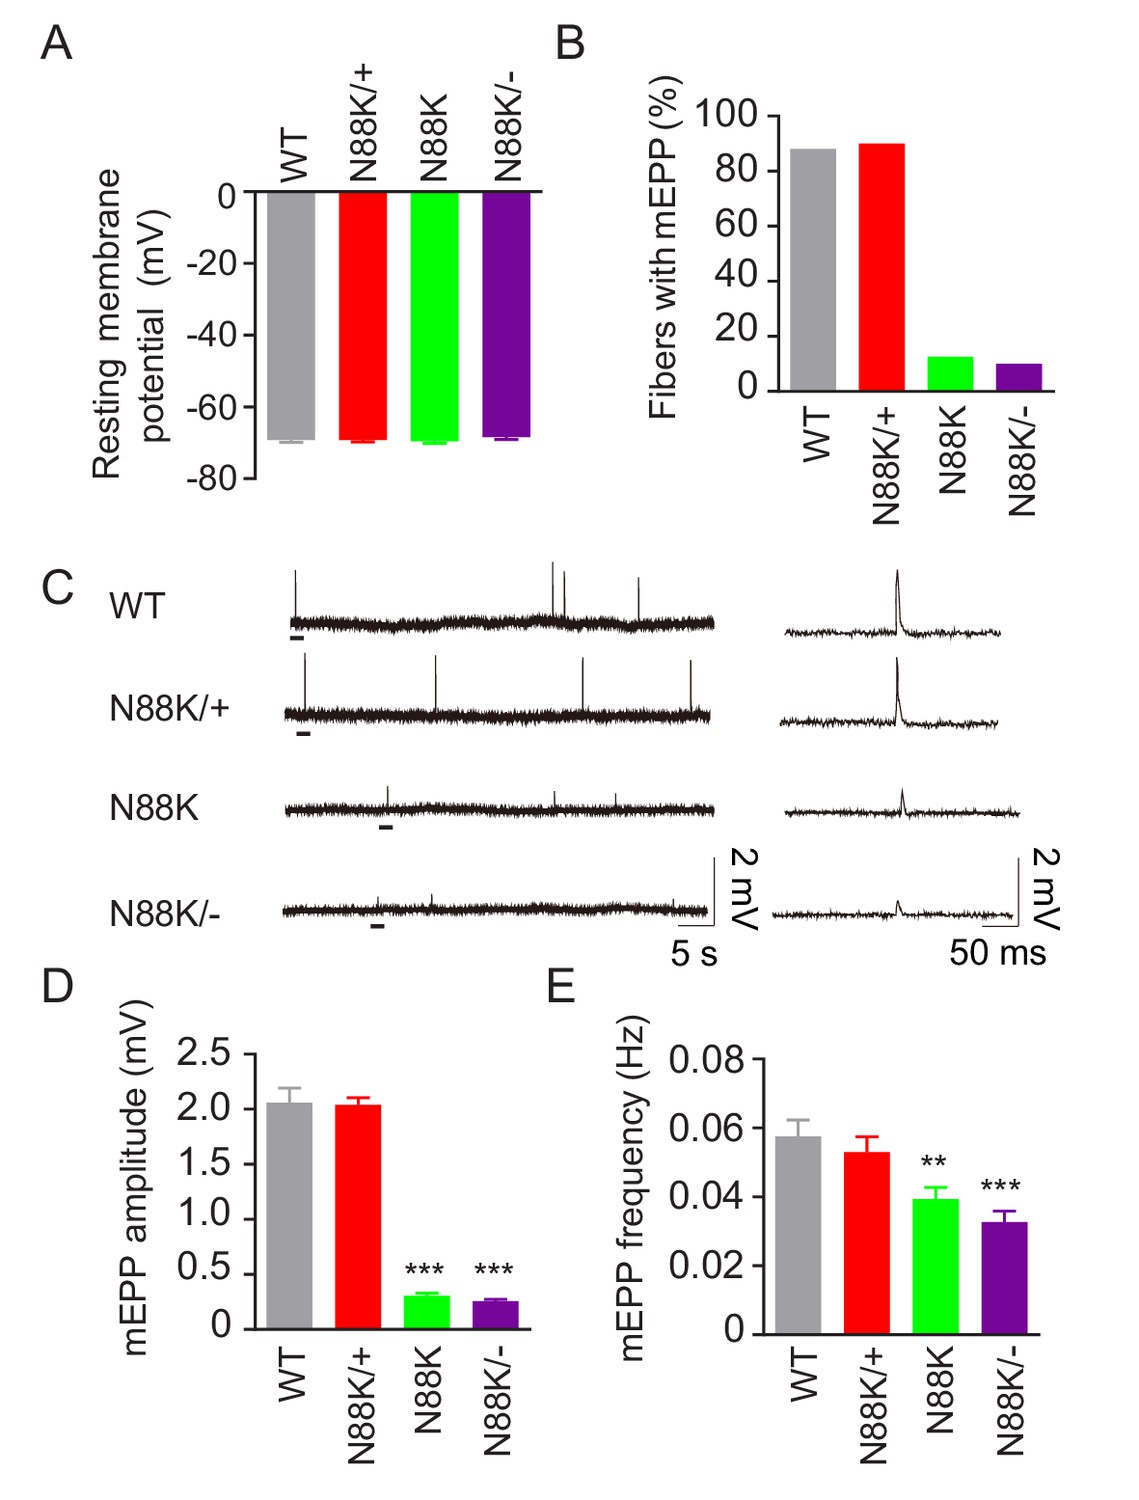
Reduced synaptic transmission in N88K mt mice.
(A) Comparable resting membrane potentials among WT, N88K/+, N88K mt, and N88K/- mt. P0 hemi-diaphragms at ventral, left were recorded. (B) Percentage of muscle fibers with mEPPs in 3 min of recording (n = 120, 6 mice). (C) Representative mEPP traces. (D, E) Reduced mEPP amplitude (D) and reduced mEPP frequency in N88K mt and N88K/- mt (E). Data were shown as mean ± SEM, **, p<0.01, ***, p<0.001, One-way ANOVA, n = 6 mice.
-
Figure 3—source data 1
Sample size (n), mean, SEM, p value, statistical methods and results are presented in Figures 3A, B, D and E.
- https://doi.org/10.7554/eLife.49180.009
Figure 4 with 2 supplements
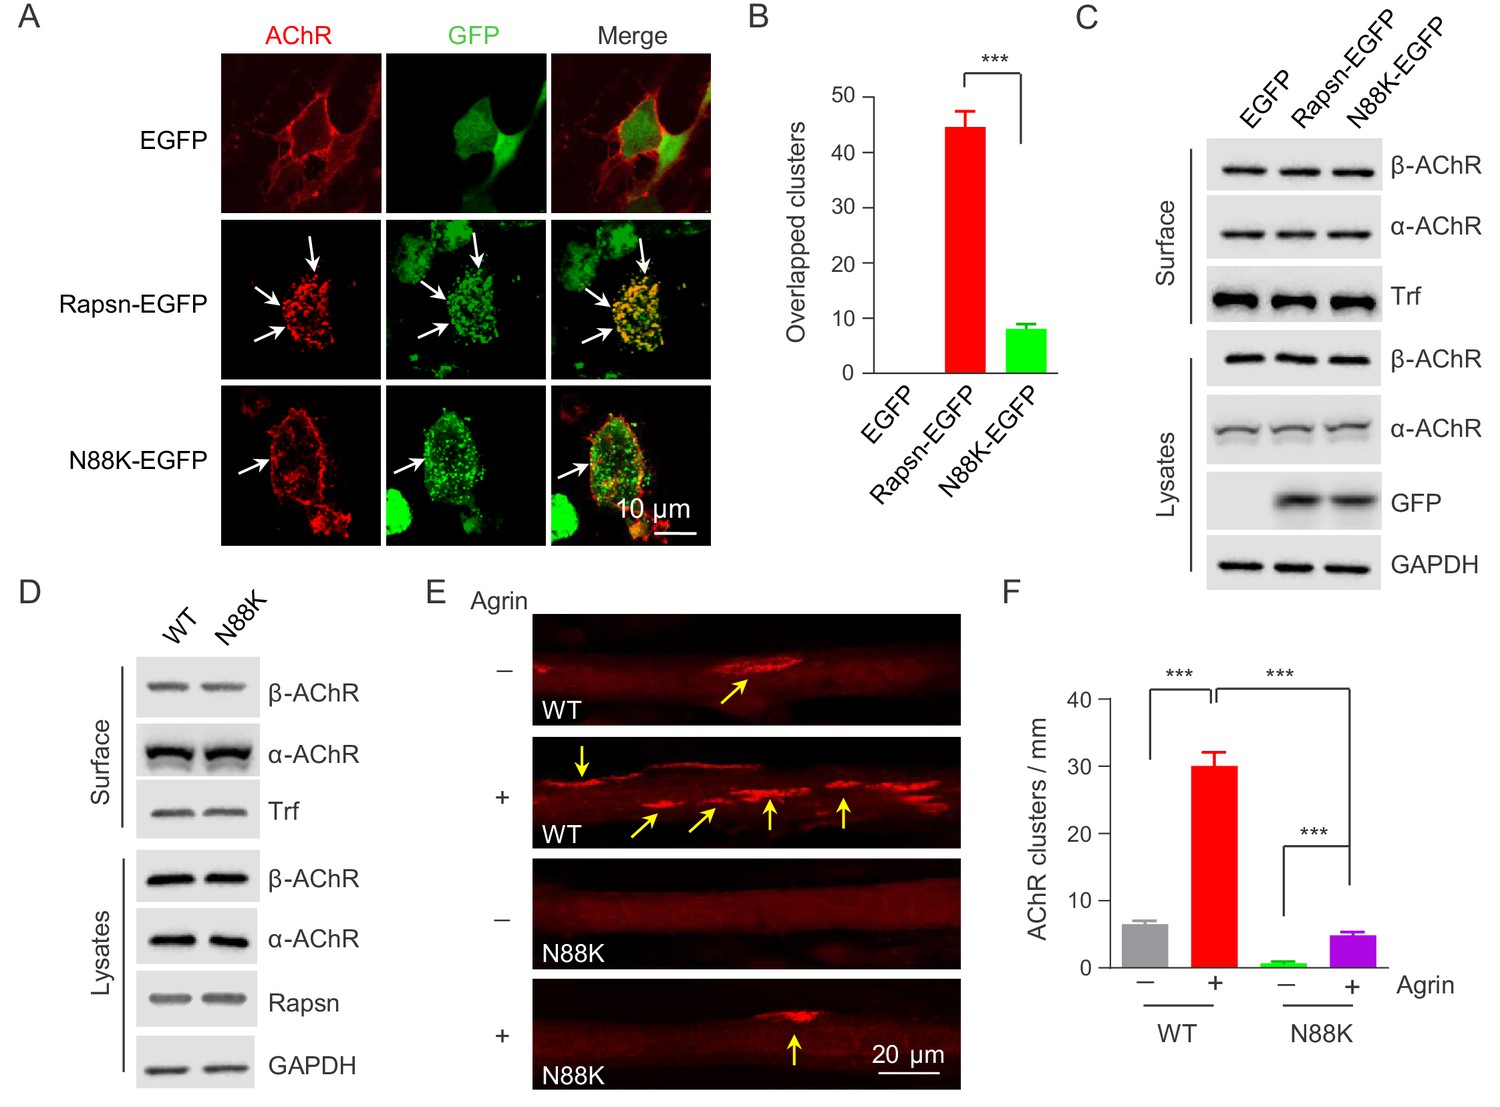
Impaired ability of N88K mt Rapsn in AChR clustering in HEK293T cells and in cultured muscle cells.
(A) Impaired ability of N88K mt Rapsn to induce AChR clustering in HEK293T cells. HEK293T cells were transfected with AChR subunits (α, β, γ, δ), along with EGFP empty vector, Rapsn-EGFP, or N88K-EGFP. After 36 hr, live, unfixed cells were incubated with Flour 594-α-BTX (red) to label surface AChRs. Arrows, AChR clusters colocalized with Rapsn clusters. (B) Quantitative data of (A) (mean ± SEM). ***, p<0.001, unpaired t-test, n = 20 cells. (C) Comparable amount of AChRs and Rapsn in (A). Total levels of α-AChR, β-AChR, Rapsn, and surface α-AChR, β-AChR in the parallel experiment of (A) were examined by western blotting, using GAPDH and Transferrin (Trf) as lysate and surface protein loading controls, respectively. (D) Comparable total Rapsn and AChR, and surface AChR expression in N88K mt cultured myotubes. Total α-AChR, β-AChR, Rapsn and surface α-AChR, β-AChR from WT or N88K mt C2C12 myotubes were examined by western blotting, using GAPDH and Trf as lysate and surface protein loading controls, respectively. (E) Fewer Agrin-induced AChR clusters in N88K mt C2C12 myotubes, compared with WT controls. Myotubes were treated with or without 50 ng/ml Agrin for 12 hr. Arrows, AChR clusters. (F) Quantitative data of (E) (mean ± SEM), ***, p<0.001, Two-way ANOVA, n = 20 cells. Also see Figure 4—figure supplement 1 and Figure 4—figure supplement 2.
-
Figure 4—source data 1
Sample size (n), mean, SEM, p value, statistical methods and results are presented in Figure 4B and F.
- https://doi.org/10.7554/eLife.49180.015
Figure 4—figure supplement 1
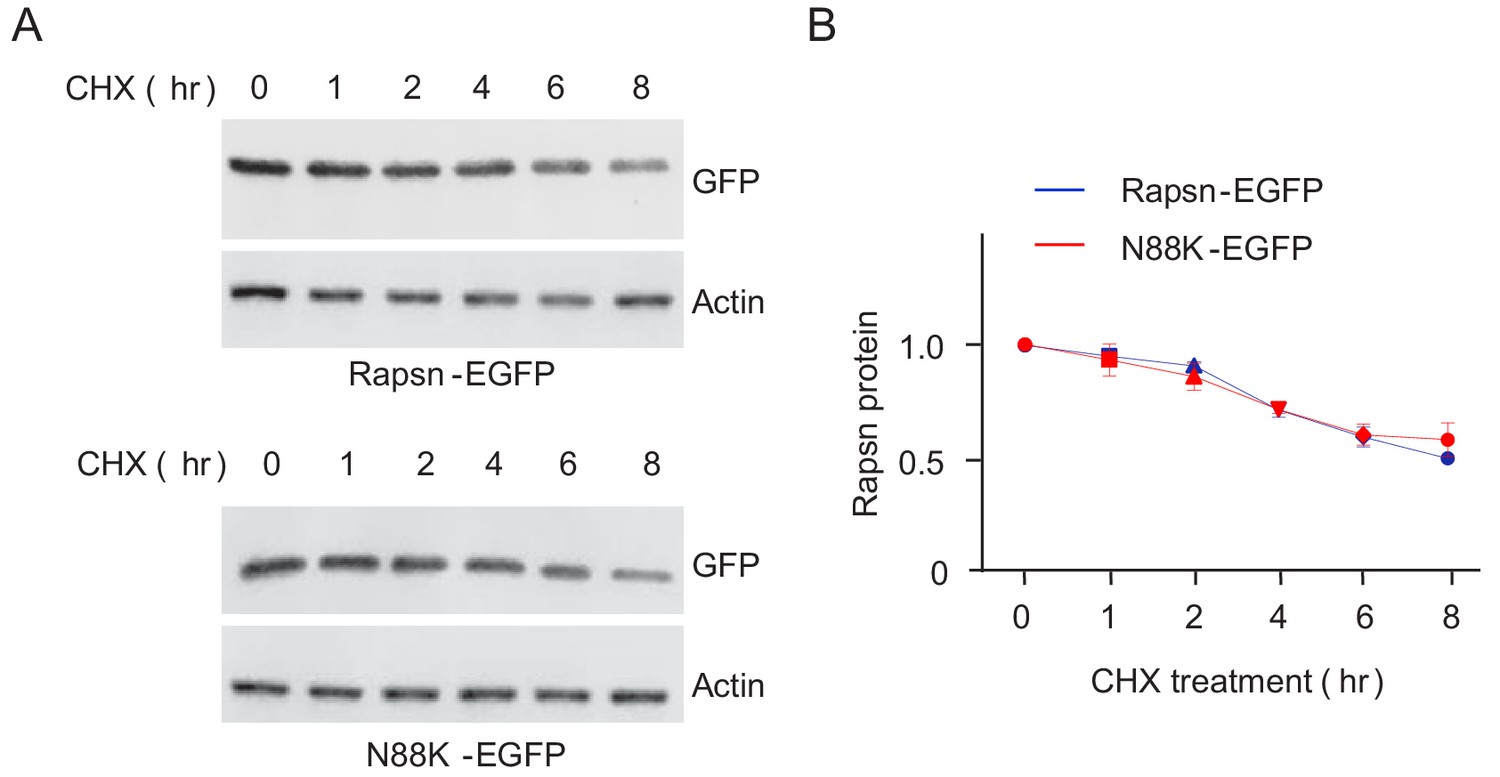
Comparable protein stability between WT and N88K mt Rapsn in HEK293T cells.
(A) Comparable degradation rate between WT and N88K mt Rapsn in HEK293T cells. HEK293T cells were transfected with EGFP tagged WT or N88K mt Rapsn. After 24 hr, cells were separated into 6-well plates and cultured for additional 12 hr. The resulting cells in 6-well plates were treated with cycloheximide (CHX, 50 μM) for indicated times. Cells were lysed and probed with anti-GFP antibody. (B) Quantitative data in (A) (mean ± SEM), unpaired t-test, n = 3.
-
Figure 4—figure supplement 1—source data 1
Raw data, sample size (n), mean, SEM, p value, statistical methods and results are presented in Figure 4—figure supplement 1B.
- https://doi.org/10.7554/eLife.49180.012
Figure 4—figure supplement 2
Comparable Rapsn mRNA level and Rapsn protein stability between WT and N88K mt myotubes.
(A) Verification of N88K mutation by genomic DNA sequencing. Genomic DNA of WT and N88K mt C2C12 was sequenced and aligned. Dashed rectangle to indicate N88K mutation. (B) Comparable Rapsn mRNA level between WT and N88K mt myotubes. Data were shown as mean ± SEM; unpaired t-test, n = 3. (C) Comparable Rapsn protein stability between WT and N88K mt culture myotubes. WT or N88K mt myotubes were treated with CHX (50 μM) for indicated times. Resulting lysates were subject to western blotting with anti-Rapsn antibody. (D) Quantitative data in (C) (mean ± SEM), unpaired t-test, n = 3.
-
Figure 4—figure supplement 2—source data 1
Raw data, sample size (n), mean, SEM, p value, statistical methods and results are presented in Figure 4—figure supplement 2B and D.
- https://doi.org/10.7554/eLife.49180.014
Figure 5 with 1 supplement

Reduced E3 ligase activity in N88K mt Rapsn.
(A) Schematic diagram of extraction of surface AChRs from C2C12 myotubes. Live C2C12 myotubes were incubated with biotin-α-BTX at 4°C for 1 hr to capture AChR complex, and then were lysed. Resulting biotin-α-BTX-AChR complex in lysates were precipitated by streptavidin-coupled agarose beads. Cell lysates, precipitated AChRs and AChR-associated proteins were examined by western blotting. (B) Comparable amounts of Actin and Rapsn were co-precipitated by surface AChR between WT and N88K mt C2C12 myotubes. Surface AChRs from WT or N88K mt myotubes were isolated, and associated Rapsn and actin were examined by western blotting. (C) Reduced Rapsn E3 ligase activity by N88K mutation in HEK293T cells. HEK293T cells were transfected with HA tagged WT, C366A, or N88K mt Rapsn, along with Flag-δ-AChR and Nedd8-Myc. After 48 hr, cells were lysed and precipitated with anti-Flag beads to pull down δ-AChR. The precipitated δ-AChR was blotted with anti-Nedd8 antibody to examine its neddylation. (D) Quantitative data of neddylated δ-AChR in (C) (mean ± SEM), ***, p<0.001, One-way ANOVA, n = 3. (E–H) Reduced Rapsn E3 ligase activity in N88K mt cultured myotubes and in mt mice. (E, F) WT and N88K mt cultured myotubes were treated with Agrin for 2 hr. Myotubes were lysed and precipitated with anti-Nedd8 antibody. The resulting lysates and precipitated proteins were blotted with indicated antibodies to reveal neddylated δ-AChR, readout for E3 ligase activity of Rapsn (E). (F) Quantitative data in (E) (mean ± SEM), ***, p<0.001, unpaired t-test, n = 3. (G) Neddylated δ-AChR was examined in WT or N88K mt mice. (H) Quantitative data in (G) (mean ± SEM), ***, p<0.001, unpaired t-test, n = 3. Also see Figure 5—figure supplement 1.
-
Figure 5—source data 1
Raw data, sample size (n), mean, SEM, p value, statistical methods and results are presented in Figure 5D, F and H.
- https://doi.org/10.7554/eLife.49180.019
Figure 5—figure supplement 1

Comparable binding ability of N88K mt Rapsn with subunits of AChR and Actin.
(A, B) HEK293T cells were cotransfected with HA tagged WT or N88K mt Rapsn and Flag tagged α-AChR (A) or δ-AChR (B). After 48 hr, cells were lysed and the interaction of Rapsn with subunits of AChR was examined by co-immunoprecipitation with anti-HA immobilized on beads. Note that WT and N88K mt Rapsn showed comparable binding ability to α-AChR and δ-AChR. (C) Actin-anchored WT or N88K mt Rapsn showed similar resistance to 0.05% Triton X-100. Plates with WT or N88K mt myotubes were treated with 0.05% Triton X-100 for 10 min on ice to collect lysates. The plates were then incubated with 1% Triton X-100 to collect complexes resistant to 0.05%-Triton X-100 solubilization. Rapsn level in both conditions was probed. (D) Quantitative data in (C) (mean ± SEM), ns, no significant difference, unpaired t-test, n = 3.
-
Figure 5—figure supplement 1—source data 1
Raw data, sample size (n), mean, SEM, p value, statistical methods and results are presented in Figure 5—figure supplement 1D.
- https://doi.org/10.7554/eLife.49180.018
Figure 6
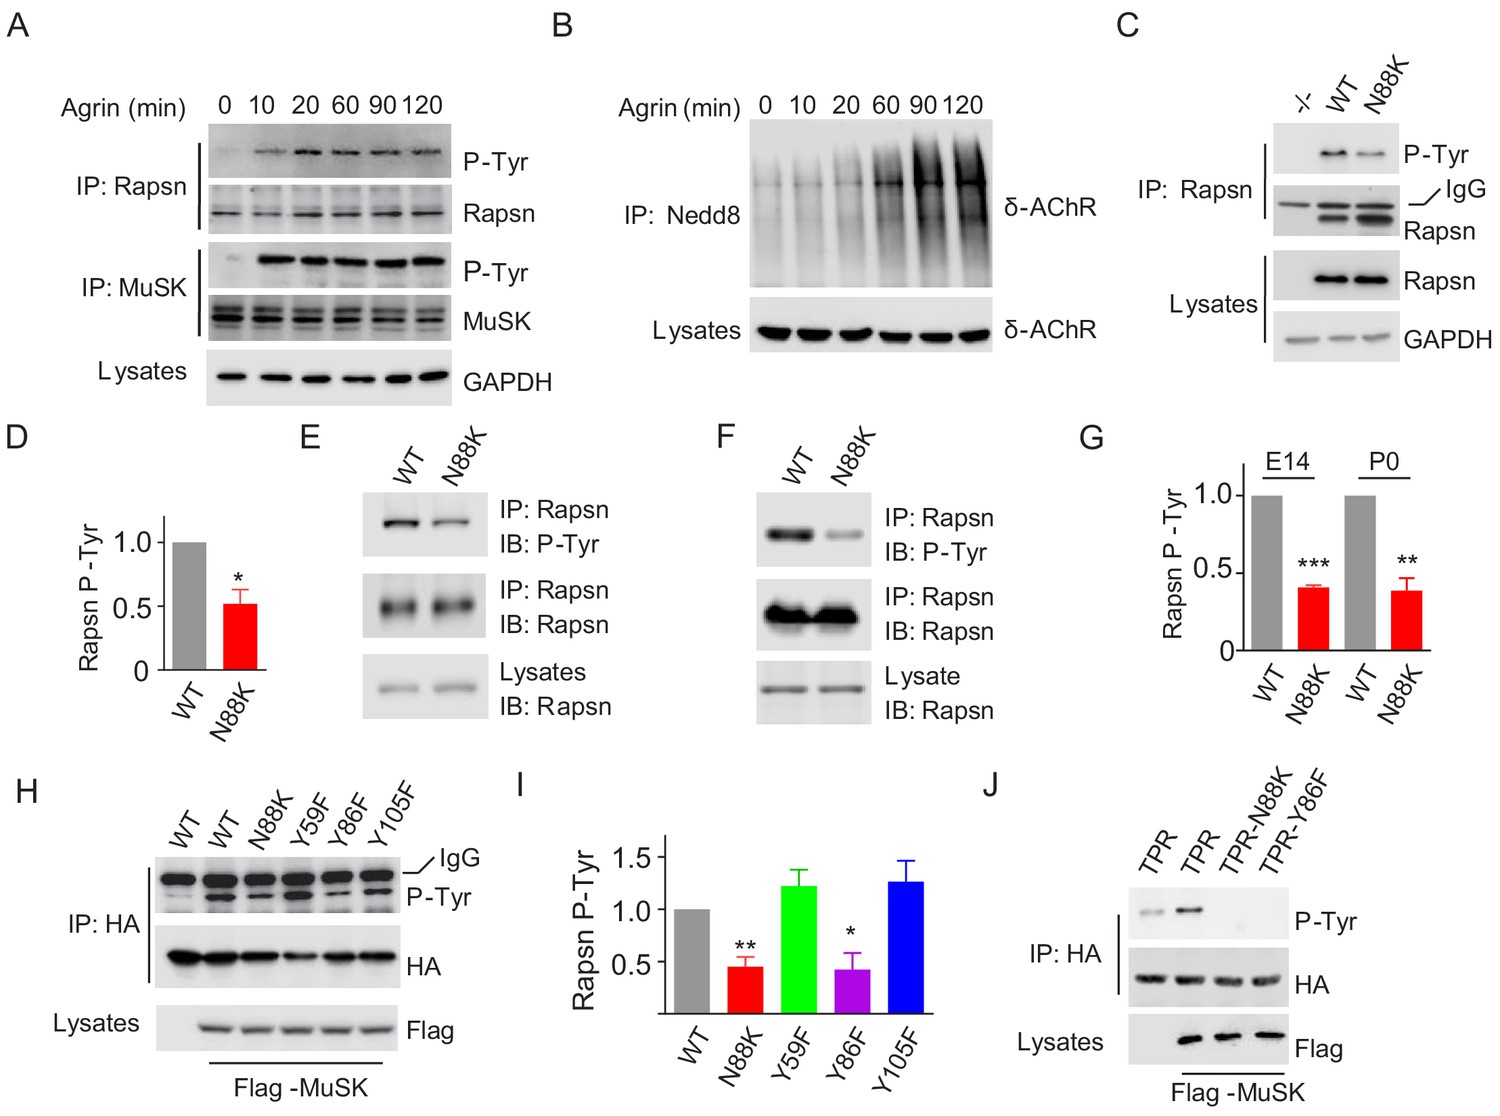
Impaired Y86 phosphorylation by N88K mutation.
(A) Agrin treatment induced tyrosine phosphorylation of Rapsn in cultured myotubes. WT cultured myotubes were treated with Agrin for indicated times. Cells were lysed and were incubated with anti-Rapsn antibody to precipitate Rapsn protein, and probed with anti-p-Tyr antibody to examine tyrosine phosphorylation of Rapsn. MuSK tyrosine phosphorylation was examined as positive controls. (B) Agrin treatment induced E3 ligase activity of Rapsn in culture myotubes. WT cultured myotubes were treated with Agrin for indicated times. Neddylated δ-AChR was examined to reveal E3 ligase activity of Rapsn. (C) Reduced tyrosine phosphorylation of Rapsn by N88K mutation in cultured myotubes. WT, N88K mt, Rapsn null mt (-/-) cultured myotubes were treated with Agrin for 2 hr, and then tyrosine phosphorylation of Rapsn was examined. (D) Quantitative data in (C) (mean ± SEM), *, p<0.05, unpaired t-test, n = 3. (E–G) Reduced tyrosine phosphorylation of Rapsn by N88K mutation in mt mice. Rapsn protein was precipitated with anti-Rapsn antibody from muscle homogenates of WT or N88K mice at E14 (E) and P0 (F) and probed with anti-p-Tyr antibody to examine tyrosine phosphorylation of Rapsn. (G) Quantitative data in (E) and (F) (mean ± SEM), **, p<0.01, ***, p<0.001, unpaired t-test, n = 3. (H) Reduced MuSK-induced Rapsn tyrosine phosphorylation by N88K and Y86F mutations in HEK293T cells. HEK293T cells were transfected HA tagged WT or indicated mt Rapsn, along with Flag tagged MuSK, or not. Precipitated Rapsn protein with anti-HA beads was probed with anti-p-Tyr antibody to reveal tyrosine phosphorylation of Rapsn. (I) Quantitative data of (H) (mean ± SEM), *, p<0.05, **, p<0.001, unpaired t-test, n = 3. (J) Abolished MuSK-induced TPR1-7 (TPR) tyrosine phosphorylation by N88K and Y86F mutations in HEK293T cells. Same as (H), MuSK-induced WT, Y86F, or N88K mt TPR was detected in HEK293T cells.
-
Figure 6—source data 1
Raw data, sample size (n), mean, SEM, p value, statistical methods and results are presented in Figure 6D, G and I.
- https://doi.org/10.7554/eLife.49180.021
Figure 7 with 1 supplement

Critical roles of Y86 phosphorylation in activating Rapsn E3 ligase activity and AChR clustering.
(A) Reduced E3 ligase activity of Rapsn by Y86F mutation in transfected HEK293T cells. (B) Quantitative data of neddylated δ-AChR in (A) (mean ± SEM), ***, p<0.001, One-way ANOVA, n = 3. (C) Reduced Rapsn tyrosine phosphorylation in Y86F mt myotubes, compared with WT controls. (D) Quantitative data of tyrosine phosphorylation of Rapsn in (C) (mean ± SEM), *, p<0.05, unpaired t-test, n = 3. (E) Fewer Agrin-induced AChR clusters in Y86F mt C2C12 myotubes, compared with WT controls. Arrows, AChR clusters. (F) Quantitative data in (E), (mean ± SEM), **, p<0.01, ***, p<0.001, Two-way ANOVA, n = 20 cells. (G) Reduced E3 ligase activity of Rapsn in Y86F mt myotubes. (H) Quantitative data in (G) (mean ± SEM), ***, p<0.001, unpaired t-test, n = 3. (I) Agrin treatment increased Rapsn self-association. Cultured C2C12 cells were transfected with HA- and EGFP-tagged Rapsn, respectively. Resulting myotubes were treated with Agrin. Cell lysates were subjected to co-immunoprecipitation with anti-HA beads, and probed with anti-GFP antibody to reveal the association between Rapsn-HA and Rapsn-EGFP. (J) Quantitative analysis of MuSK and Rapsn tyrosine phosphorylation in Figure 6A, neddylated δ-AChR in Figure 6B, and Rapsn self-association in Figure 7I. Data were shown as mean ± SEM, **, p<0.01, ***, p<0.001 (compared with time 0), One-way ANOVA, n = 3. (K–N) Reduced Rapsn self-association by Y86F (K) or N88K (M) mutation revealed by co-immunoprecipitation in HEK293T cells. Quantitative data of WT or Y86F Rapsn self-association(L); WT or N88K Rapsn self-association (M) (mean ± SEM), *, p<0.05; ***, p<0.001, unpaired t-test, n = 3. Also see Figure 7—figure supplement 1.
-
Figure 7—source data 1
Raw data, sample size (n), mean, SEM, p value, statistical methods and results are presented in Figure 7B, D, F, H, J, L and N.
- https://doi.org/10.7554/eLife.49180.025
Figure 7—figure supplement 1
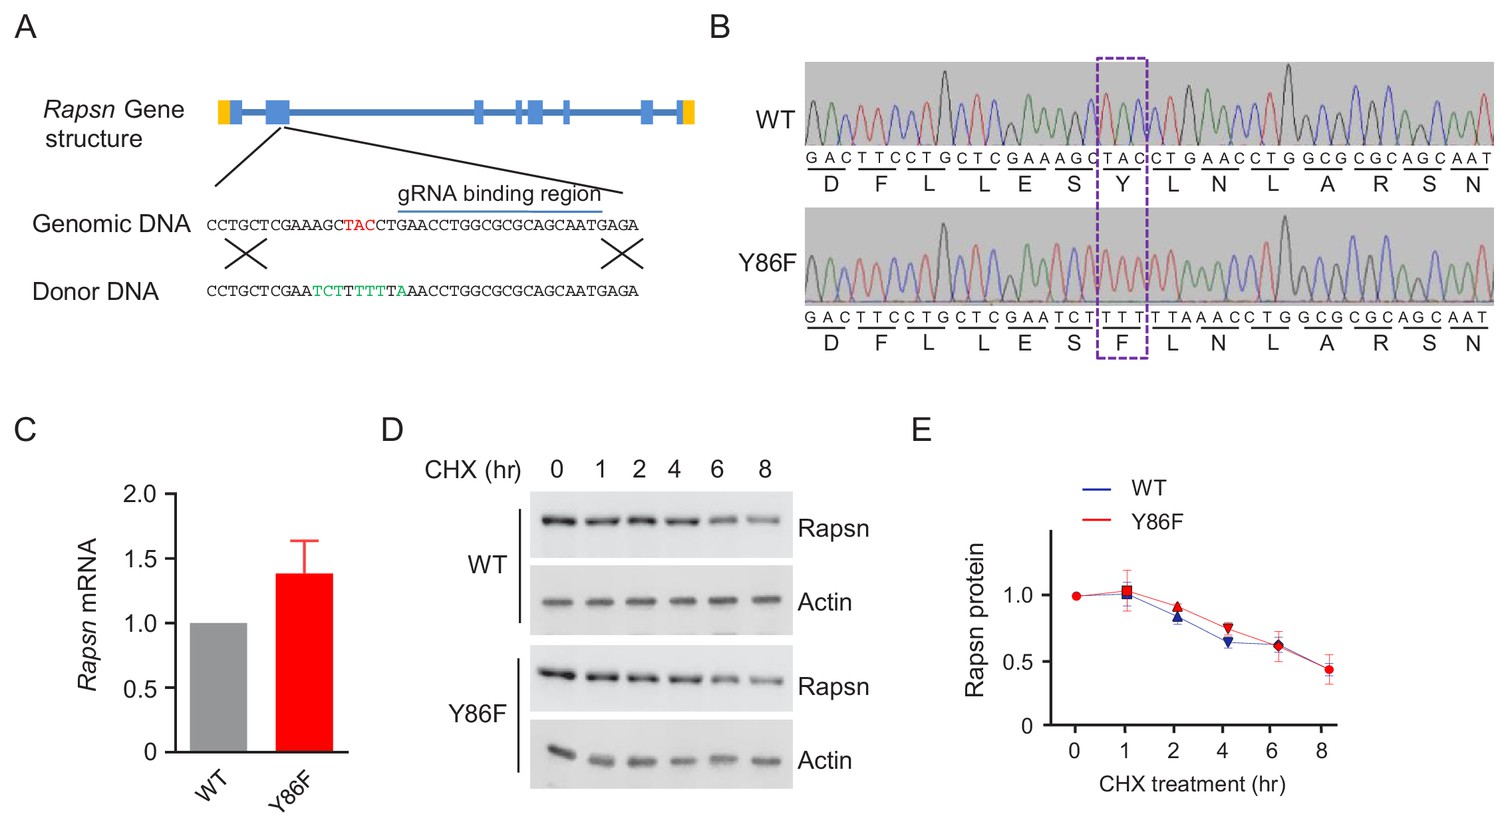
Comparable Rapsn mRNA level and Rapsn protein stability between WT and Y86F mt myotubes.
(A) Generation of Y86F mt C2C12 cells by CRISPR-Cas9. Top, the Rapsn gene structure. Genomic sequence flanking the Y86 was shown below. Guidance RNA targeting sequence, CAT TGC TGC GCG CCA GGT TC, was underlined. Y86 was indicated in red. Bottom, DNA sequence of the donor, with the mutated base pairs in green. (B) Verification of Y86F mutation by sequencing. Y86F mutation was highlighted by dashed rectangle. (C) Rapsn mRNA level between WT and Y86F mt cultured myotubes were comparable, examined by real-time PCR. Data were shown as mean ± SEM; unpaired t-test, n = 3. (D) Same degradation rate of WT or Y86F mt Rapsn in culture myotubes. (E) Quantitative data in (D) (mean ± SEM), unpaired t-test, n = 3.
-
Figure 7—figure supplement 1—source data 1
Raw data, sample size (n), mean, SEM, p value, statistical methods and results are presented in Figure 7—figure supplement 1C and E.
- https://doi.org/10.7554/eLife.49180.024
Figure 8 with 1 supplement
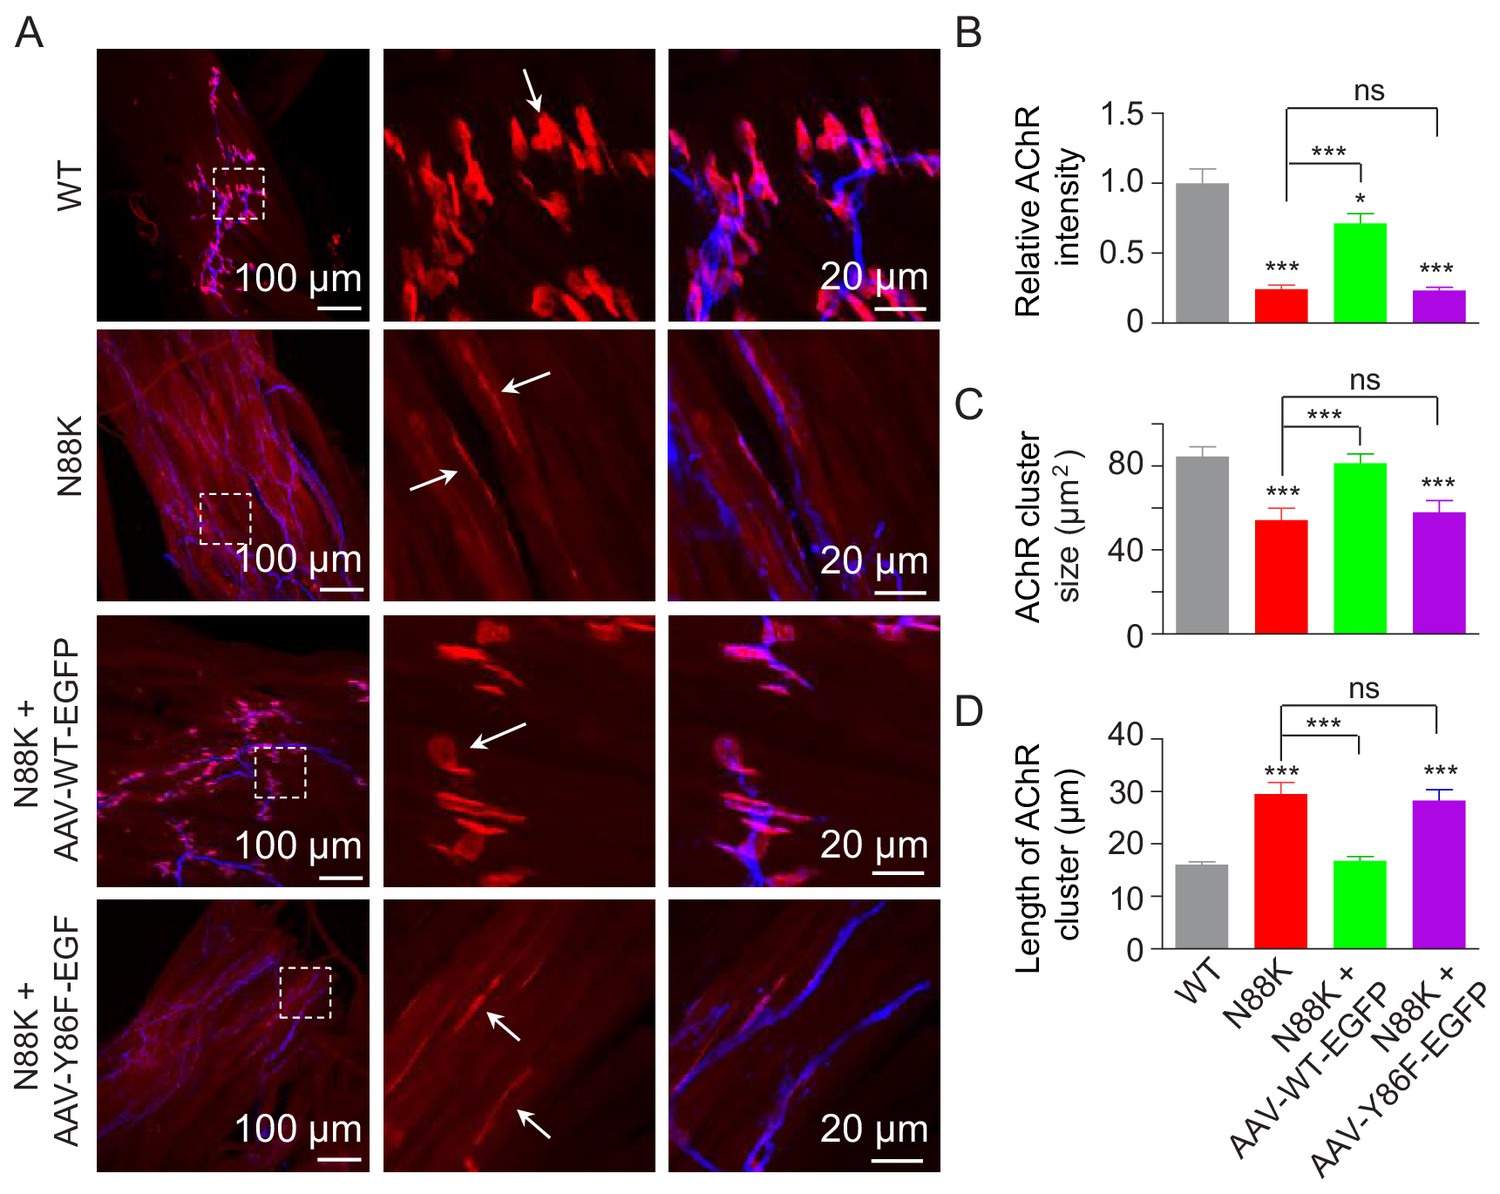
Rescue of NMJ deficits by WT Rapsn but not phospho-preventing Y86F mt.
(A) Thigh muscles of N88K mt were infected with AAV-WT-Rapsn-EGFP (N88K + AAV-WT-EGFP), or infected with AAV-Y86F-Rapsn-EGFP (N88K + AAV-Y86F-EGFP) at E13. The resulting P0 muscles were stained with Flour 594-α-BTX (red) and anti-NF/Syn antibodies (blue) to examine AChR clusters, using uninfected WT or N88K mt as positive or negative controls. (B–D) Quantitative analysis of AChR cluster fluorescence intensity (B), AChR cluster size (C), AChR cluster length (D). White arrows, AChR clusters. Data were shown as mean ± SEM; *, p<0.05; ***, p<0.001, ns, no significant difference, One-way ANOVA, n = 3. Also see Figure 8—figure supplement 1.
-
Figure 8—source data 1
Sample size (n), mean, SEM, p value, statistical methods and results are presented in Figure 8B, C and D.
- https://doi.org/10.7554/eLife.49180.028
Figure 8—figure supplement 1
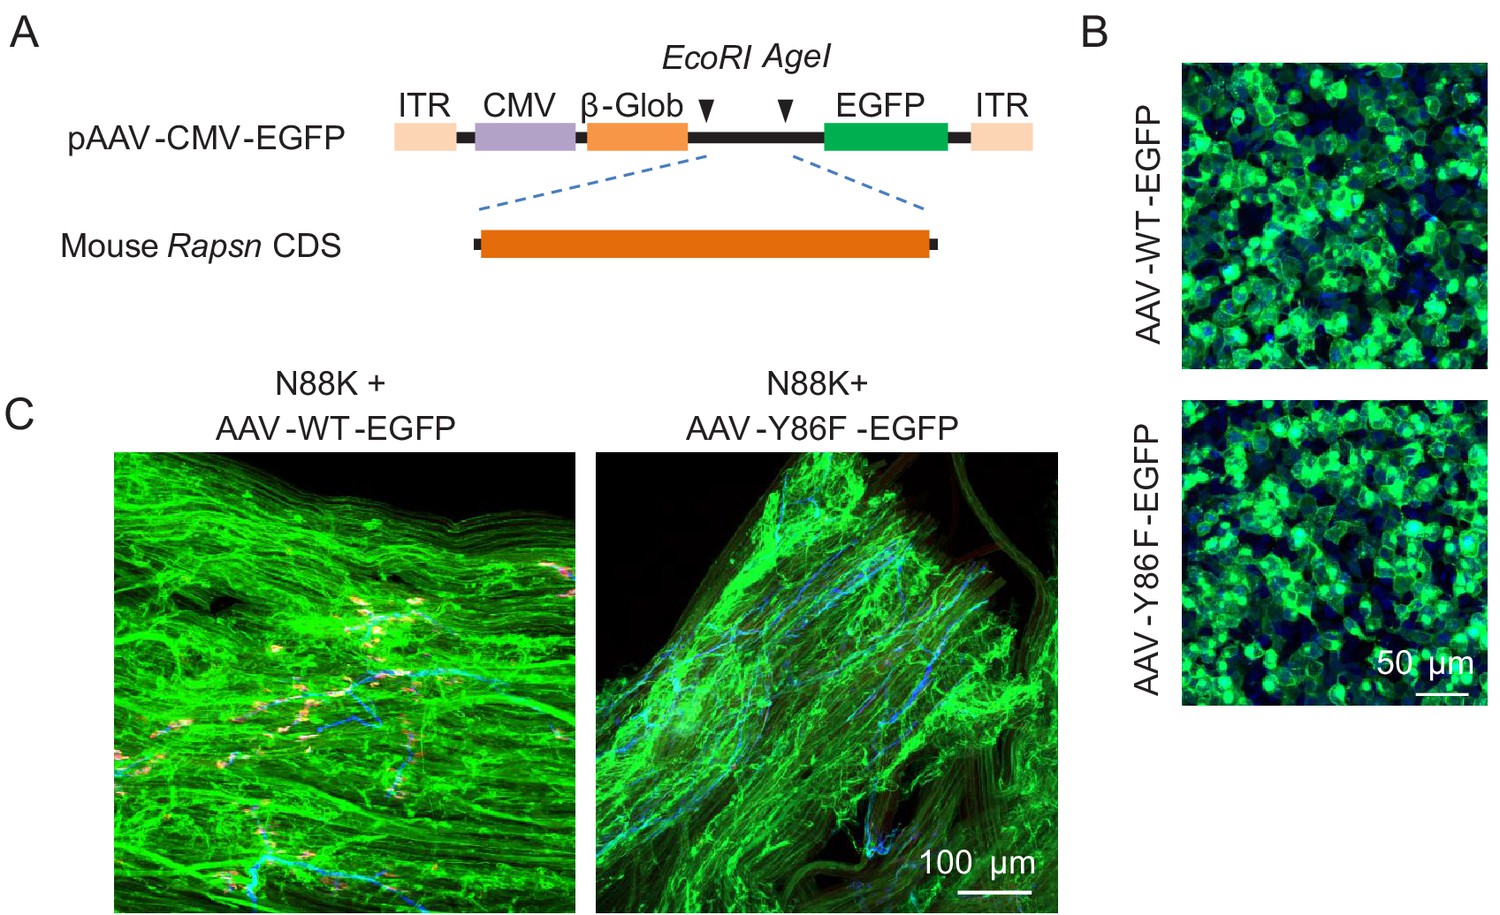
Generation of AAV vectors expressing WT or Y86F mt Rapsn and examination of AAV expression.
(A) Schematic diagram of generation of AAV vector expressing Rapsn. (B) HEK293T cells were infected with AAV-Rapsn-EGFP (AAV-WT-EGFP) or AAV-Y86F-Rapsn-EGFP (AAV-Y86F-EGFP). After 24 hr, Rapsn-EGFP or Y86F-EGFP expression was confirmed by GFP fluorescence. (C) Infected muscle fibers by AAV-WT-EGFP or AAV-Y86F-EGFP.
Tables
Key resources table
| Reagent type (species) or resource | Designation | Source or reference | Identifiers | Additional information |
|---|---|---|---|---|
| Genetic reagent (M. musculus) | Rapsn-/- | PMID: 7675108 | ||
| Genetic reagent (M. musculus) | N88K | This paper | See detail information in Materials and methods . | |
| Cell line (Homo sapiens) | HEK293T | ATCC | Cat#:CRL-3216 RRID: CVCL_0042 | From ATCC; Cell identity has been confirmed by STR profiling and cell line was found to be free of Mycoplasma. |
| Cell line (M. musculus) | C2C12 | ATCC | Cat#: CRL-1772 RRID: CVCL_0188 | From ATCC; Cell identity has been confirmed by STR profiling and cell line was found to be free of Mycoplasma. |
| Cell line (M. musculus) | N88K mt C2C12 | This paper | See detail information in Material and methods). | |
| Cell line (M. musculus) | Y86F mt C2C12 | This paper | See detail information in Material and methods. | |
| Cell line (M. musculus) | Rapsn-/- C2C12, clone 11–7 | PMID: 10414969 | ||
| Antibody | Mouse monoclonal anti-HA Agarose | Thermo Fisher Scientific | Cat#: 26181, RRID: AB_2537081 | 1: 40 for IP |
| Antibody | Goat anti-rabbit IgG conjugated with Alexa Fluor 488 | Thermo Fisher Scientific | Cat#: A-11008 RRID: AB_10563748 | IHC (1:500) |
| Antibody | Rabbit polyclonal anti-Actin | Cell Signaling Technology | Cat #: 4967, RRID: AB_330288 | WB (1:10000) |
| Antibody | Rabbit polyclonal anti- α-Actin | Abcam | Cat #: ab52218 RRID: AB_870573 | WB (1:1000) |
| Antibody | Rabbit polyclonal anti-Flag | Sigma-Aldrich | Cat #: F7425 RRID: AB_439687 | WB (1:1000) |
| Antibody | Mouse monoclonal anti-GAPDH (Clone, 6C5) | Santa Cruz Biotechnology | Cat #: sc-32233, RRID: AB_627679 | WB (1:10000) |
| Antibody | Rabbit polyclonal anti-neurofilament | Cell Signaling Technology | Cat#: 2837, RRID: AB_823575 | IHC (1:1000) |
| Antibody | Rabbit polyclonal anti-synapsin | Cell Signaling Technology | Cat#: 5297, RRID: AB_2616578 | IHC (1:1000) |
| Antibody | Mouse monoclonal anti-Ubiquitin (Clone, Ubi-1) | Abcam | Cat#: ab7254, RRID: AB_305802 | WB (1:1000) |
| Antibody | Rabbit polyclonal anti-GFP | Cell Signaling Technology | Cat#: 2555, RRID: AB_10692764 | WB (1:1000) |
| Antibody | Mouse monoclonal P-Tyr-100 | Cell Signaling Technology | Cat #: 9411 RRID: AB_331228 | WB (1:1000) |
| Antibody | Mouse monoclonal Anti-Flag affinity gel (Clone, M2) | Sigma-Aldrich | Cat#: A2220, RRID: AB_10063035 | 1: 50 for IP |
| Antibody | Rabbit polyclonal anti-HA | Sigma-Aldrich | Cat#: H6908, RRID: AB_260070 | WB (1:2000) |
| Antibody | Mouse monoclonal anti-Rapsn (Clone 1234) | Abcam | Cat#: ab11423, RRID: AB_298028 | WB (1:1000) |
| Antibody | Rabbit polyclonal anti-Transferrin | Abcam | Cat#: ab82411, RRID: AB_1659060 | WB (1:1000) |
| Antibody | Mouse monoclonal anti-δ-AChR (Clone, 88B) | Thermo Fisher Scientific | Cat#: MA3-043, RRID: AB_2081037 | WB (1:1000) |
| Antibody | Rabbit polyclonal anti-Rapsn | PMID: 18940591 | WB (1:1000) | |
| Antibody | Goat polyclonal anti-α-AChR | PMID: 3484485 | WB (1:1000) | |
| Antibody | Rabbit polyclonal anti-β-AChR | PMID: 3484485 | WB (1:1000) | |
| Antibody | Horseradish peroxidase (HRP)-conjugated goat anti-rabbit IgG | Thermo Fisher Scientific | Cat#: 32260, RRID: AB_1965959 | WB (1:5000) |
| Antibody | Horseradish peroxidase (HRP)-conjugated goat anti-Mouse IgG | Thermo Fisher Scientific | Cat#: 32230, RRID: AB_1965958 | WB (1:5000) |
| Antibody | Horseradish peroxidase (HRP)-conjugated goat anti-Rat IgG | Thermo Fisher Scientific | Cat#: 31470, RRID: AB_228356 | WB (1:5000) |
| Recombinant Protein | Agrin | R and D Systems | Cat#: 550-AG-100 | 50 ng / ml for induction of AChR clusters in culture myotubes |
| Other | Immunofluorescence of NMJ in diaphragm and muscles | PMID: 18278041 PMID: 22794264 | ||
| Other | Electron microscopic analysis | |||
| Other | Generation of Gene-modified C2C12 cells | PMID: 27839998 | ||
| Other | Isolation of cell surface protein | PMID: 22157653 | ||
| Other | Isolation of surface AChR and their associated proteins | PMID: 18940591 | ||
| Other | AAV Virus production | PMID: 30626963 and Information in Addgene: https://www.addgene.org/protocols/aav-production-hek293-cells/ |
Additional files
-
Transparent reporting form
- https://doi.org/10.7554/eLife.49180.029
Download links
A two-part list of links to download the article, or parts of the article, in various formats.
Downloads (link to download the article as PDF)
Open citations (links to open the citations from this article in various online reference manager services)
Cite this article (links to download the citations from this article in formats compatible with various reference manager tools)
A mechanism in agrin signaling revealed by a prevalent Rapsyn mutation in congenital myasthenic syndrome
eLife 8:e49180.
https://doi.org/10.7554/eLife.49180


